


方案详情
文
本文报道1999~2001年期间欧盟举办的几个欧洲国家研究机构防护热板法热性能测量装置之间的比对试验。比对试验采用了EN 1946-2和IRMM 440参考材料,共邀请了比利时、法国、瑞士、德国、英国和瑞典六个国家的八个实验室参加了此次比对测试。
方案详情

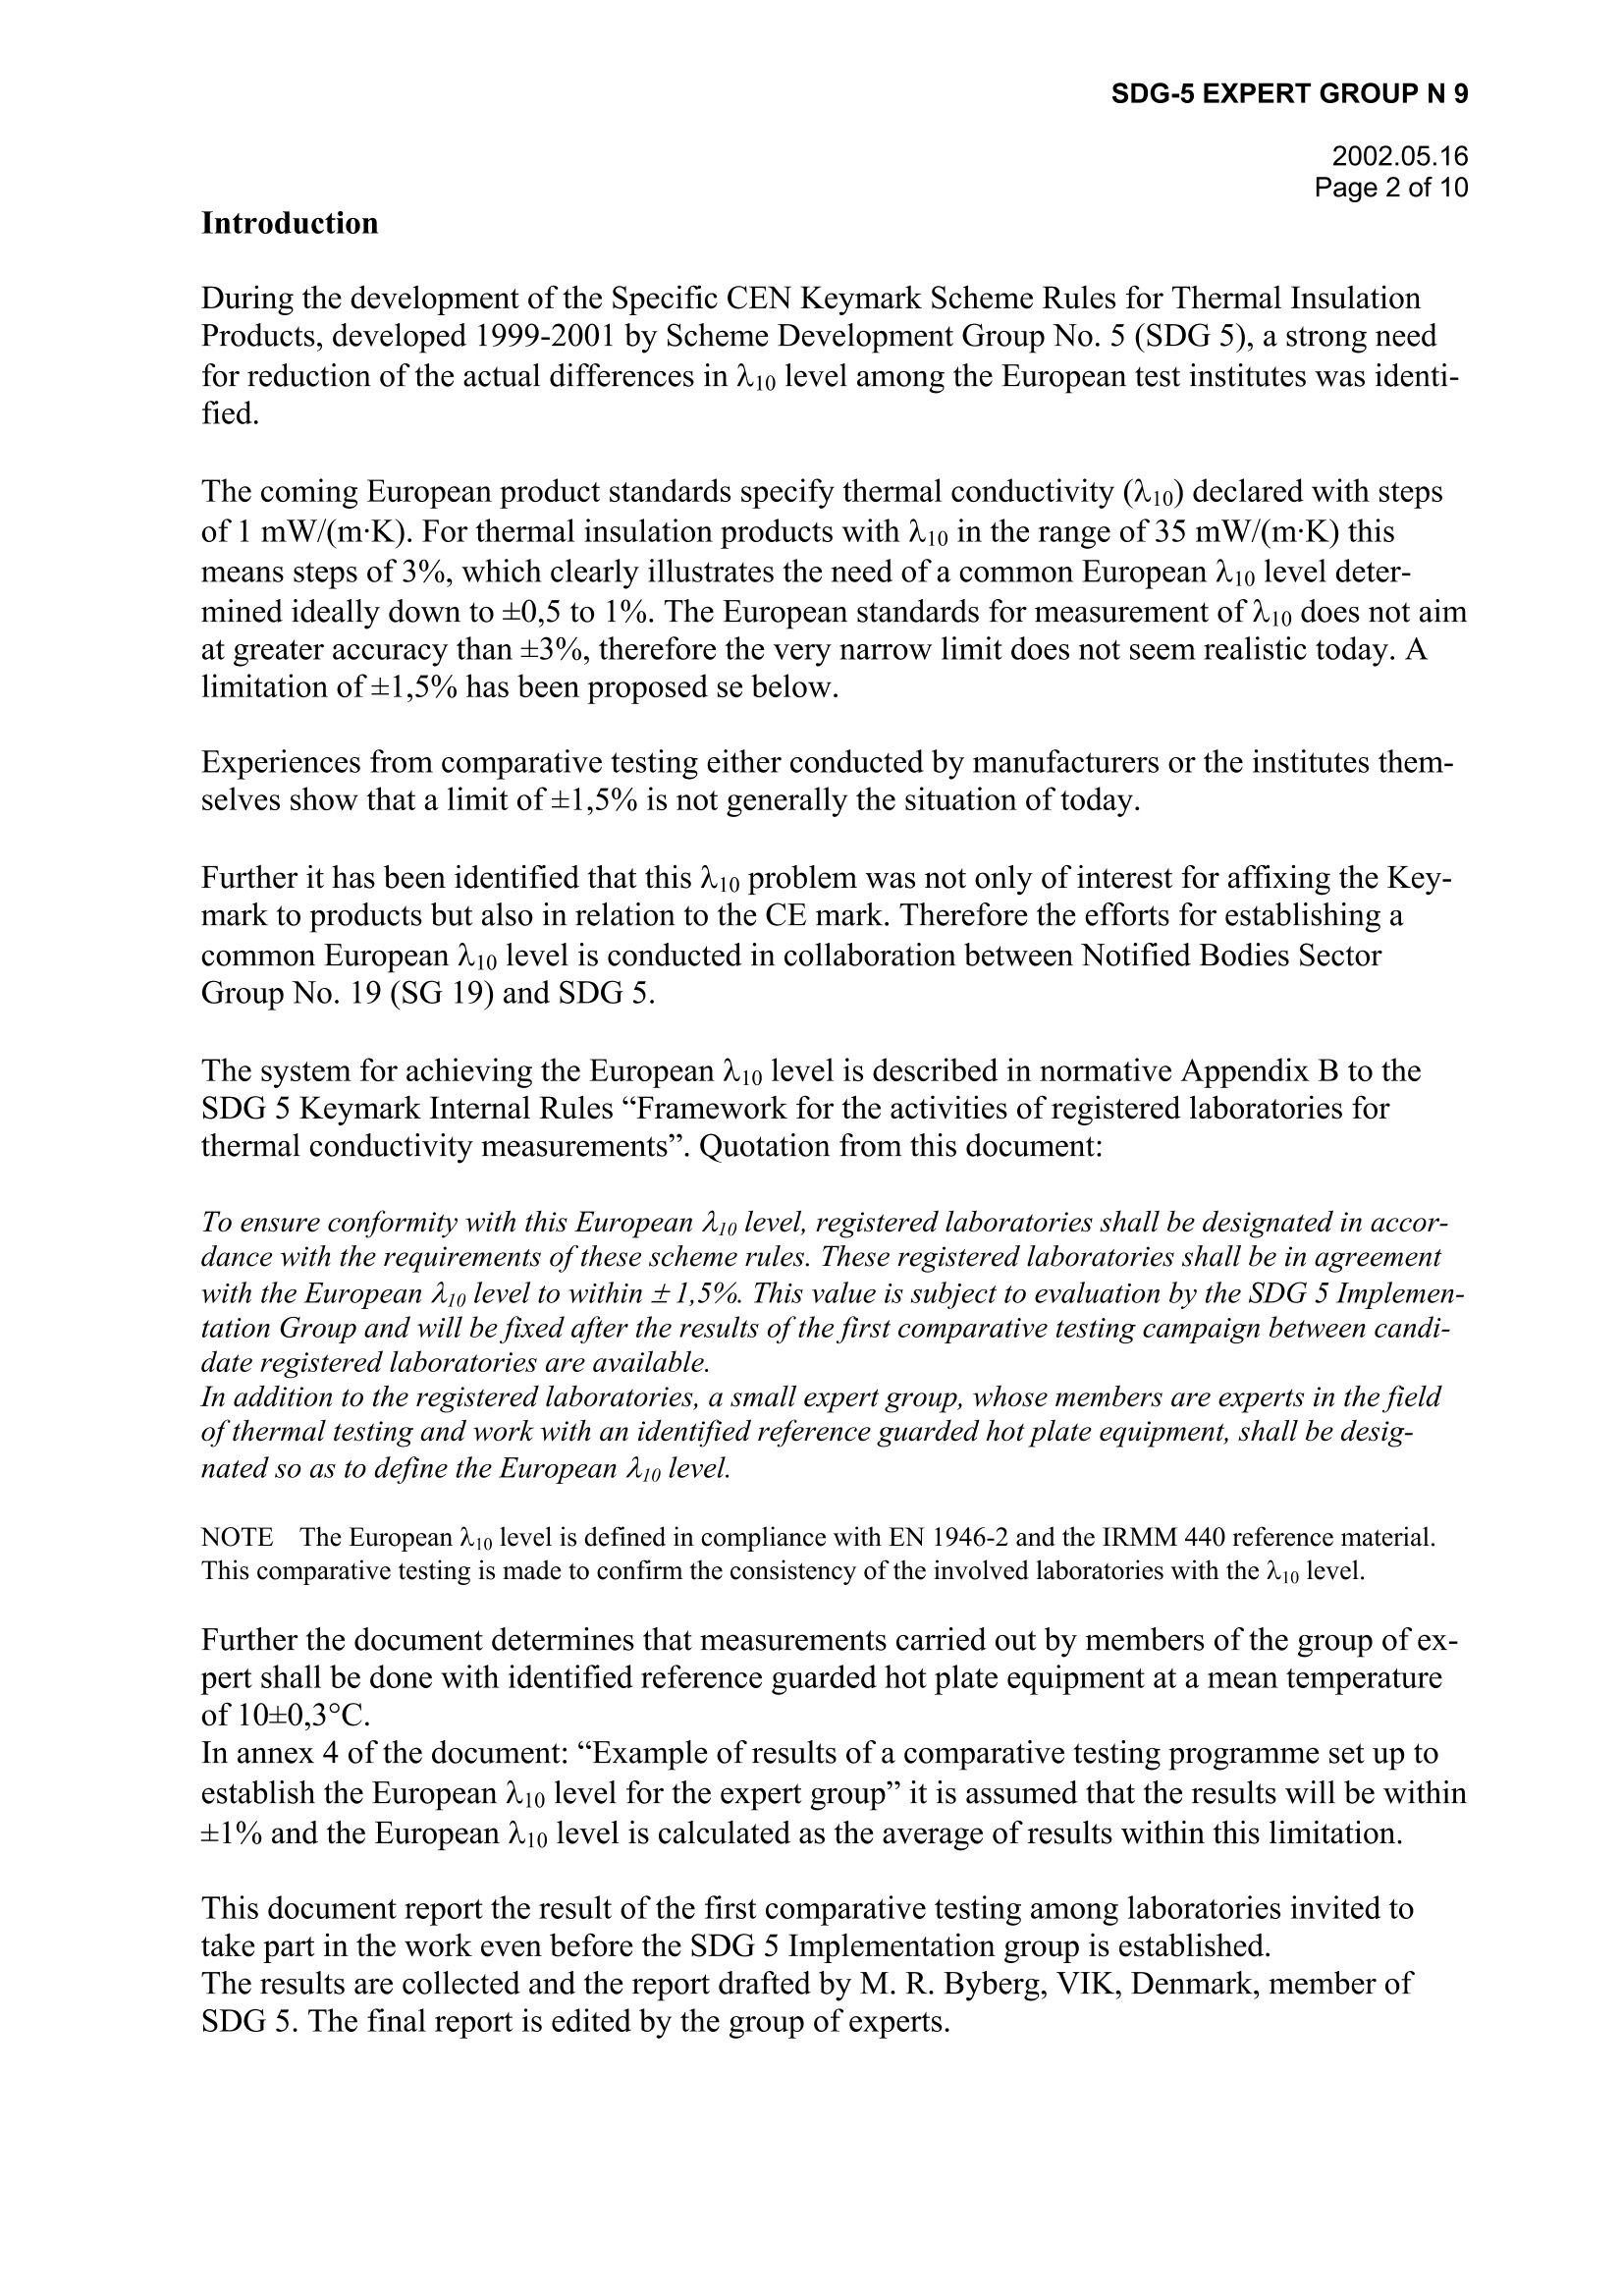
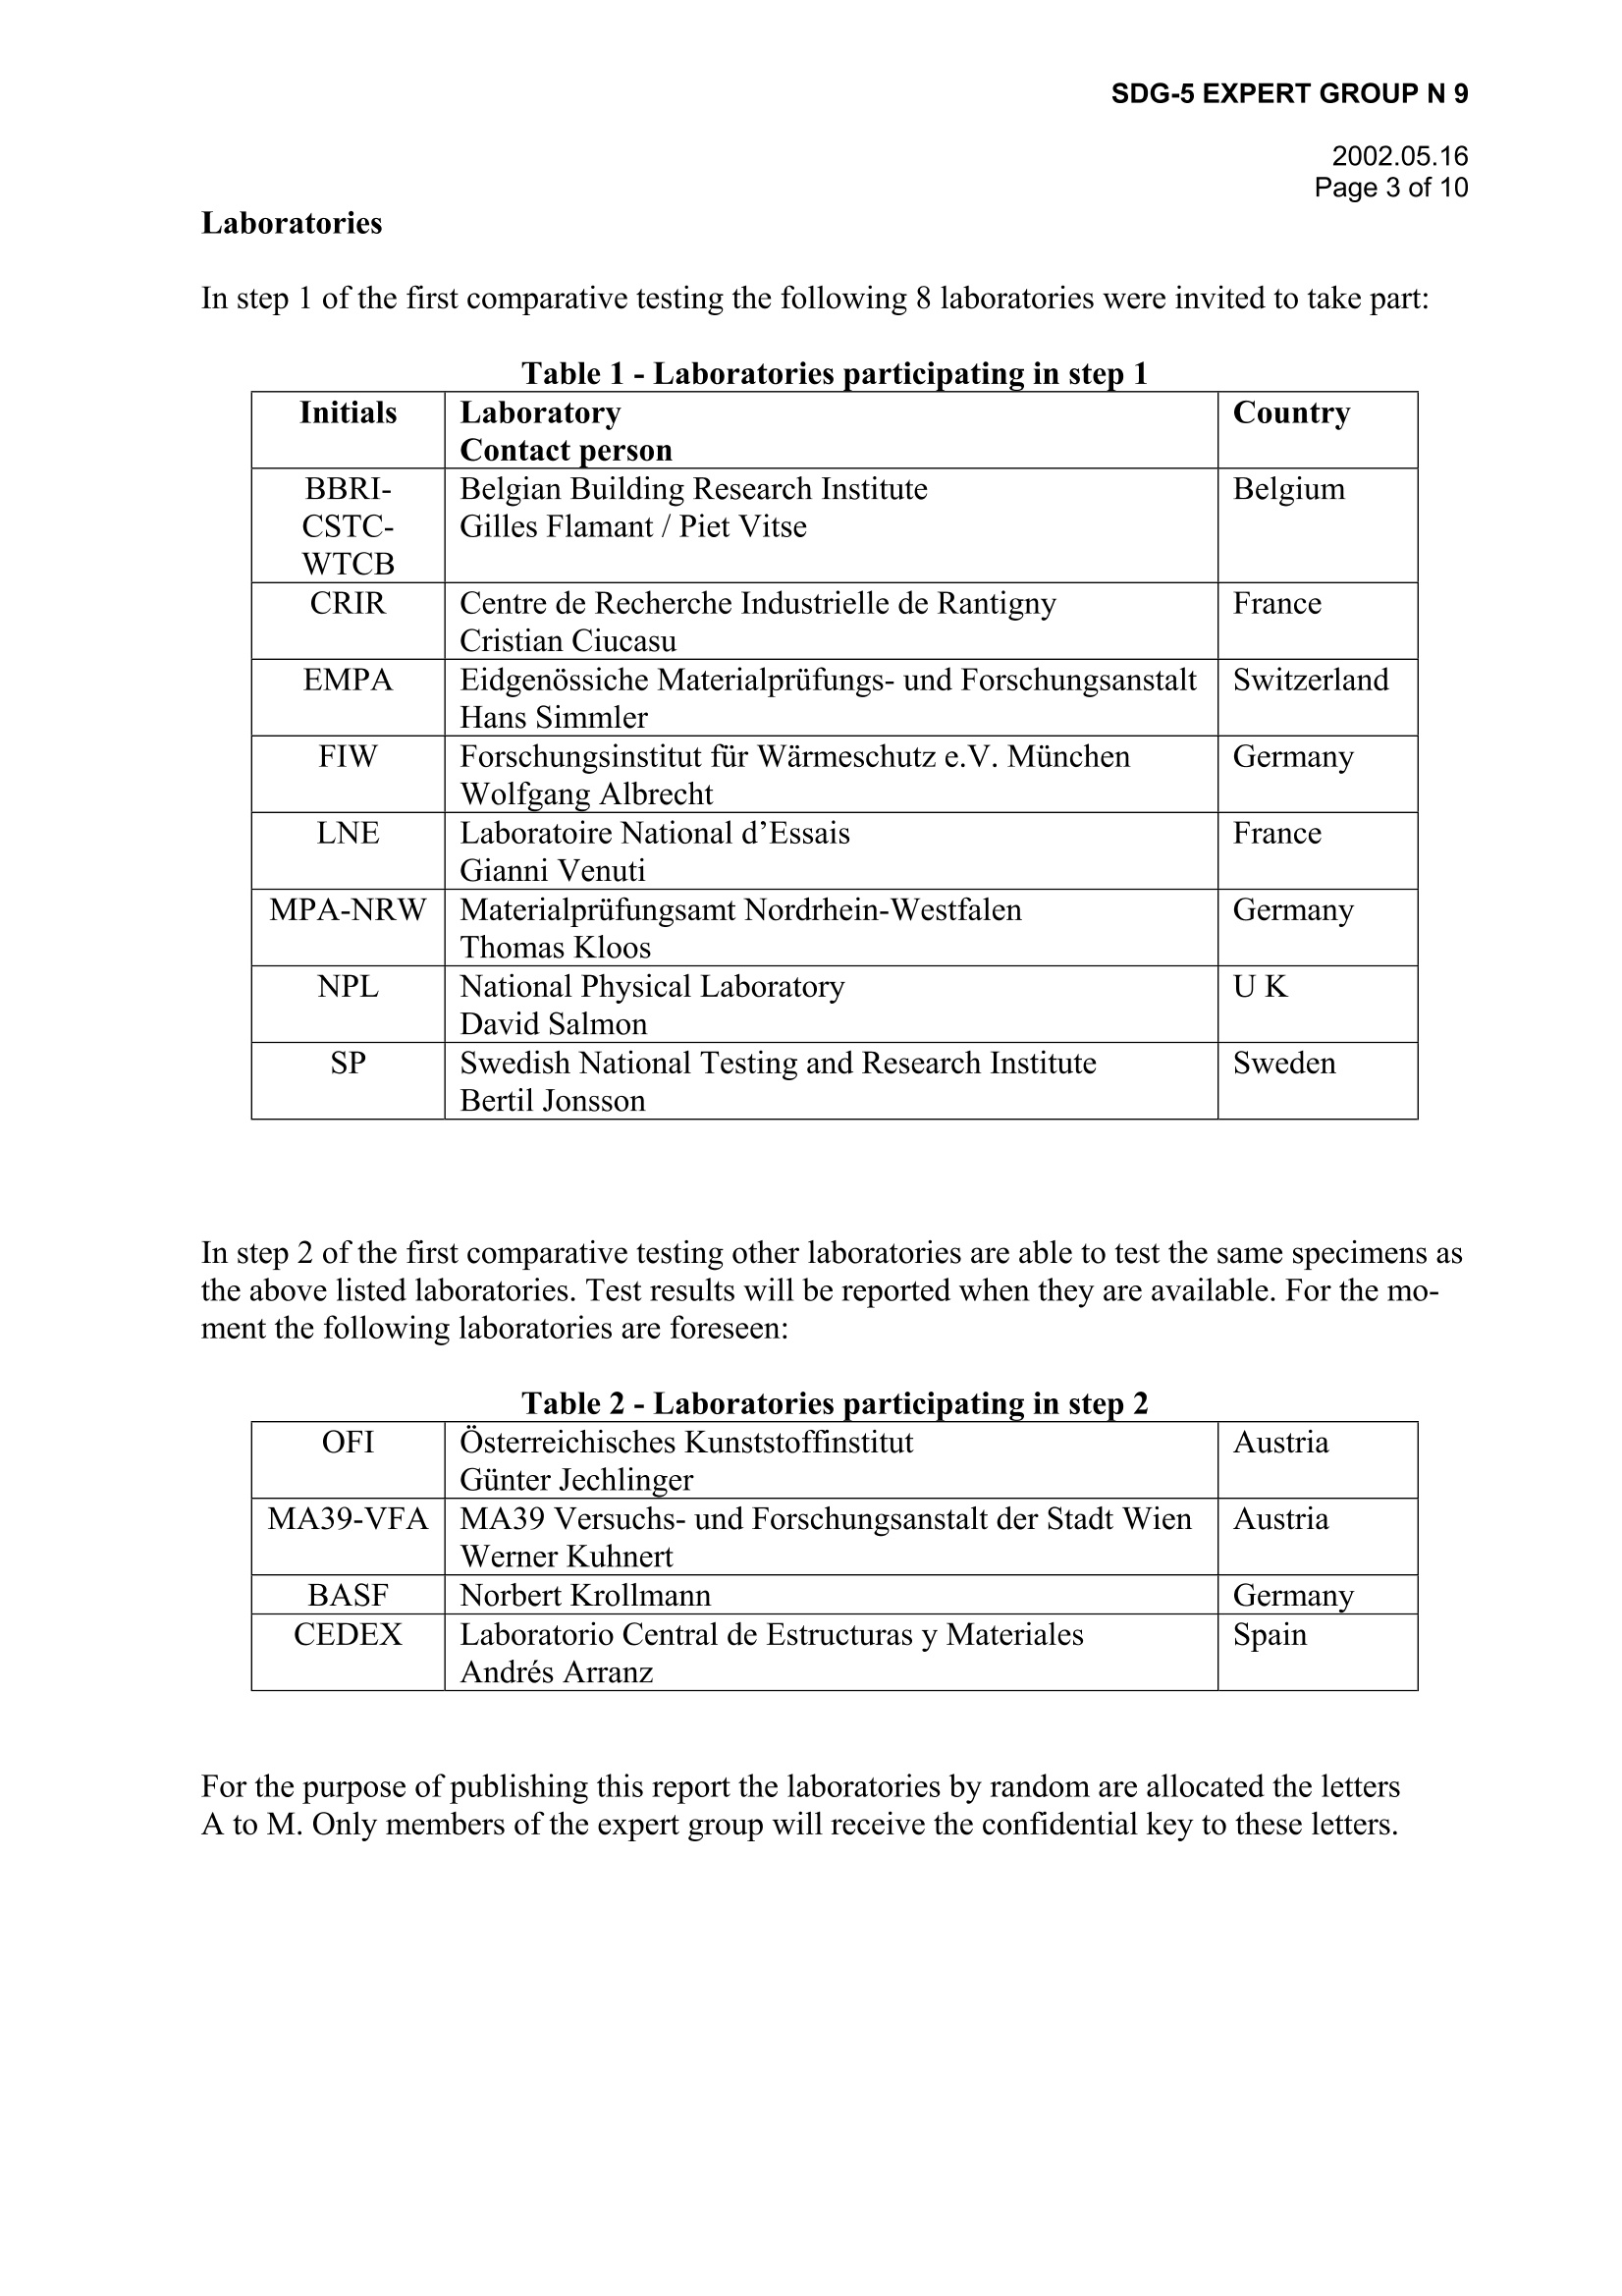
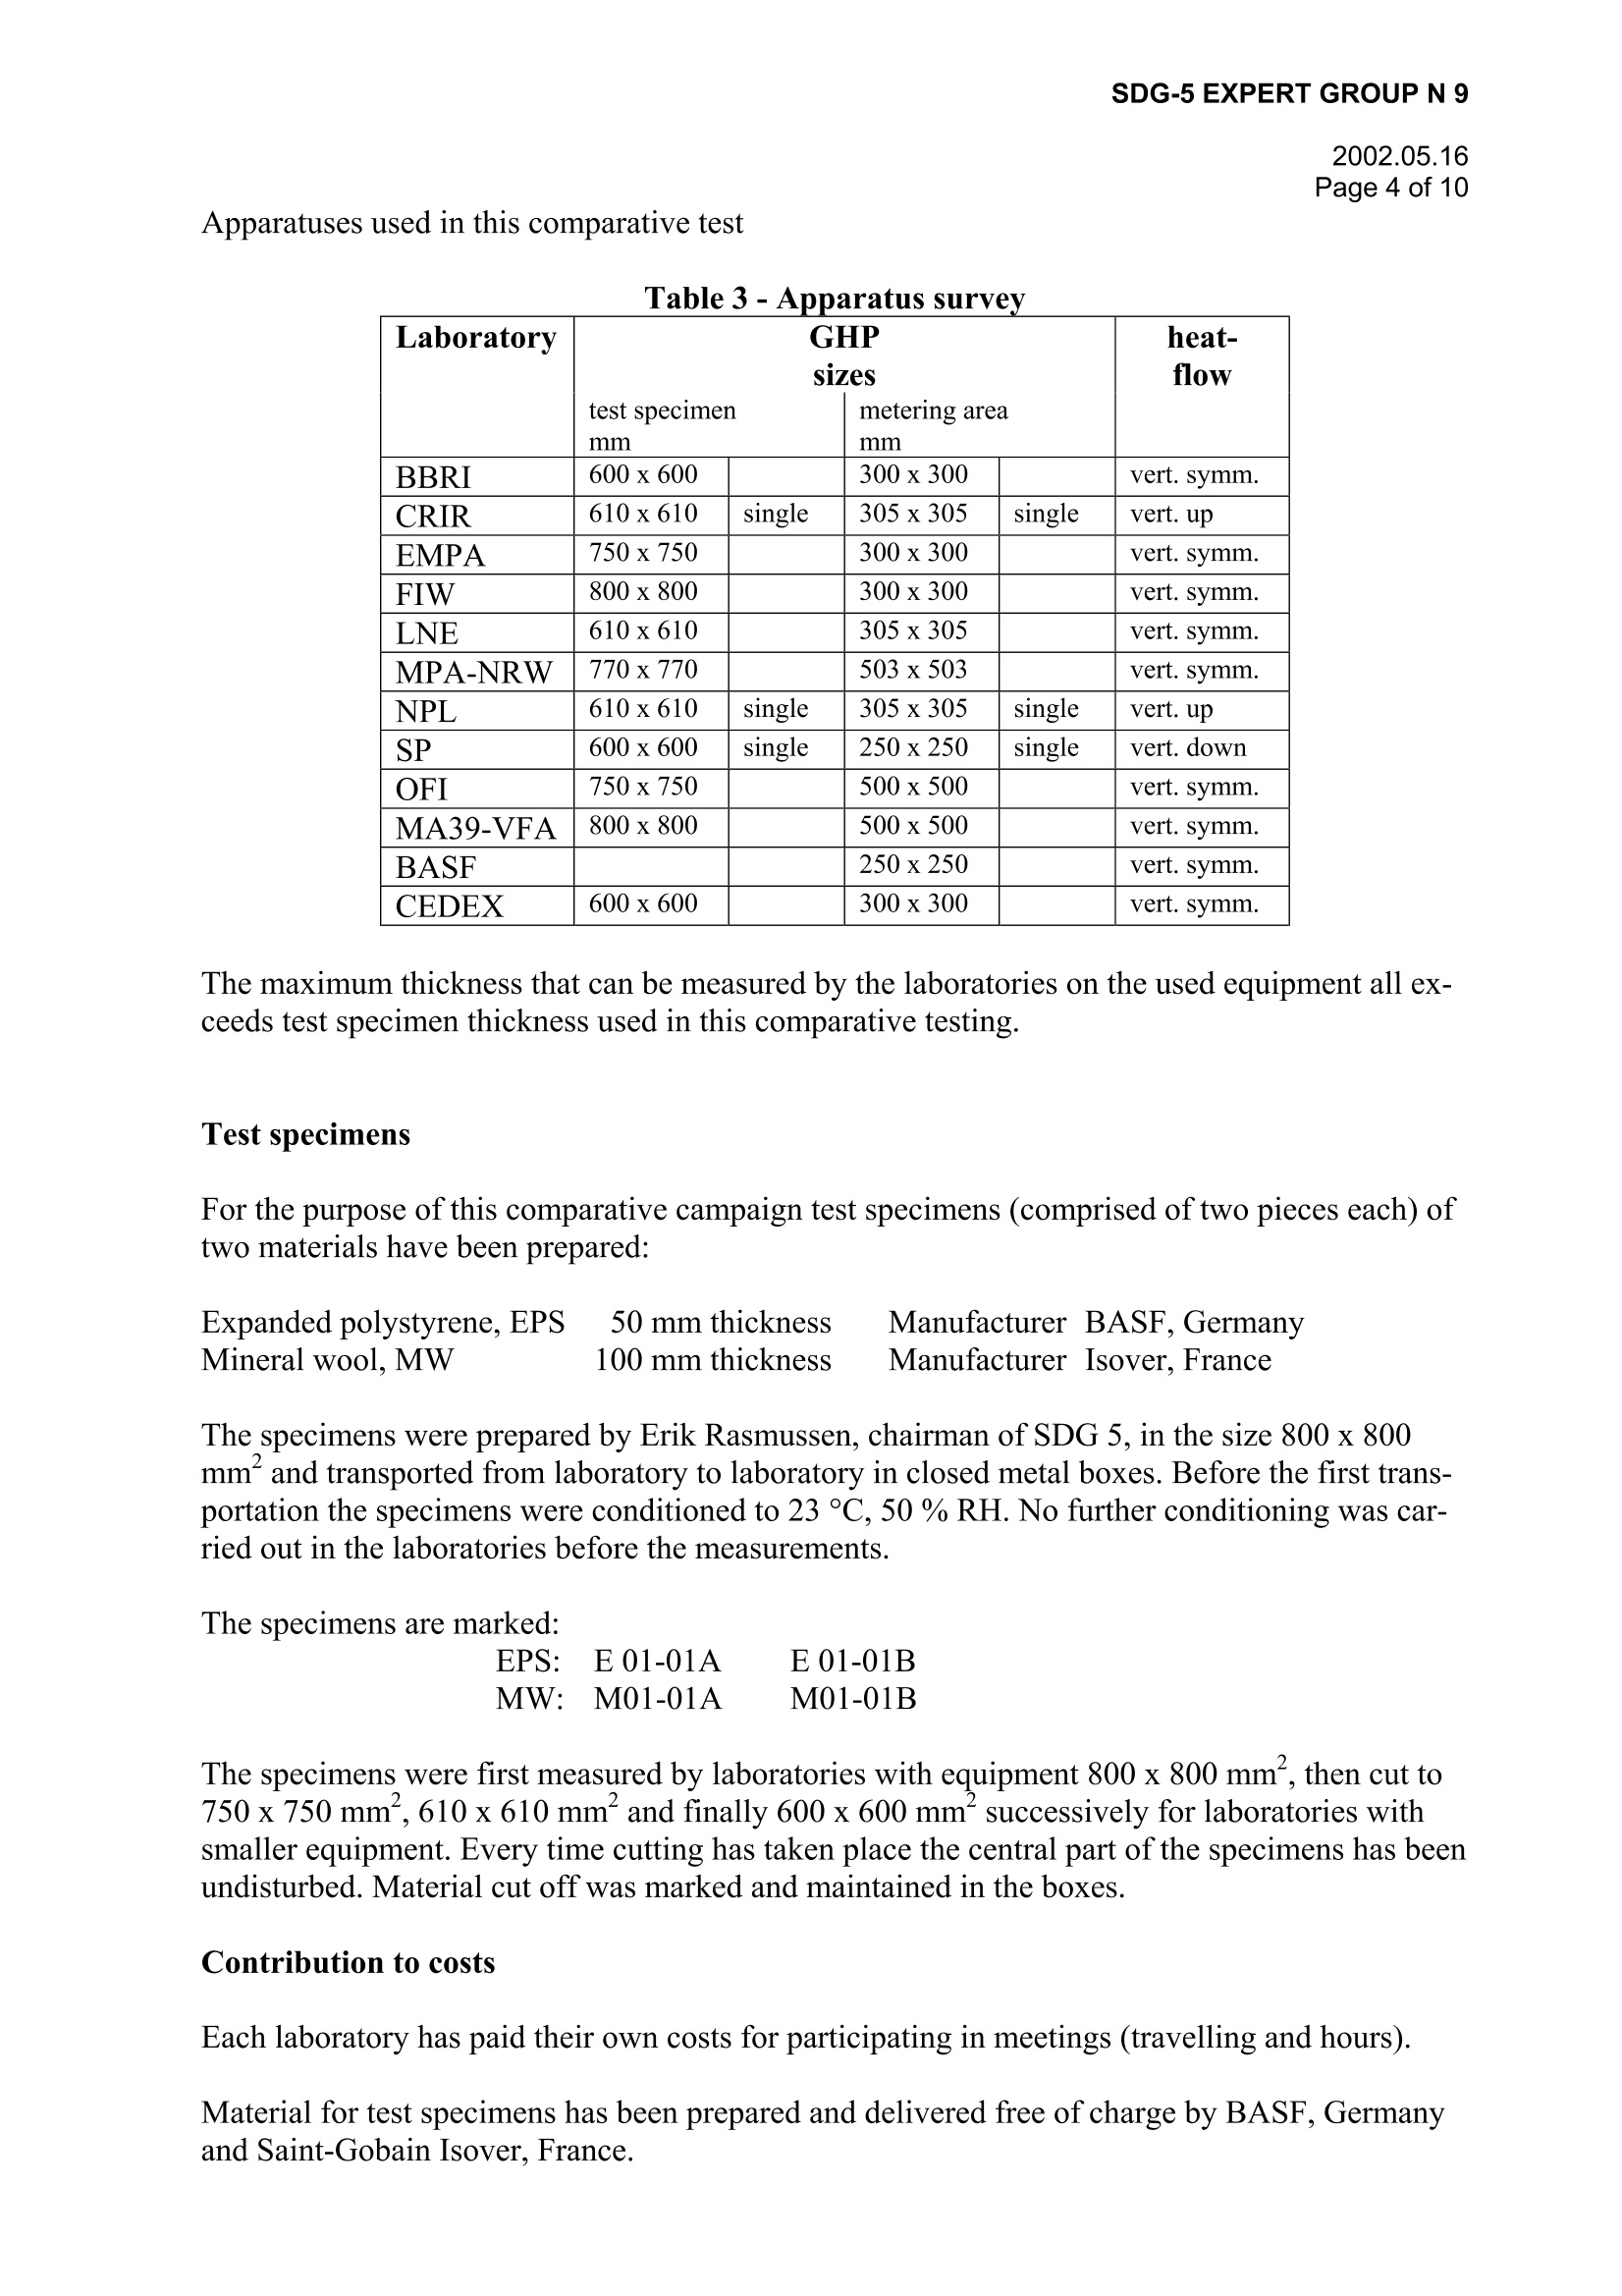
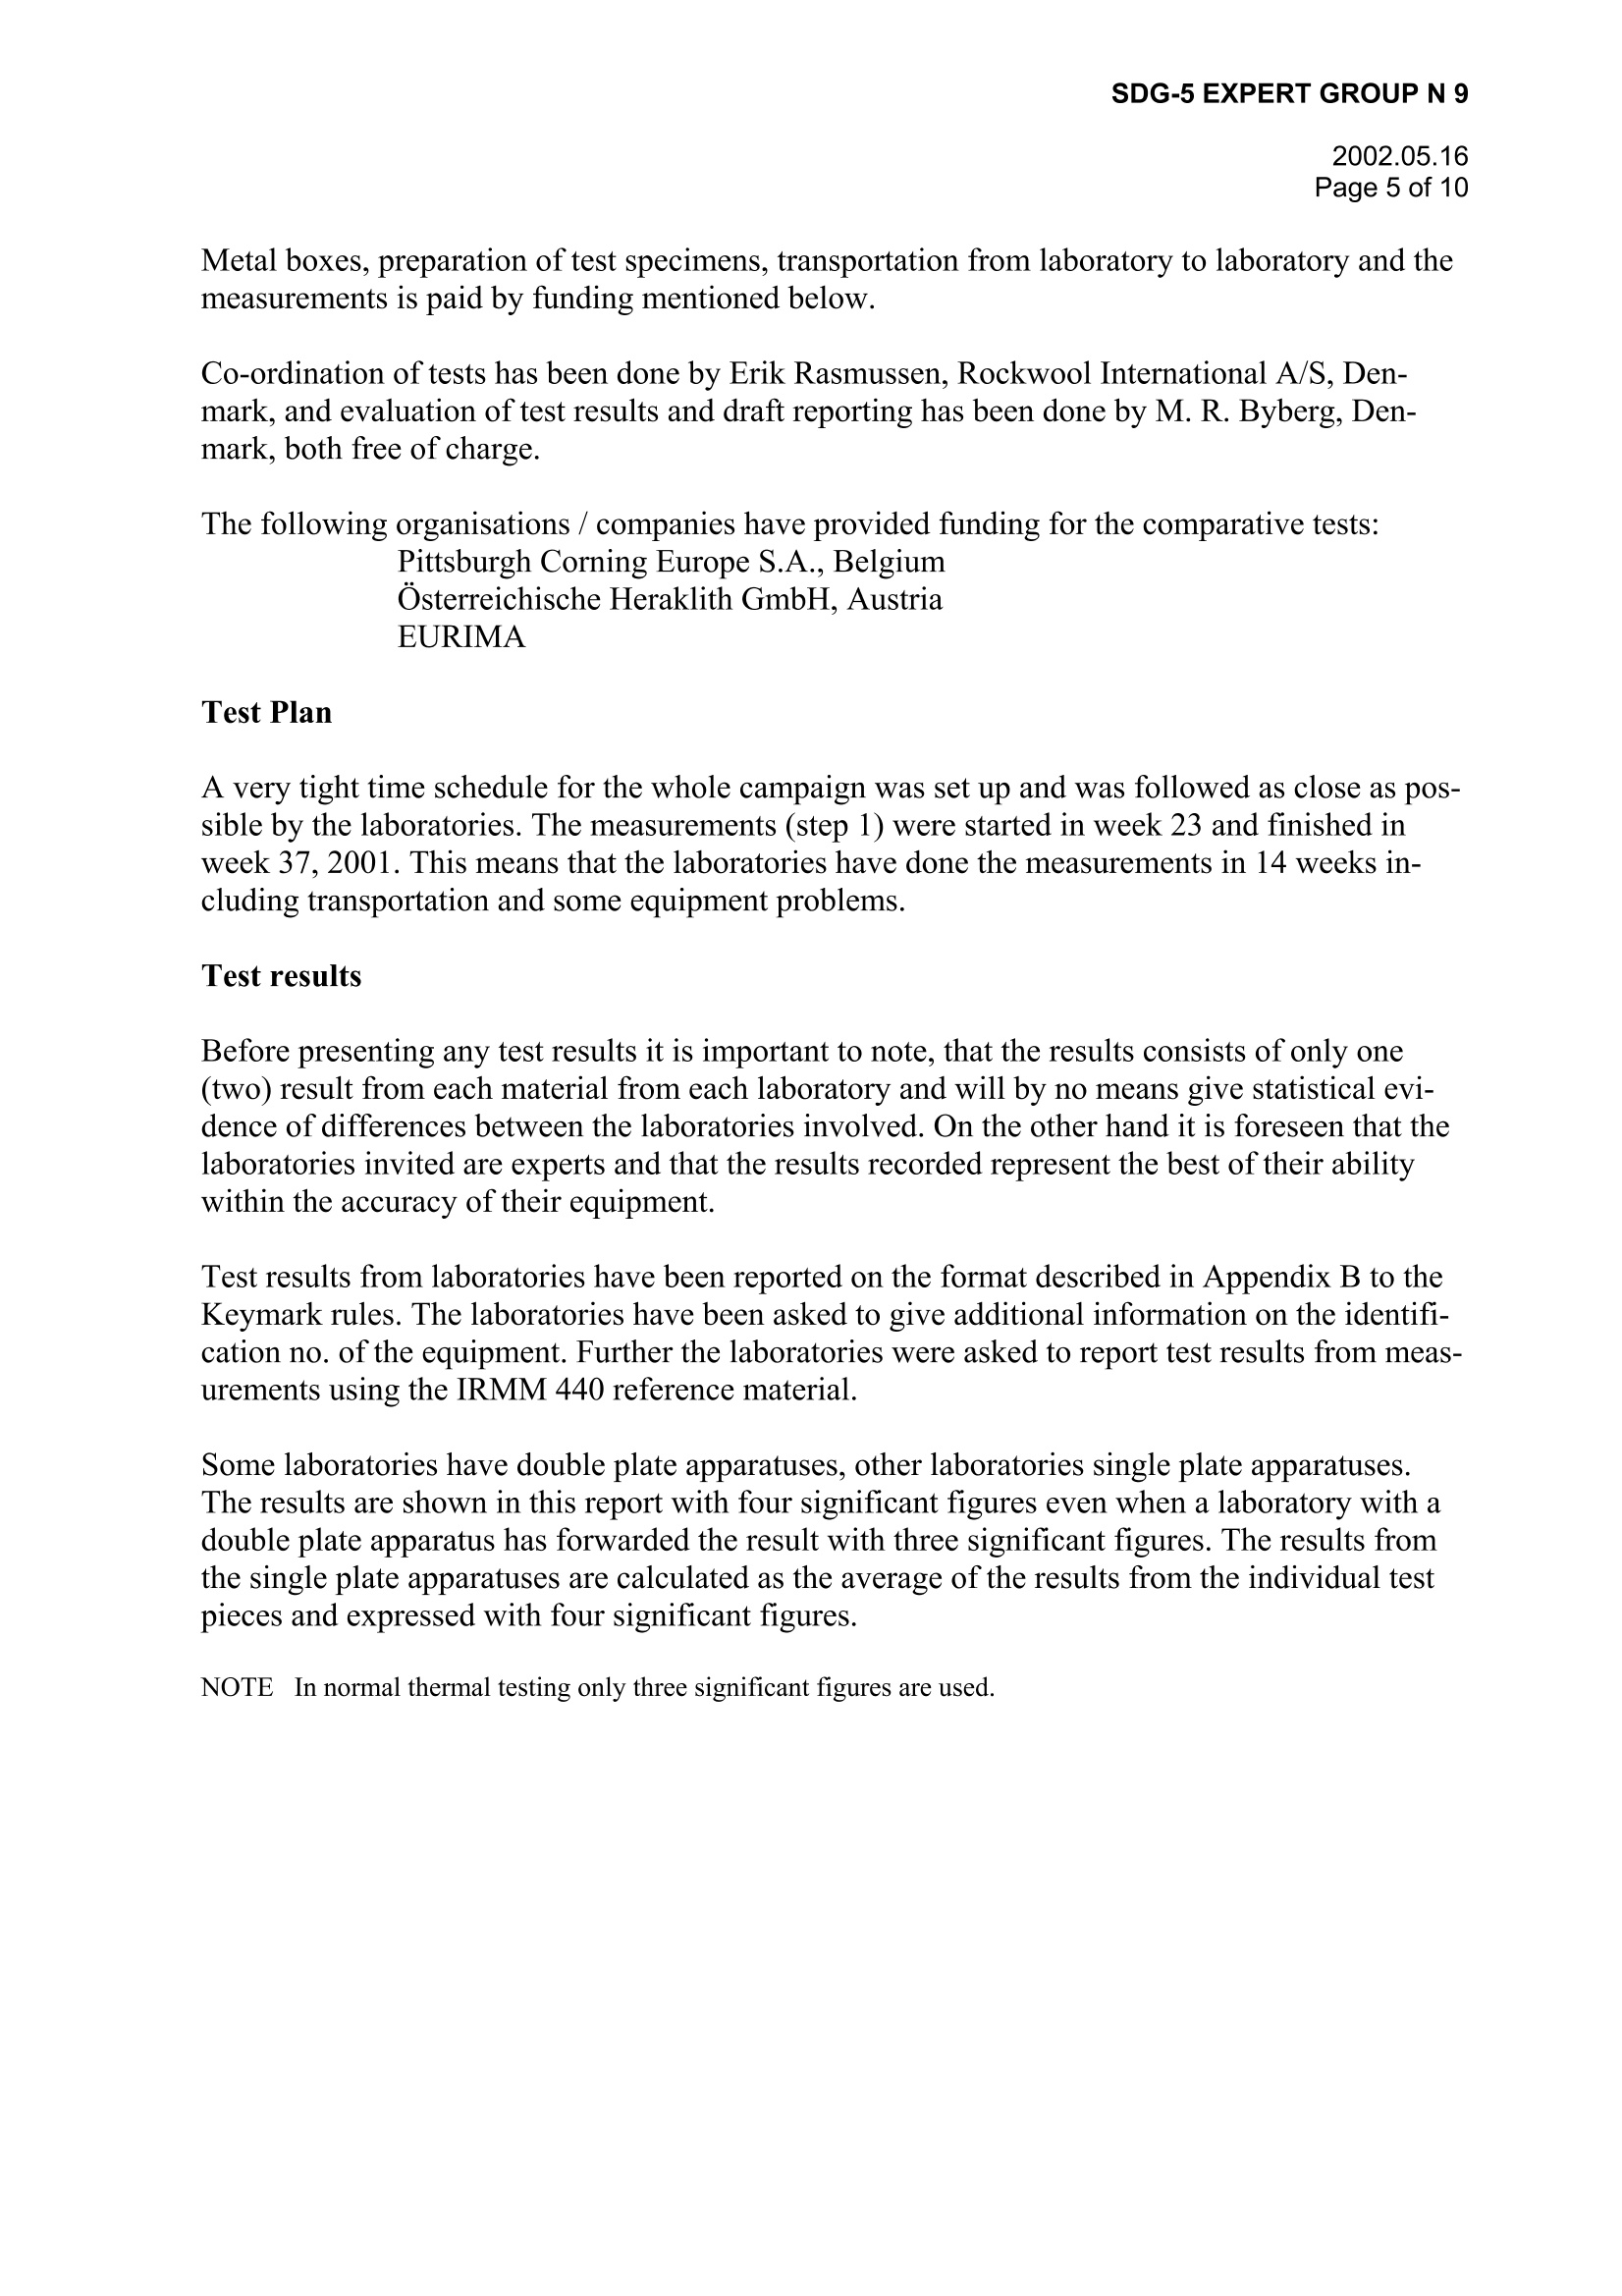
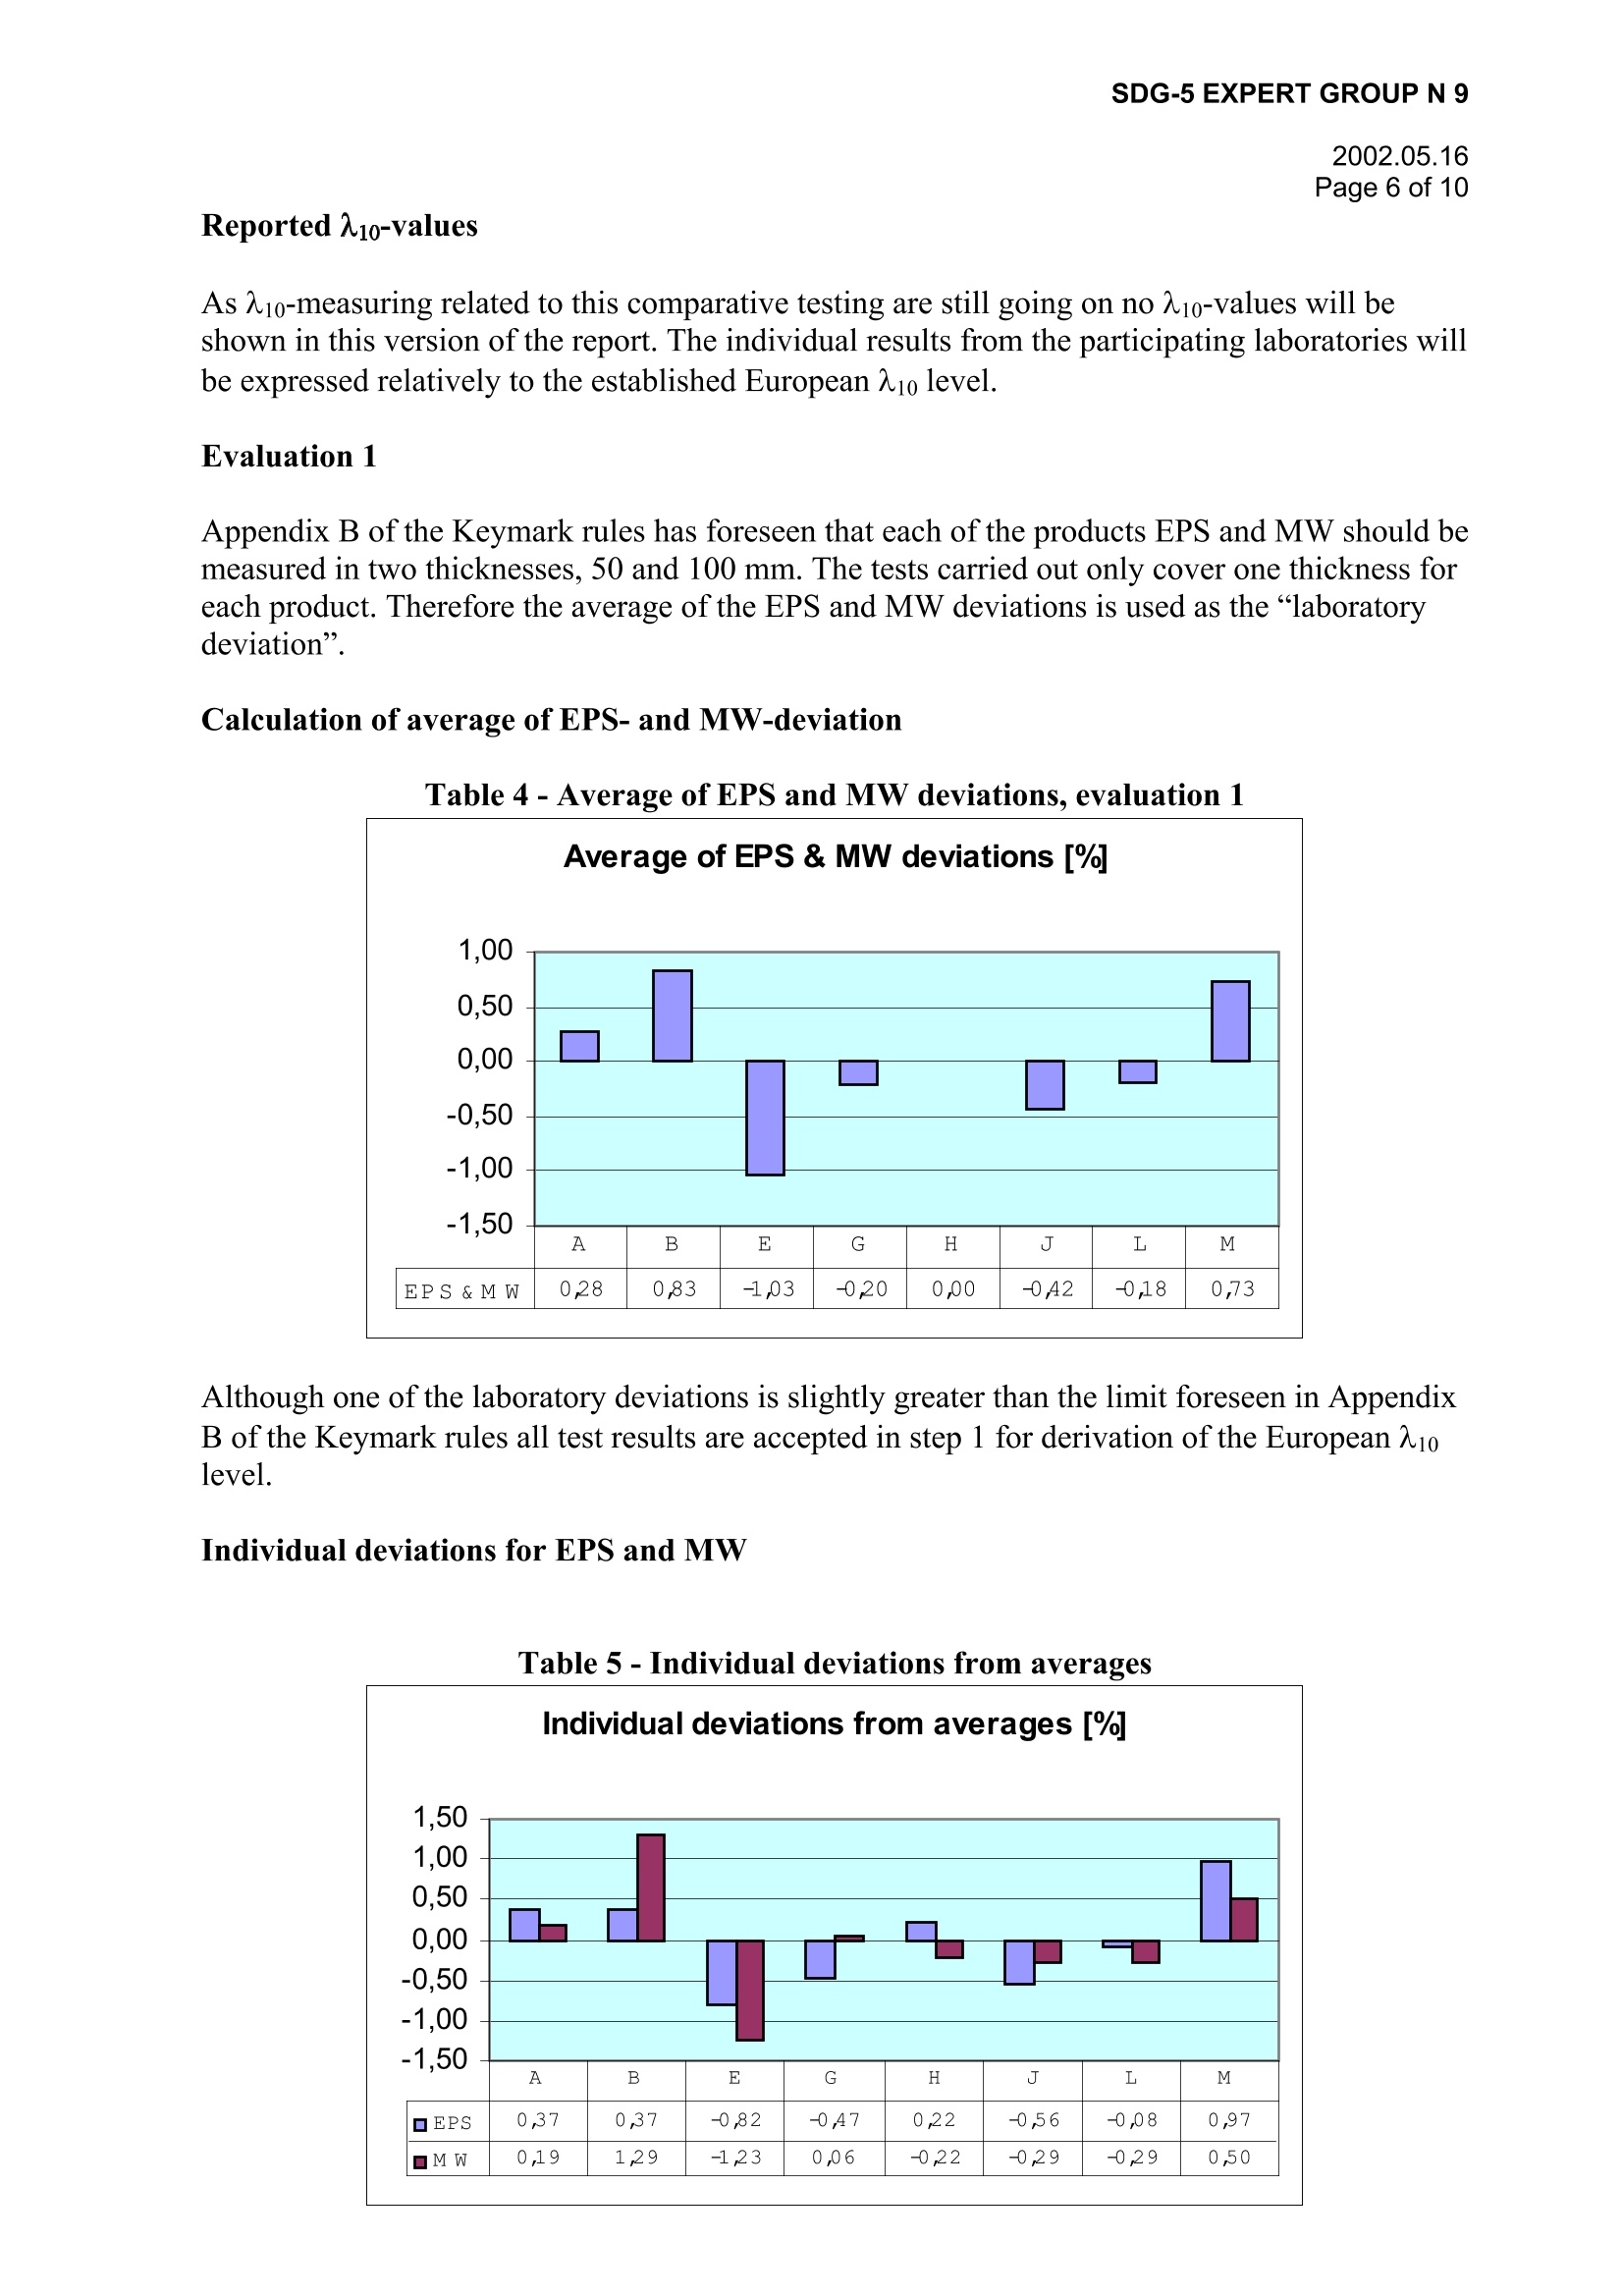
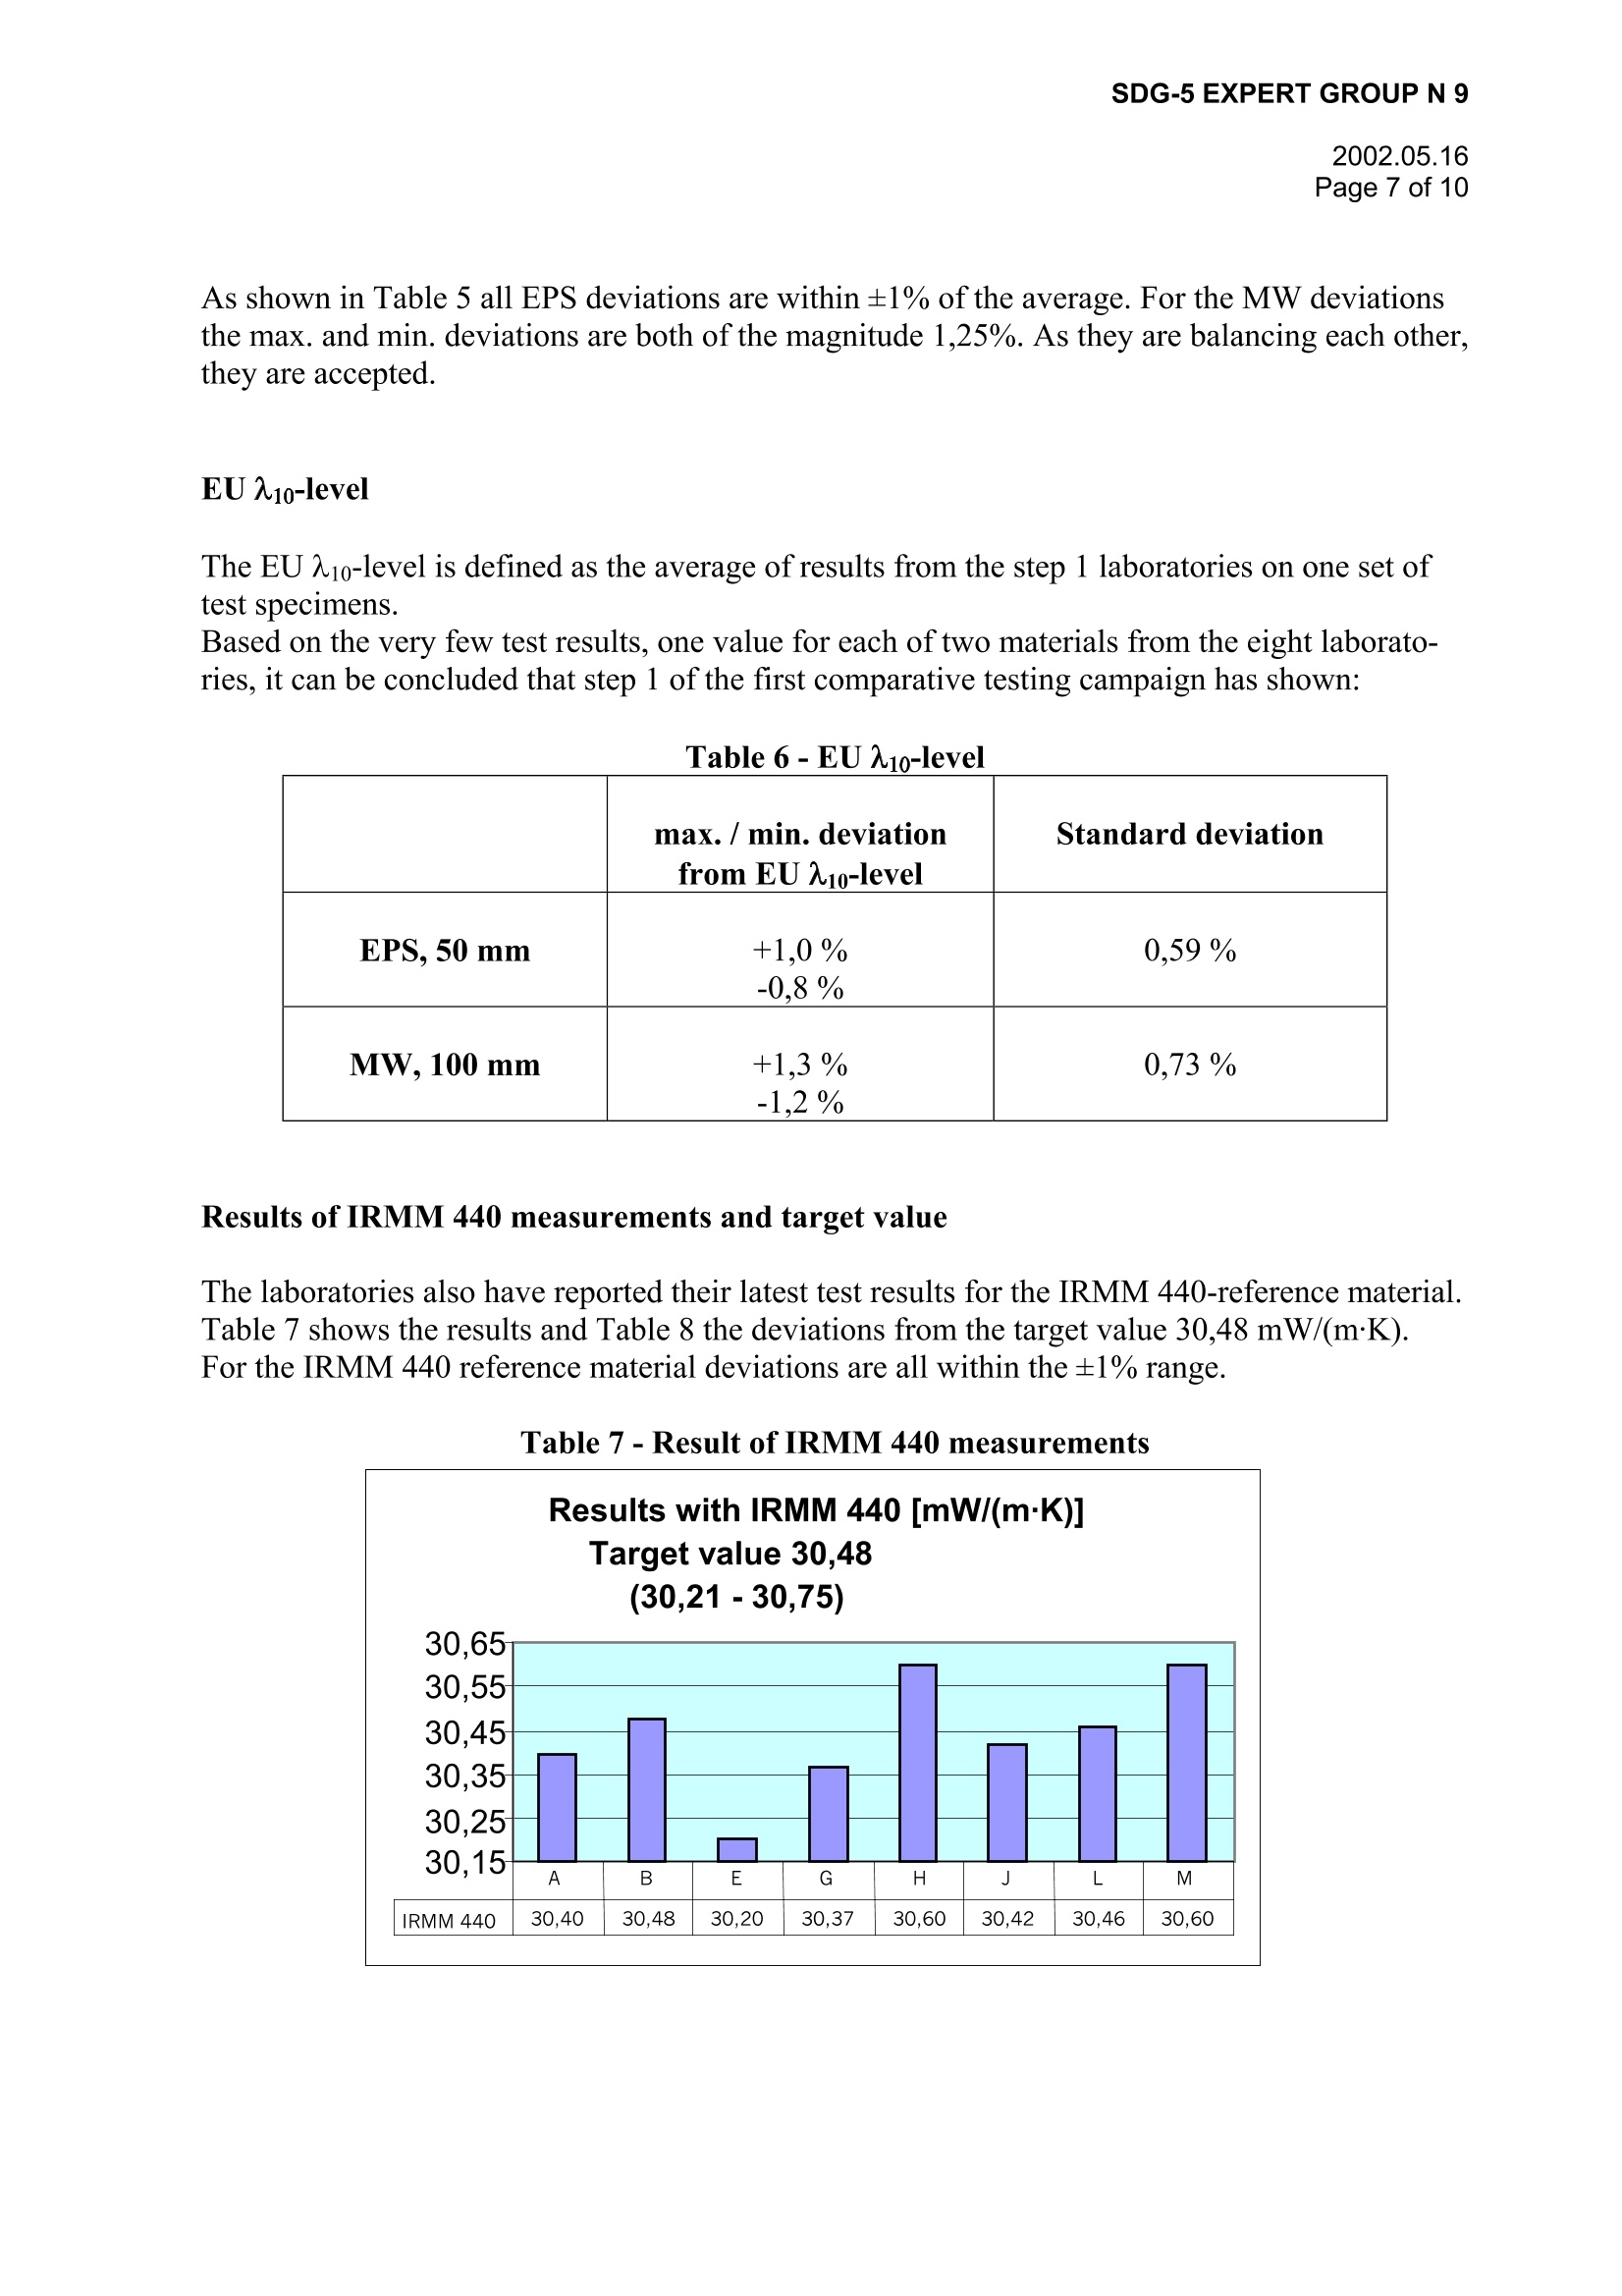
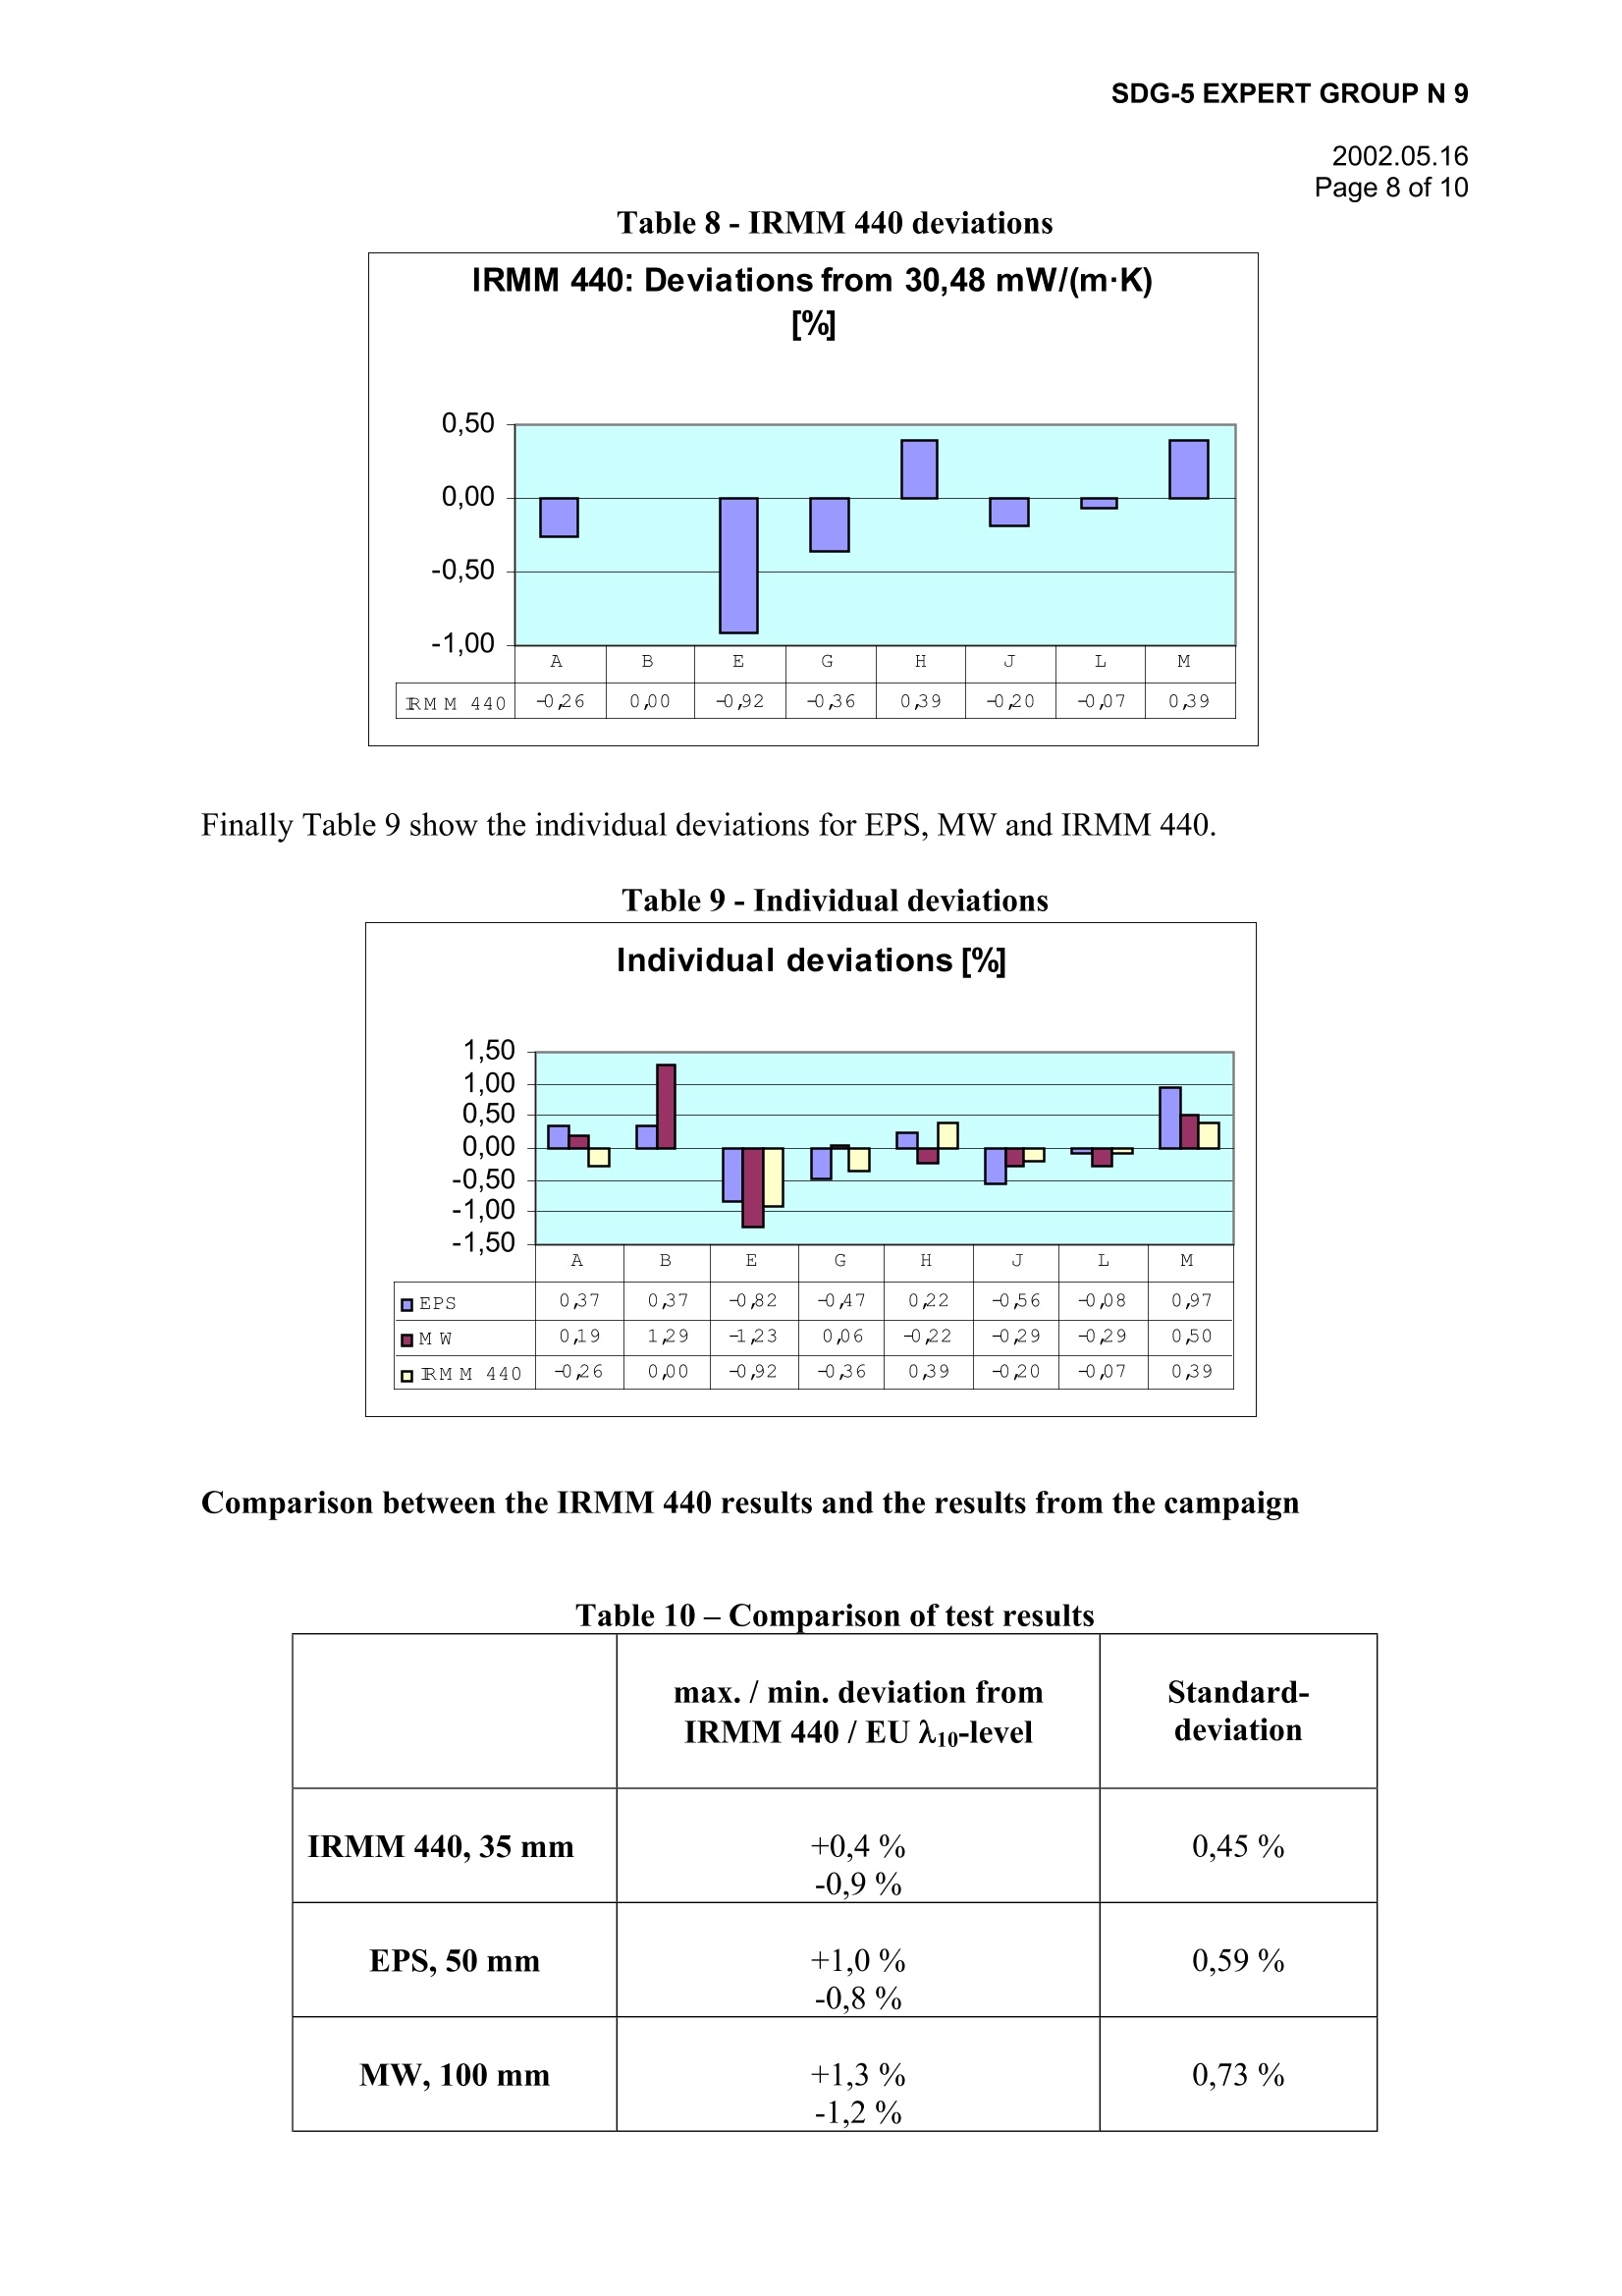
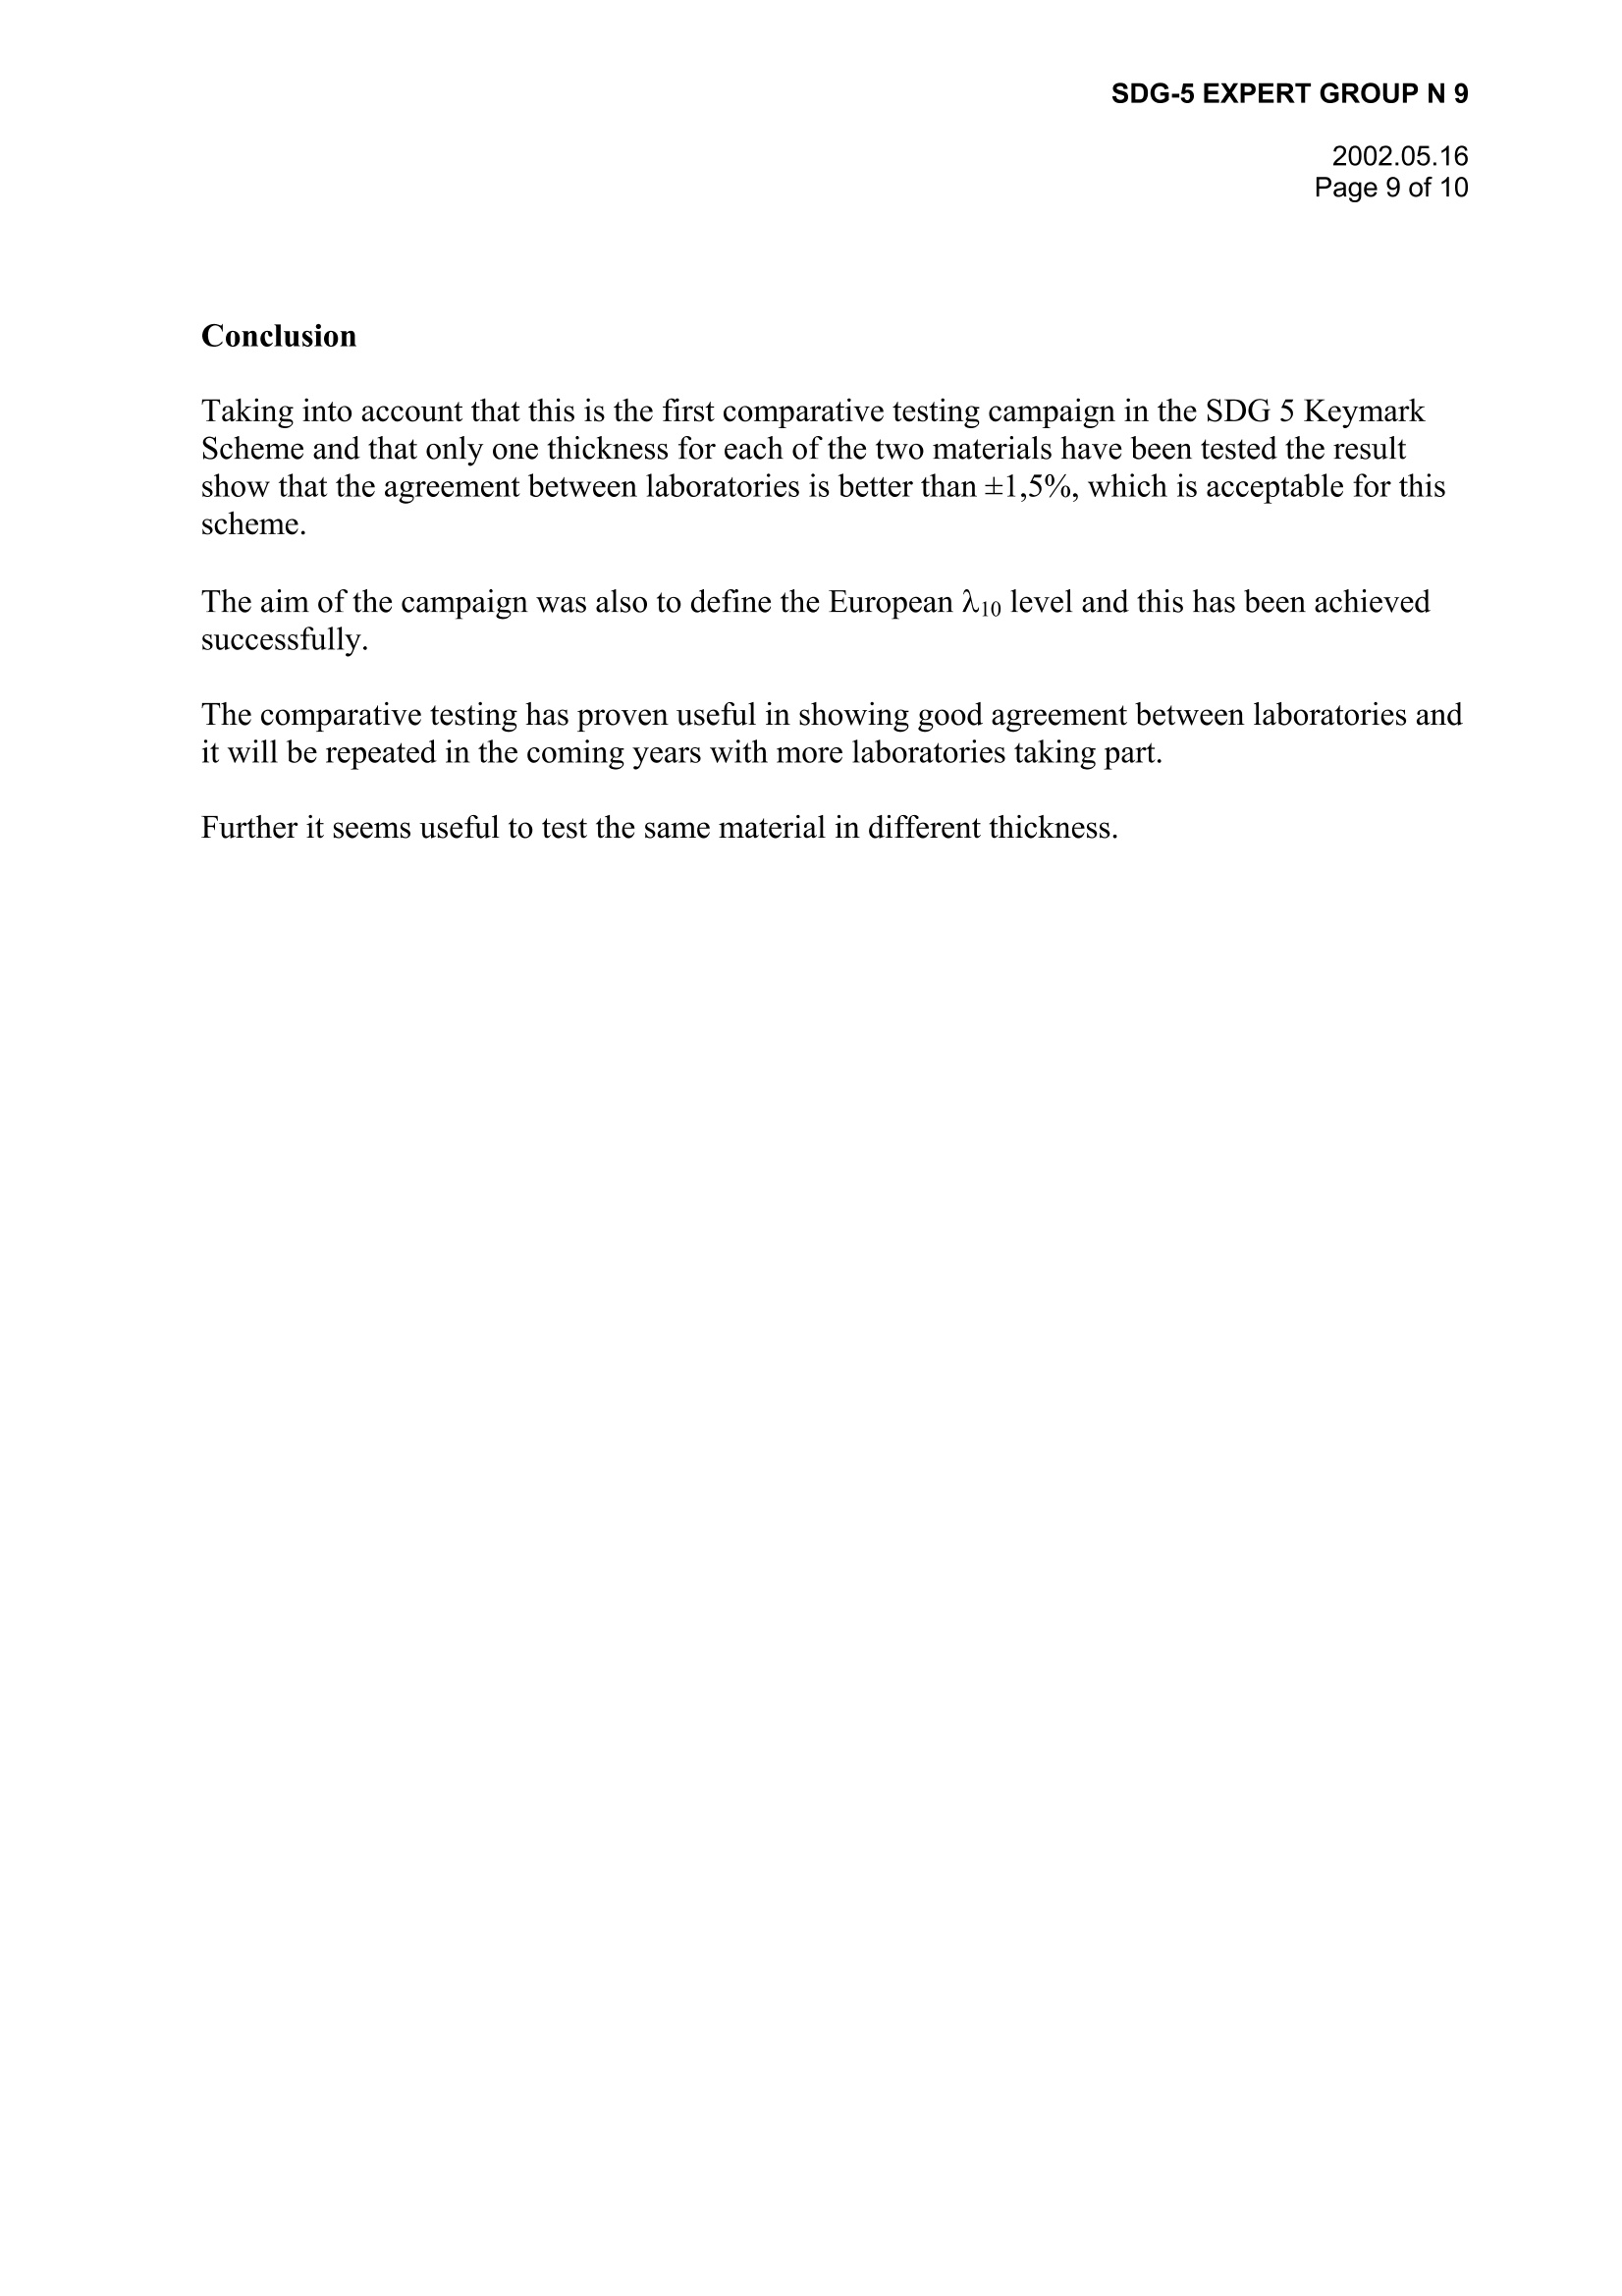
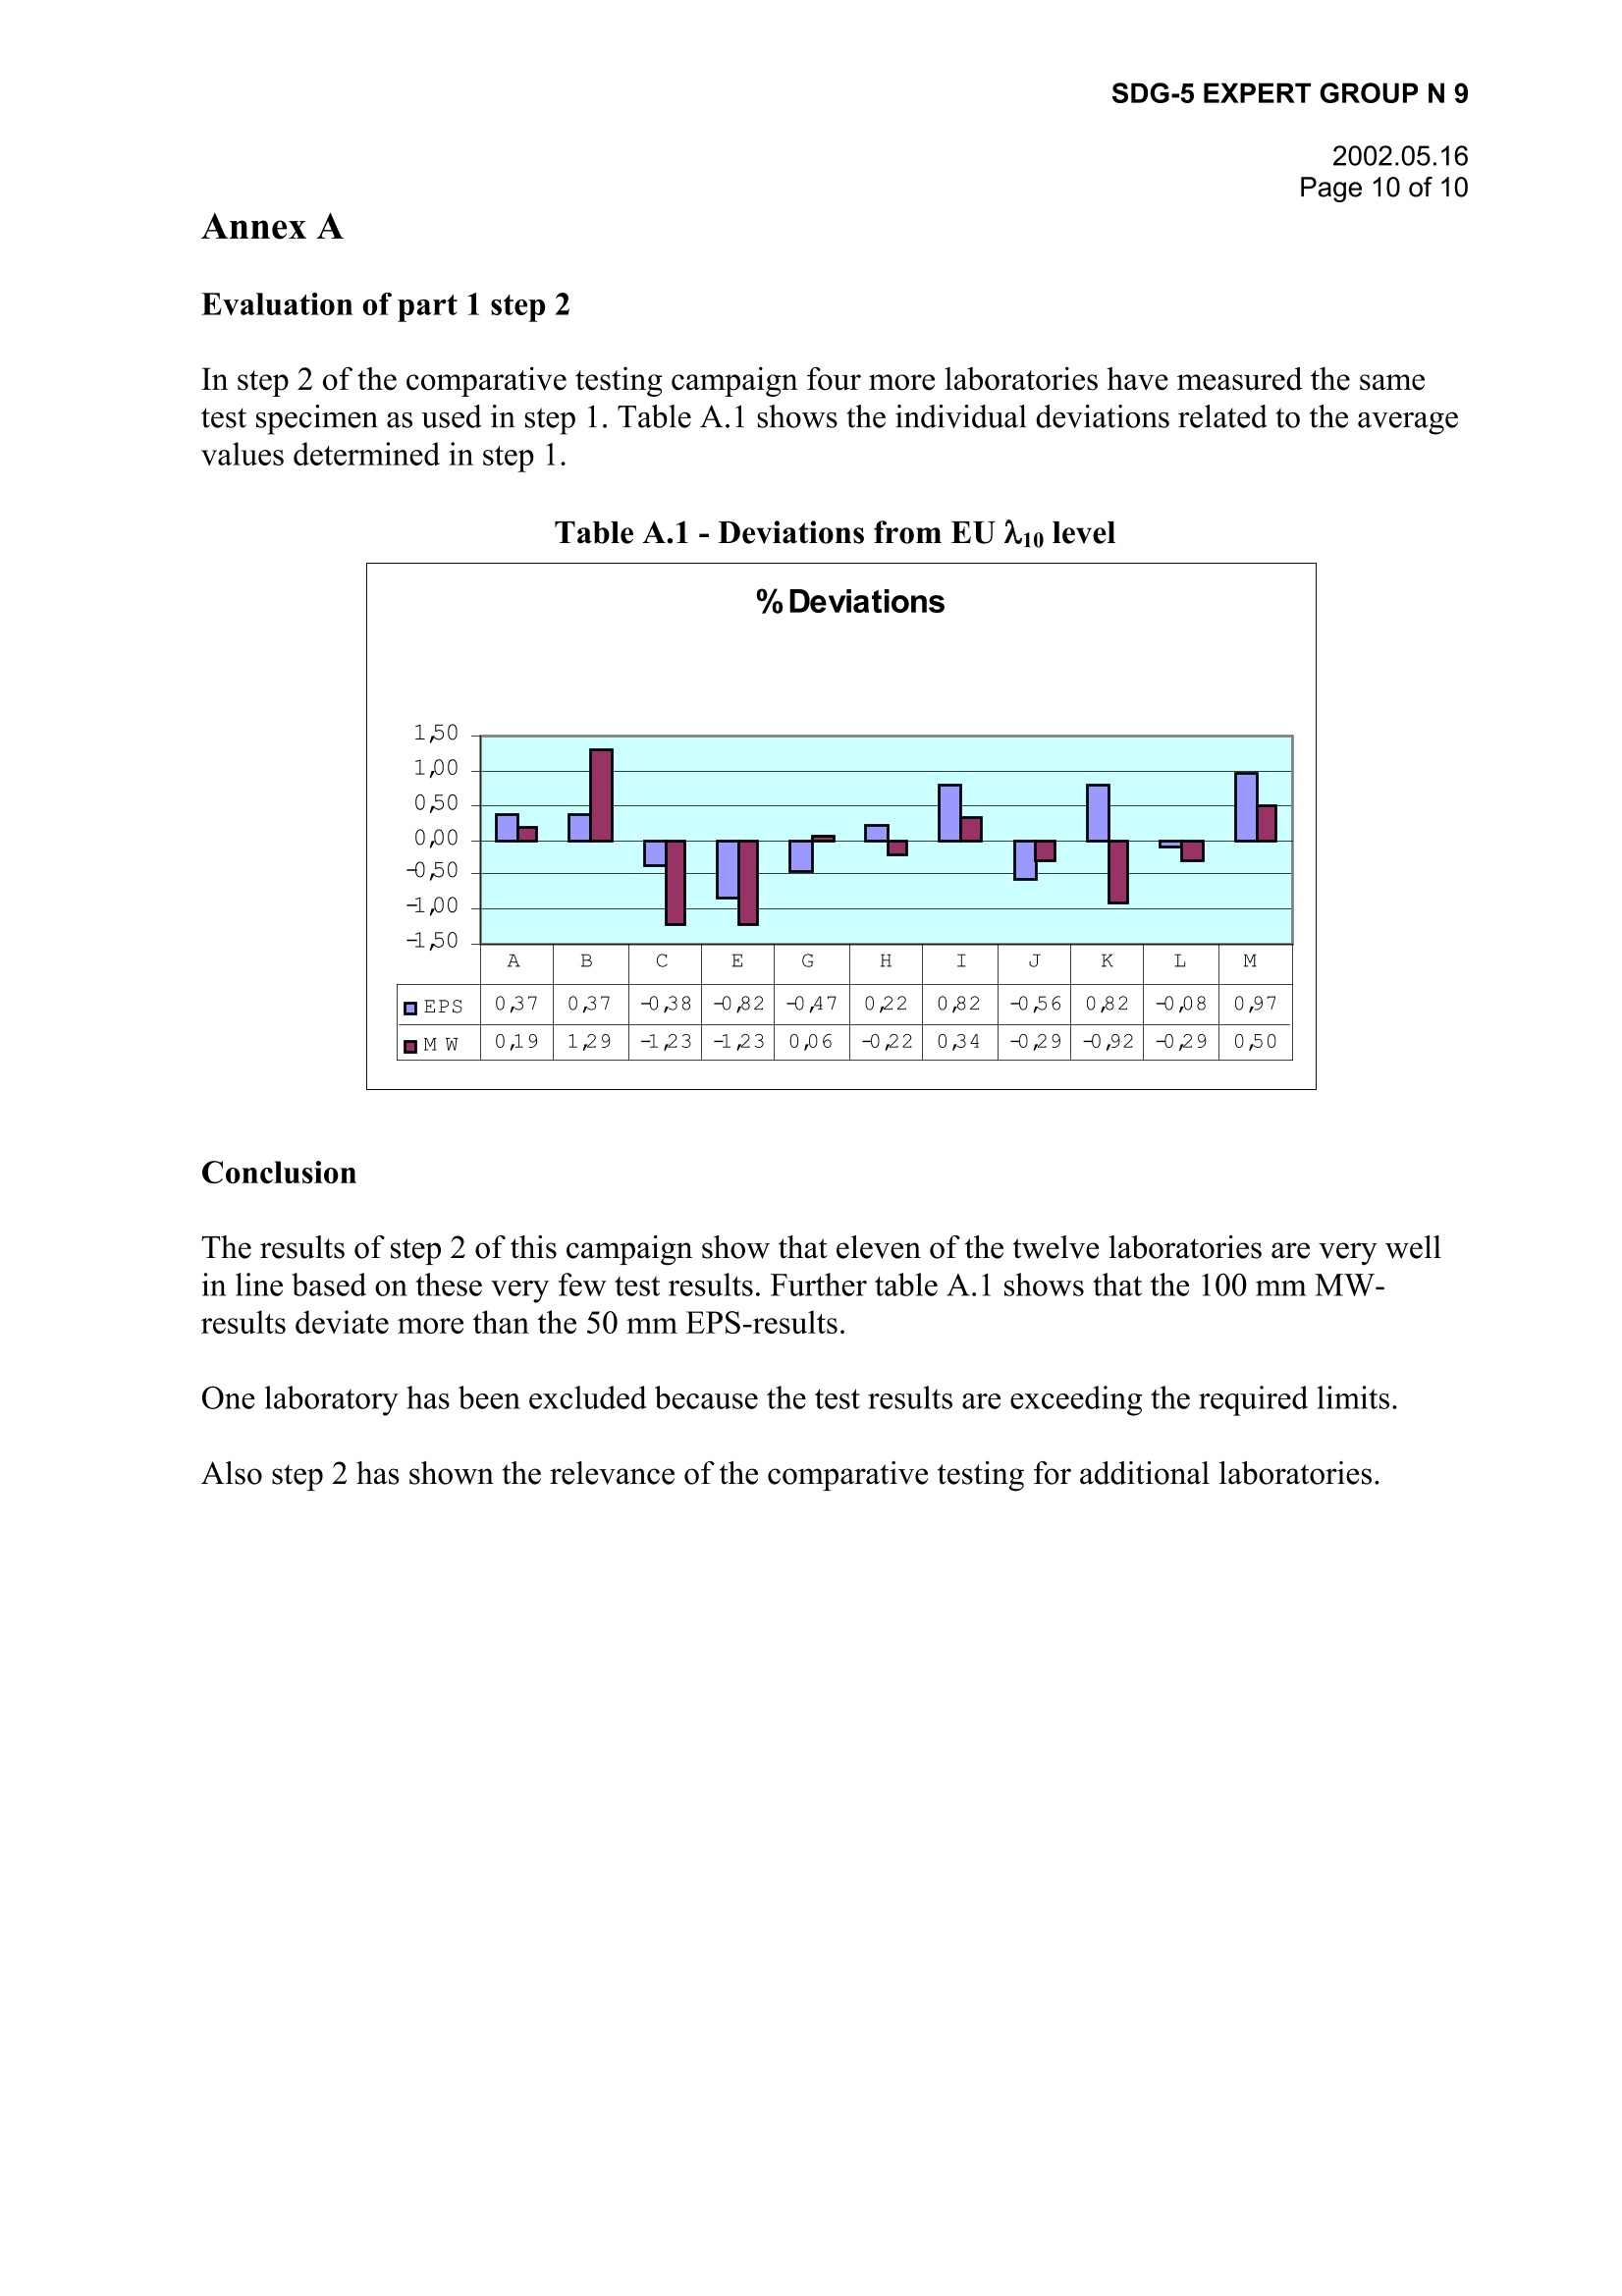
SDG-5 EXPERT GROUP N 9 SDG-5 EXPERT GROUP N 92002.05.16 2002.05.16 Page 1 of 10 Comparative testing of thermal conductivity Group of experts for establishing European A10-level Round 1: 2001 Page 2 of 10 Introduction During the development of the Specific CEN Keymark Scheme Rules for Thermal InsulationProducts, developed 1999-2001 by Scheme Development Group No.5 (SDG5), a strong needfor reduction of the actual differences in A10 level among the European test institutes was identi-fied. The coming European product standards specify thermal conductivity(A10) declared with stepsof1 mW/(m.K). For thermal insulation products with A1o in the range of 35 mW/(mK) thismeans steps of 3%, which clearly illustrates the need of a common European A10 level deter-mined ideally down to ±0,5 to 1%. The European standards for measurement of A1o does not aimat greater accuracy than ±3%, therefore the very narrow limit does not seem realistic today. Alimitation of±1,5%has been proposed se below. Experiences from comparative testing either conducted by manufacturers or the institutes them-selves show that a limit of+1,5% is not generally the situation of today. Further it has been identified that this A1o problem was not only of interest for affixing the Key-mark to products but also in relation to the CE mark. Therefore the efforts for establishing acommon European A10 level is conducted in collaboration between Notified Bodies SectorGroup No. 19 (SG 19) and SDG 5. The system for achieving the European A1o level is described in normative Appendix B to theSDG 5 Keymark Internal Rules“Framework for the activities of registered laboratories forthermal conductivity measurements”. Quotation from this document: To ensure conformity with this European Ao level, registered laboratories shall be designated in accor-dance with the requirements ofthese scheme rules. These registered laboratories shall be in agreementwith the European Ajo level to within ±1,5%. This value is subject to evaluation by the SDG 5 Implemen-tation Group and will be fixed after the results ofthe first comparative testing campaign between candi-date registered laboratories are available. In addition to the registered laboratories, a small expert group, whose members are experts in the fieldof thermal testing and work with an identified reference guarded hot plate equipment, shall be desig-nated so as to define the European A1o level. NOTE The European A1o level is defined in compliance with EN 1946-2 and the IRMM 440 reference material.This comparative testing is made to confirm the consistency of the involved laboratories with the A1o level. Further the document determines that measurements carried out by members of the group of ex-pert shall be done with identified reference guarded hot plate equipment at a mean temperatureof 10±0,3°C. In annex 4 of the document:“Example of results of a comparative testing programme set up toestablish the European A10 level for the expert group”it is assumed that the results will be within±1% and the European A10 level is calculated as the average of results within this limitation. This document report the result of the first comparative testing among laboratories invited totake part in the work even before the SDG 5 Implementation group is established.The results are collected and the report drafted by M. R. Byberg, VIK, Denmark, member ofSDG 5. The final report is edited by the group of experts. Page 3 of 10 Laboratories In step 1 of the first comparative testing the following 8 laboratories were invited to take part: Table 1-Laboratories participating in step 1 Initials Laboratory Contact person Country BBRI-CSTC-WTCB Belgian Building Research InstituteGilles Flamant/ Piet Vitse Belgium CRIR Centre de Recherche Industrielle de RantignyCristian Ciucasu France EMPA Eidgenossiche Materialpruifungs- und ForschungsanstaltHans Simmler Switzerland FIW Forschungsinstitut fir Warmeschutz e.V. MiinchenWolfgang Albrecht Germany LNE Laboratoire National d'Essais Gianni Venuti France MPA-NRW Materialprifungsamt Nordrhein-WestfalenThomas Kloos Germany NPL National Physical Laboratory David Salmon UK SP Swedish National Testing and Research InstituteBertil Jonsson Sweden In step2 of the first comparative testing other laboratories are able to test the same specimens asthe above listed laboratories. Test results will be reported when they are available. For the mo-ment the following laboratories are foreseen: Table 2-Laboratories participating in step 2 OFI Osterreichisches Kunststoffinstitut Giinter Jechlinger Austria MA39-VFA MA39 Versuchs-und Forschungsanstalt der Stadt WienWerner Kuhnert Austria BASF Norbert Krollmann Germany CEDEX Laboratorio Central de Estructuras y Materiales Andres Arranz Spain For the purpose of publishing this report the laboratories by random are allocated the lettersA to M. Only members of the expert group will receive the confidential key to these letters. Apparatuses used in this comparative test Table 3 -Apparatus survey Laboratory GHP sizes test specimen metering areamm mm heat-flow BBRI 600x 600 300x300 vert. symm. CRIR 610x 610 single 305x305 single vert. up EMPA 750x750 300x300 vert. symm. FIW 800x800 300x300 vert. symm. LNE 610x610 305 x 305 vert. symm. MPA-NRW 770x770 503 x503 vert. symm. NPL 610x610 single 305x305 single vert. up sP 600x600 single 250x250 single vert. down OFI 750x750 500 x500 vert. symm. MA39-VFA 800x800 500 x 500 vert. symm. BASF 250x250 vert. symm. CEDEX 600 x600 300x300 vert. symm. The maximum thickness that can be measured by the laboratories on the used equipment all ex-ceeds test specimen thickness used in this comparative testing. Test specimens For the purpose of this comparative campaign test specimens (comprised of two pieces each) oftwo materials have been prepared: Expanded polystyrene, EPS 50 mm thickness Manufacturer BASF, GermanyMineral wool.MW 100 mm thickness Manufacturer Isover,France The specimens were prepared by Erik Rasmussen, chairman of SDG 5, in the size 800 x 800mm"and transported from laboratory to laboratory in closed metal boxes. Before the first trans-portation the specimens were conditioned to 23℃, 50 % RH. No further conditioning was car-ried out in the laboratories before the measurements. The specimens are marked: The specimens were first measured by laboratories with equipment 800 x 800 mm , then cut to750 x 750 mm , 610x 610 mm and finally 600 x 600 mmsuccessively for laboratories withsmaller equipment. Every time cutting has taken place the central part of the specimens has beenundisturbed. Material cut off was marked and maintained in the boxes. Contribution to costs Each laboratory has paid their own costs for participating in meetings (travelling and hours). Page 5 of 10 Metal boxes, preparation of test specimens, transportation from laboratory to laboratory and themeasurements is paid by funding mentioned below. Co-ordination of tests has been done by Erik Rasmussen, Rockwool International A/S, Den-mark, and evaluation of test results and draft reporting has been done by M. R. Byberg, Den-mark, both free of charge. The following organisations / companies have provided funding for the comparative tests:Pittsburgh Corning Europe S.A., BelgiumOsterreichische Heraklith GmbH, AustriaEURIMA Test Plan A very tight time schedule for the whole campaign was set up and was followed as close as pos-sible by the laboratories. The measurements (step 1) were started in week 23 and finished inweek 37, 2001. This means that the laboratories have done the measurements in 14 weeks in-cluding transportation and some equipment problems. Test results Before presenting any test results it is important to note, that the results consists of only one(two) result from each material from each laboratory and will by no means give statistical evi-dence of differences between the laboratories involved. On the other hand it is foreseen that thelaboratories invited are experts and that the results recorded represent the best of their abilitywithin the accuracy of their equipment. Test results from laboratories have been reported on the format described in Appendix B to theKeymark rules. The laboratories have been asked to give additional information on the identifi-cation no. of the equipment. Further the laboratories were asked to report test results from meas-urements using the IRMM 440 reference material. Some laboratories have double plate apparatuses, other laboratories single plate apparatuses.The results are shown in this report with four significant figures even when a laboratory with adouble plate apparatus has forwarded the result with three significant figures. The results fromthe single plate apparatuses are calculated as the average of the results from the individual testpieces and expressed with four significant figures. NOTE In normal thermal testing only three significant figures are used. Page 6 of 10 Reported A10-values As A1o-measuring related to this comparative testing are still going on no A1o-values will beshown in this version of the report. The individual results from the participating laboratories willbe expressed relatively to the established European A10 level. Evaluation 1 Appendix B of the Keymark rules has foreseen that each of the products EPS and MW should bemeasured in two thicknesses, 50 and 100 mm. The tests carried out only cover one thickness foreach product. Therefore the average of the EPS and MW deviations is used as the “laboratorydeviation”. Calculation of average of EPS-and MW-deviation Although one of the laboratory deviations is slightly greater than the limit foreseen in AppendixB of the Keymark rules all test results are accepted in step 1 for derivation of the European 10level. Individual deviations for EPS and MW Page 7 of 10 As shown in Table 5 all EPS deviations are within ±1% of the average. For the MW deviationsthe max. and min. deviations are both of the magnitude 1,25%. As they are balancing each other,they are accepted. EU A1o-level The EU A1o-level is defined as the average of results from the step 1 laboratories on one set oftest specimens. Based on the very few test results, one value for each of two materials from the eight laborato-ries, it can be concluded that step 1 of the first comparative testing campaign has shown: Table 6-EU A10-level max./ min. deviationfrom EUA10-level Standard deviation EPS, 50 mm +1,0% -0.8% 0,59% MW, 100 mm +1,3%-1.2% 0,73% Results of IRMM 440 measurements and target value The laboratories also have reported their latest test results for the IRMM 440-reference material.Table 7 shows the results and Table 8 the deviations from the target value 30,48 mW/(mK).For the IRMM 440 reference material deviations are all within the ±1% range. Table 7-Result of IRMM 440 measurements Finally Table 9 show the individual deviations for EPS, MW and IRMM 440. Table 9 -Individual deviations Comparison between the IRMM 440 results and the results from the campaign Table 10 -Comparison of test results max./ min. deviation fromIRMM 440 /EU A1o-level Standard-deviation IRMM 440, 35 mm +0,4%-0.9% 0,45% EPS, 50 mm +1.0%-0,8% 0.59% MW, 100 mm +1,3% -1.2% 0.73% Page 9 of 10 Conclusion Taking into account that this is the first comparative testing campaign in the SDG 5 KeymarkScheme and that only one thickness for each of the two materials have been tested the resultshow that the agreement between laboratories is better than ±1,5%,which is acceptable for thisscheme. The aim of the campaign was also to define the European A10 level and this has been achievedsuccessfully. The comparative testing has proven useful in showing good agreement between laboratories andit will be repeated in the coming years with more laboratories taking part. Further it seems useful to test the same material in different thickness. Annex A Evaluation of part 1 step 2 In step 2 of the comparative testing campaign four more laboratories have measured the sametest specimen as used in step 1. Table A.1 shows the individual deviations related to the averagevalues determined in step 1. Table A.1-Deviations from EU A10 level %Deviations 1,50 1,000,50 0一 -4-1 A B C E G H oEPS 0,37 0,37 C -0,38 E -0,82 -0,47 0,22 I 0,82 J -0,56 K 0,82 L -0,08 M 0,97 口MW 0,19 1,29 -1,23 -1,23 0,06 -0,22 0,34 -0,29 -0,92 -0,29 0,50 Conclusion The results of step 2 of this campaign show that eleven of the twelve laboratories are very wellin line based on these very few test results. Further table A.1 shows that the 100 mm MW-results deviate more than the 50 mm EPS-results. One laboratory has been excluded because the test results are exceeding the required limits. Also step 2 has shown the relevance of the comparative testing for additional laboratories.
确定
还剩8页未读,是否继续阅读?

产品配置单
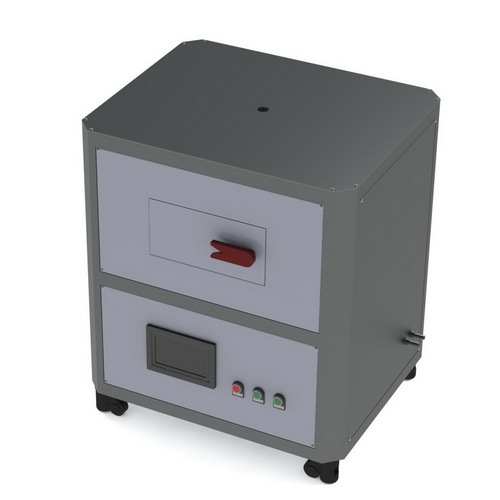
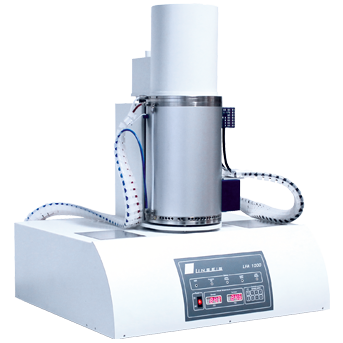
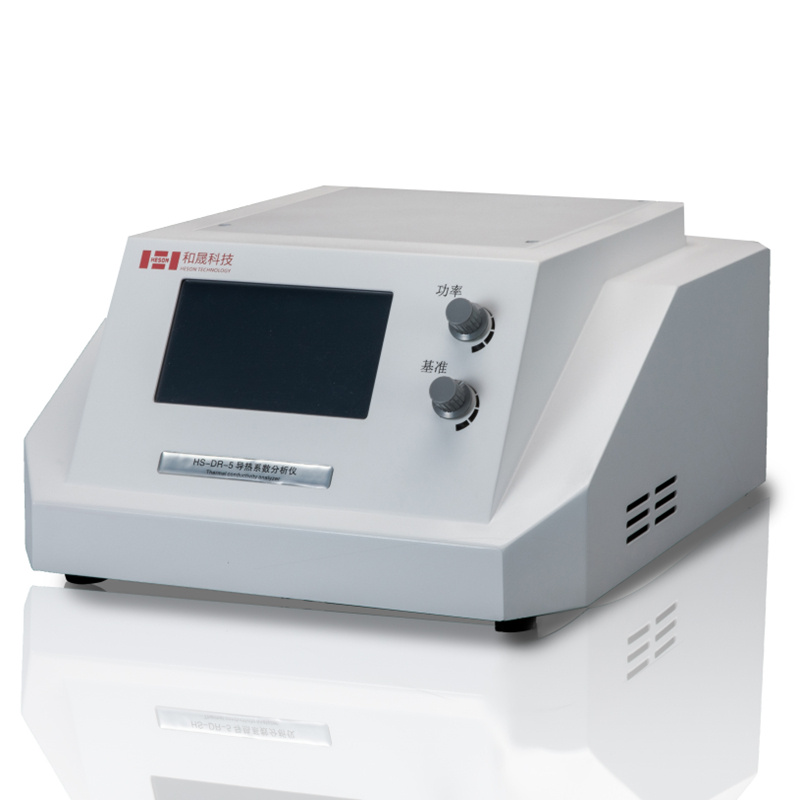
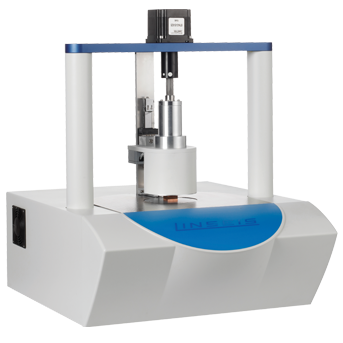
上海依阳实业有限公司为您提供《欧盟范围内防护热板法低导热系数材料比对测试》,该方案主要用于其它中检测,参考标准--,《欧盟范围内防护热板法低导热系数材料比对测试》用到的仪器有稳态护热板法导热系数测定仪
推荐专场

相关方案
更多
该厂商其他方案
更多