


方案详情
文
北京天翔飞域仪器设备有限公司 近红外技术部
方案详情

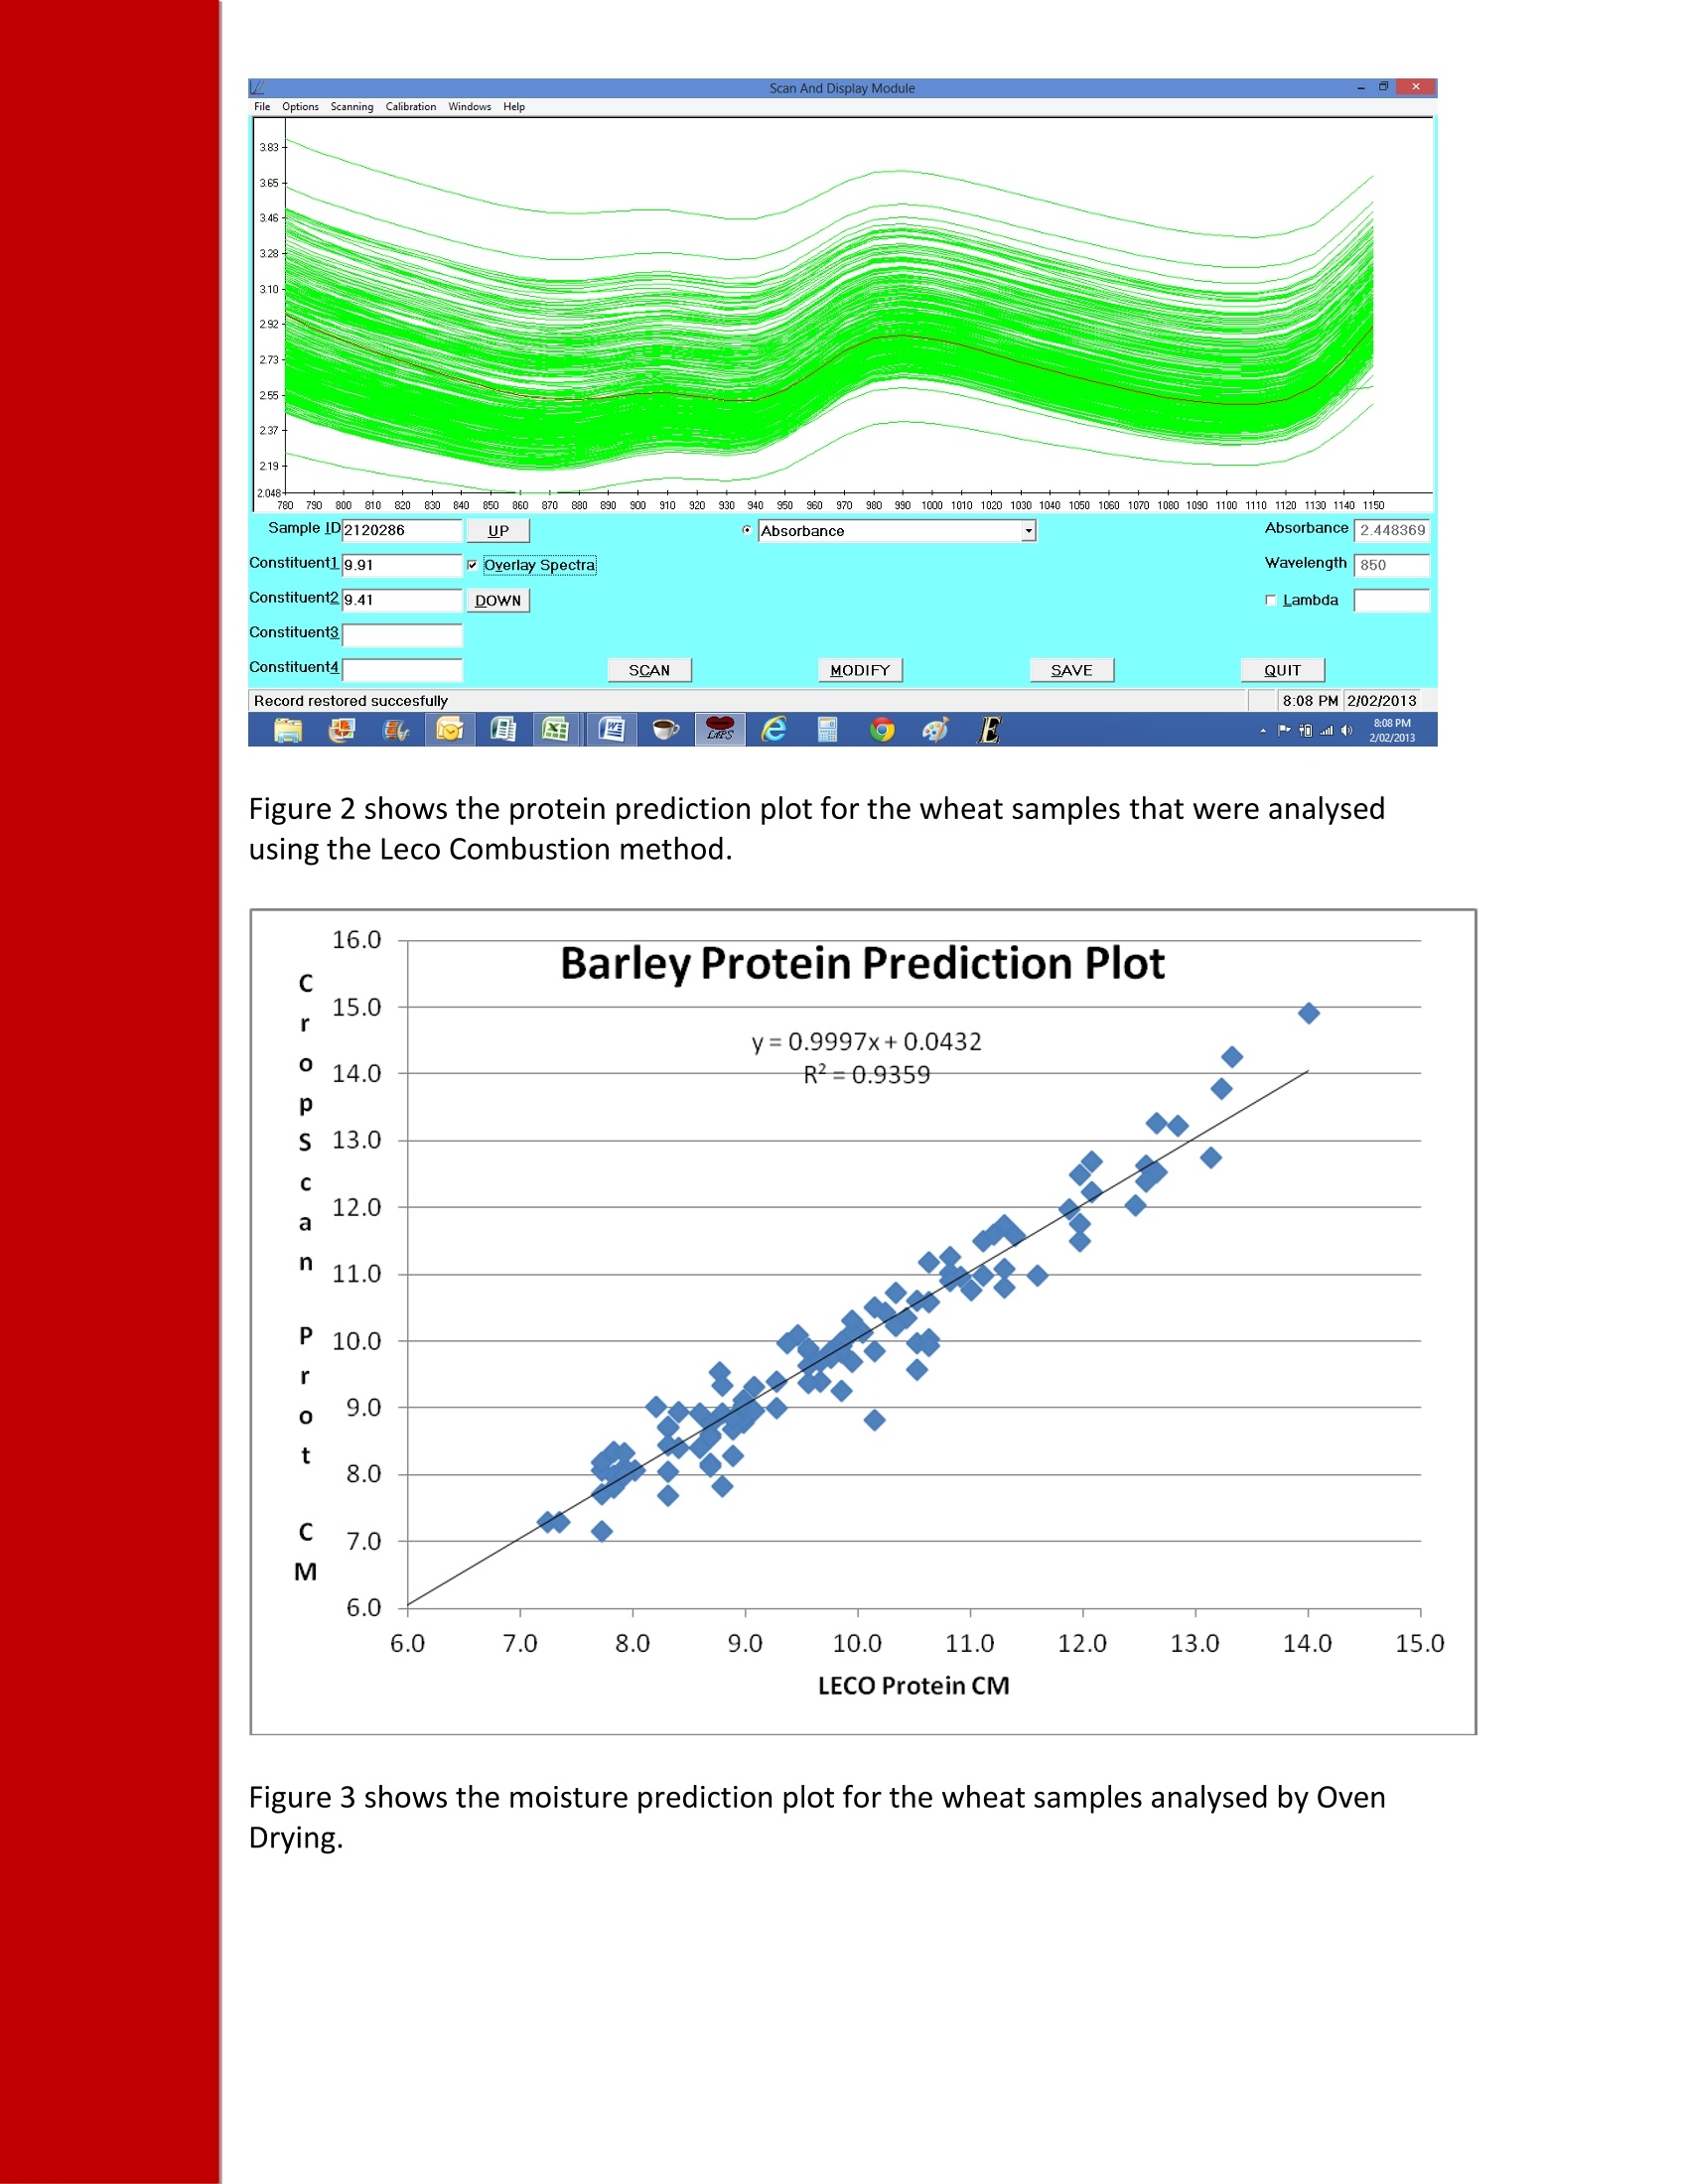
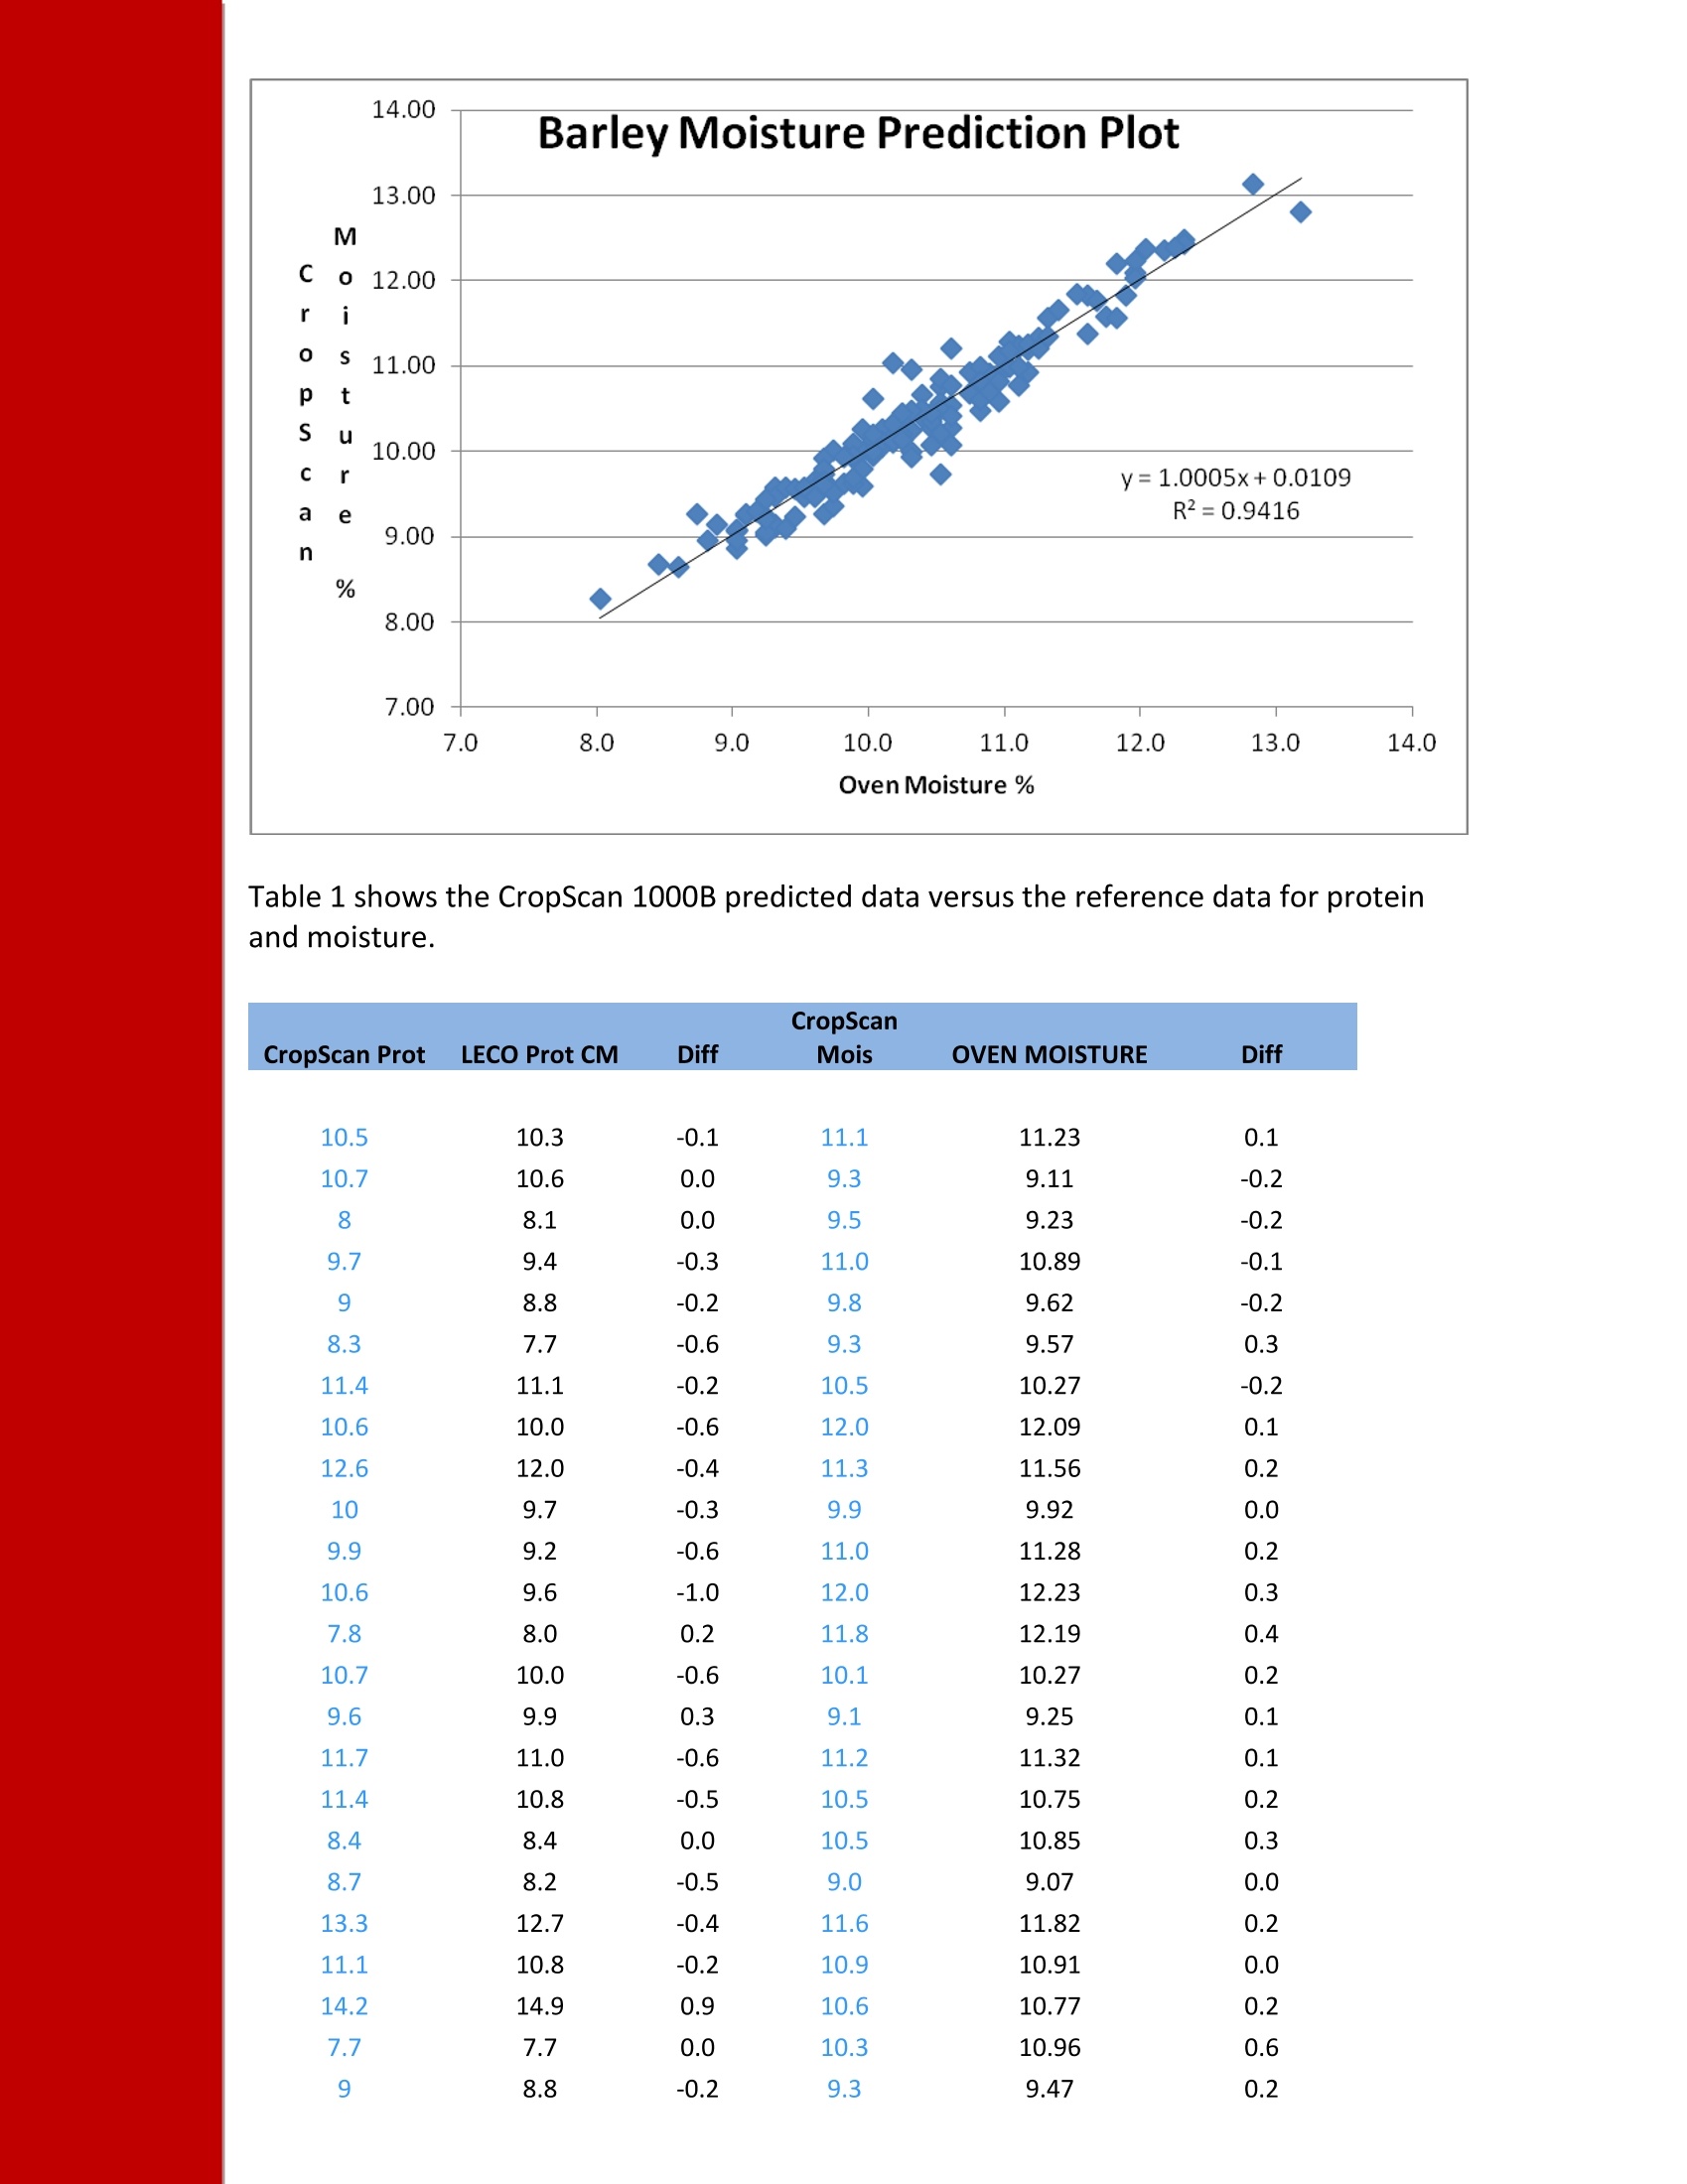
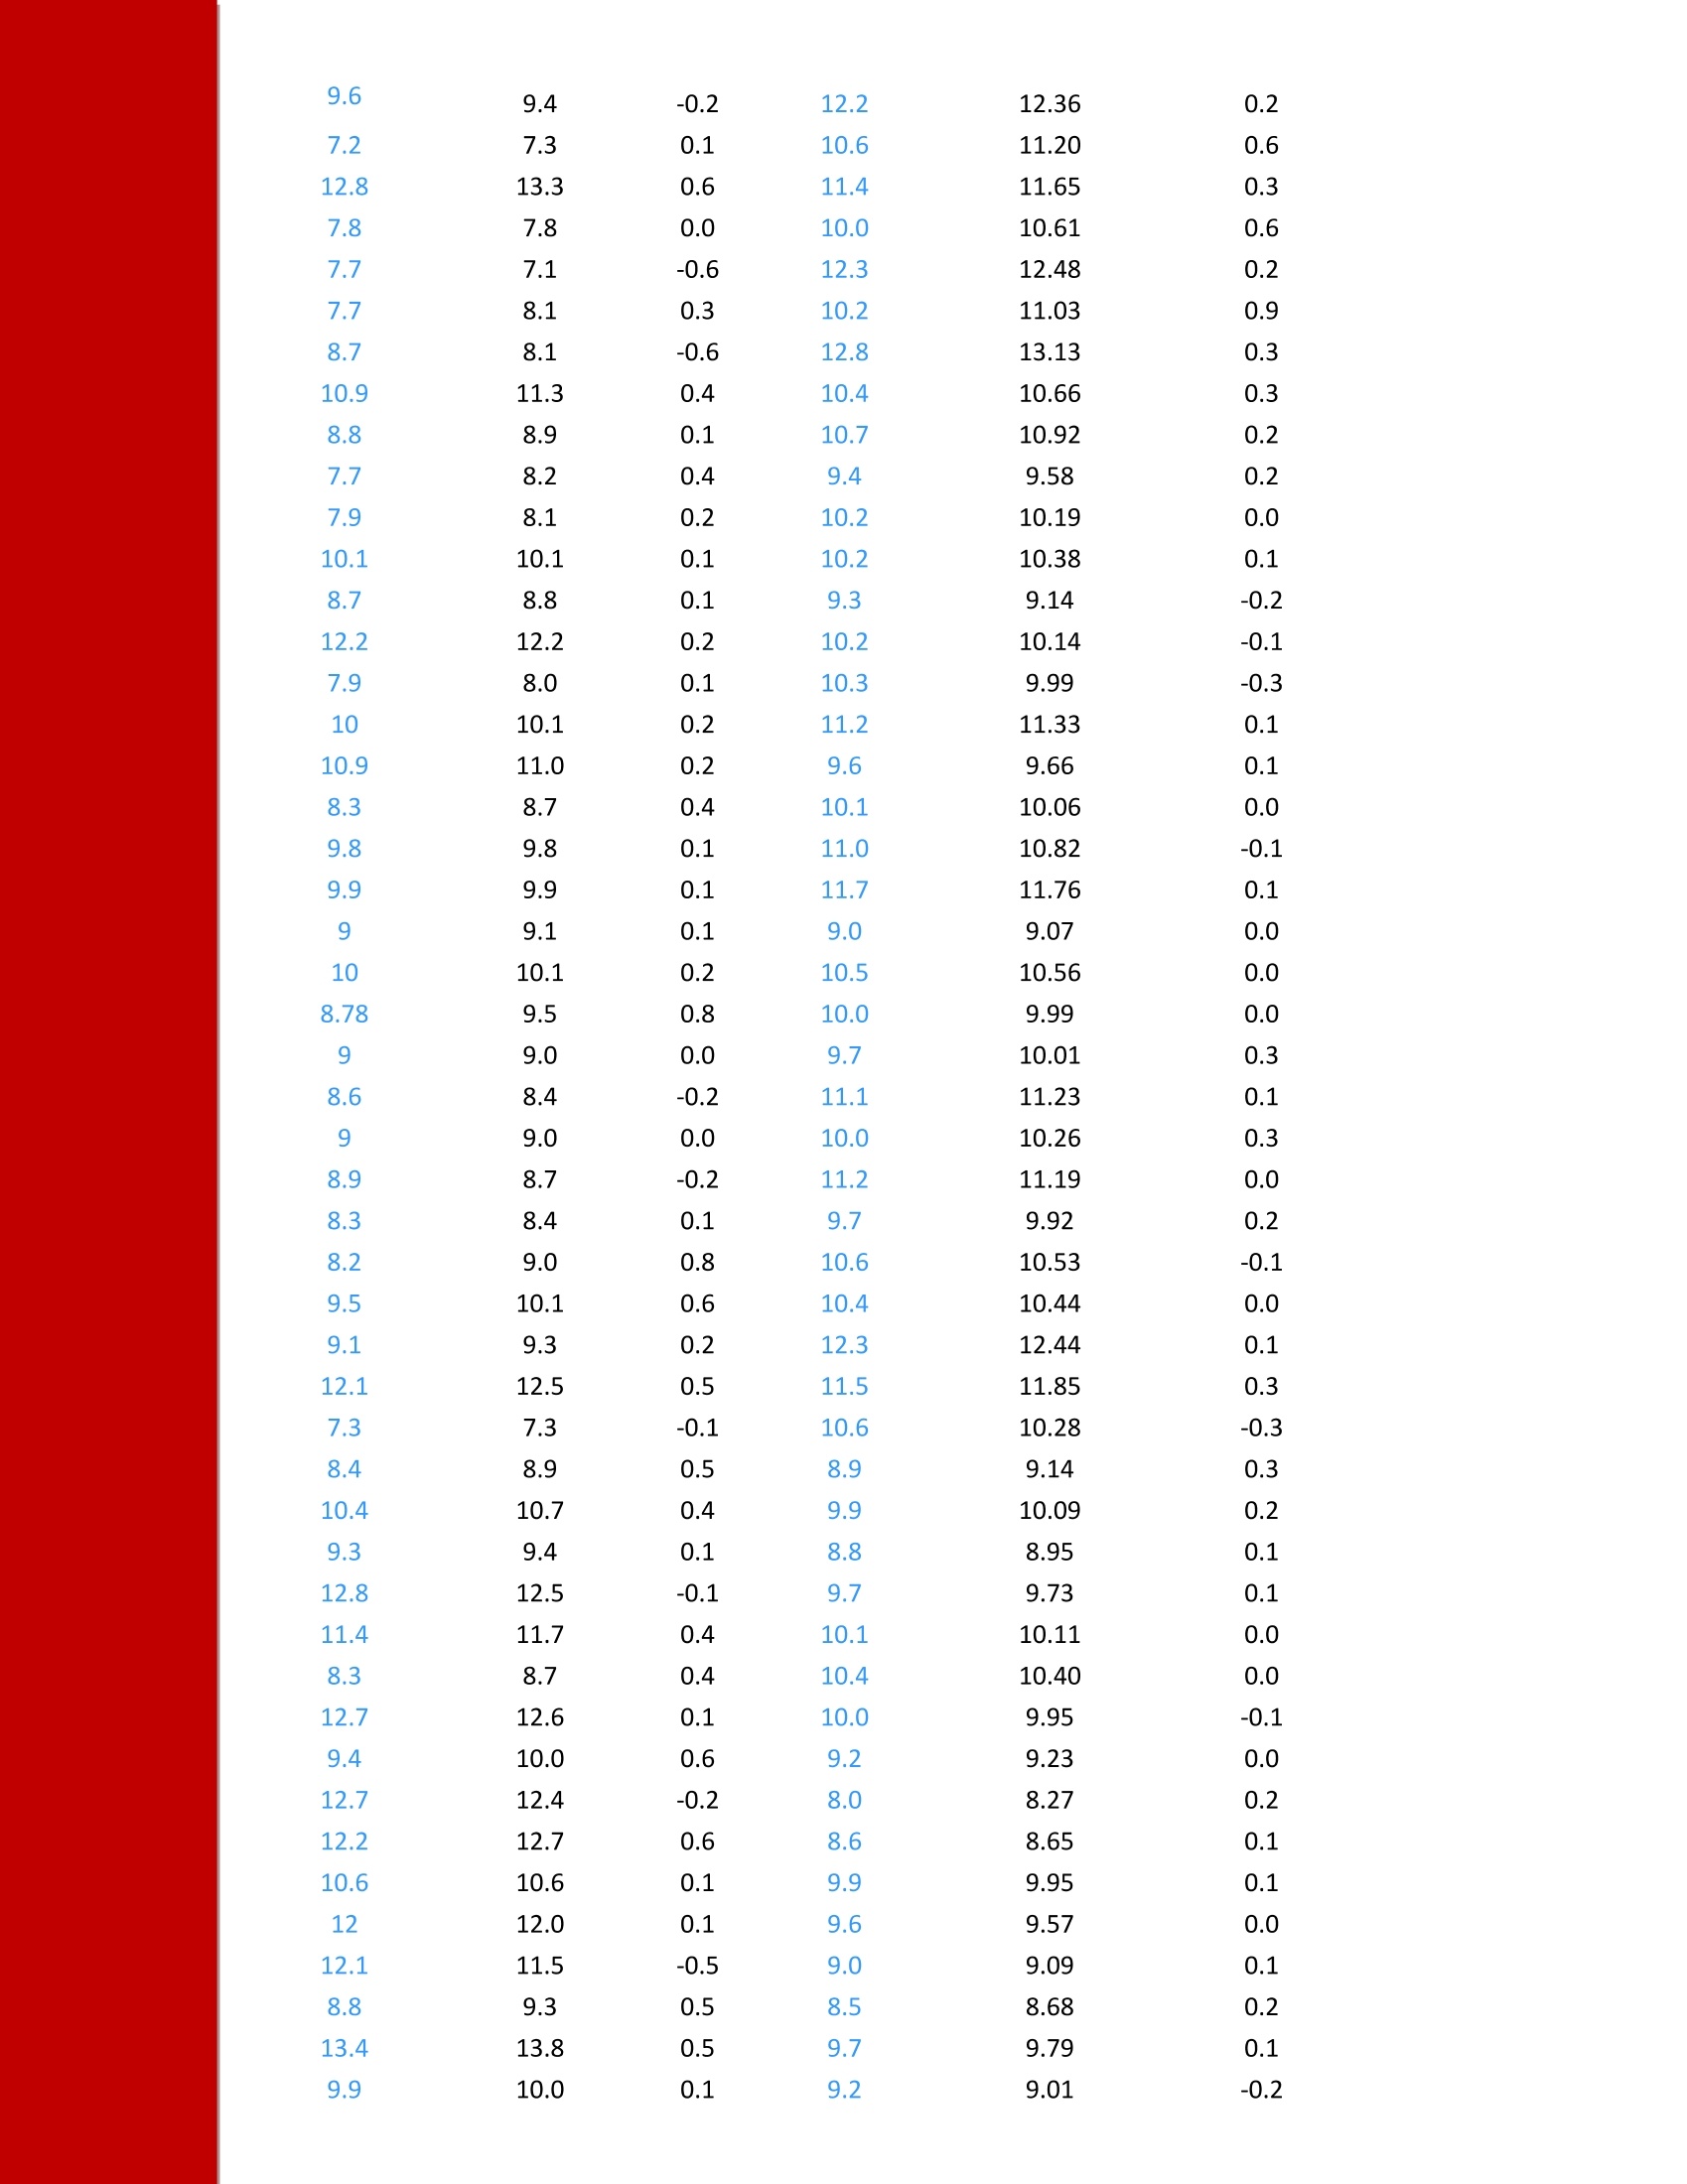
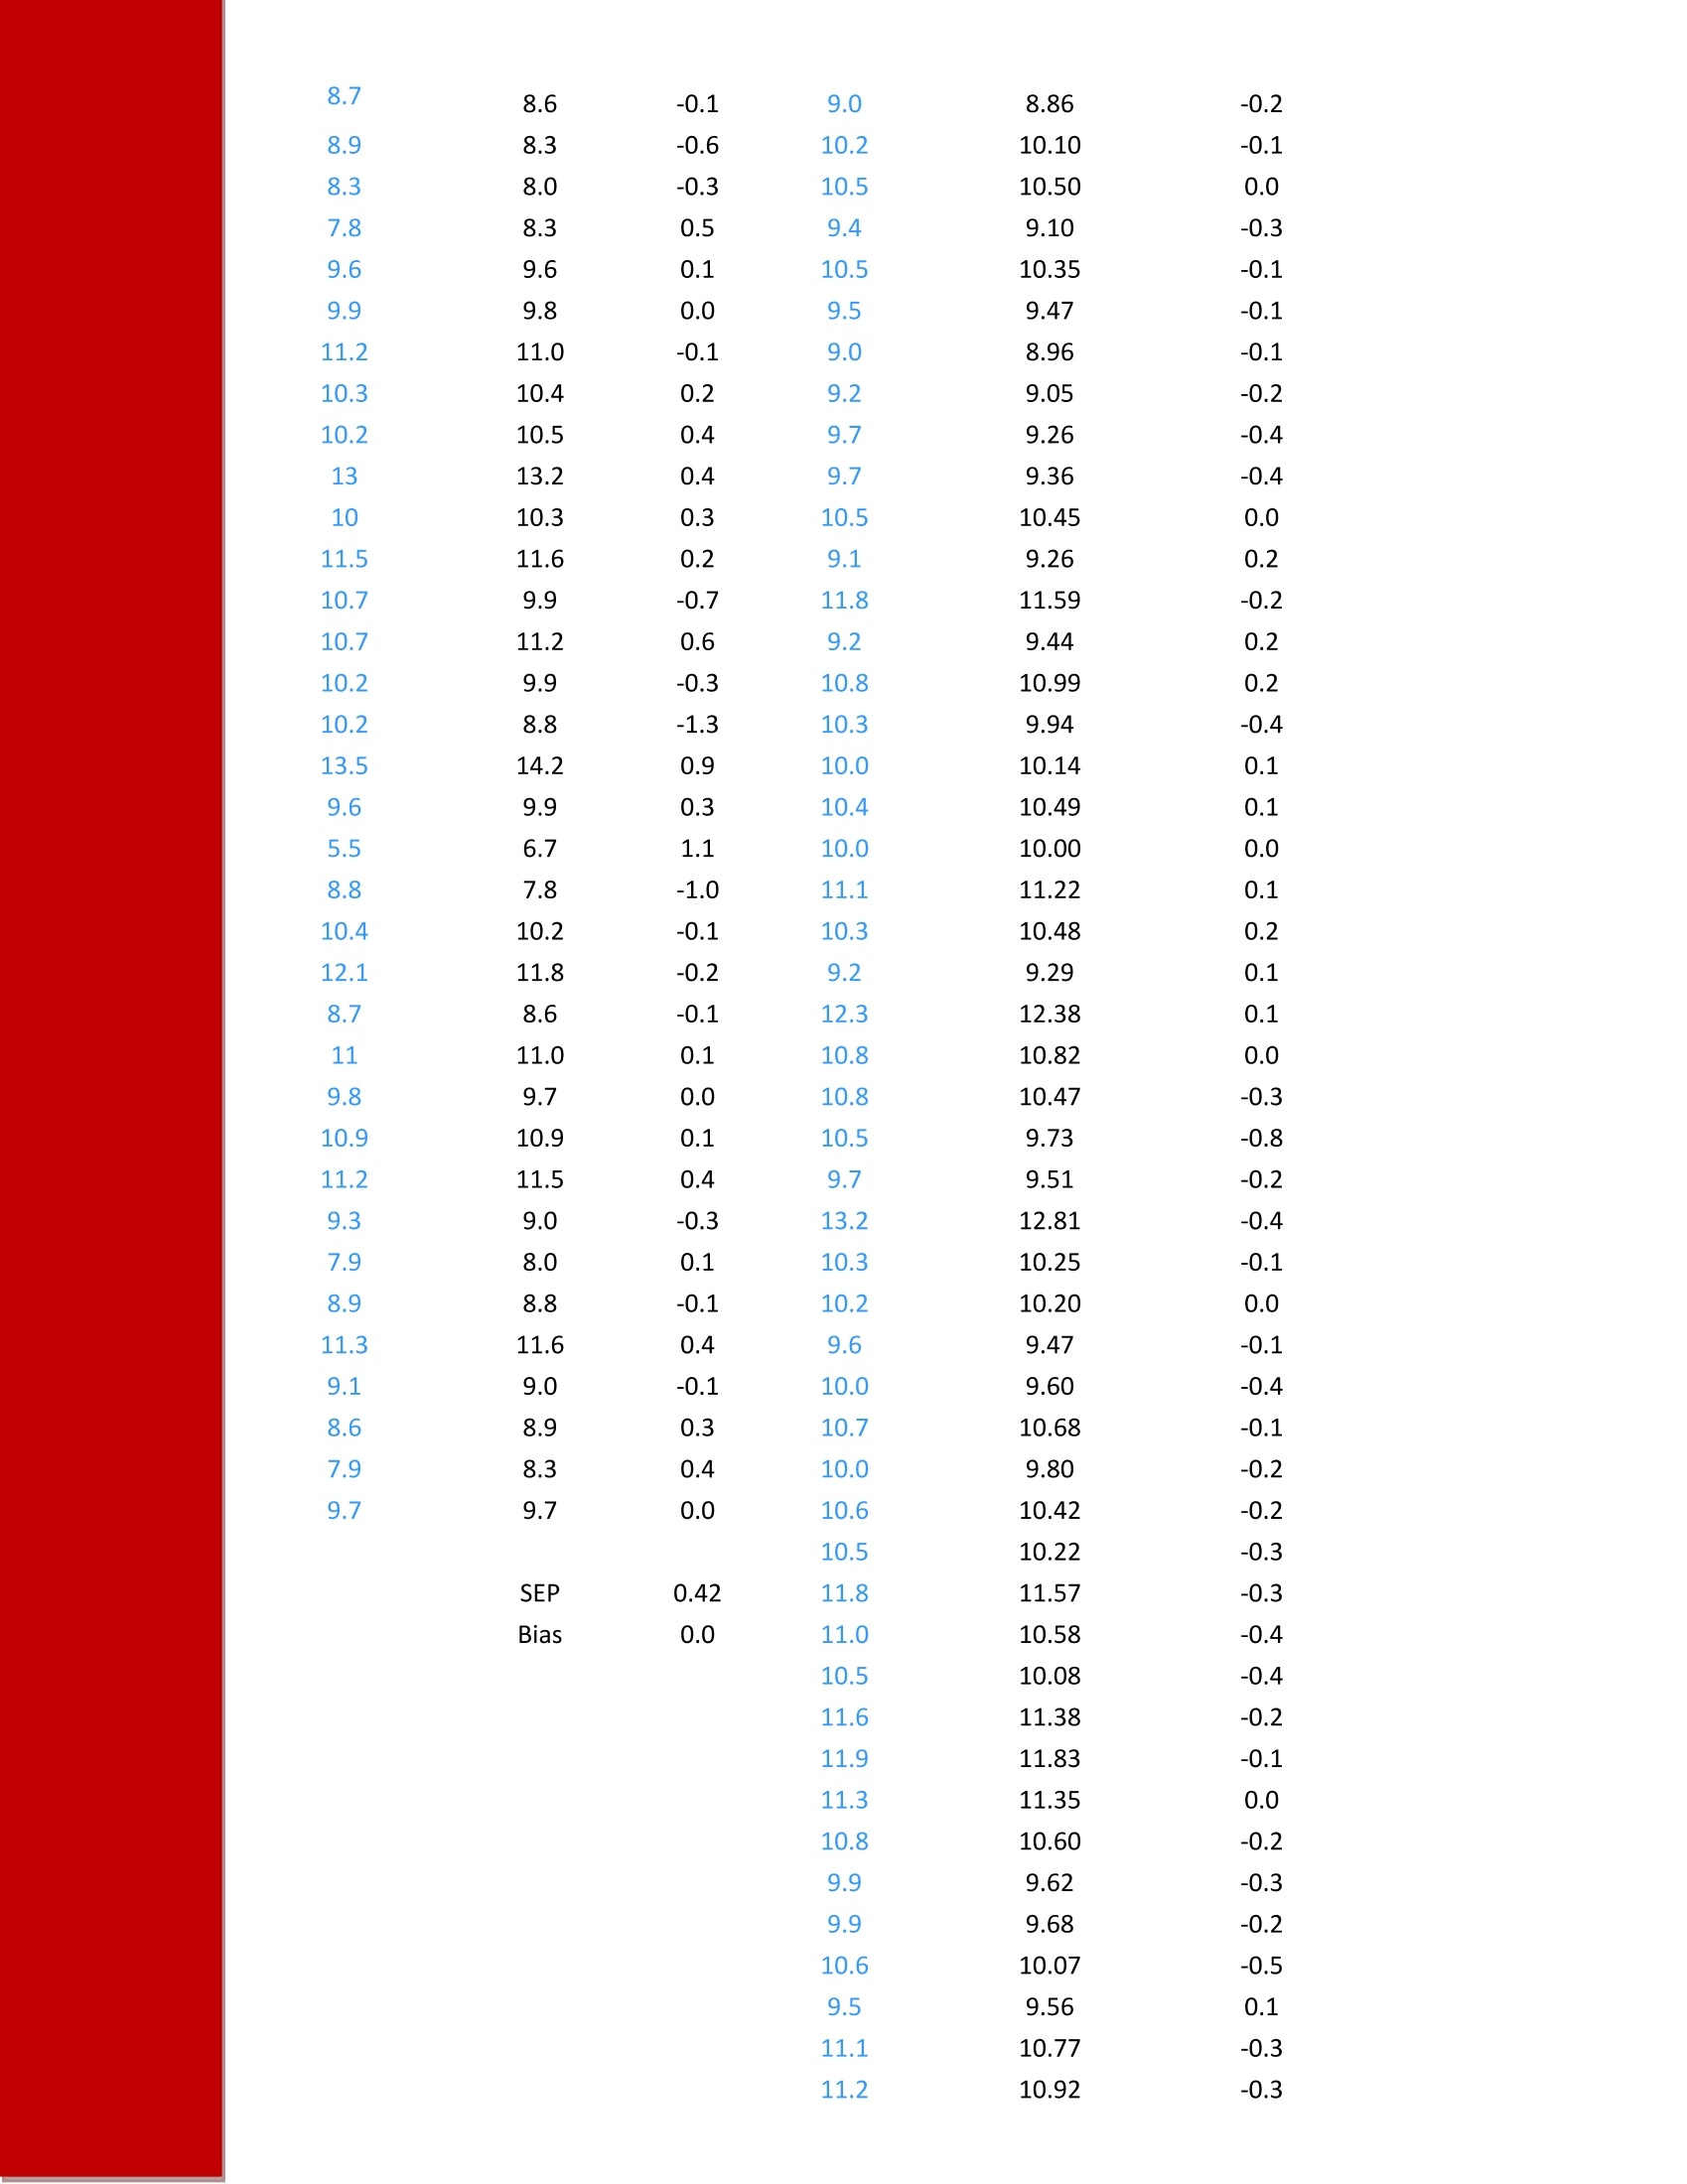
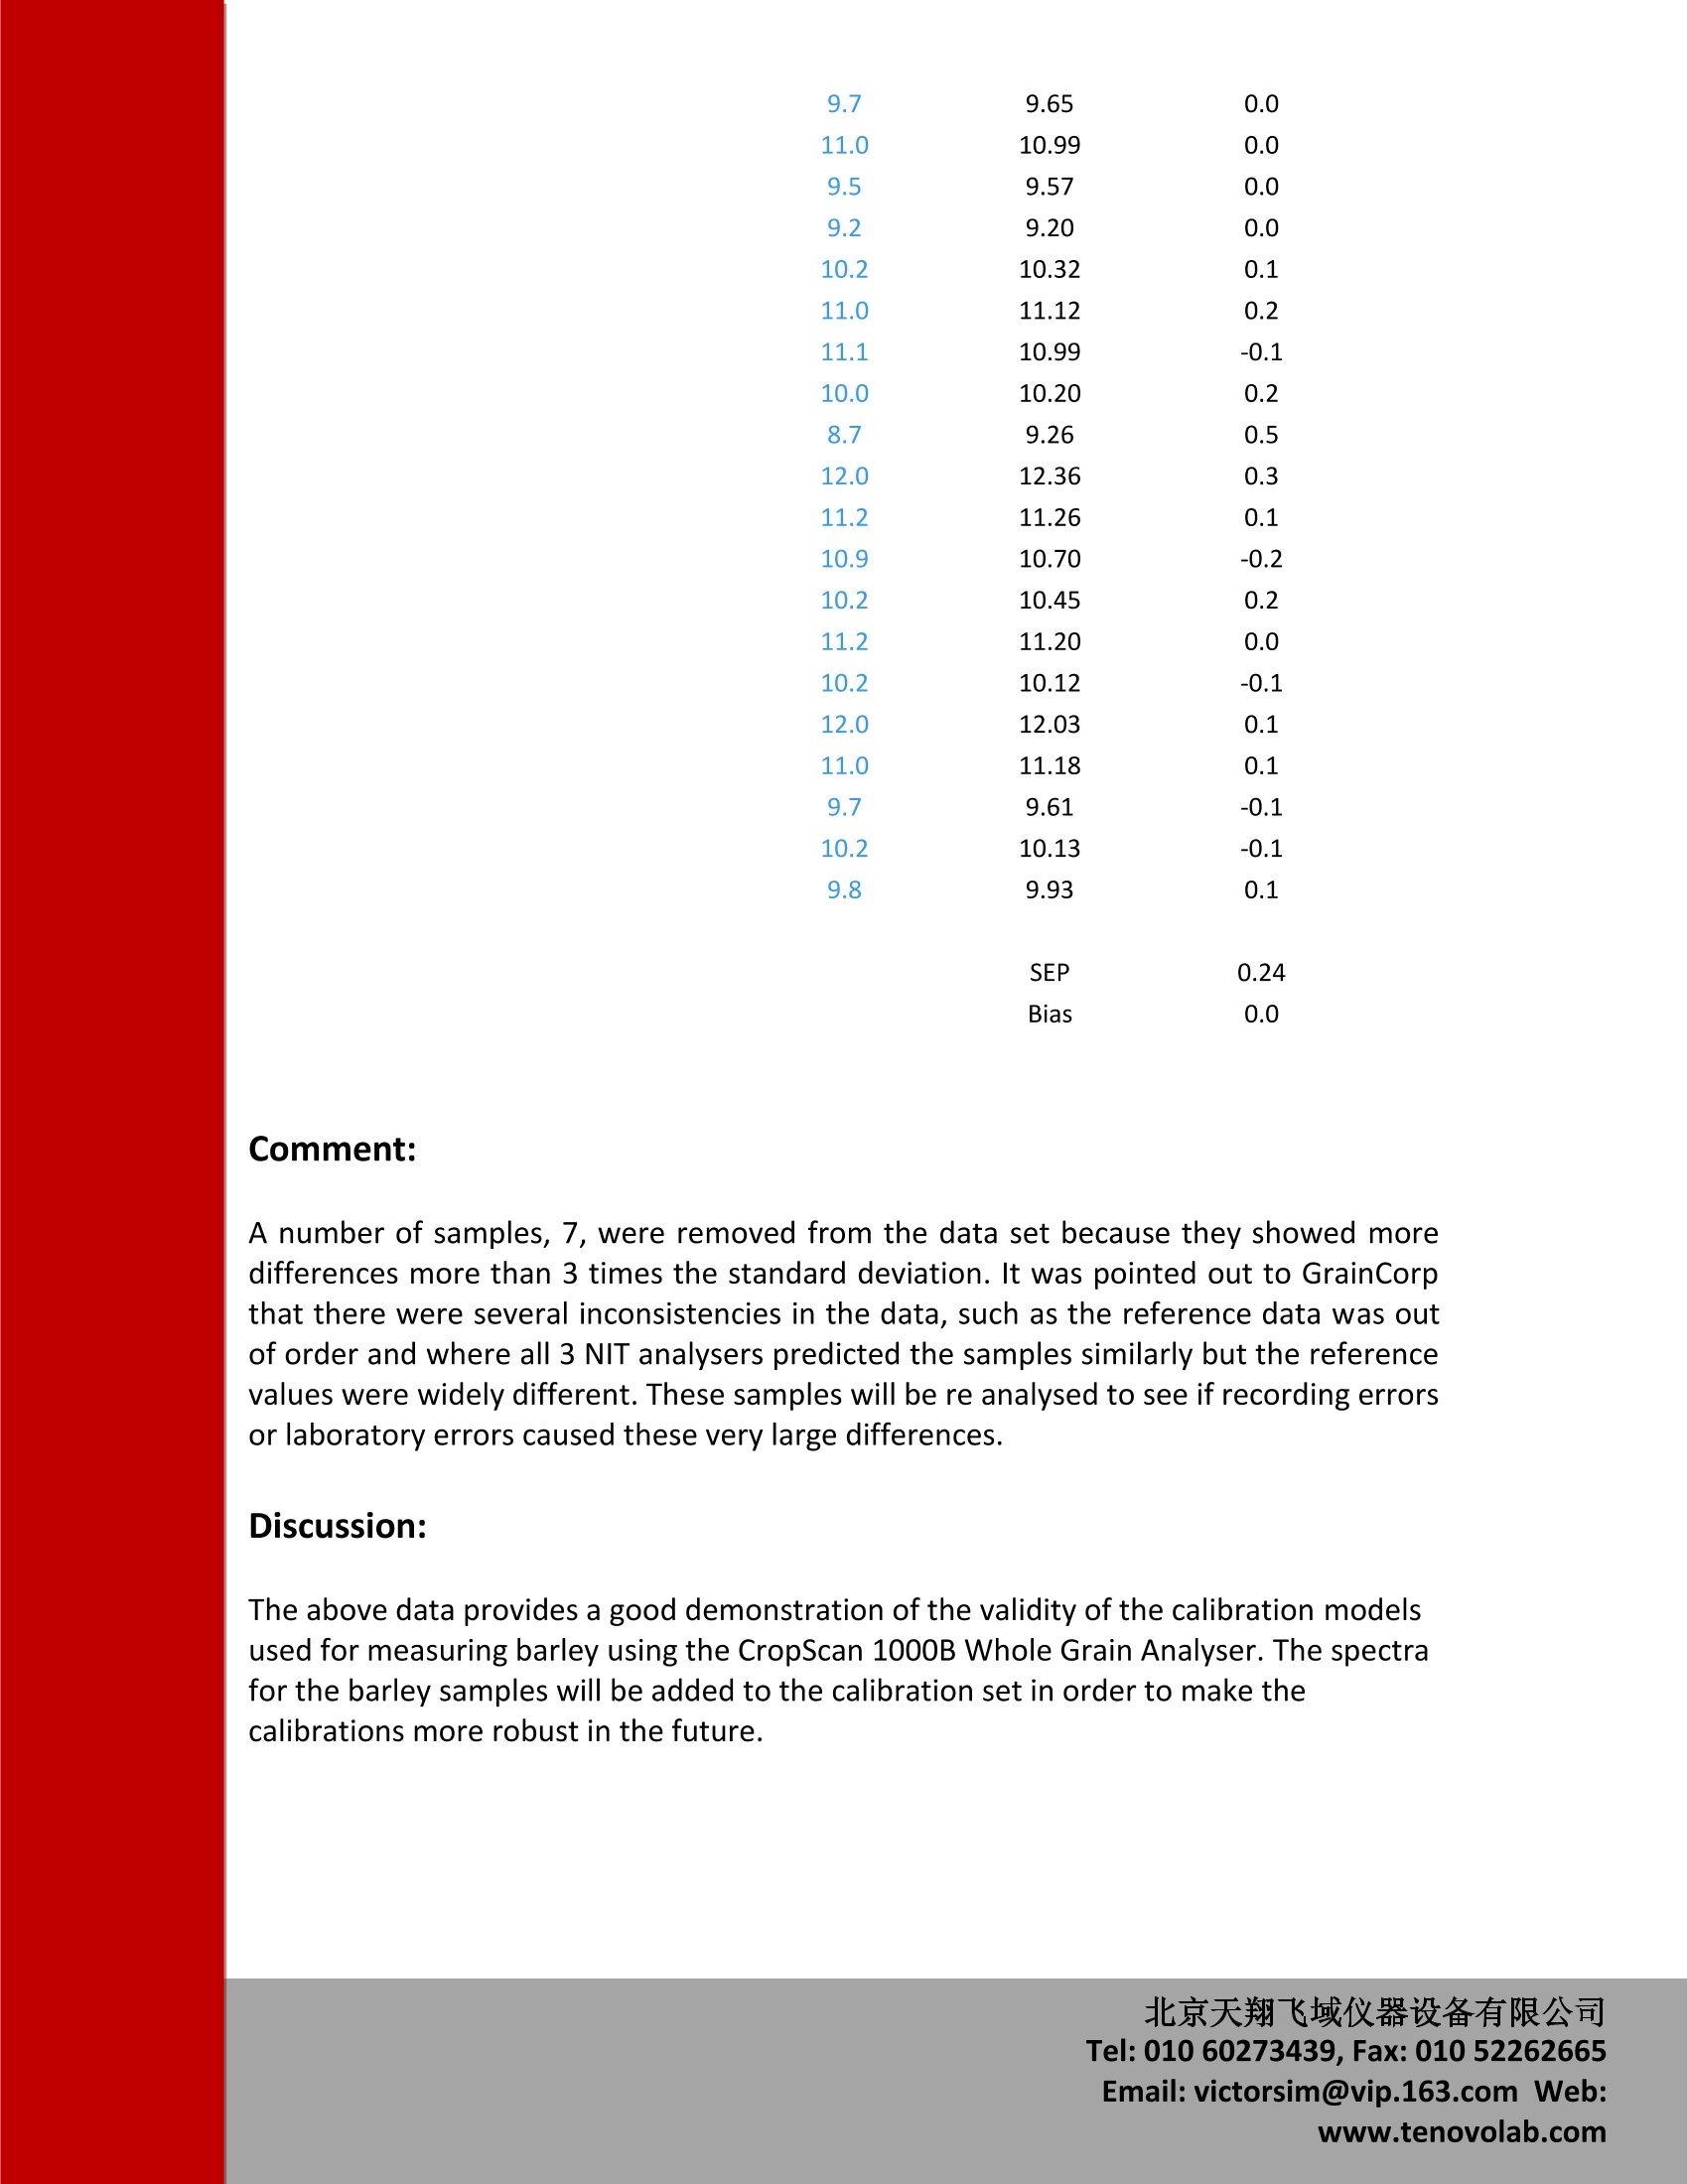
Application Note 167.2012 Harvest Validation Study for theCropScan 1000B Whole Grain Analyser: Australian Barley.北京天翔飞域仪器设备有限公司Tel: 010 60273439, Fax: 010 52262665Email: victorsim@vip.163.com Introduction: Near Infrared Transmission analysers are used in the Australian grains industry tomeasure protein, moisture and oil in wheat, barley, canola and other grains and oilseeds as they are received into bulk storage silos and bunkers. NIT provides a rapid andcost effective means of measuring every load of grain stored in the system, however NITis only a correlated method to the reference methods for protein, Dumas Combustion,for moisture, Oven Drying, and for oil, Soxhlet Extraction. As such, NIT analysers need tobe validated against these techniques annually. GrainCorp Technical Servicess Laboratory,. NNaarrabri, NSW, offers NIT instt ntmanufacturers the opportunity to have a large number of samples run throughinstruments during harvest. This study shows the results of the tests performed duringthe 2012 harvest for Australian Wheat. The CropScan 1000B Whole Grain Analyser is used widely throughout Australia and theworld. It is based on a novel diode array spectrometer that scans the wavelength rangefrom 720-1100nm. Whole grains of wheat, approximately 500ml, are poured into ahopper and then up to 15 sub portions are scanned in transmission mode. Wheat isanalysed for protein and moisture in approximately 45 seconds. A built-in Test WeightModule also provides a means of determining Test Weight and calculating the %Screenings. The CropScan 1000B is certified under the NMI V10 guidelines as beingsuitable for use for measuring protein in wheat and barley. Procedure: GrainCorp collected approx 350 samples of barley during the 2012 harvest. 120 sampleswere analysed for nitrogen and thereby protein using a Leco Combustion analyser andfor moisture using the Oven Drying method. The other samples were analysed using theFoss Infratec 1241 Whole Grain Analyser as this is the standard analyser used byGrainCorp at their receival depots. The barley samples were analysed through severalbrands of NIT whole grains analysers, including the CropScan 1000B. For the sake ofconfidentiality only the data showing comparison between the Leco and Oven Dryingmethods vs the CropScan 1000B are presented in this report. Results: Figure 1 shows the NIT spectra of the 120 barley samples. The spectrum represent theamount of light that is absorbed at each wavelength of light. Protein and water absorbNIR energy at approx 1020 and 970nm respectively. Starch and oil also absorb NIRenergy in this region. Figure 2 shows the protein prediction plot for the wheat samples that were analysedusing the Leco Combustion method. Figure 3 shows the moisture prediction plot for the wheat samples analysed by OvenDrying. Table 1 shows the CropScan 1000B predicted data versus the reference data for proteinand moisture. CropScan Prot LECO Prot CM Diff CropScan Mois OVEN MOISTURE Diff 10.5 10.3 -0.1 11.1 11.23 0.1 10.7 10.6 0.0 9.3 9.11 -0.2 8 8.1 0.0 9.5 9.23 -0.2 9.7 9.4 -0.3 11.0 10.89 -0.1 9 8.8 -0.2 9.8 9.62 -0.2 8.3 7.7 -0.6 9.3 9.57 0.3 11.4 11.1 -0.2 10.5 10.27 -0.2 10.6 10.0 -0.6 12.0 12.09 12.6 12.0 -0.4 11.3 11.56 10 9.7 -0.3 9.9 9.92 0.0 9.9 9.2 -0.6 11.0 11.28 10.6 9.6 -1.0 12.0 12.23 7.8 8.0 0.2 11.8 12.19 10.7 10.0 -0.6 10.1 10.27 9.6 9.9 0.3 9.1 9.25 11.7 11.0 -0.6 11.2 11.32 11.4 10.8 -0.5 10.5 10.75 8.4 8.4 0.0 10.5 10.85 8.7 8.2 -0.5 9.0 9.07 0.0 13.3 12.7 -0.4 11.6 11.82 0.2 11.1 10.8 -0.2 10.9 10.91 0.0 14.2 14.9 0.9 10.6 10.77 0.2 7.7 7.7 0.0 10.3 10.96 0.6 9 8.8 -0.2 9.3 9.47 0.2 Comment: A number of samples, 7, were removed from the data set because they showed moredifferences more than 3 times the standard deviation. It was pointed out to GrainCorpthat there were several inconsistencies in the data, such as the reference data was outof order and where all 3 NIT analysers predicted the samples similarly but the referencevalues were widely different. These samples will be re analysed to see if recording errorsor laboratory errors caused these very large differences. Discussion: The above data provides a good demonstration of the validity of the calibration modelsused for measuring barley using the CropScan 1000B Whole Grain Analyser. The spectrafor the barley samples will be added to the calibration set in order to make thecalibrations more robust in the future.
确定
还剩4页未读,是否继续阅读?

产品配置单
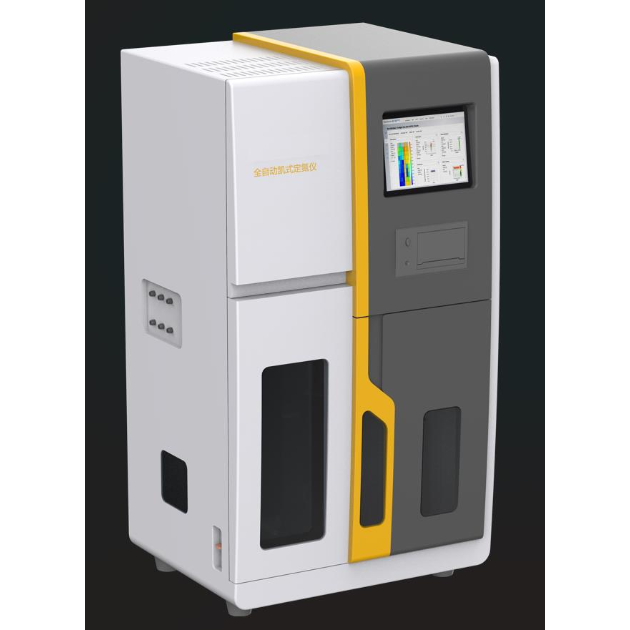
北京天翔飞域科技有限公司为您提供《大麦整谷解决方案》,该方案主要用于其他粮食加工品中营养成分检测,参考标准--,《大麦整谷解决方案》用到的仪器有德国OMNILAB半自动凯氏定氮仪、CropScan 1000B 近红外整谷分析仪、全自动凯氏定氮仪
推荐专场
定氮仪、凯氏定氮仪、Dumas定氮仪
更多


相关方案
更多
该厂商其他方案
更多