


方案详情
文
美味的食品,色、香、味缺一不可,而好的口感是美味中的重要一个元素。奶酪制造过程中,怎样保持好的口感,怎样才能做出美味的奶酪?
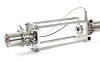
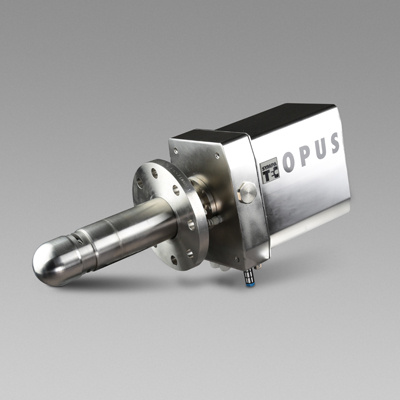
奶酪等乳制品在发酵工程中会产生很多大小不一的颗粒,如何控制?如何检测?通过SEQUIP在线粒度仪,德国Hohenheim大学的专家告诉您。
方案详情

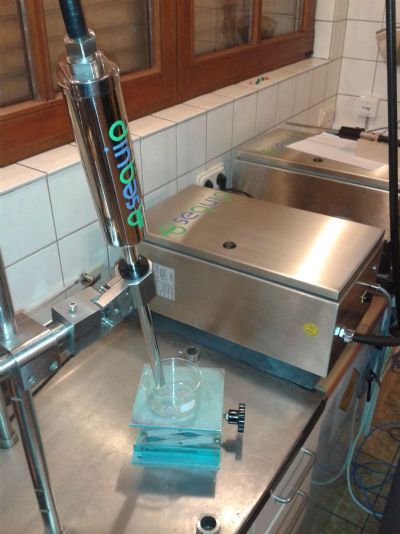
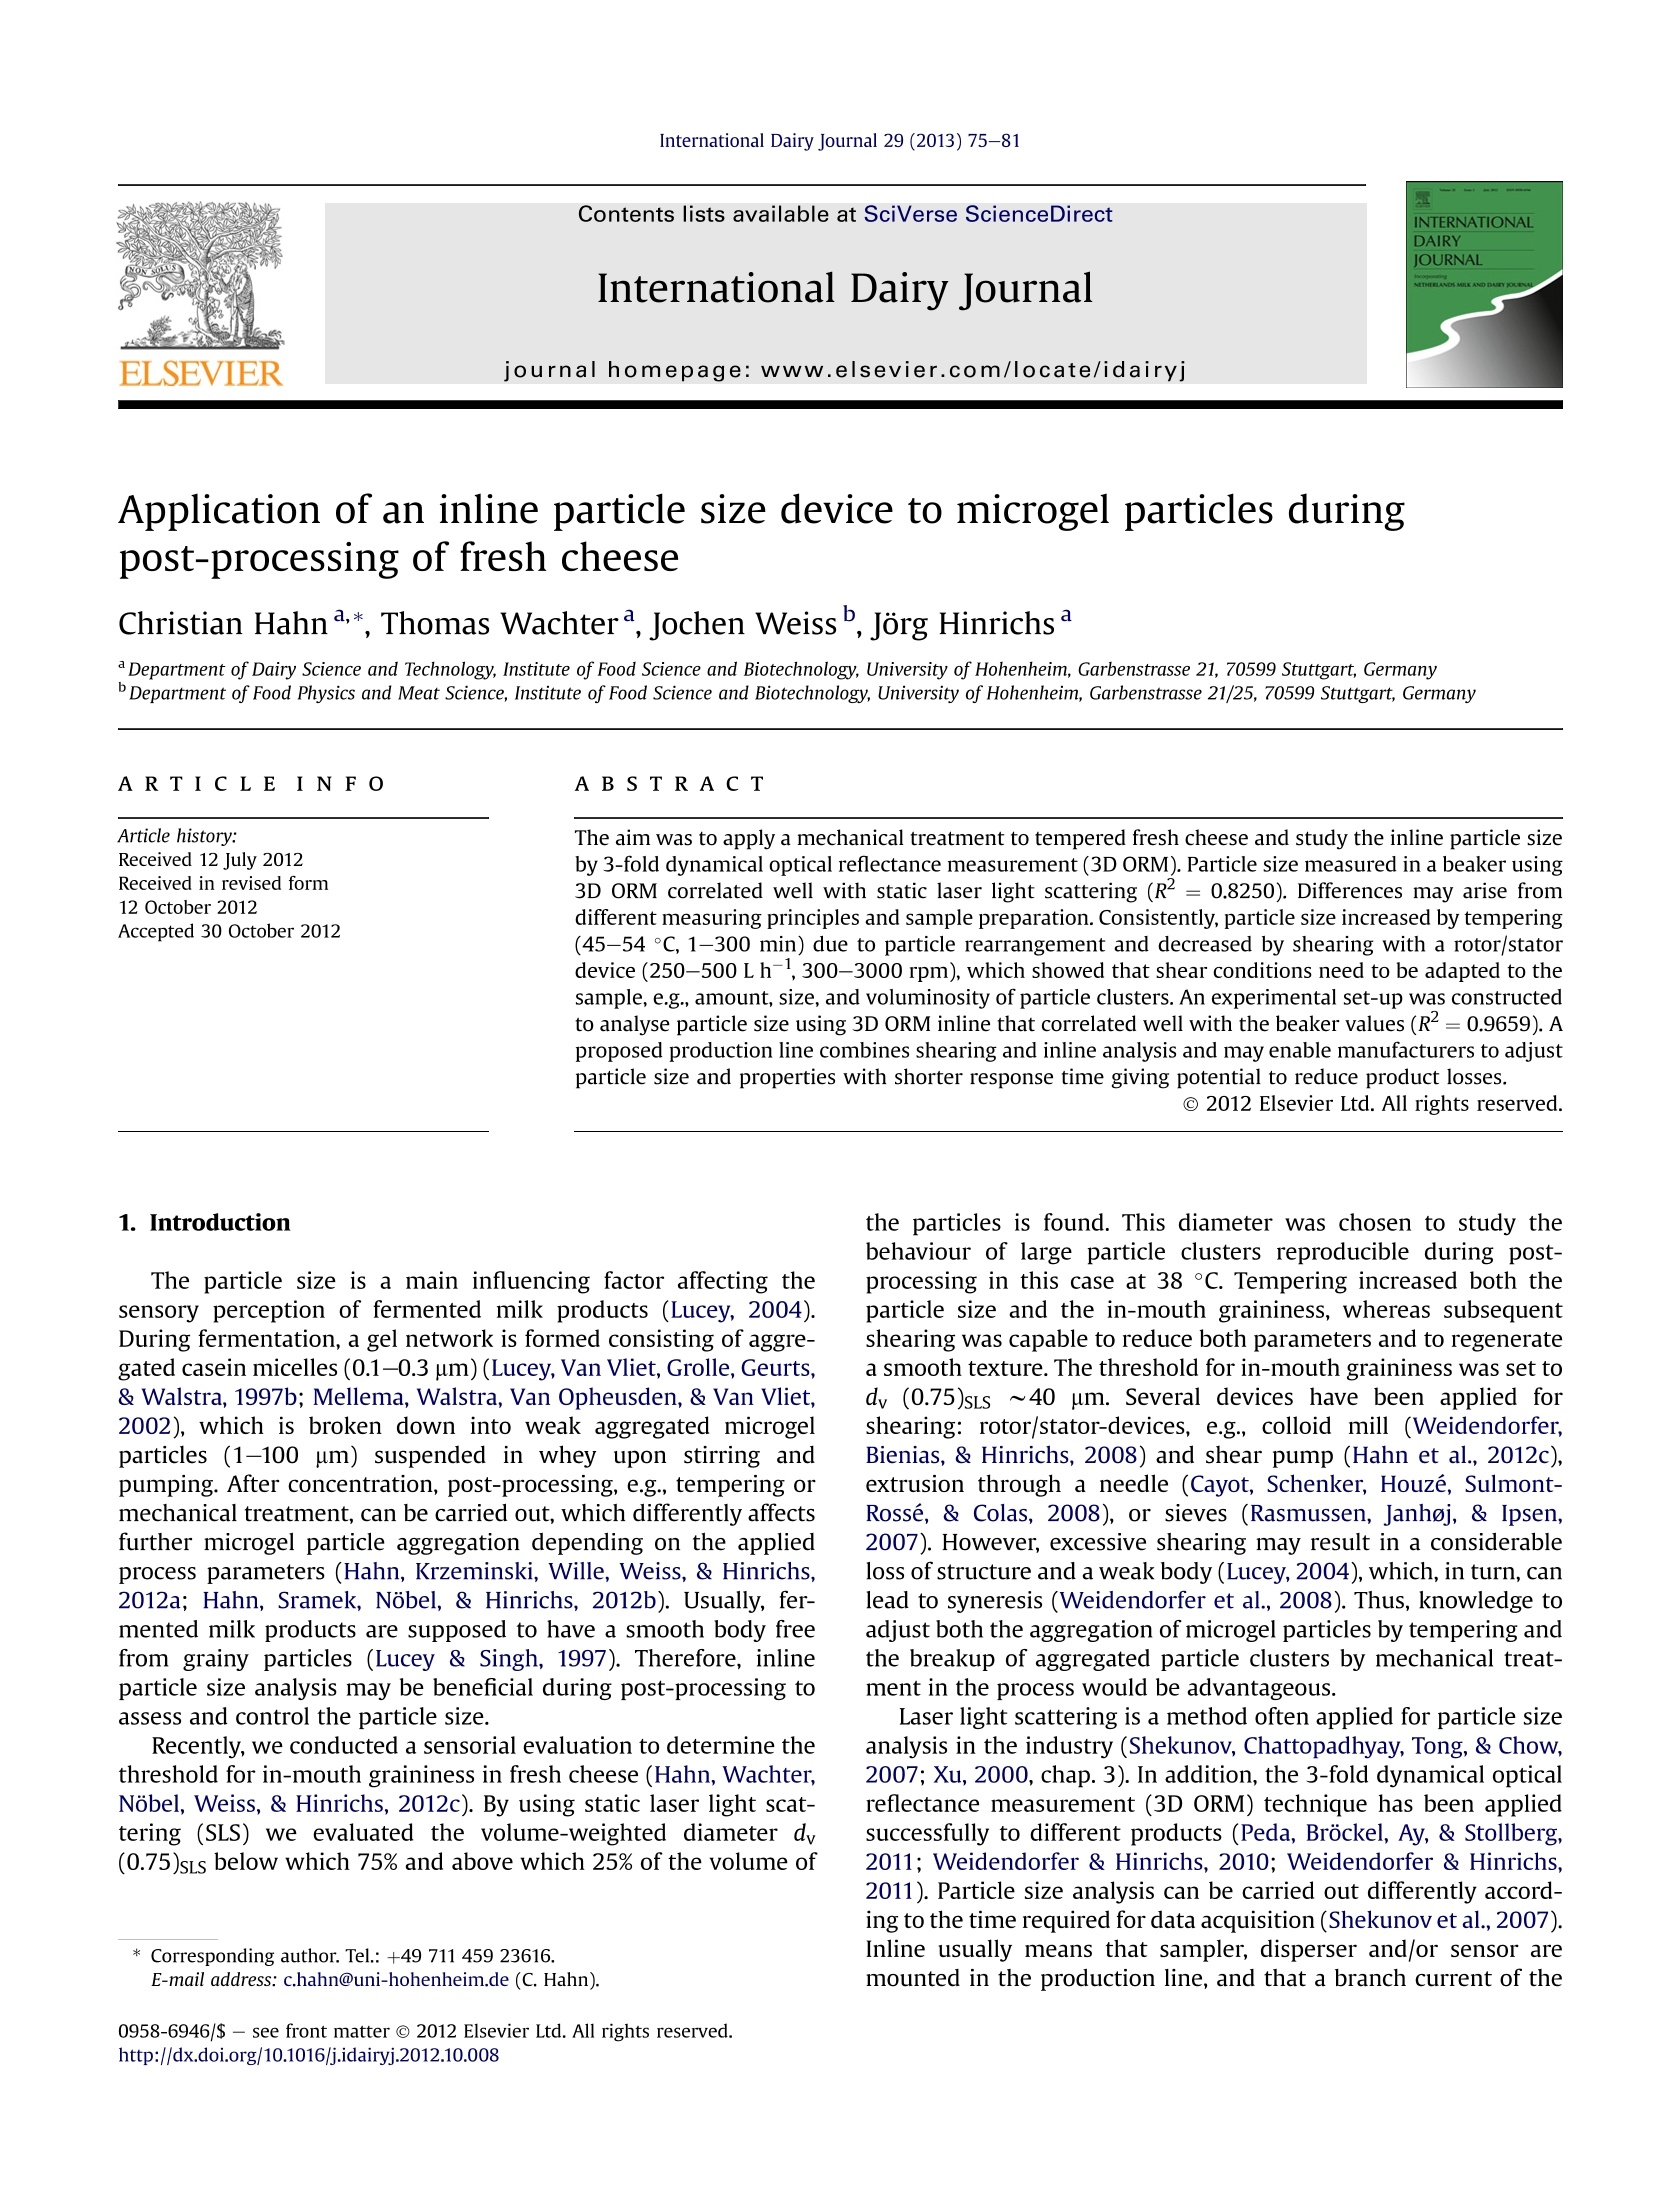
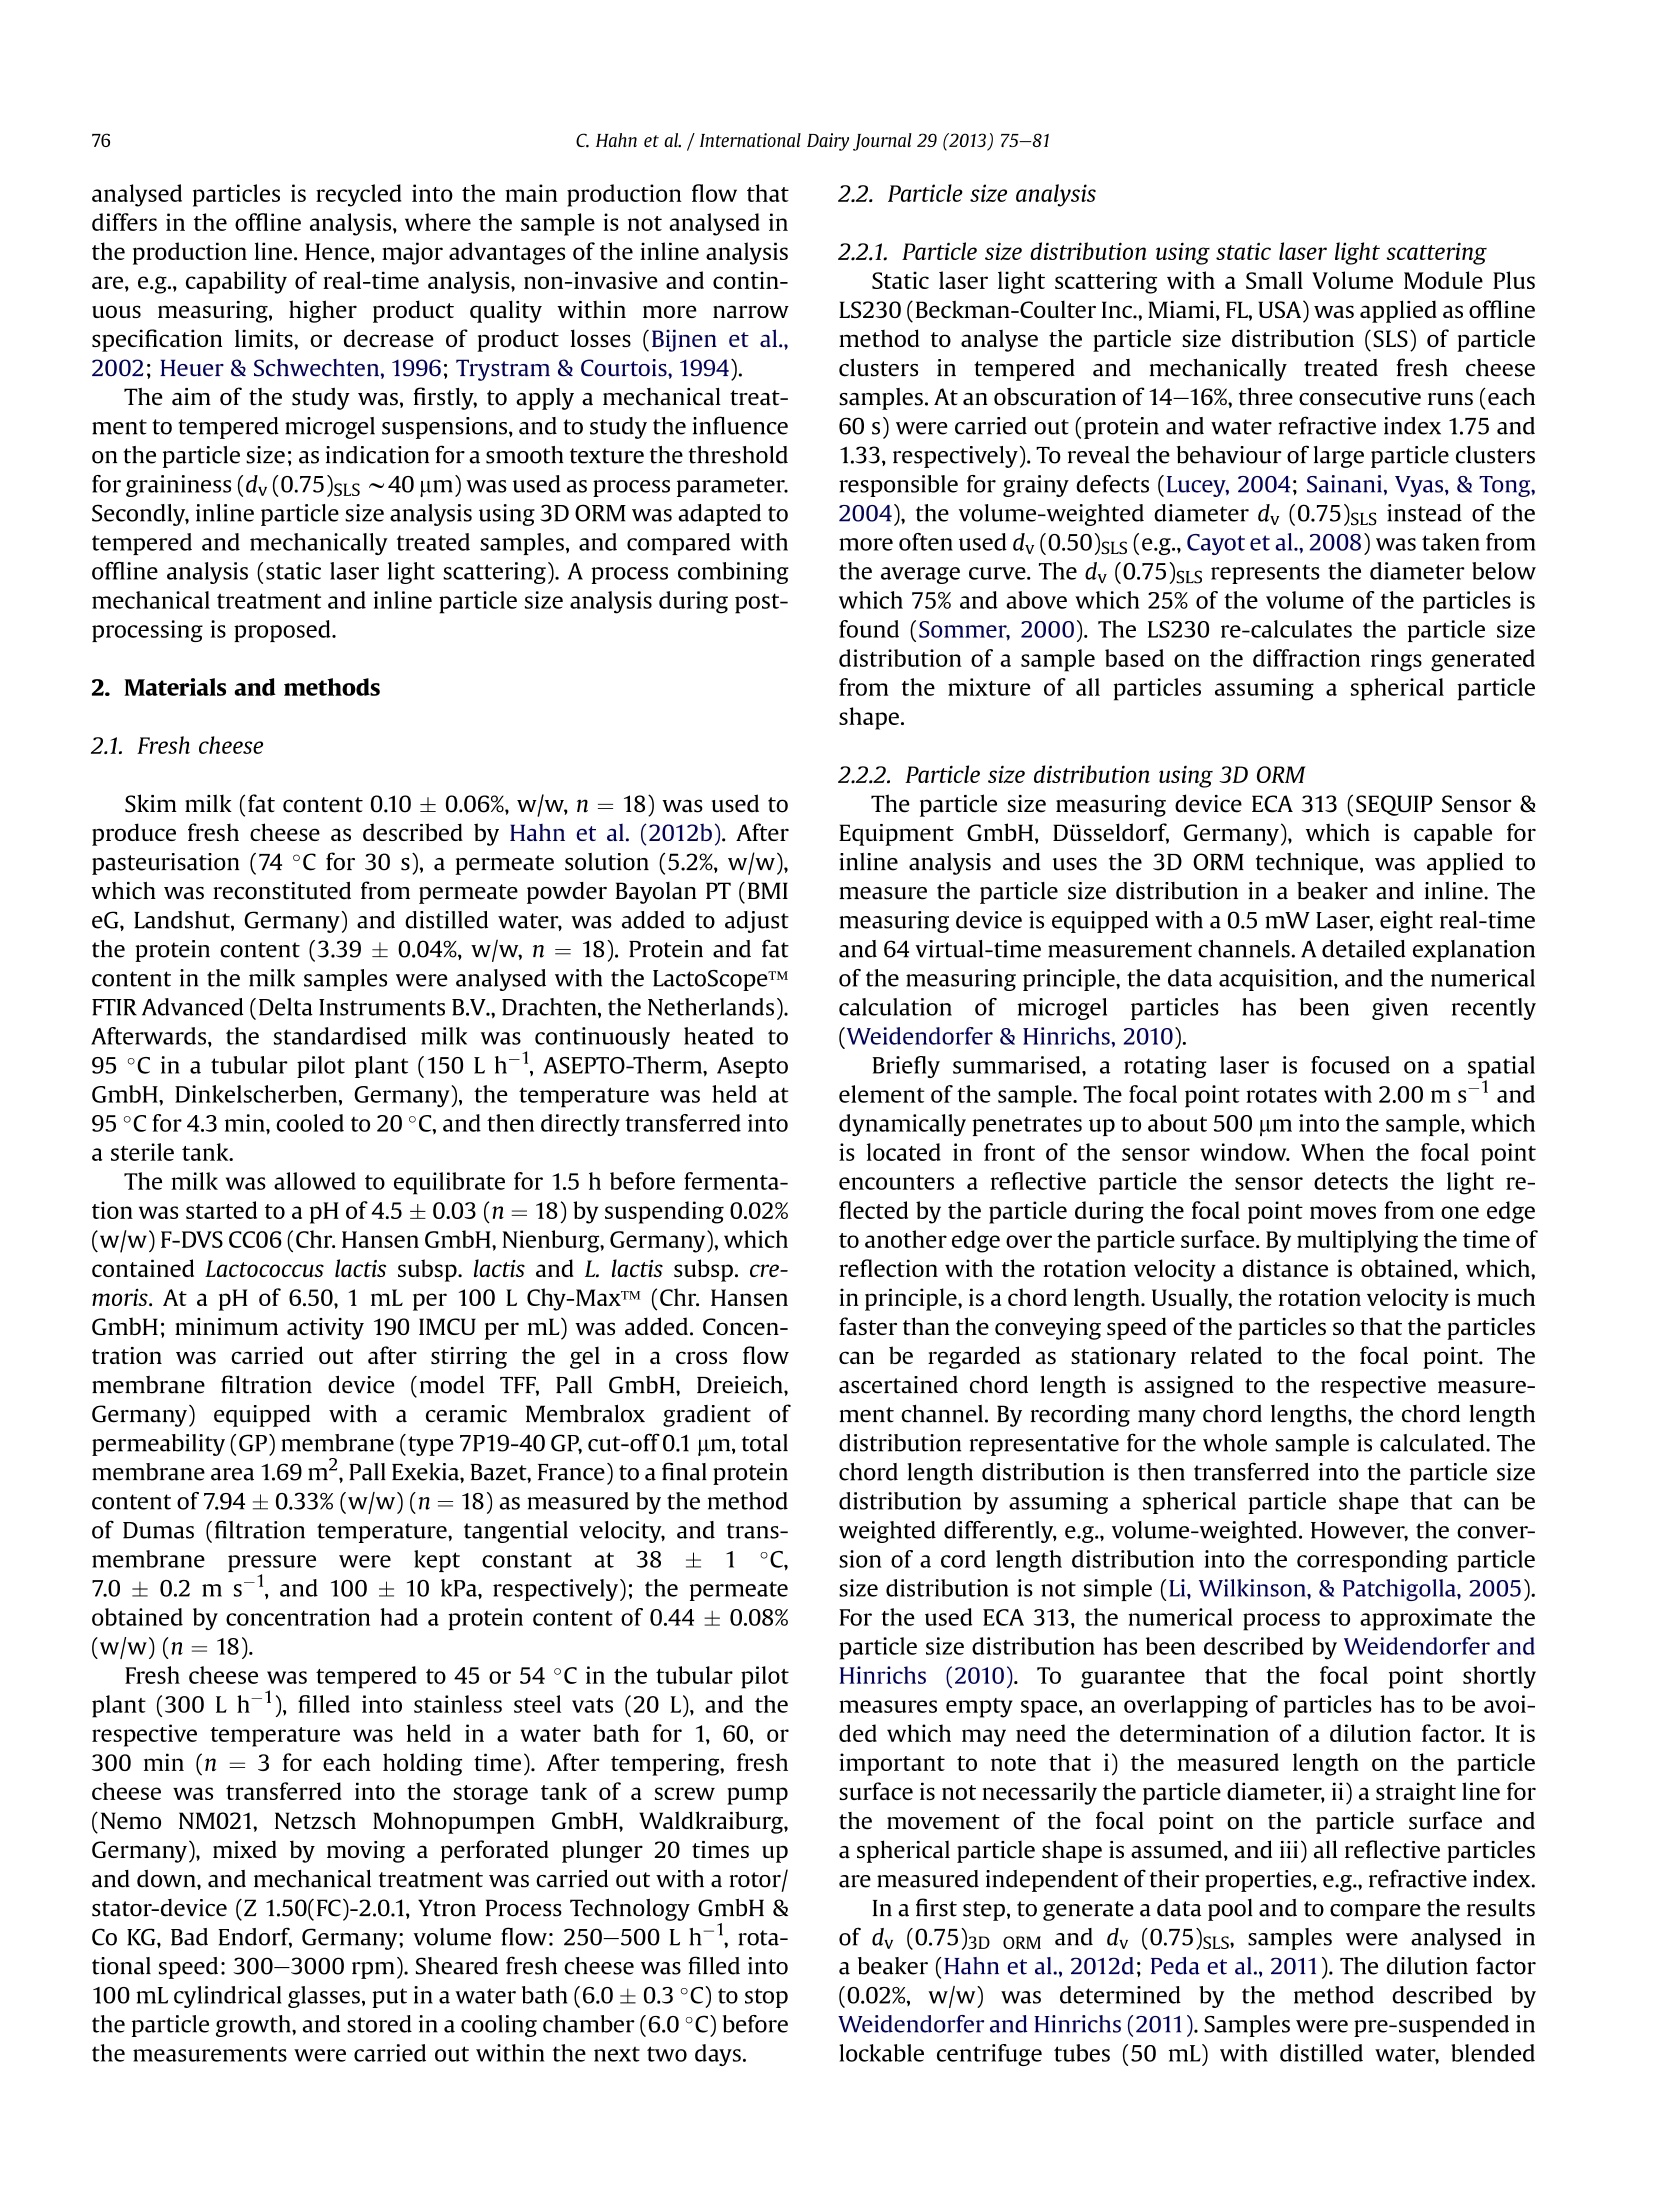
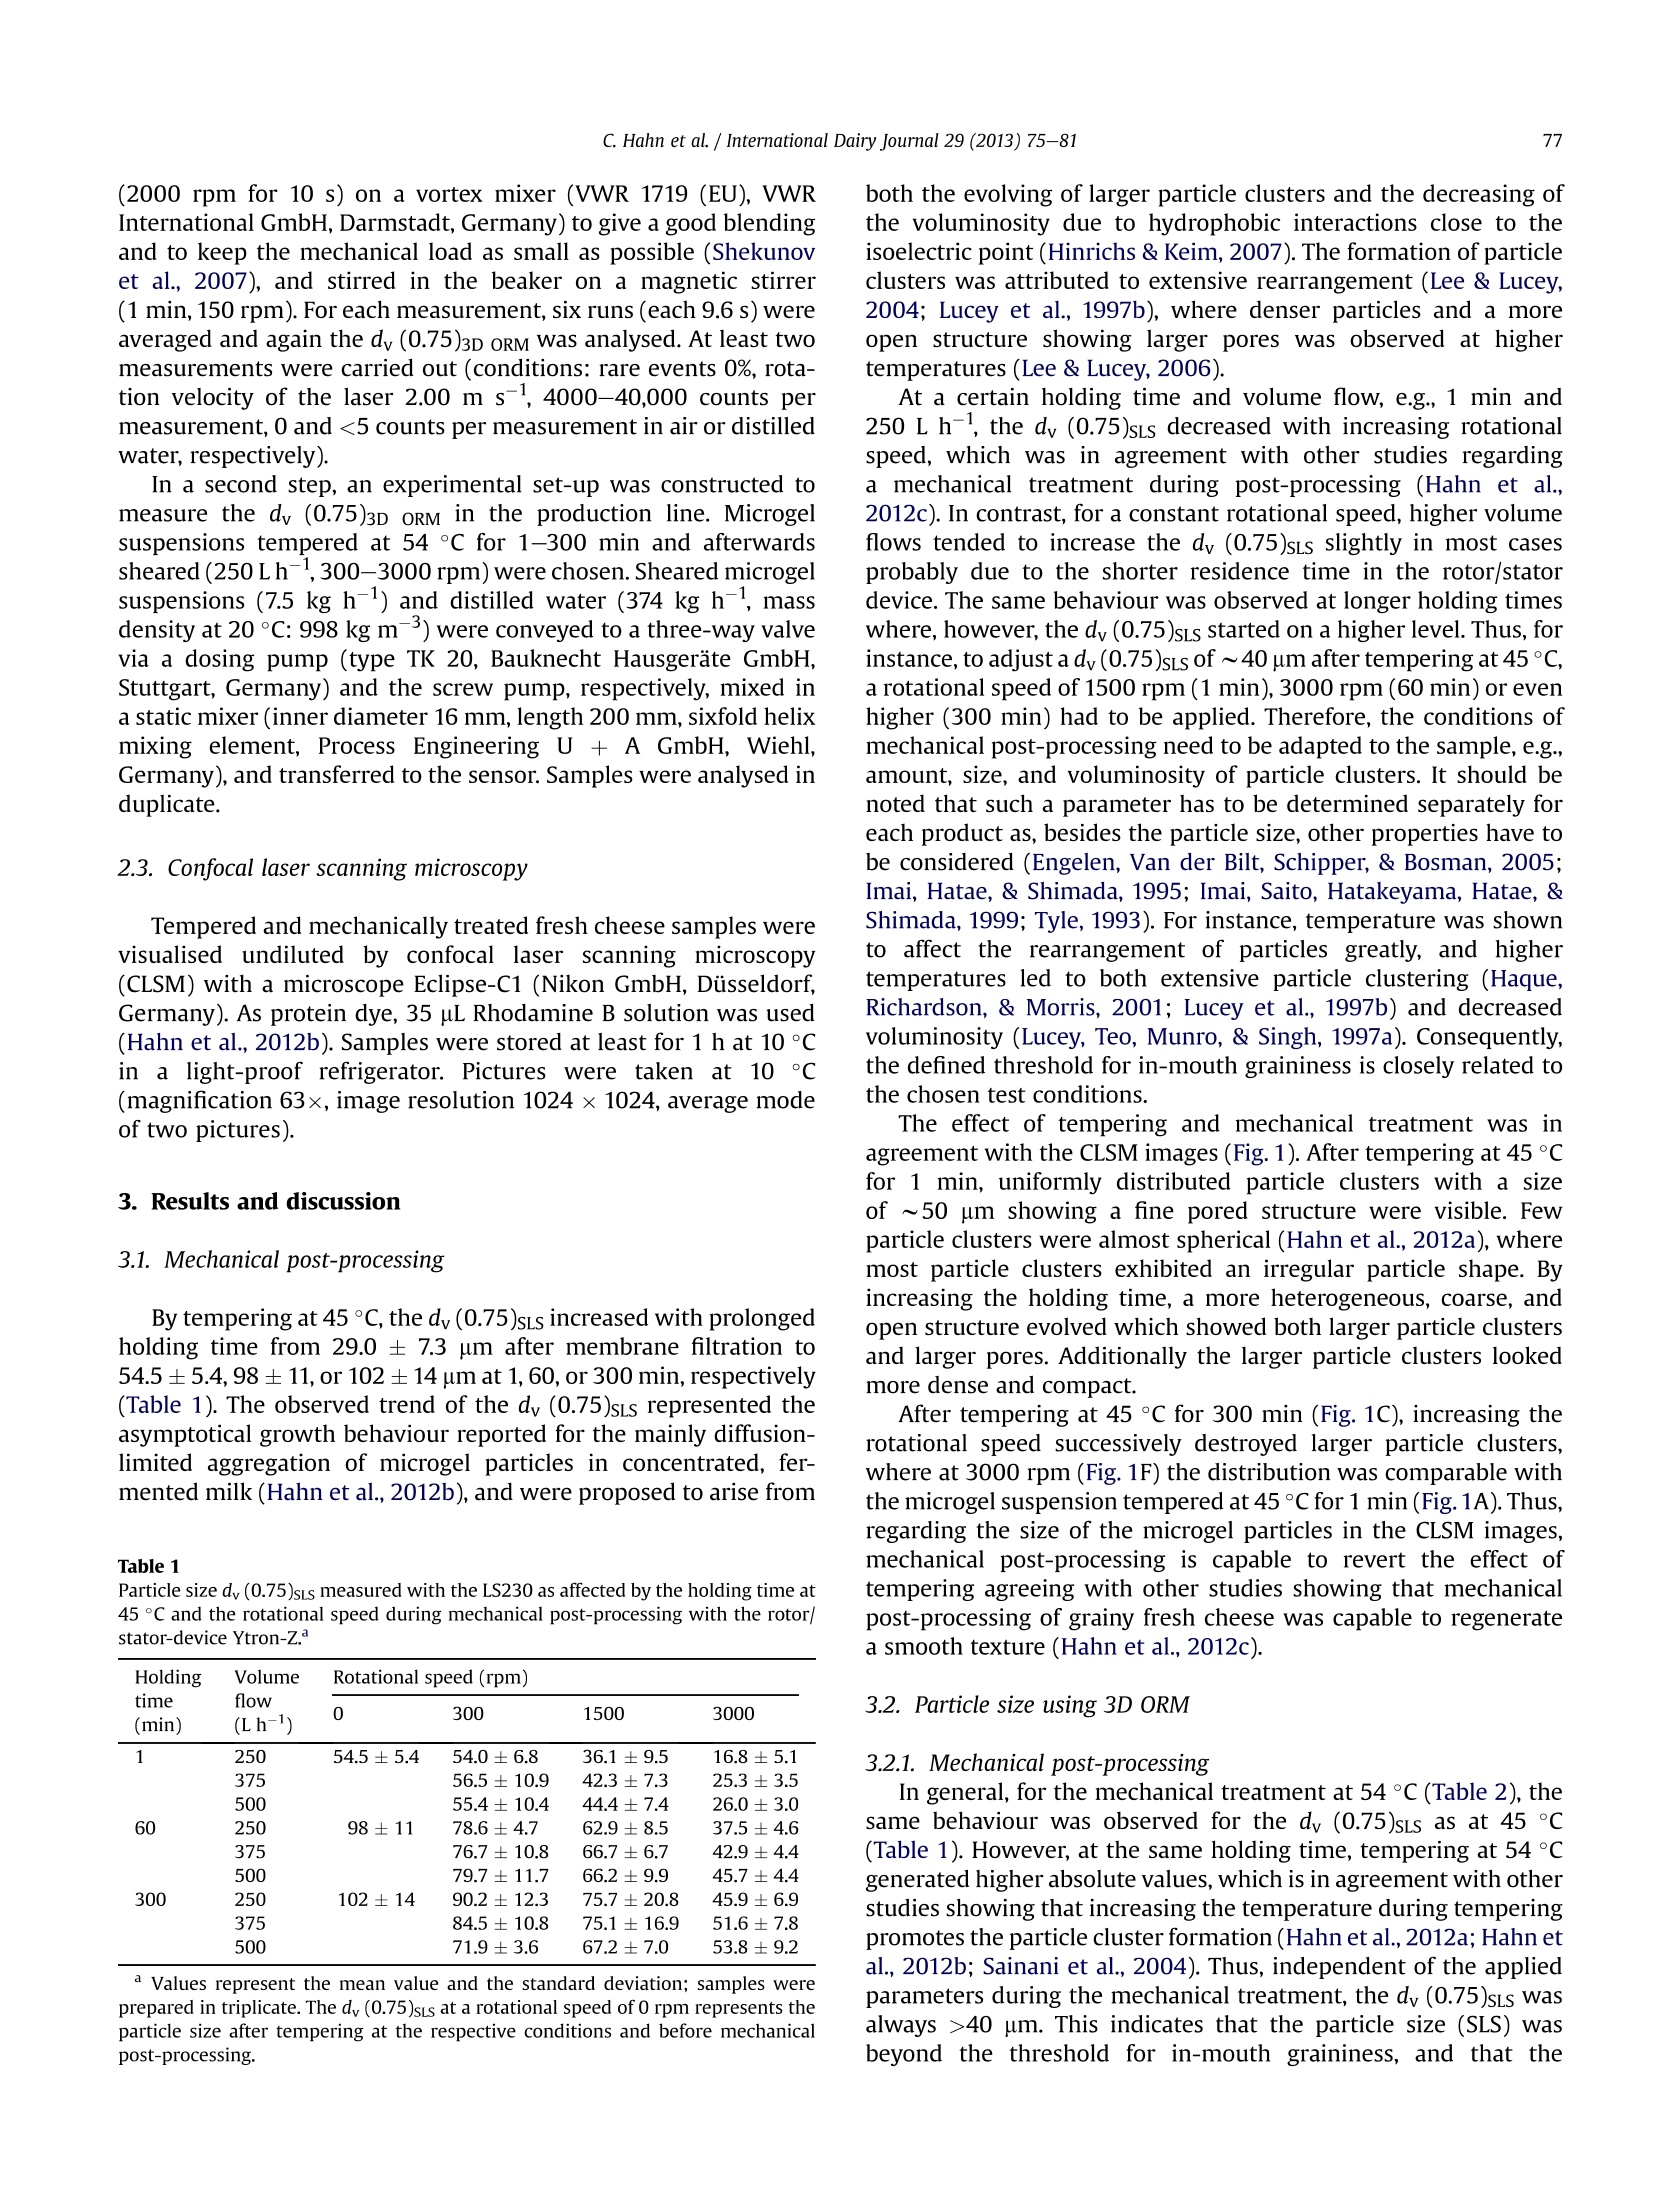
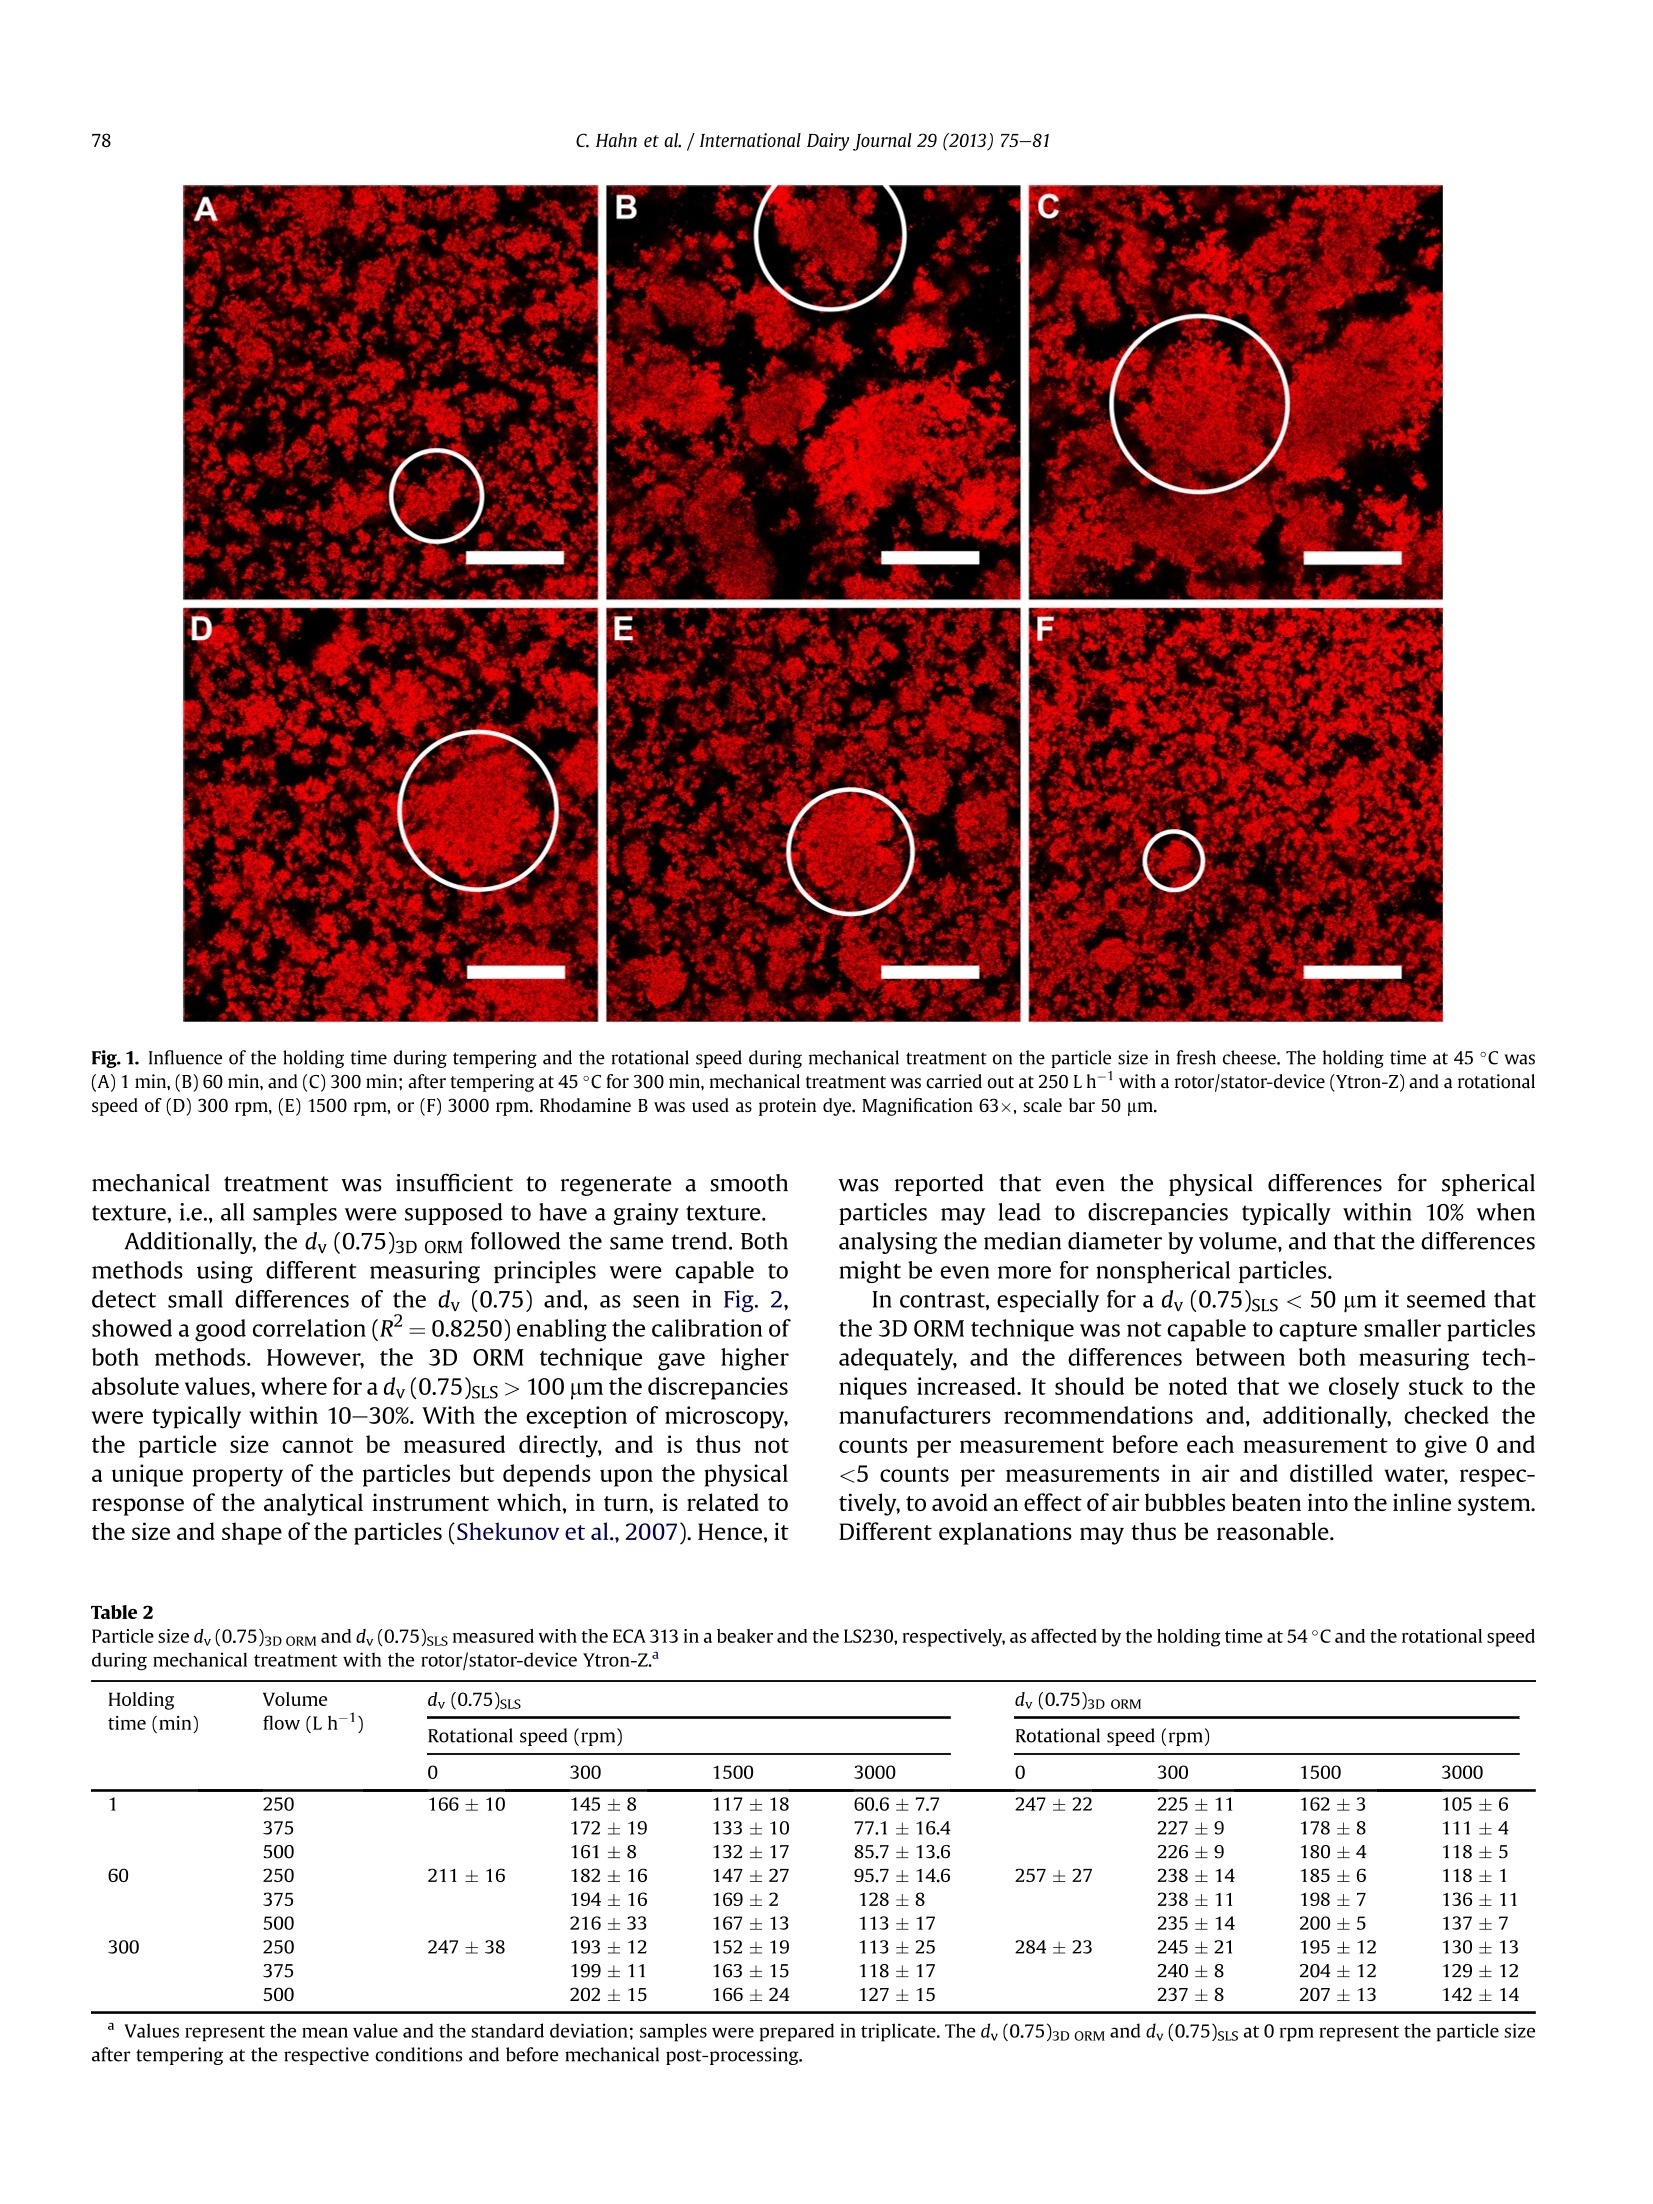
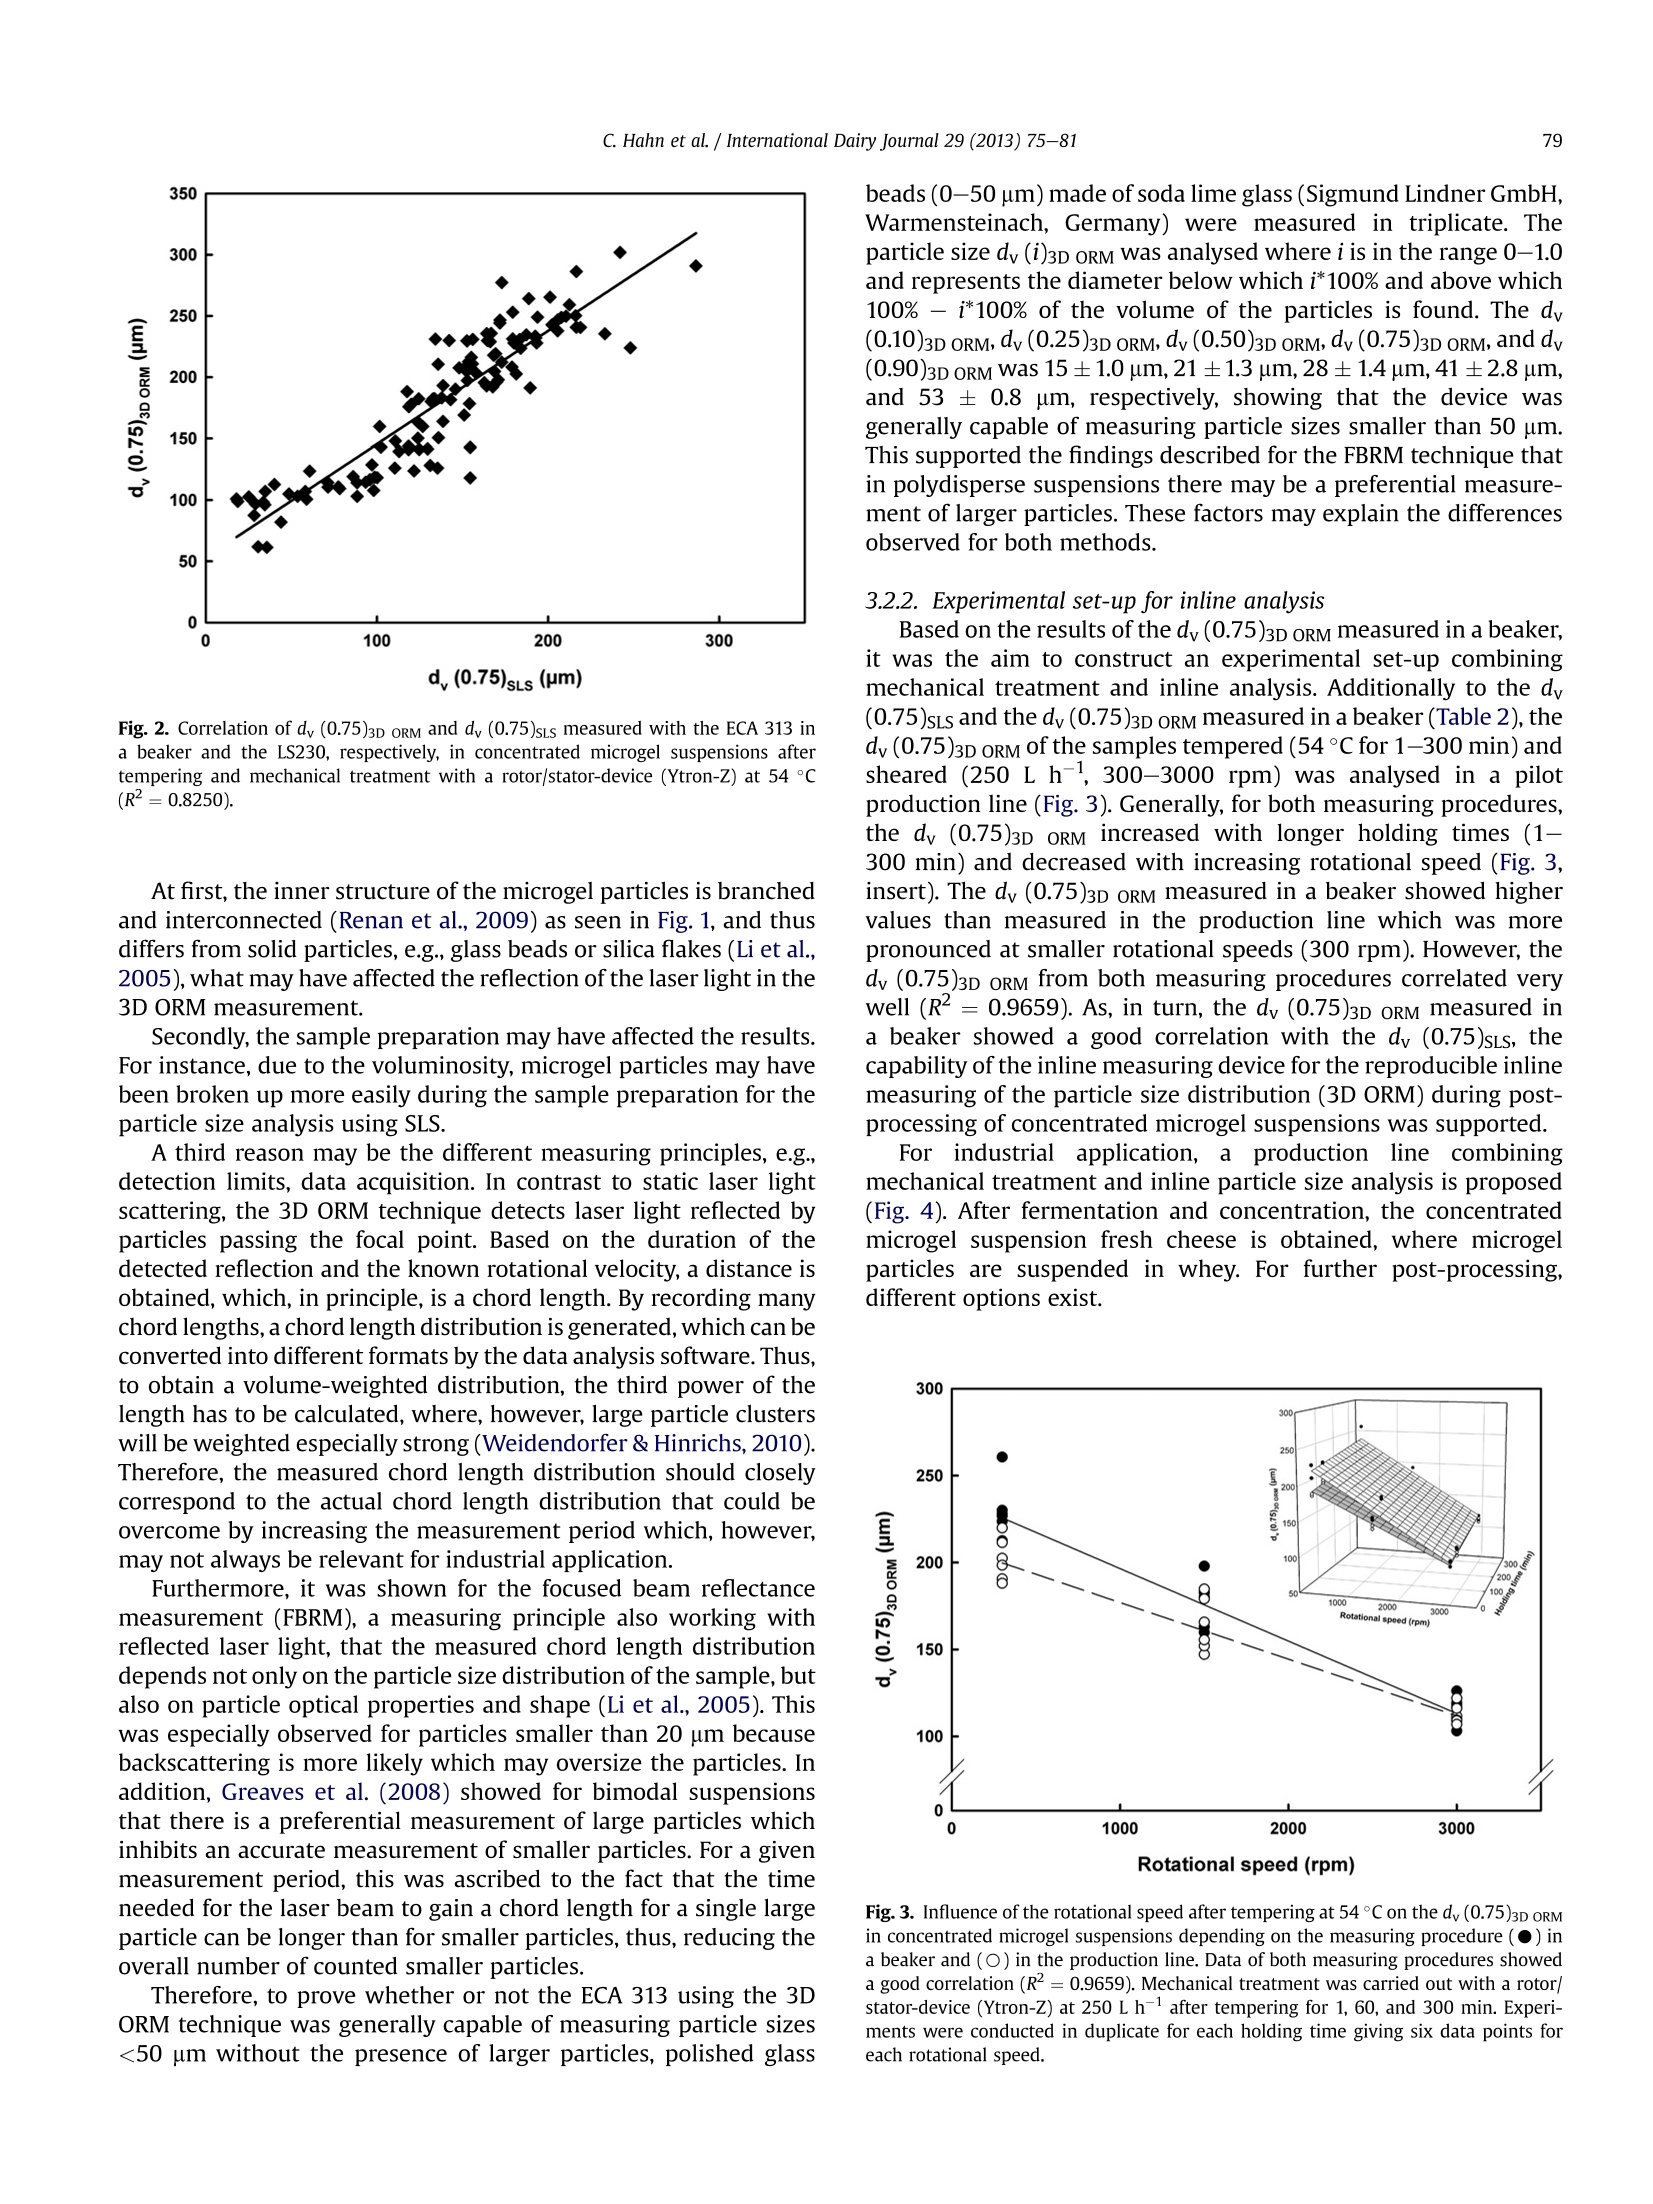
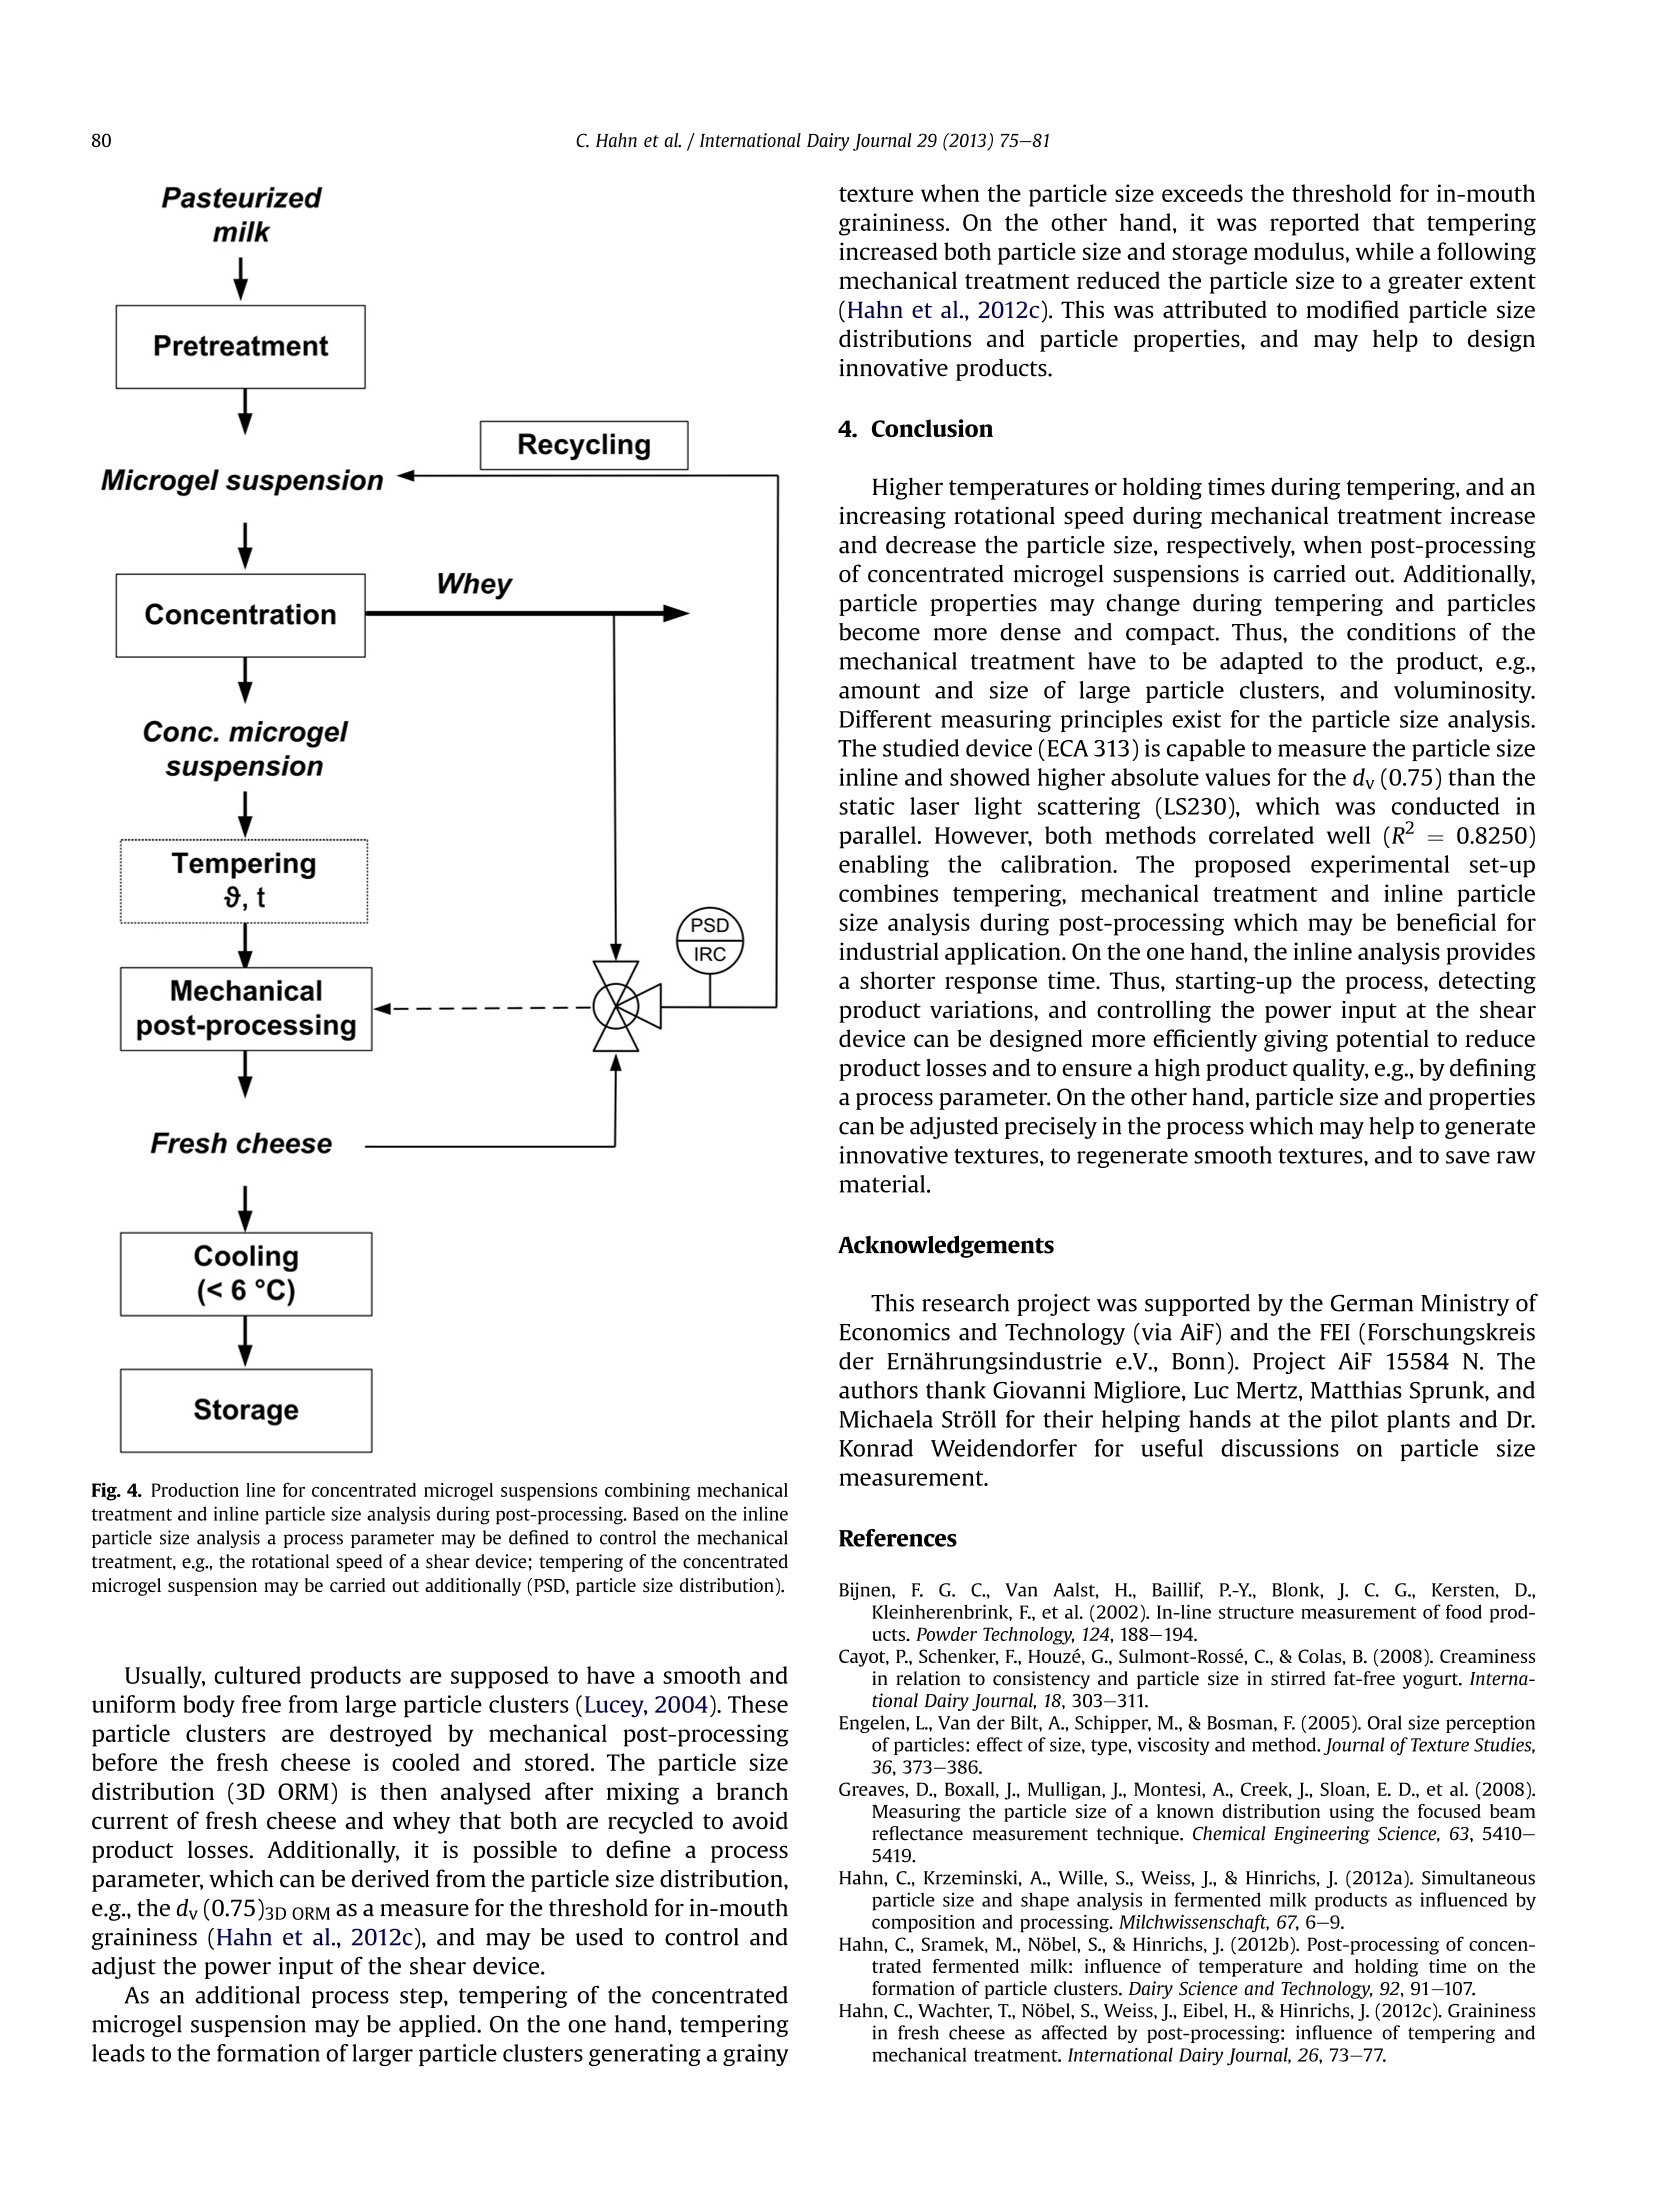
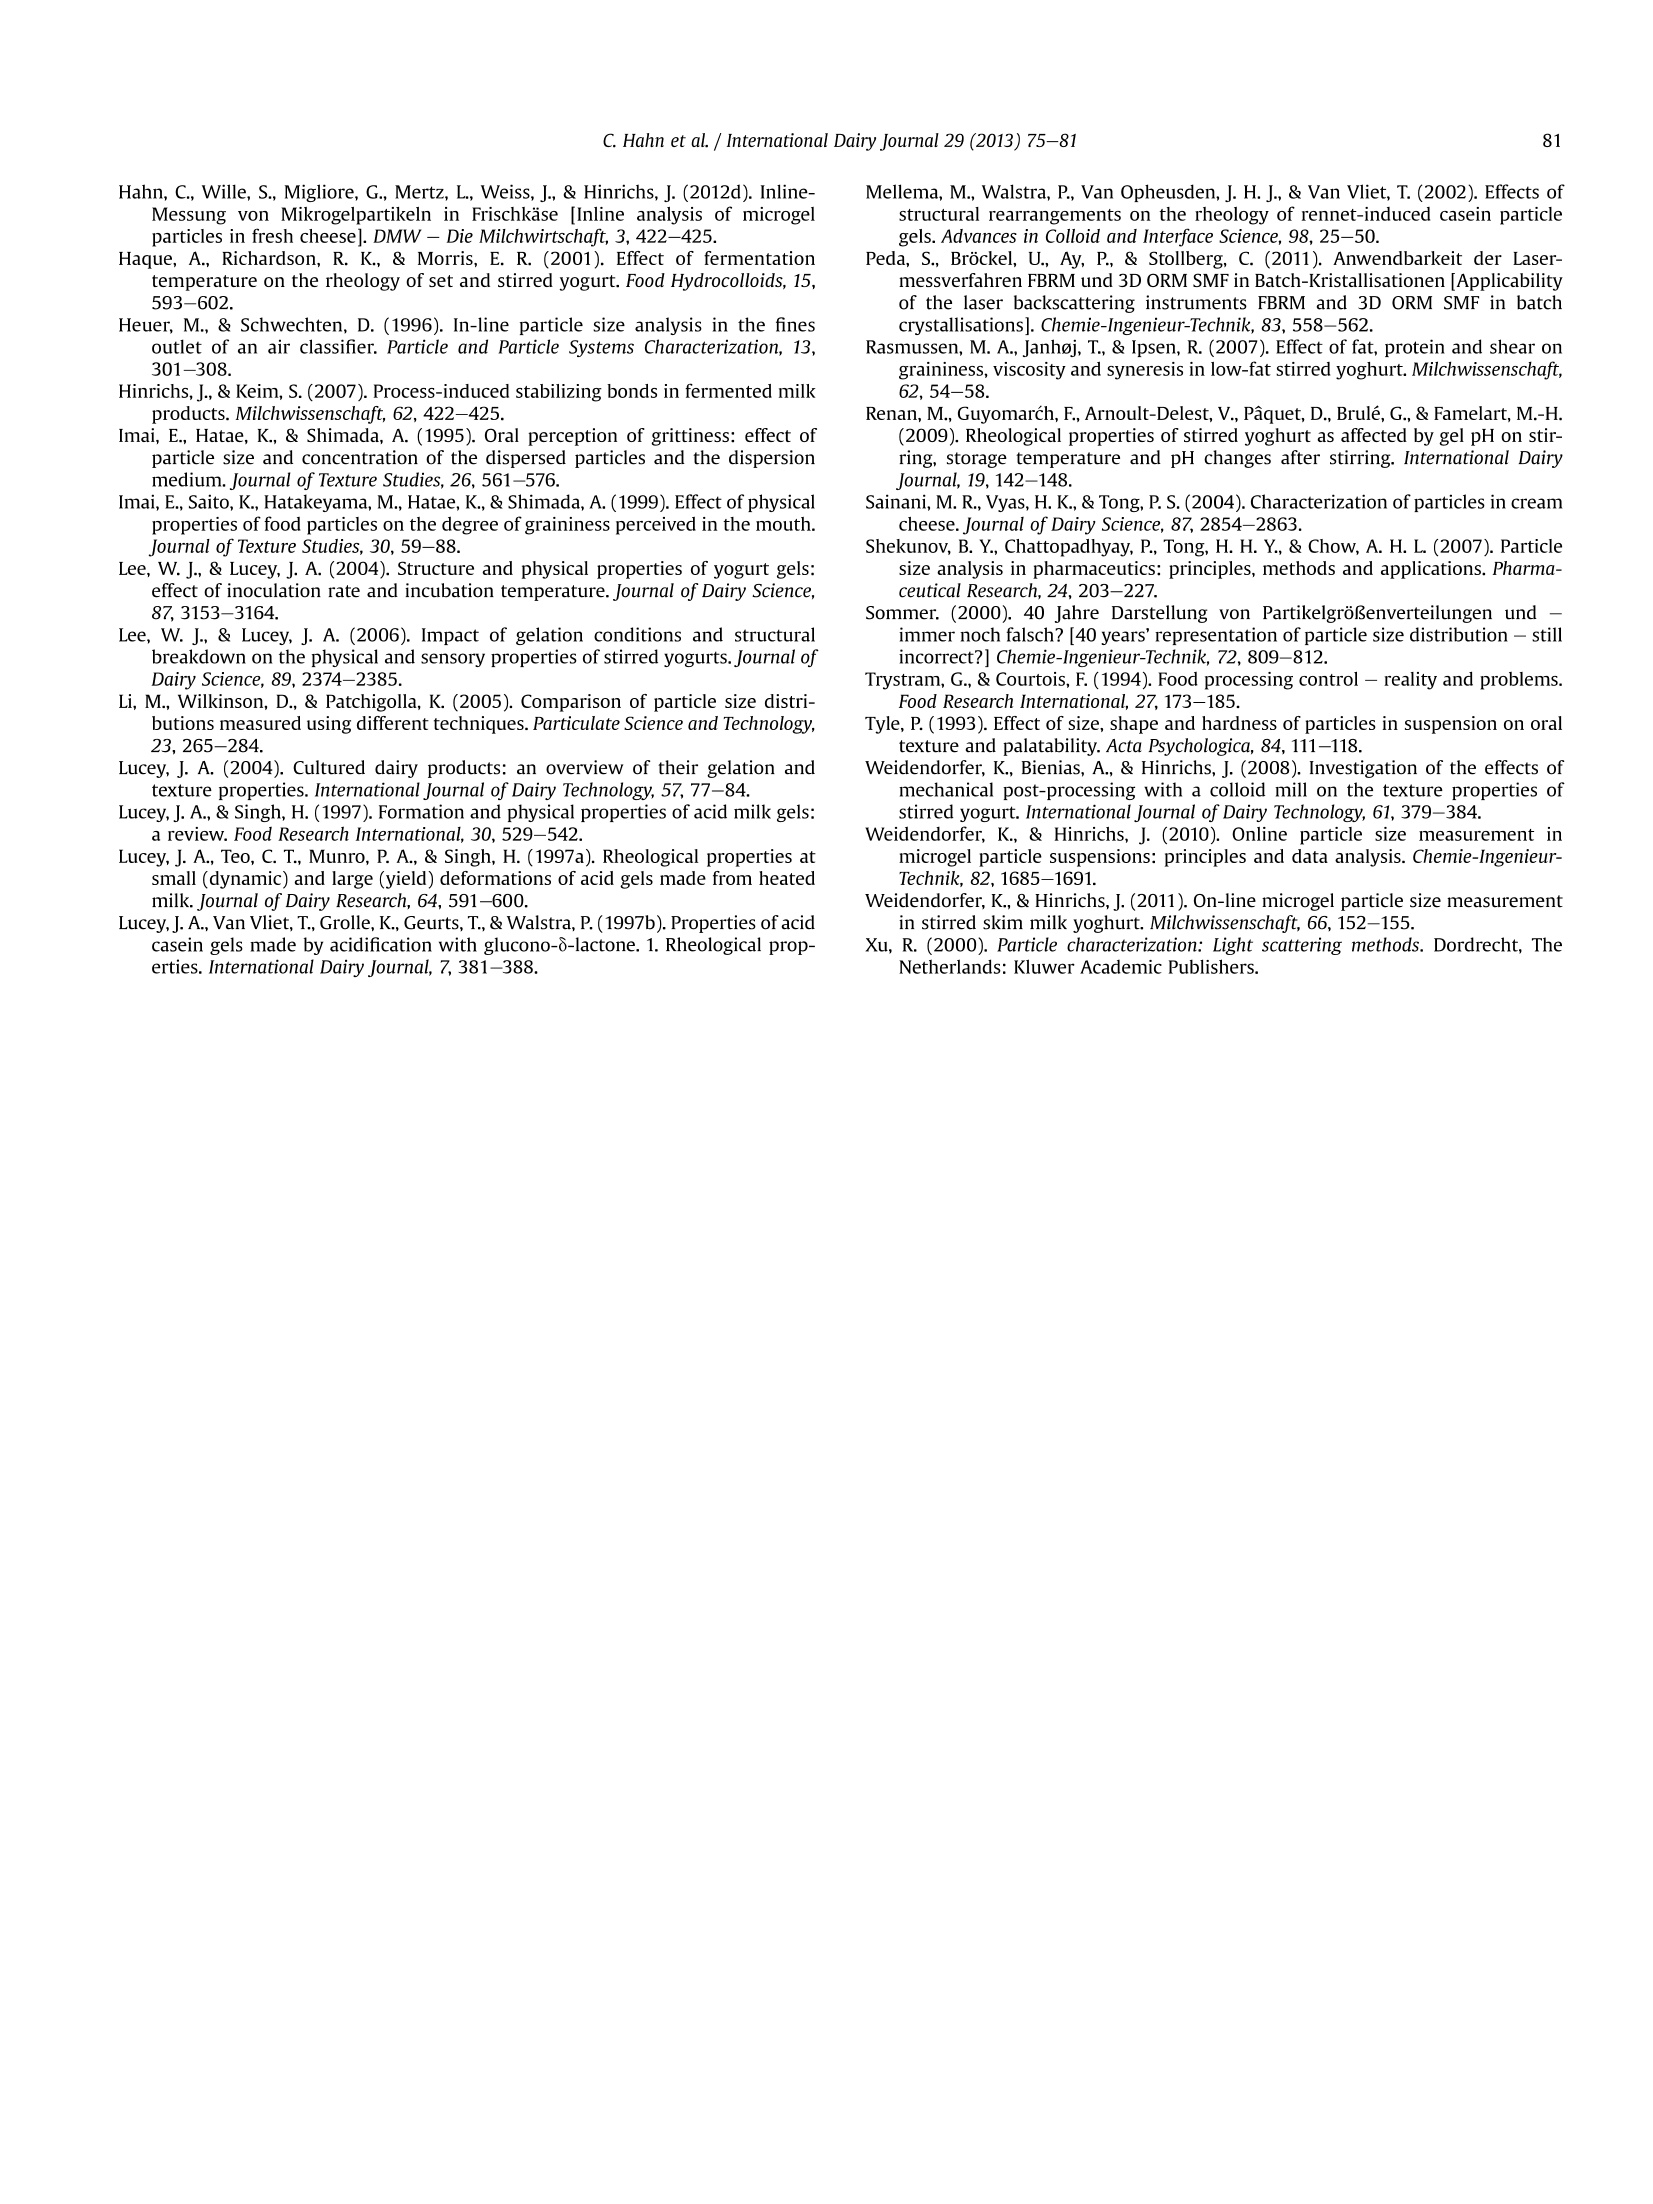
International Dairy Journal 29 (2013) 75-81 76C. Hahn et al./International Dairy Journal 29 (2013)75-81 0958-6946/$ - see front matter @ 2012 Elsevier Ltd. All rights reserved.http://dx.doi.org/10.1016/j.idairyj.2012.10.008 Contents lists available at SciVerse ScienceDirect International Dairy Journal ELSEVIER journal homepage: www.elsevier.com/locate/id airyj Application of an inline particle size device to microgel particles duringpost-processing of fresh cheese Christian Hahna*, Thomas Wachter , Jochen Weiss , Jorg Hinrichsa Department of Dairy Science and Technology, Institute of Food Science and Biotechnology, University of Hohenheim, Garbenstrasse 21, 70599 Stuttgart, Germany Department of Food Physics and Meat Science, Institute of Food Science and Biotechnology,University of Hohenheim, Garbenstrasse 21/25, 70599 Stuttgart, Germany ARTICLEINFO ABSTRACT Article history:Received 12 July 2012Received in revised form12 October 2012Accepted 30 October 2012 The aim was to apply a mechanical treatment to tempered fresh cheese and study the inline particle sizeby 3-fold dynamical optical reflectance measurement (3D ORM). Particle size measured in a beaker using3D ORM correlated well with static laser light scattering (R²= 0.8250). Differences may arise fromdifferent measuring principles and sample preparation.Consistently, particle size increased by tempering(45-54°C,1-300 min) due to particle rearrangement and decreased by shearing with a rotor/statordevice (250-500L h-, 300-3000 rpm), which showed that shear conditions need to be adapted to thesample,e.g., amount, size, and voluminosity of particle clusters. An experimental set-up was constructedto analyse particle size using 3D ORM inline that correlated well with the beaker values (R²=0.9659).Aproposed production line combines shearing and inline analysis and may enable manufacturers to adjustparticle size and properties with shorter response time giving potential to reduce product losses. ◎ 2012 Elsevier Ltd. All rights reserved. 1. Introduction The particle size is a main influencing factor affecting thesensory perception of fermented milk products (Lucey, 2004).During fermentation, a gel network is formed consisting of aggre-gated casein micelles (0.1-0.3 um)(Lucey,Van Vliet, Grolle, Geurts,& Walstra, 1997b; Mellema, Walstra, Van Opheusden, & Van Vliet,2002), which is broken down into weak aggregated microgelparticles (1-100 um) suspended in whey upon stirring andpumping. After concentration, post-processing, e.g., tempering ormechanical treatment, can be carried out, which differently affectsfurther microgel particle aggregation depending on the appliedprocess parameters (Hahn, Krzeminski, Wille, Weiss, & Hinrichs,2012a; Hahn, Sramek, Nobel, & Hinrichs, 2012b). Usually, fer-mented milk products are supposed to have a smooth body freefrom grainy particles (Lucey & Singh, 1997). Therefore, inlineparticle size analysis may be beneficial during post-processing toassess and control the particle size. Recently, we conducted a sensorial evaluation to determine thethreshold for in-mouth graininess in fresh cheese (Hahn, Wachter,Nobel, Weiss, & Hinrichs,2012c). By using static laser light scat-tering (SLS) we evaluated the volume-weighted diameter dy(0.75)sus below which 75% and above which 25% of the volume of ( * Corresponding author. Tel. : +49 711 459 23616. ) ( E-mail address:c. h a hn @uni-hohenheim.de ( C . Hahn). ) the particles is found. This diameter was chosen to study thebehaviour of large particle clusters reproducible during post-processing in this case at 38 °C. Tempering increased both theparticle size and the in-mouth graininess, whereas subsequentshearing was capable to reduce both parameters and to regeneratea smooth texture. The threshold for in-mouth graininess was set todv (0.75)sLs~40 um. Several devices have been applied forshearing: rotor/stator-devices, e.g., colloid mill (Weidendorfer,Bienias, & Hinrichs, 2008) and shear pump (Hahn et al., 2012c),extrusion through a needle (Cayot, Schenker, Houze, Sulmont-Rosse, & Colas, 2008), or sieves (Rasmussen, Janhoj, & Ipsen,2007). However, excessive shearing may result in a considerableloss of structure and a weak body (Lucey, 2004), which, in turn, canlead to syneresis (Weidendorfer et al., 2008). Thus, knowledge toadjust both the aggregation of microgel particles by tempering andthe breakup of aggregated particle clusters by mechanical treat-ment in the process would be advantageous. Laser light scattering is a method often applied for particle sizeanalysis in the industry (Shekunov, Chattopadhyay, Tong,& Chow,2007; Xu, 2000, chap. 3). In addition, the 3-fold dynamical opticalreflectance measurement (3D ORM) technique has been appliedsuccessfully to different products (Peda, Brockel, Ay, & Stollberg,2011;Weidendorfer & Hinrichs, 2010; Weidendorfer & Hinrichs,2011). Particle size analysis can be carried out differently accord-ing to the time required for data acquisition (Shekunov et al.,2007).Inline usually means that sampler, disperser and/or sensor aremounted in the production line, and that a branch current of the analysed particles is recycled into the main production flow thatdiffers in the offline analysis, where the sample is not analysed inthe production line. Hence, major advantages of the inline analysisare, e.g., capability of real-time analysis, non-invasive and contin-uous measuring, higher product quality within more narrowspecification limits, or decrease of product losses (Bijnen et al.,2002; Heuer & Schwechten, 1996; Trystram & Courtois, 1994). The aim of the study was, firstly, to apply a mechanical treat-ment to tempered microgel suspensions, and to study the influenceon the particle size; as indication for a smooth texture the thresholdfor graininess(dv(0.75)sLs ~40 pm) was used as process parameter.Secondly, inline particle size analysis using 3D ORM was adapted totempered and mechanically treated samples, and compared withoffline analysis (static laser light scattering). A process combiningmechanical treatment and inline particle size analysis during post-processing is proposed. 2. Materials and methods 2.1. Fresh cheese Skim milk (fat content 0.10 ±0.06%, w/w, n= 18) was used toproduce fresh cheese as described by Hahn et al.(2012b). Afterpasteurisation (74 °C for 30 s), a permeate solution (5.2%, w/w),which was reconstituted from permeate powder Bayolan PT (BMIeG, Landshut, Germany) and distilled water, was added to adjustthe protein content (3.39±0.04%, w/w, n = 18). Protein and fatcontent in the milk samples were analysed with the LactoScopeTMFTIR Advanced (Delta Instruments B.V.,Drachten, the Netherlands).Afterwards, the standardised milk was continuously heated to95 C in a tubular pilot plant (150 L h-,ASEPTO-Therm, AseptoGmbH, Dinkelscherben, Germany), the temperature was held at95°C for 4.3 min, cooled to 20°C, and then directly transferred intoa sterile tank. The milk was allowed to equilibrate for 1.5 h before fermenta-tion was started to a pH of 4.5±0.03(n=18) by suspending 0.02%(w/w) F-DVS CC06(Chr. Hansen GmbH, Nienburg,Germany), whichcontained Lactococcus lactis subsp. lactis and L. lactis subsp. cre-moris. At a pH of 6.50, 1 mL per 100 L Chy-MaxTM (Chr. HansenGmbH; minimum activity 190 IMCU per mL) was added. Concen-tration was carried out after stirring the gel in a cross flowmembrane filtration device (model TFF, Pall GmbH, Dreieich,Germany) equipped with a ceramic Membralox gradient ofpermeability (GP) membrane (type 7P19-40 GP, cut-off 0.1 um, totalmembrane area 1.69 m, Pall Exekia, Bazet, France) to a final proteincontent of 7.94±0.33%(w/w)(n=18) as measured by the methodof Dumas (filtration temperature, tangential velocity, and trans-membranepressure were kkept constantat38 17.0 ± 0.2 m s , and 100 ± 10 kPa, respectively); the permeateobtained by concentration had a protein content of 0.44±0.08%(w/w)(n=18). Fresh cheese was tempered to 45 or 54°C in the tubular pilotplant (300 L h-), filled into stainless steel vats (20 L), and therespective temperature was held in a water bath for 1, 60, or300 min (n = 3 for each holding time). After tempering, freshcheese was transferred into the storage tank of a screw pump(Nemo NM021, Netzsch Mohnopumpen GmbH, Waldkraiburg,Germany), mixed by moving a perforated plunger 20 times upand down, and mechanical treatment was carried out with a rotor/stator-device (Z 1.50(FC)-2.0.1, Ytron Process Technology GmbH &Co KG, Bad Endorf, Germany; volume flow: 250-500 L h-, rota-tional speed: 300-3000 rpm). Sheared fresh cheese was filled into100 mL cylindrical glasses, put in a water bath (6.0±0.3 °C) to stopthe particle growth, and stored in a cooling chamber(6.0°C) beforethe measurements were carried out within the next two days. 2.2.1. Particle size distribution using static laser light scattering Static laser light scattering with a Small Volume Module PlusLS230 (Beckman-Coulter Inc.,Miami,FL, USA) was applied as offlinemethod to analyse the particle size distribution (SLS) of particleclusters in tempered and mechanically treated fresh cheesesamples.At an obscuration of 14-16%, three consecutive runs (each60 s) were carried out (protein and water refractive index 1.75 and1.33, respectively). To reveal the behaviour of large particle clustersresponsible for grainy defects (Lucey, 2004; Sainani, Vyas, & Tong,2004), the volume-weighted diameter dv (0.75)sLs instead of themore often used dv (0.50)sus (e.g., Cayot et al., 2008) was taken fromthe average curve. The dv (0.75)sus represents the diameter belowwhich 75% and above which 25% of the volume of the particles isfound (Sommer, 2000). The LS230 re-calculates the particle sizedistribution of a sample based on the diffraction rings generatedfrom the mixture of all particles assuming a spherical particleshape. 2.2.2. Particle size distribution using 3D ORM The particle size measuring device ECA 313 (SEQUIP Sensor &Equipment GmbH, Diisseldorf, Germany), which is capable forinline analysis and uses the 3D ORM technique, was applied tomeasure the particle size distribution in a beaker and inline.Themeasuring device is equipped with a 0.5 mW Laser,eight real-timeand 64 virtual-time measurement channels. A detailed explanationof the measuring principle, the data acquisition, and the numericalcalculation of microgel particleshasbeenngiven recently(Weidendorfer & Hinrichs,2010). Briefly summarised, a rotating laser is focused on a spatialelement of the sample. The focal point rotates with 2.00 m s- anddynamically penetrates up to about 500 um into the sample, whichis located in front of the sensor window. When the focal pointencounters a reflective particle the sensor detects the light re-flected by the particle during the focal point moves from one edgeto another edge over the particle surface. By multiplying the time ofreflection with the rotation velocity a distance is obtained, which,in principle, is a chord length. Usually, the rotation velocity is muchfaster than the conveying speed of the particles so that the particlescan be regarded as stationary related to the focal point. Theascertained chord length is assigned to the respective measure-ment channel. By recording many chord lengths, the chord lengthdistribution representative for the whole sample is calculated. Thechord length distribution is then transferred into the particle sizedistribution by assuming a spherical particle shape that can beweighted differently, e.g., volume-weighted. However, the conver-sion of a cord length distribution into the corresponding particlesize distribution is not simple (Li, Wilkinson, & Patchigolla, 2005).For the used ECA 313, the numerical process to approximate theparticle size distribution has been described by Weidendorfer andHinrichs (2010). To guarantee that the focal point shortlymeasures empty space, an overlapping of particles has to be avoi-ded which may need the determination of a dilution factor. It isimportant to note that i) the measured length on the particlesurface is not necessarily the particle diameter, ii) a straight line forthe movement of the focal point on the particle surface anda spherical particle shape is assumed, and iii) all reflective particlesare measured independent of their properties, e.g., refractive index. In a first step, to generate a data pool and to compare the resultsof dv (0.75)3D ORM and dv (0.75)sLs, samples were analysed ina beaker (Hahn et al., 2012d; Peda et al., 2011). The dilution factor(0.02%, w/w) was determined by the method described byWeidendorfer and Hinrichs (2011). Samples were pre-suspended inlockable centrifuge tubes (50 mL) with distilled water, blended (2000 rpm for 10 s) on a vortex mixer (VWR 1719 (EU), VWRInternational GmbH, Darmstadt, Germany) to give a good blendingand to keep the mechanical load as small as possible (Shekunovet al., 2007), and stirred in the beaker on a magnetic stirrer(1 min, 150 rpm). For each measurement, six runs (each 9.6 s) wereaveraged and again the dv (0.75)3D ORM was analysed. At least twomeasurements were carried out (conditions: rare events 0%, rota-tion velocity of the laser 2.00 m s-, 4000-40,000 counts permeasurement,0 and <5 counts per measurement in air or distilledwater,respectively). In a second step, an experimental set-up was constructed tomeasure the dv (0.75)3D ORM in the production line. Microgelsuspensions tempered at 54 °C for 1-300 min and afterwardssheared(250L h-1,300-3000 rpm) were chosen. Sheared microgelsuspensions (7.5 kg h-1) and distilled water (374 kg h-, massdensity at 20 C: 998 kg m-) were conveyed to a three-way valvevia a dosing pump (type TK 20, Bauknecht Hausgerate GmbH,Stuttgart, Germany) and the screw pump, respectively, mixed ina static mixer (inner diameter 16 mm, length 200 mm, sixfold helixmixing element, Process Engineering U +A GmbH, Wiehl,Germany), and transferred to the sensor. Samples were analysed induplicate. 2.3. Confocal laser scanning microscopy Tempered and mechanically treated fresh cheese samples werevisualised undiluted by confocal laser scanning microscopy(CLSM) with a microscope Eclipse-C1 (Nikon GmbH, Diisseldorf,Germany). As protein dye, 35 uL Rhodamine B solution was used(Hahn et al., 2012b). Samples were stored at least for 1 h at 10 °Cin a alight-proof refrigerator. Pictures were taken at 10 C(magnification 63x, image resolution 1024 ×1024, average modeof two pictures). 3. Results and discussion 3.1. Mechanical post-processing By tempering at 45 °C, the dv(0.75)sLs increased with prolongedholding time from 29.0 ± 7.3 um after membrane filtration to54.5±5.4,98±11, or 102 ± 14 um at 1, 60, or 300 min, respectively(Table 1). The observed trend of the dv (0.75)sus represented theasymptotical growth behaviour reported for the mainly diffusion-limited aggregation of microgel particles in concentrated, fer-mented milk (Hahn et al.,2012b), and were proposed to arise from Table 1 Particle size dv (0.75)sus measured with the LS230 as affected by the holding time at45 °C and the rotational speed during mechanical post-processing with the rotor/stator-device Ytron-Z. Holding Volume Rotational speed (rpm) time (min) flow (Lh-1) 0 300 1500 3000 250 54.5±5.4 54.0±6.8 36.1±9.5 16.8±5.1 375 56.5±10.9 42.3±7.3 25.3±3.5 500 55.4±10.4 44.4±7.4 26.0±3.0 60 250 98 ± 11 78.6±4.7 62.9±8.5 37.5±4.6 375 76.7±10.8 66.7±6.7 42.9±4.4 500 79.7±11.7 66.2±9.9 45.7±4.4 300 250 102±14 90.2±12.3 75.7±20.8 45.9±6.9 375 84.5±10.8 75.1±16.9 51.6±7.8 500 71.9±3.6 67.2±7.0 53.8±9.2 Values represent the mean value and the standard deviation; samples wereprepared in triplicate. The dv (0.75)sls at a rotational speed of 0 rpm represents theparticle size after tempering at the respective conditions and before mechanicalpost-processing. both the evolving of larger particle clusters and the decreasing ofthe voluminosity due to hydrophobic interactions close to theisoelectric point (Hinrichs & Keim, 2007). The formation of particleclusters was attributed to extensive rearrangement (Lee & Lucey,2004; Lucey et al., 1997b), where denser particles and a moreopen structure showing larger pores was observed at highertemperatures (Lee & Lucey, 2006). At a certain holding time and volume flow, e.g., 1 min and250 L h-, the dv (0.75)sus decreased with increasing rotationalspeed, which was in agreement with other studies regardinga mechanical treatment during post-processing (Hahn et al.,2012c). In contrast, for a constant rotational speed, higher volumeflows tended to increase the dv(0.75)sus slightly in most casesprobably due to the shorter residence time in the rotor/statordevice. The same behaviour was observed at longer holding timeswhere,however, the dv (0.75)sus started on a higher level. Thus, forinstance, to adjust a dv(0.75)sLs of ~40 um after tempering at 45°C,a rotational speed of 1500 rpm (1 min), 3000 rpm (60min) or evenhigher (300 min) had to be applied. Therefore, the conditions ofmechanical post-processing need to be adapted to the sample, e.g.,amount, size, and voluminosity of particle clusters. It should benoted that such a parameter has to be determined separately foreach product as, besides the particle size, other properties have tobe considered (Engelen, Van der Bilt, Schipper, & Bosman, 2005;Imai, Hatae, & Shimada, 1995; Imai, Saito, Hatakeyama, Hatae, &Shimada, 1999; Tyle, 1993). For instance, temperature was shownto affect the rearrangement of particles greatly, and highertemperatures led to both extensive particle clustering (Haque,Richardson, & Morris, 2001; Lucey et al., 1997b) and decreasedvoluminosity (Lucey, Teo, Munro, & Singh, 1997a). Consequently,the defined threshold for in-mouth graininess is closely related tothe chosen test conditions. The effect of tempering and mechanical treatment was inagreement with the CLSM images (Fig.1). After tempering at 45°Cfor 1 min, uniformly distributed particle clusters with a sizeATA:of ~50 um showing a fine pored structure were visible. Fewparticle clusters were almost spherical (Hahn et al., 2012a), wheremost particle clusters exhibited an irregular particle shape. Byincreasing the holding time, a more heterogeneous, coarse, andopen structure evolved which showed both larger particle clustersand larger pores. Additionally the larger particle clusters lookedmore dense and compact. After tempering at 45 °C for 300 min (Fig. 1C), increasing therotational speed successively destroyed larger particle clusters,where at 3000 rpm (Fig.1F) the distribution was comparable withthe microgel suspension tempered at 45 °C for 1 min (Fig.1A). Thus,regarding the size of the microgel particles in the CLSM images,mechanical post-processing is capable to revert the effect oftempering agreeing with other studies showing that mechanicalpost-processing of grainy fresh cheese was capable to regeneratea smooth texture (Hahn et al., 2012c). 3.2. Particle size using 3D ORM 3.2.1. Mechanical post-processing In general, for the mechanical treatment at 54°C (Table 2), thesame behaviour was observed for the dy (0.75)ss as at 45 °C(Table 1). However, at the same holding time, tempering at 54 °Cgenerated higher absolute values, which is in agreement with otherstudies showing that increasing the temperature during temperingpromotes the particle cluster formation (Hahn et al.,2012a; Hahn etal.,2012b; Sainani et al., 2004). Thus, independent of the appliedparameters during the mechanical treatment, the dv (0.75)sus wasalways>40 um. This indicates that the particle size (SLS) wasbeyond the threshold for in-mouth graininess, and that the Fig. 1. Influence of the holding time during tempering and the rotational speed during mechanical treatment on the particle size in fresh cheese. The holding time at 45°C was(A)1 min, (B)60 min, and (C) 300 min; after tempering at 45C for 300 min, mechanical treatment was carried out at 250 Lh- with a rotor/stator-device (Ytron-Z) and a rotationalspeed of (D) 300 rpm, (E) 1500 rpm, or (F) 3000 rpm. Rhodamine B was used as protein dye. Magnification 63x, scale bar 50 pm. mechanical treatment was insufficient to regenerate a smoothtexture, i.e., all samples were supposed to have a grainy texture. Additionally, the dv (0.75)3D ORM followed the same trend.Bothmethods using different measuring principles were capable todetect small differences of the dv (0.75) and, as seen in Fig. 2,showed a good correlation(R-=0.8250)enabling the calibration ofboth methods. However, the 3D ORM technique gave higherabsolute values, where for a dv(0.75)sLs >100 um the discrepancieswere typically within 10-30%. With the exception of microscopy,the particle size cannot be measured directly, and is thus nota unique property of the particles but depends upon the physicalresponse of the analytical instrument which, in turn, is related tothe size and shape of the particles (Shekunov et al., 2007). Hence, it was reported that even the physical differences for sphericalparticles may lead to discrepancies typically within 10% whenanalysing the median diameter by volume, and that the differencesmight be even more for nonspherical particles. In contrast, especially for a dv (0.75)sLs< 50 um it seemed thatthe 3D ORM technique was not capable to capture smaller particlesadequately, and the differences between both measuring tech-niques increased. It should be noted that we closely stuck to themanufacturers recommendations and, additionally, checked thecounts per measurement before each measurement to give 0 and<5 counts per measurements in air and distilled water, respec-tively, to avoid an effect of air bubbles beaten into the inline system.Different explanations may thus be reasonable. Table 2 Particle size dv(0.75)3D ORM and dy(0.75)sus measured with the ECA 313 in a beaker and the LS230, respectively, as affected by the holding time at 54°C and the rotational speedduring mechanical treatment with the rotor/stator-device Ytron-Z. Holding Volume dv(0.75)sus dv (0.75)3D ORM time (min) flow (Lh-) Rotational speed (rpm) Rotational speed (rpm) 0 300 1500 3000 0 300 1500 3000 1 250 166±10 145 ±8 117±18 60.6±7.7 247±22 225±11 162±3 105±6 375 172±19 133±10 77.1±16.4 227±9 178±8 111±4 500 161±8 132±17 85.7±13.6 226±9 180±4 118±5 60 250 211±16 182±16 147±27 95.7±14.6 257±27 238±14 185±6 118±1 375 194±16 169±2 128±8 238±11 198±7 136±11 300 500 216±33 167±13 113±17 235±14 200±5 137±7 250 247±38 193±12 152±19 113±25 284±23 245±21 195±12 130±13 375 199±11 163±15 118±17 240±8 204±12 129±12 500 202±15 166±24 127±15 237±8 207±13 142±14 Fig. 2. Correlation of dv (0.75)3D ORM and dy (0.75)sus measured with the ECA 313 ina beaker and the LS230, respectively, in concentrated microgel suspensions aftertempering and mechanical treatment with a rotor/stator-device (Ytron-Z) at 54 °C(R²=0.8250). At first, the inner structure of the microgel particles is branchedand interconnected (Renan et al., 2009) as seen in Fig. 1, and thusdiffers from solid particles, e.g., glass beads or silica flakes (Li et al.,2005), what may have affected the reflection of the laser light in the3D ORM measurement. Secondly, the sample preparation may have affected the results.For instance, due to the voluminosity, microgel particles may havebeen broken up more easily during the sample preparation for theparticle size analysis using SLS. A third reason may be the different measuring principles, e.g.,detection limits, data acquisition. In contrast to static laser lightscattering, the 3D ORM technique detects laser light reflected byparticles passing the focal point. Based on the duration of thedetected reflection and the known rotational velocity, a distance isobtained, which, in principle, is a chord length. By recording manychord lengths, achord length distribution is generated, which can beconverted into different formats by the data analysis software. Thus,to obtain a volume-weighted distribution, the third power of thelength has to be calculated,where, however, large particle clusterswill be weighted especially strong (Weidendorfer & Hinrichs,2010).Therefore, the measured chord length distribution should closelycorrespond to the actual chord length distribution that could beovercome by increasing the measurement period which, however,may not always be relevant for industrial application. Furthermore, it was shown for the focused beam reflectancemeasurement (FBRM), a measuring principle also working withreflected laser light, that the measured chord length distributiondepends not only on the particle size distribution of the sample, butalso on particle optical properties and shape (Li et al., 2005). Thiswas especially observed for particles smaller than 20 um becausebackscattering is more likely which may oversize the particles. Inaddition, Greaves et al.(2008) showed for bimodal suspensionsthat there is a preferential measurement of large particles whichinhibits an accurate measurement of smaller particles. For a givenmeasurement period, this was ascribed to the fact that the timeneeded for the laser beam to gain a chord length for a single largeparticle can be longer than for smaller particles, thus, reducing theoverall number of counted smaller particles. Therefore, to prove whether or not the ECA 313 using the 3DORM technique was generally capable of measuring particle sizes<50 um without the presence of larger particles, polished glass beads (0-50 um) made of soda lime glass (Sigmund Lindner GmbH,Warmensteinach, Germany) were measured in triplicate. Theparticle size dy (i)3D ORM was analysed where i is in the range 0-1.0ORMand represents the diameter below which i*100% and above which100%- i*100% of the volume of the particles is found. The dy(0.10)3DORM, dv(0.25)3D ORM, dv(0.50)3D ORM, dv(0.75)3D ORM,anddy(0.90)3D ORM was 15±1.0 um,21±1.3 um,28±1.4 um, 41±2.8 um,and 53 ± 0.8 um, respectively, showing that the device wasgenerally capable of measuring particle sizes smaller than 50 pm.This supported the findings described for the FBRM technique thatin polydisperse suspensions there may be a preferential measure-ment of larger particles. These factors may explain the differencesobserved for both methods. 3.2.2. Experimental set-up for inline analysis Based on the results of the dv (0.75)3D ORM measured in a beaker,it was the aim to construct an experimental set-up combiningmechanical treatment and inline analysis. Additionally to the dy(0.75)sls and the dy (0.75)3D ORM measured in a beaker (Table 2), thedv(0.75)3D ORM of the samples tempered (54°C for 1-300 min) andsheared (250 L h-1, 300-3000 rpm) was analysed in a pilotproduction line (Fig.3). Generally, for both measuring procedures,the dy(0.75)3D ORM increased with longer holding times (1-300 min) and decreased with increasing rotational speed (Fig. 3,insert). The dv (0.75)3D ORM measured in a beaker showed highervalues than measured in the production line which was morepronounced at smaller rotational speeds (300 rpm). However, thedv(0.75)3D ORM from both measuring procedures correlated verywell (R²=0.9659). As, in turn, the dy (0.75)3D ORM measured ina beaker showed a good correlation with the dv (0.75)sLs, thecapability of the inline measuring device for the reproducible inlinemeasuring of the particle size distribution (3D ORM) during post-processing of concentrated microgel suspensions was supported. For industrialapplication, a production line combiningmechanical treatment and inline particle size analysis is proposed(Fig. 4). After fermentation and concentration, the concentratedmicrogel suspension fresh cheese is obtained, where microgelparticles are suspended in whey. For further post-processing,different options exist. Fig. 3. Influence of the rotational speed after tempering at 54°C on the dv(0.75)3D ORMin concentrated microgel suspensions depending on the measuring procedure (●) ina beaker and (O) in the production line. Data of both measuring procedures showeda good correlation (R²=0.9659). Mechanical treatment was carried out with a rotor/stator-device (Ytron-Z) at 250 L h-1 after tempering for 1, 60, and 300 min. Experi-ments were conducted in duplicate for each holding time giving six data points foreach rotational speed. Fig. 4. Production line for concentrated microgel suspensions combining mechanicaltreatment and inline particle size analysis during post-processing. Based on the inlineparticle size analysis a process parameter may be defined to control the mechanicaltreatment, e.g., the rotational speed of a shear device; tempering of the concentratedmicrogel suspension may be carried out additionally (PSD, particle size distribution). Usually, cultured products are supposed to have a smooth anduniform body free from large particle clusters (Lucey,2004). Theseparticle clusters are destroyed by mechanical post-processingbefore the fresh cheese is cooled and stored. The particle sizedistribution (3D ORM) is then analysed after mixing a branchcurrent of fresh cheese and whey that both are recycled to avoidproduct losses. Additionally, it is possible to define a processparameter, which can be derived from the particle size distribution,e.g., the dv(0.75)3D ORM as a measure for the threshold for in-mouthgraininess (Hahn et al.,2012c), and may be used to control andadjust the power input of the shear device. As an additional process step, tempering of the concentratedmicrogel suspension may be applied. On the one hand, temperingleads to the formation oflarger particle clusters generating a grainy texture when the particle size exceeds the threshold for in-mouthgraininess. On the other hand, it was reported that temperingincreased both particle size and storage modulus, while a followingmechanical treatment reduced the particle size to a greater extent(Hahn et al., 2012c). This was attributed to modified particle sizedistributions and particle properties, and may help to designinnovative products. 4. Conclusion Higher temperatures or holding times during tempering,and anincreasing rotational speed during mechanical treatment increaseand decrease the particle size, respectively, when post-processingof concentrated microgel suspensions is carried out. Additionally,particle properties may change during tempering and particlesbecome more dense and compact. Thus, the conditions of themechanical treatment have to be adapted to the product, e.g.,amount and size of large particle clusters, and voluminosity.Different measuring principles exist for the particle size analysis.The studied device (ECA 313) is capable to measure the particle sizeinline and showed higher absolute values for the dv (0.75) than thestatic laser light scattering (LS230), which was conducted inparallel. However, both methods correlated well (R²=0.8250)enabling the calibration. The proposed experimental set-upcombines tempering, mechanical treatment and inline particlesize analysis during post-processing which may be beneficial forindustrial application. On the one hand, the inline analysis providesa shorter response time. Thus, starting-up the process, detectingproduct variations, and controlling the power input at the sheardevice can be designed more efficiently giving potential to reduceproduct losses and to ensure a high product quality,e.g., by defininga process parameter. On the other hand, particle size and propertiescan be adjusted precisely in the process which may help to generateinnovative textures,to regenerate smooth textures, and to save rawmaterial. Acknowledgements This research project was supported by the German Ministry ofEconomics and Technology (via AiF) and the FEI (Forschungskreisder Ernahrungsindustrie e.V., Bonn). Project AiF 15584 N. Theauthors thank Giovanni Migliore, Luc Mertz, Matthias Sprunk, andMichaela Stroll for their helping hands at the pilot plants and Dr.Konrad Weidendorfer for useful discussions on particle sizemeasurement. References Bijnen, F. G. C., Van Aalst, H., Baillif, P.-Y., Blonk, J. C. G., Kersten, D.,Kleinherenbrink, F., et al. (2002). In-line structure measurement of food prod-s Pucts. Powder Technology, 124, 188-194. Cayot, P., Schenker, F, Houze, G., Sulmont-Rosse, C., & Colas, B. (2008). Creaminessin relation to consistency and particle size in stirred fat-free yogurt. Interna-tional Dairy Journal, 18, 303-311. Engelen, L., Van der Bilt, A., Schipper, M., & Bosman,F.(2005). Oral size perceptionof particles: effect of size, type, viscosity and method. Journal of Texture Studies,36, 373-386. ( Greaves, D . , B o xall, J., M ulligan, J., Montesi, A., Cr e ek, J., Sloan, E. D., et al. (2008).Measuring the particle size of a known distribution using the focused beam r eflectance measurement t e chnique. C h emical Engineering S c ience, 6 3, 5410-5419. ) ( H ahn, C . , Krzeminski, A., Wille, S., Weiss,J. , & Hinrichs,J. (2012a). Si m ultaneousparticle size and shape a nalysis i n fermented milk p r oducts as influenced by composition a n d processing. Milchwissenschaft, 67,6-9. ) ( H ahn, C., Sramek, M . , Nobel, S . , & Hinrichs,J. (2012b). Post-processing of concen-trated fermented m ilk: i nfluence o f t emperature and h o lding time on th e f ormation o f particle clusters. Dairy Science and Technology, 92, 91- 1 07. ) Hahn, C., Wachter, T, Nobel, S., Weiss, J., Eibel, H., & Hinrichs, J.(2012c). Graininessin fresh cheese as affected by post-processing: influence of tempering andmechanical treatment. International Dairy Journal, 26, 73-77. Hahn, C., Wille, S., Migliore, G., Mertz, L., Weiss, J., & Hinrichs, J. (2012d). Inline-Messung von Mikrogelpartikeln in Frischkase [Inline analysis of microgelparticles in fresh cheese]. DMW - Die Milchwirtschaft, 3,422-425. Haque, A., Richardson, R. K., & Morris, E. R. (2001). Effect of fermentationtemperature on the rheology of set and stirred yogurt. Food Hydrocolloids, 15,593-602. Heuer, M., & Schwechten, D. (1996). In-line particle size analysis in the finesoutlet of an air classifier. Particle and Particle Systems Characterization, 13,301-308. Hinrichs,J., & Keim, S. (2007). Process-induced stabilizing bonds in fermented milkproducts. Milchwissenschaft, 62,422-425. Imai, E., Hatae, K., & Shimada, A. (1995). Oral perception of grittiness: effect ofparticle size and concentration of the dispersed particles and the dispersionmedium. Journal of Texture Studies, 26, 561-576. Imai, E., Saito, K., Hatakeyama, M., Hatae, K., & Shimada, A. (1999). Effect of physicalproperties of food particles on the degree of graininess perceived in the mouth.Journal of Texture Studies, 30, 59-88. Lee, W. J., & Lucey, J.A. (2004). Structure and physical properties of yogurt gels:effect of inoculation rate and incubation temperature.Journal of Dairy Science,87,3153-3164. Lee, W. J., & Lucey, J. A. (2006). Impact of gelation conditions and structuralbreakdown on the physical and sensory properties of stirred yogurts. Journal ofDairy Science, 89, 2374-2385. Li, M., Wilkinson, D., & Patchigolla, K. (2005). Comparison of particle size distri-butions measured using different techniques. Particulate Science and Technology,23,265-284. Lucey, J. A. (2004). Cultured dairy products: an overview of their gelation andtexture properties. International Journal of Dairy Technology, 57, 77-84. Lucey,J. A., & Singh,H.(1997). Formation and physical properties of acid milk gels:a review. Food Research International, 30,529-542. Lucey, J.A., Teo, C. T., Munro, P. A., & Singh, H. (1997a). Rheological properties atsmall (dynamic) and large (yield) deformations of acid gels made from heatedmilk. Journal of Dairy Research, 64,591-600. Lucey, J. A., Van Vliet, T., Grolle, K., Geurts, T., & Walstra, P.(1997b). Properties of acidcasein gels made by acidification with glucono-8-lactone. 1. Rheological prop-erties.International Dairy Journal, 7, 381-388. Mellema, M., Walstra, P., Van Opheusden, J. H. J., & Van Vliet, T.(2002). Effects ofstructural rearrangements on the rheology of rennet-induced casein particlegels. Advances in Colloid and Interface Science, 98,25-50. Peda, S., Brockel, U., Ay, P., & Stollberg, C. (2011). Anwendbarkeit der Laser-messverfahren FBRM und 3D ORM SMF in Batch-Kristallisationen [Applicabilityof the laser backscattering instruments FBRM and 3D ORM SMF in batchcrystallisations]. Chemie-Ingenieur-Technik, 83, 558-562. Rasmussen, M. A., Janhoj, T., & Ipsen, R. (2007). Effect of fat, protein and shear ongraininess, viscosity and syneresis in low-fat stirred yoghurt. Milchwissenschaft,62,54-58. Renan, M., Guyomarch,F., Arnoult-Delest, V., Paquet, D., Brule, G., & Famelart, M.-H.(2009). Rheological properties of stirred yoghurt as affected by gel pH on stir-ring, storage temperature and pH changes after stirring. International DairyJournal,19,142-148. Sainani, M. R., Vyas, H. K., & Tong, P. S. (2004). Characterization of particles in creamcheese. Journal of Dairy Science, 87, 2854-2863. Shekunov, B. Y., Chattopadhyay, P., Tong, H. H. Y., & Chow, A. H.L. (2007). Particlesize analysis in pharmaceutics: principles, methods and applications. Pharma-ceutical Research, 24, 203-227. Sommer. (2000). 40 Jahre Darstellung von PartikelgroBenverteilungen und -immer noch falsch? [40 years' representation of particle size distribution- stillincorrect?] Chemie-Ingenieur-Technik, 72,809-812. Trystram, G., & Courtois,F. (1994). Food processing control -reality and problems.Food Research International, 27, 173-185. Tyle, P.(1993). Effect of size, shape and hardness of particles in suspension on oraltexture and palatability. Acta Psychologica, 84, 111-118. Weidendorfer, K., Bienias, A., & Hinrichs, J.(2008). Investigation of the effects ofmechanical post-processing with a colloid mill on the texture properties ofstirred yogurt. International Journal of Dairy Technology, 61, 379-384. Weidendorfer, K., & Hinrichs, j. (2010). Online particle size measurement inmicrogel particle suspensions: principles and data analysis. Chemie-Ingenieur-Technik, 82, 1685-1691. Weidendorfer, K., & Hinrichs,J. (2011). On-line microgel particle size measurementin stirred skim milk yoghurt. Milchwissenschaft, 66, 152-155. Xu, R. (2000). Particle characterization: Light scattering methods. Dordrecht, TheNetherlands: Kluwer Academic Publishers.
确定
还剩5页未读,是否继续阅读?

产品配置单

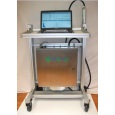

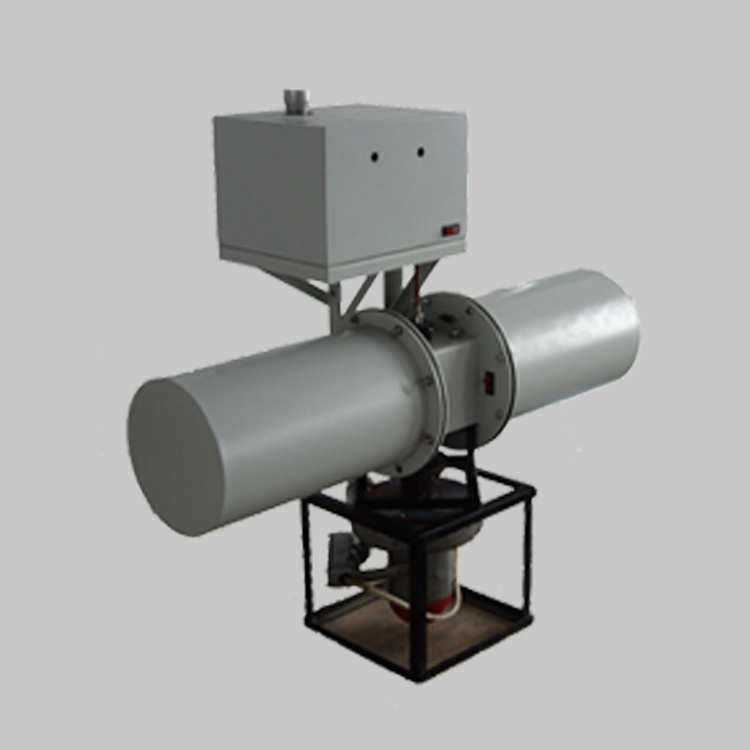
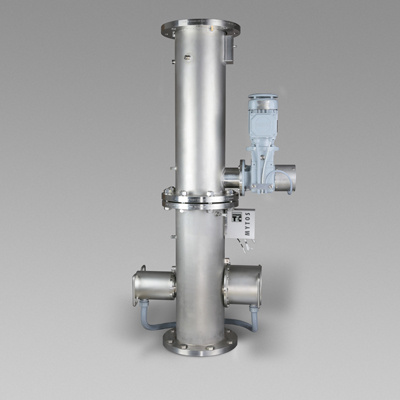
博盛技术(中国)有限公司为您提供《奶酪中凝胶颗粒物检测方案 》,该方案主要用于其他乳制品中理化分析检测,参考标准--,《奶酪中凝胶颗粒物检测方案 》用到的仪器有在线粒度分析仪、可移动粒度分析支架、在线粒度仪PAT (激光粒度)
推荐专场
相关方案
更多