


1.完全符合PMP及国5标准取样方法要求;
2.不需要CPC,只需一个传感器加预处理装置来进行检测;
3.轻便便携,不需要二级稀释;
4.可用于尾气直接采样,也可用于CVS采样;
5.与法规认证方法相关性很好,重复性极佳,适合用于颗粒物数量的测试研究.
方案详情

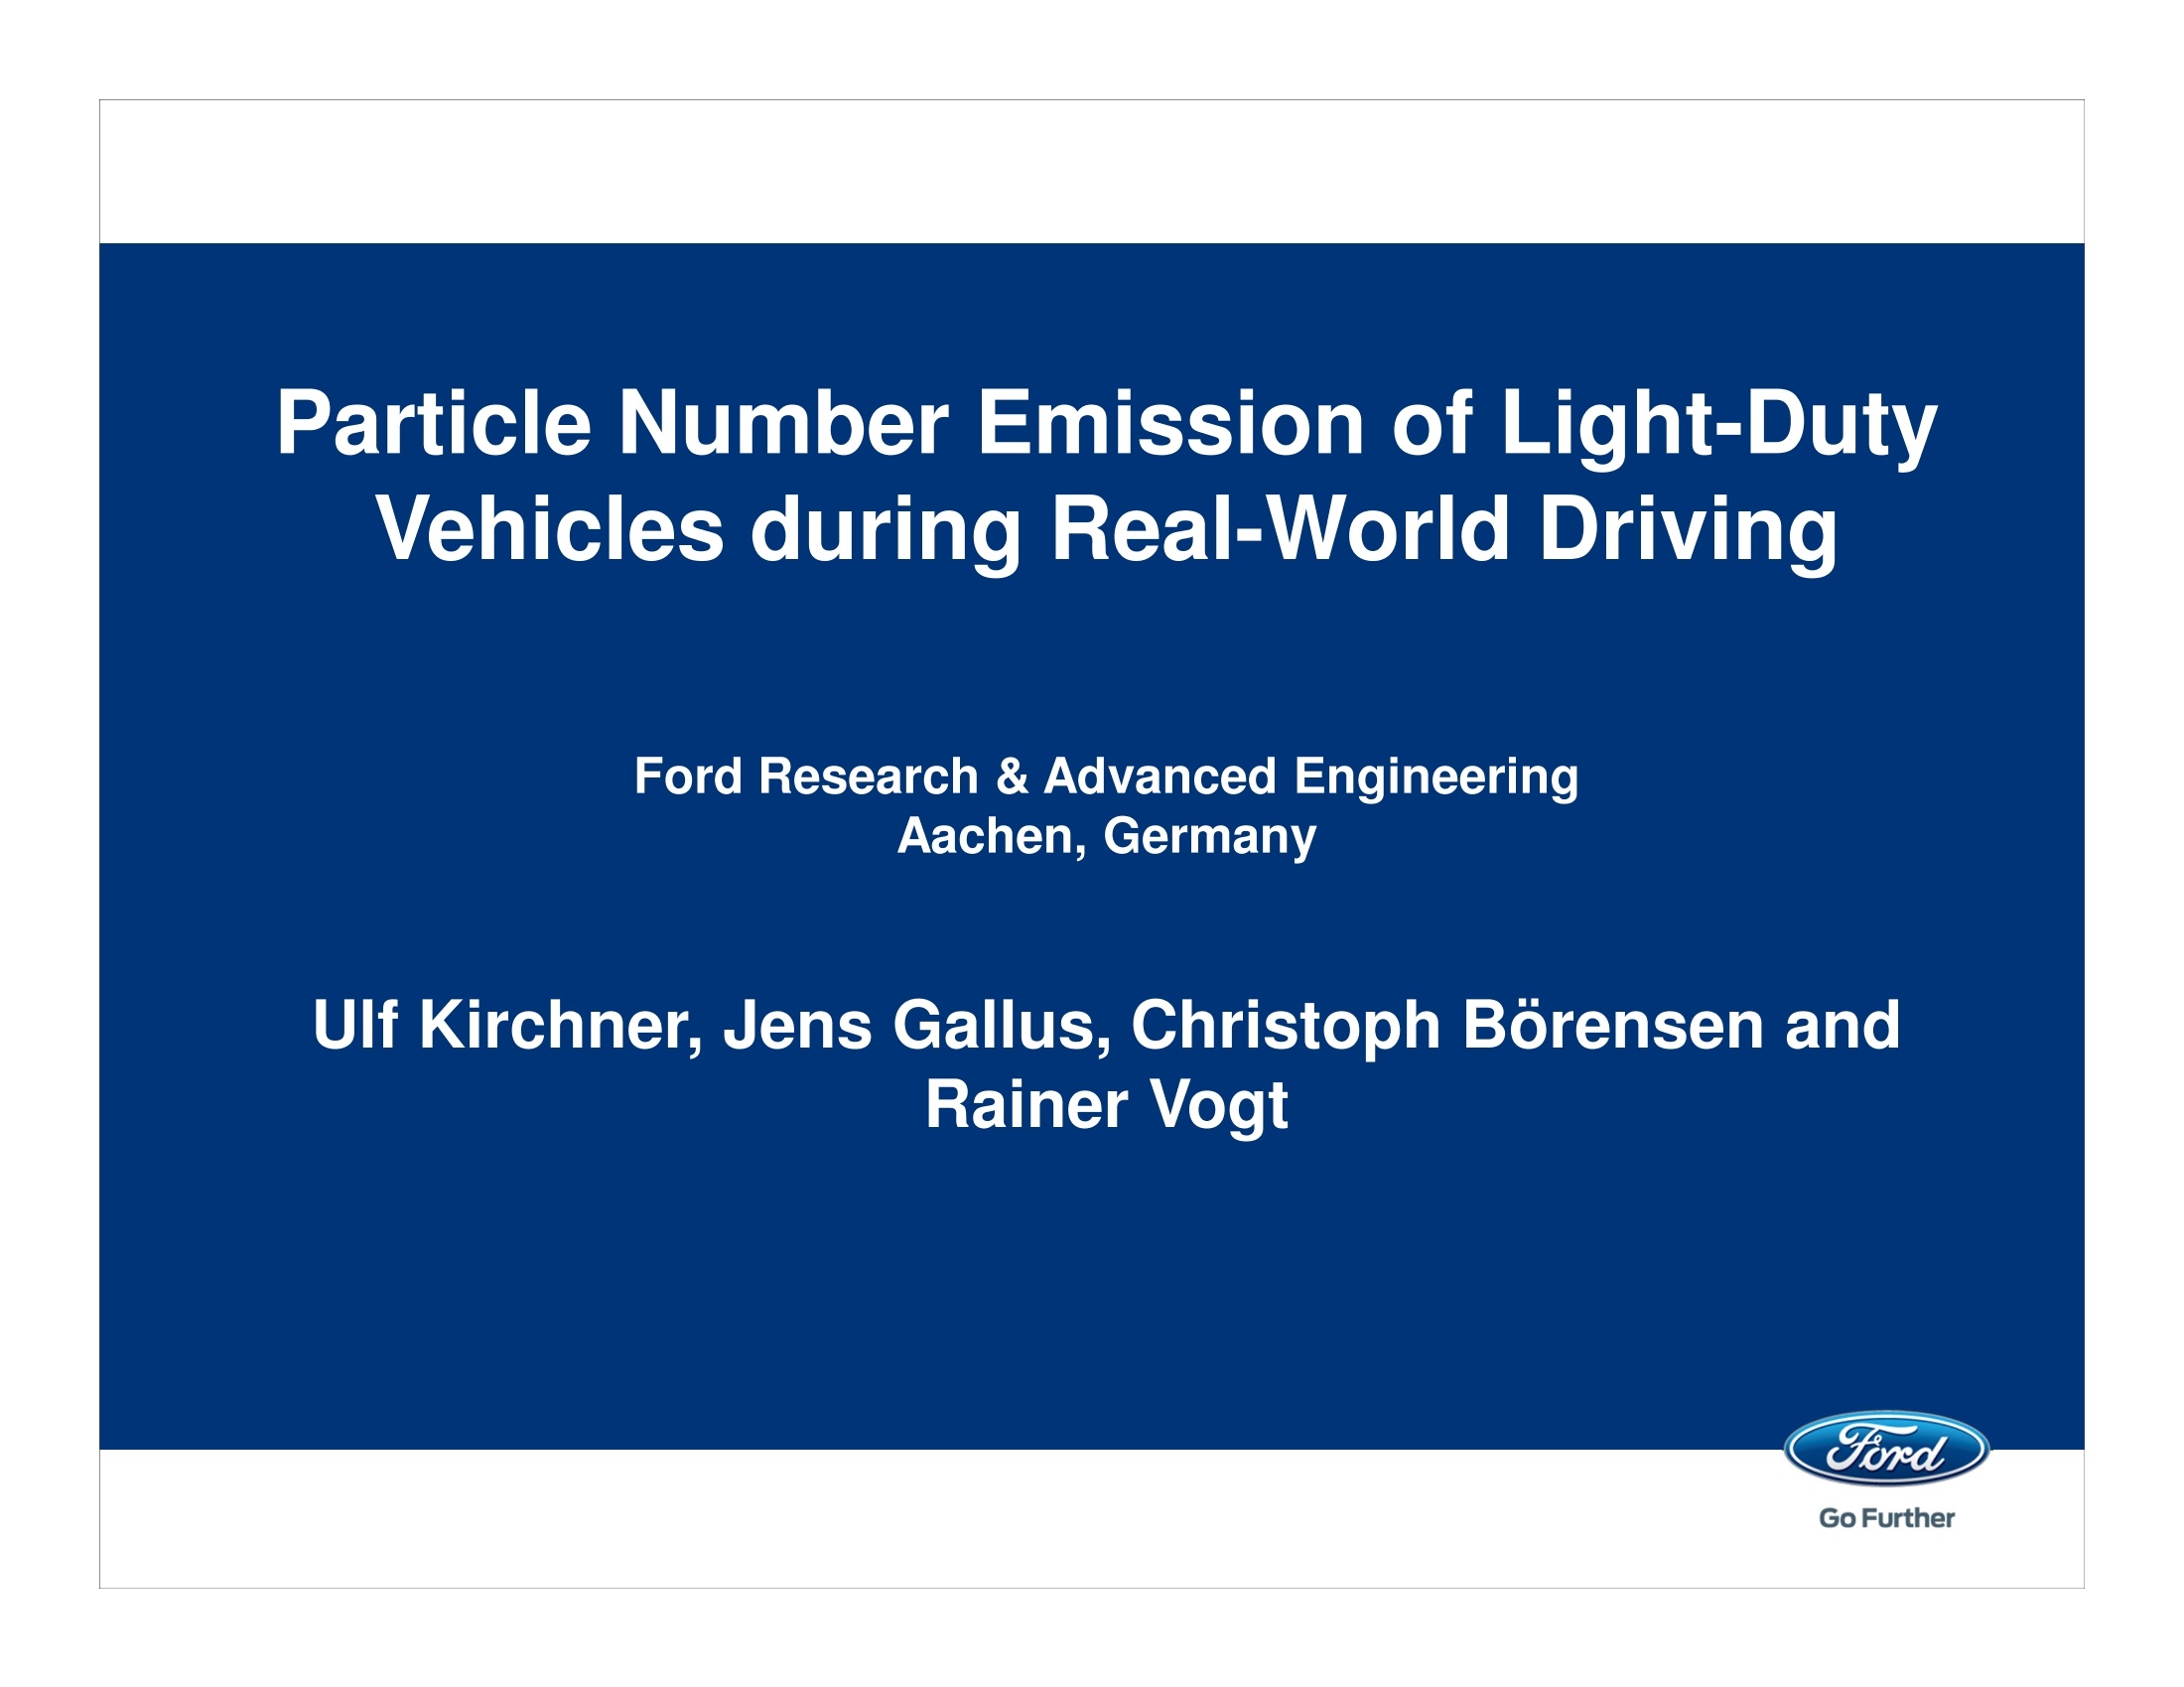
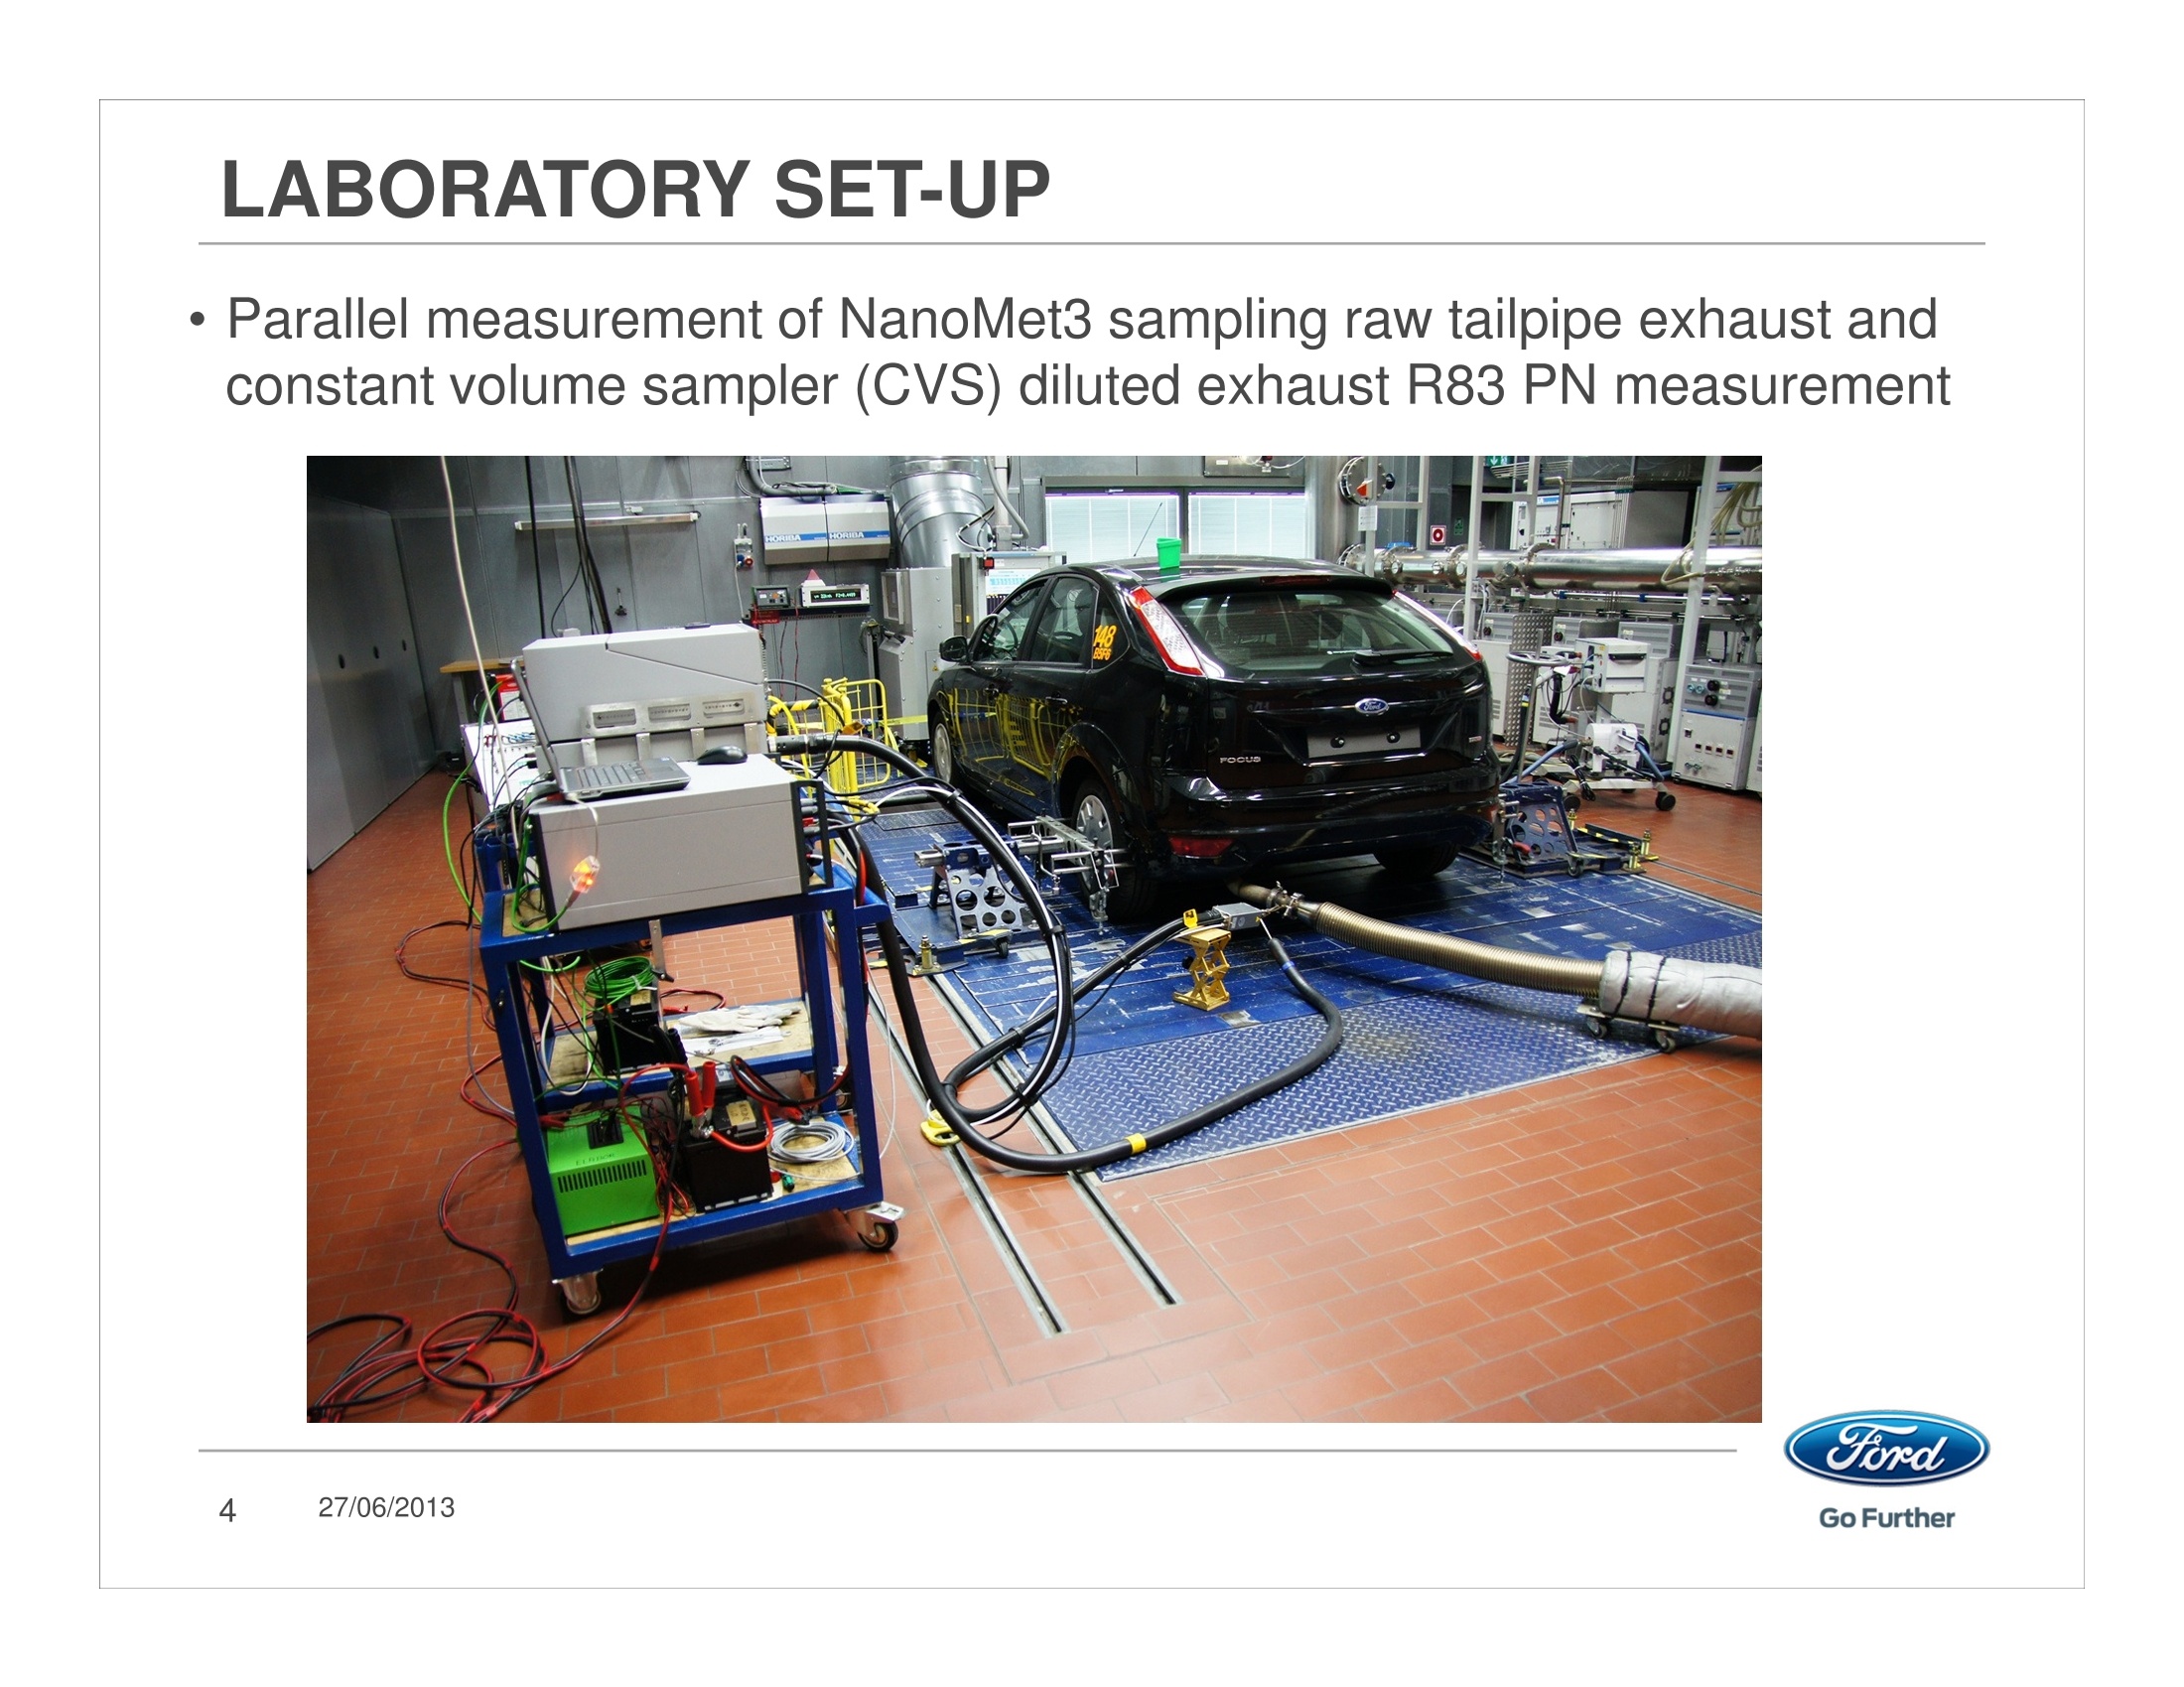
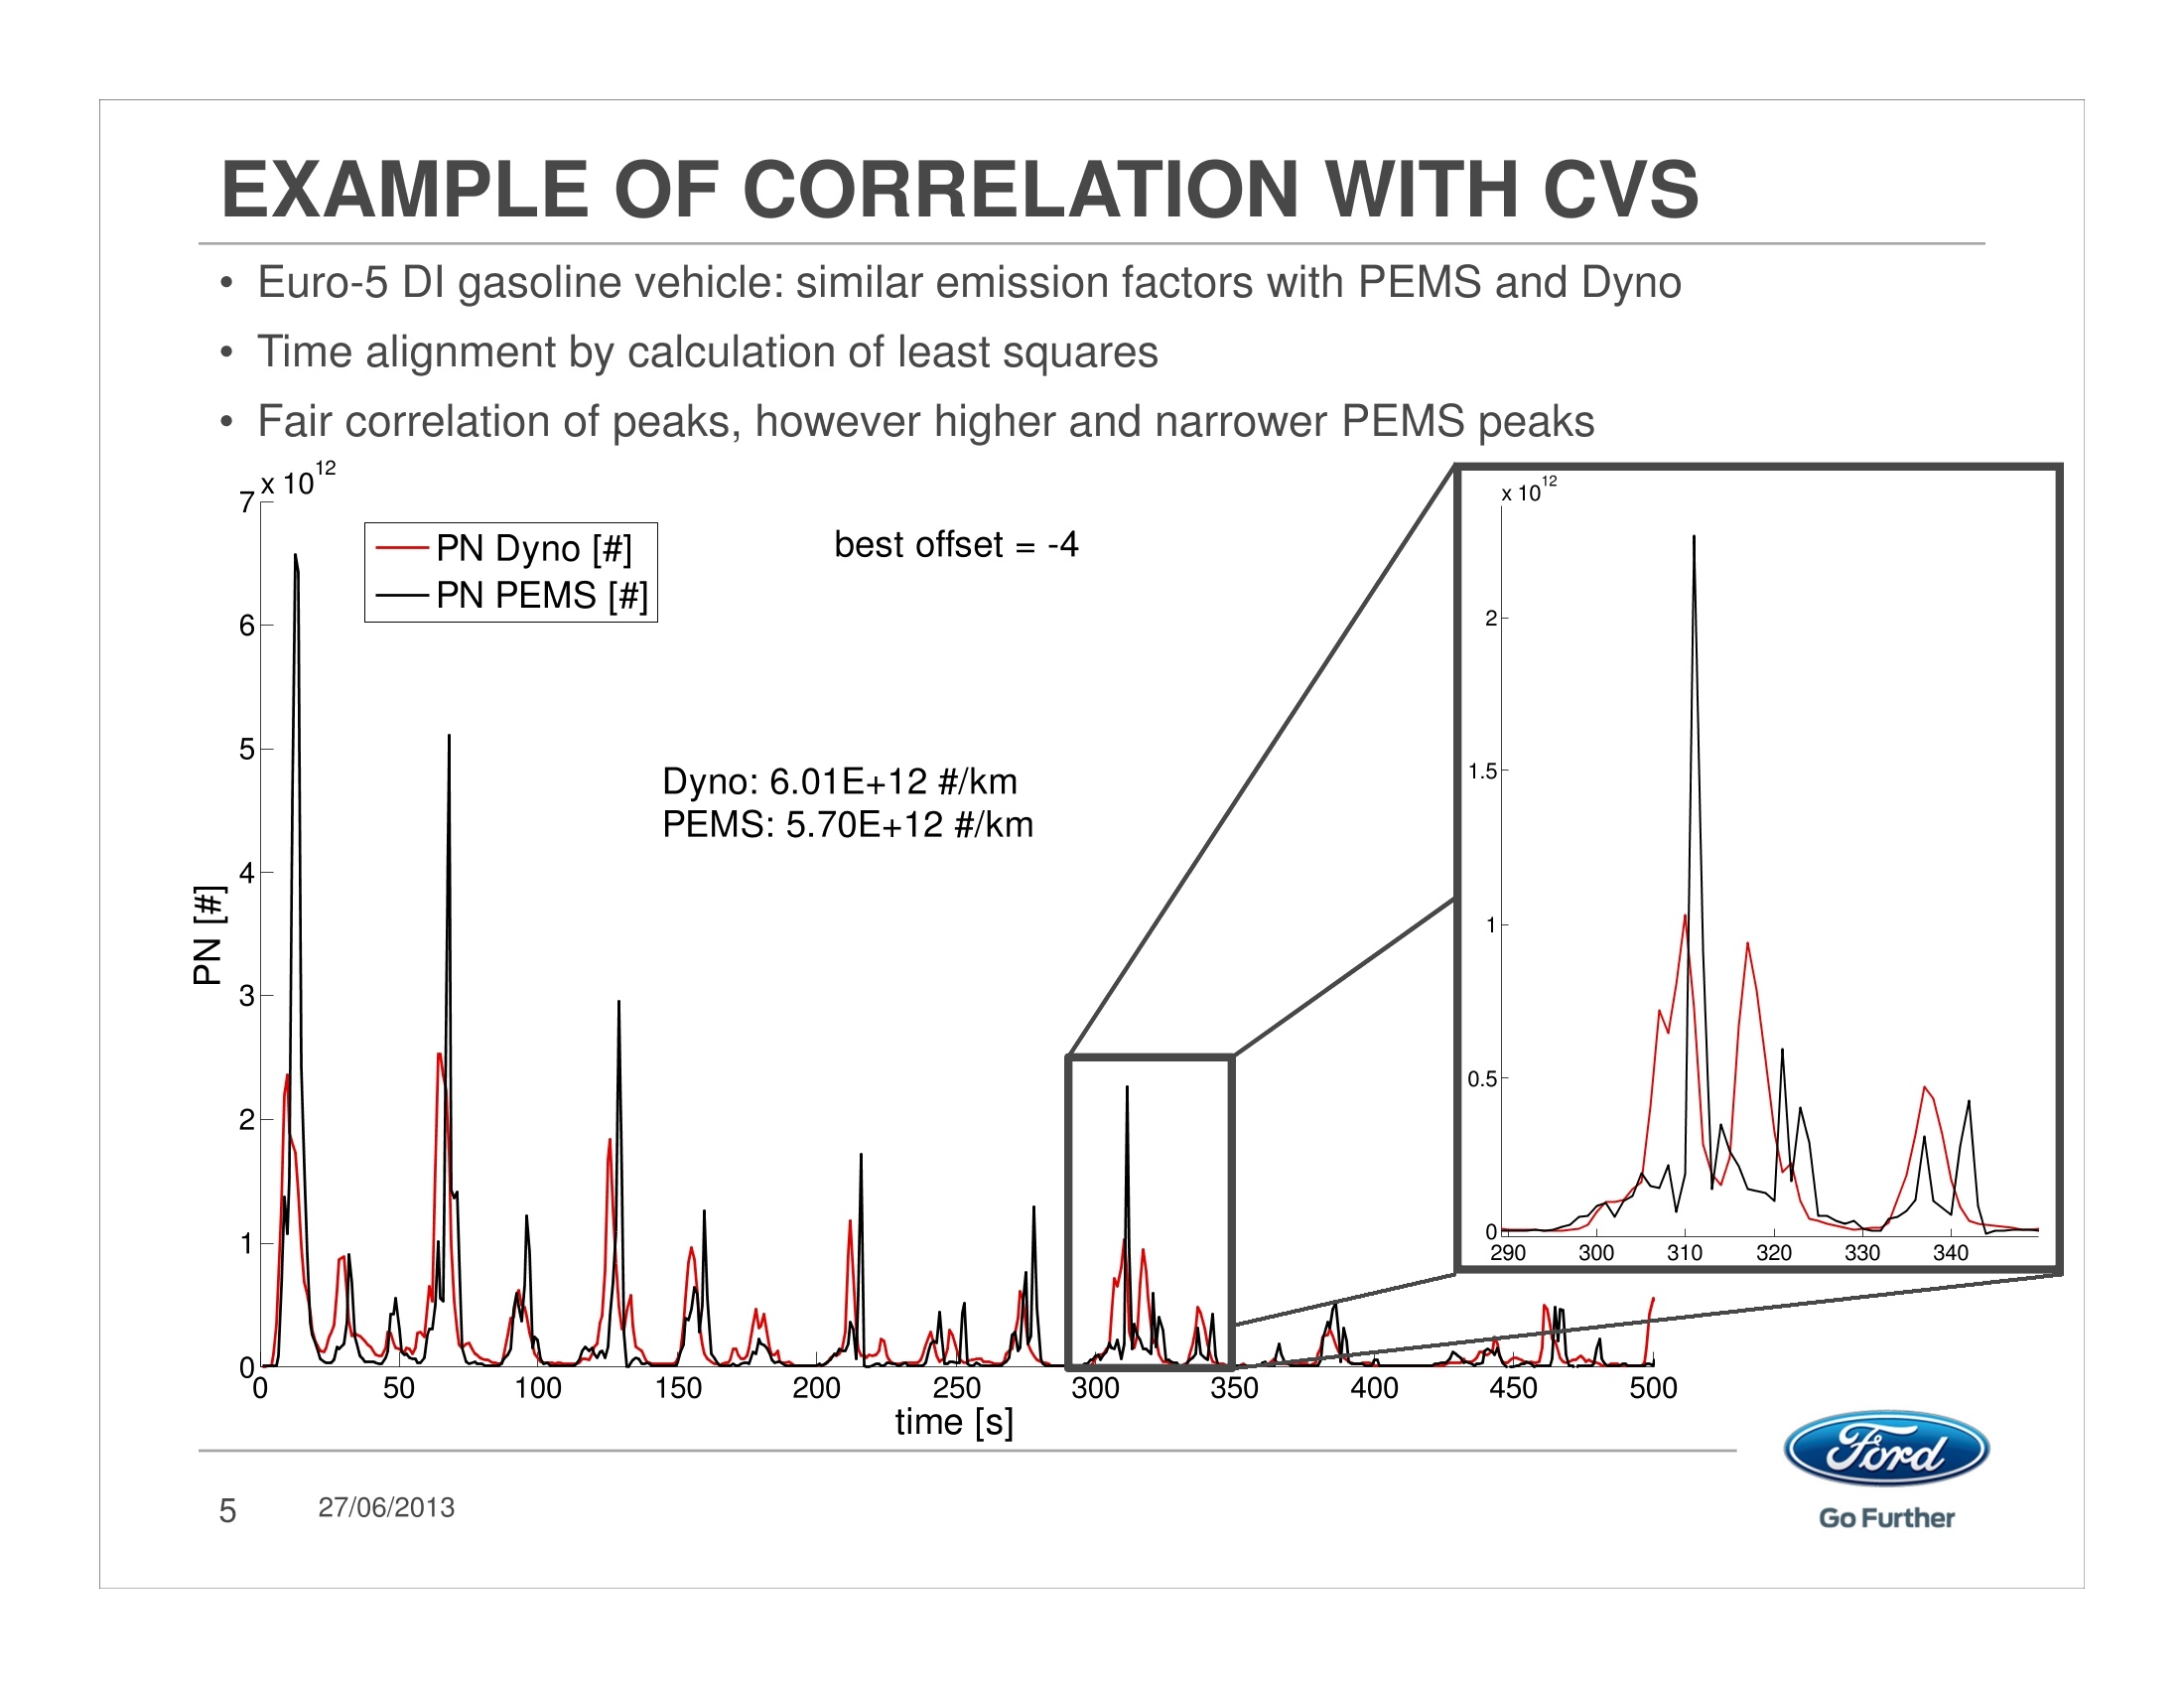
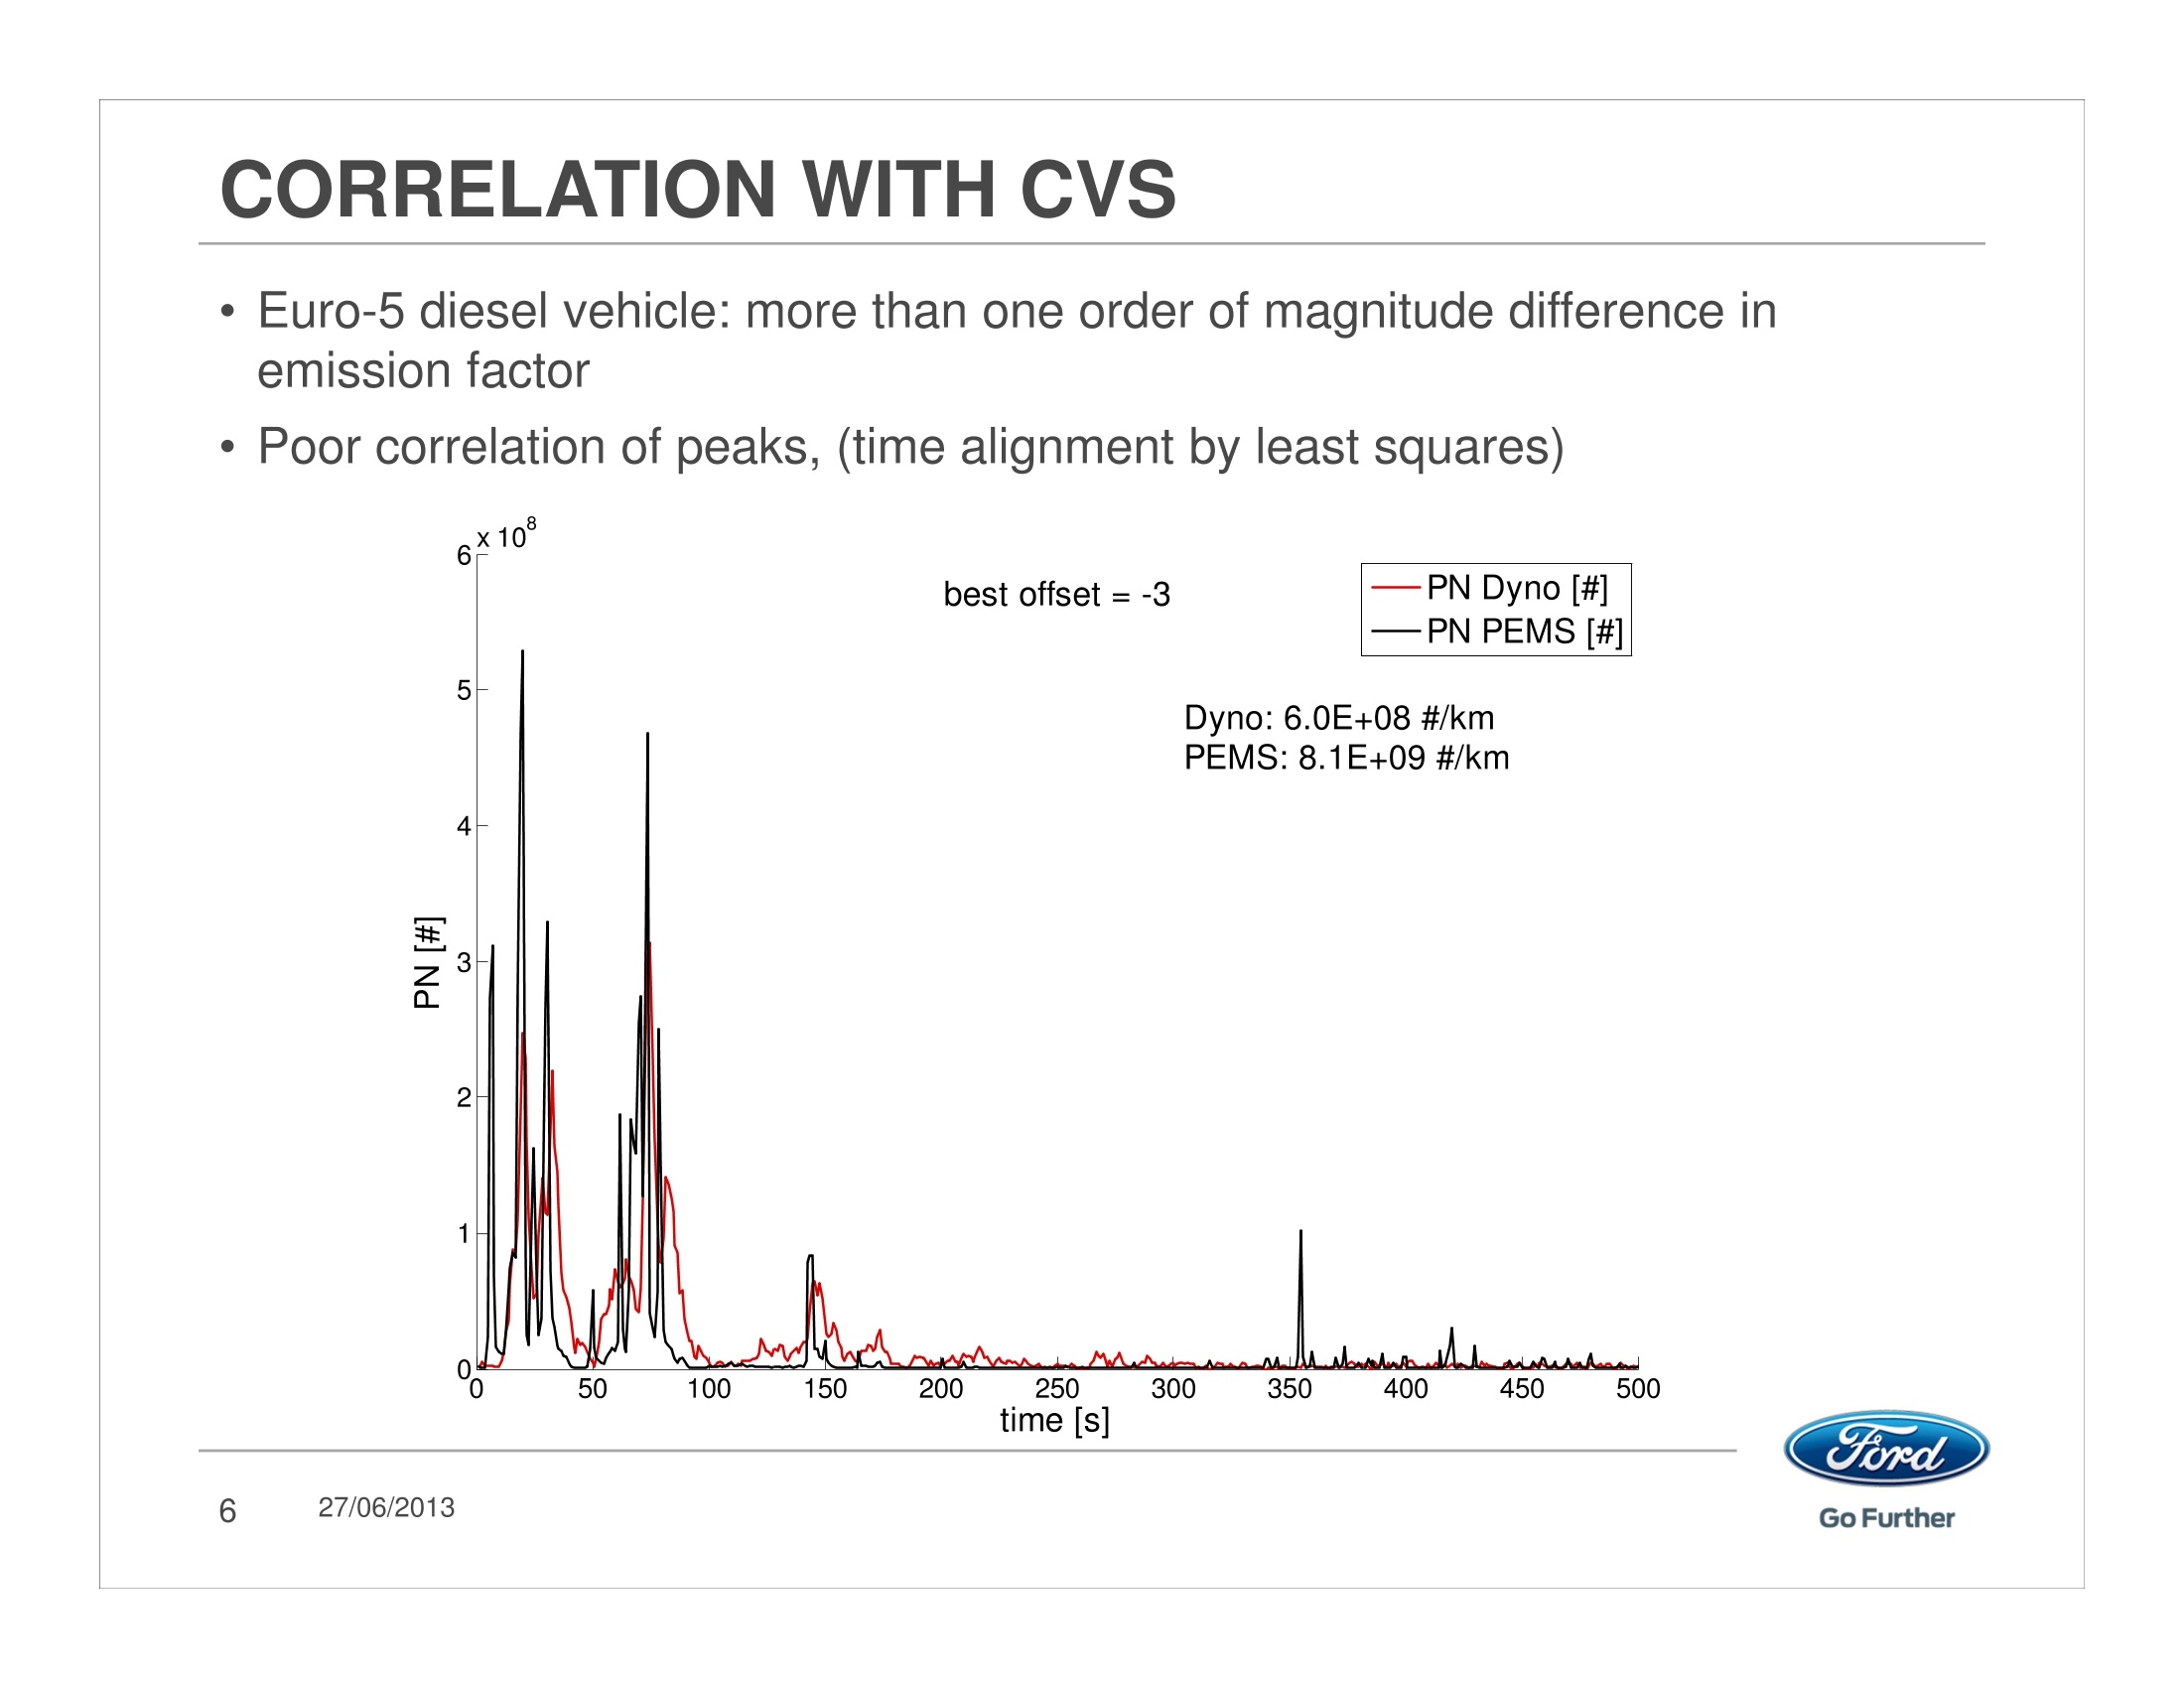
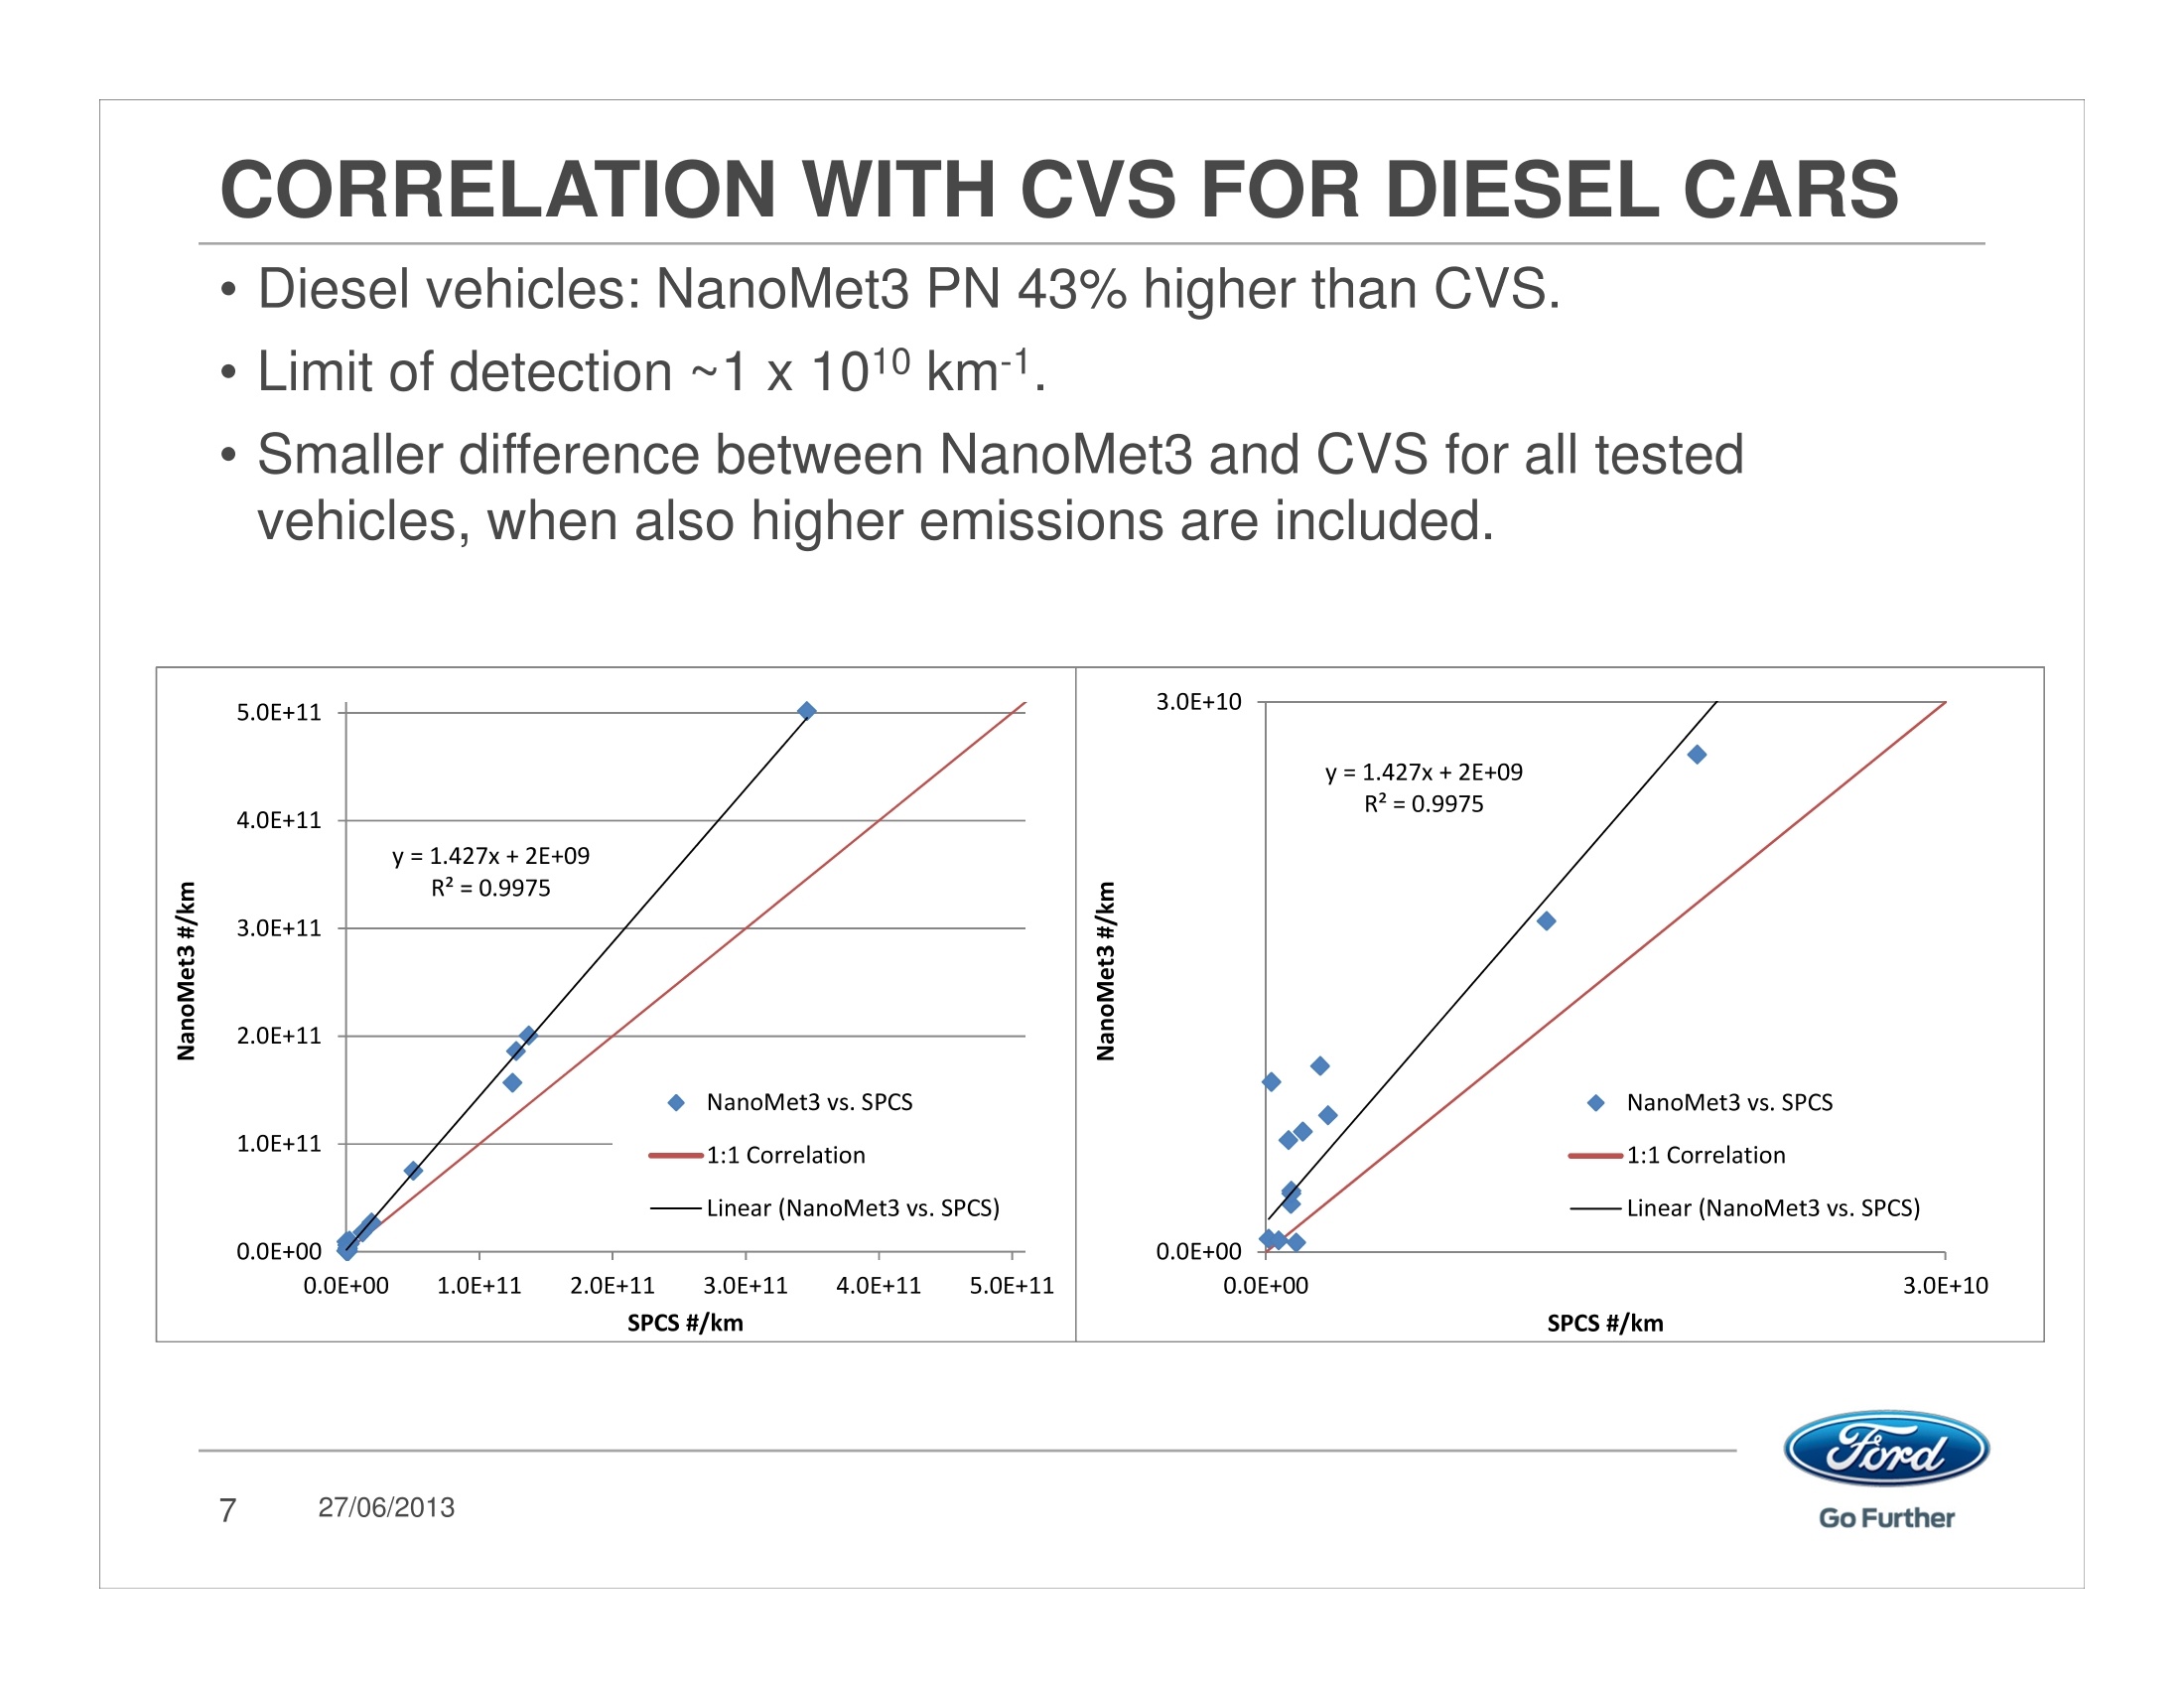
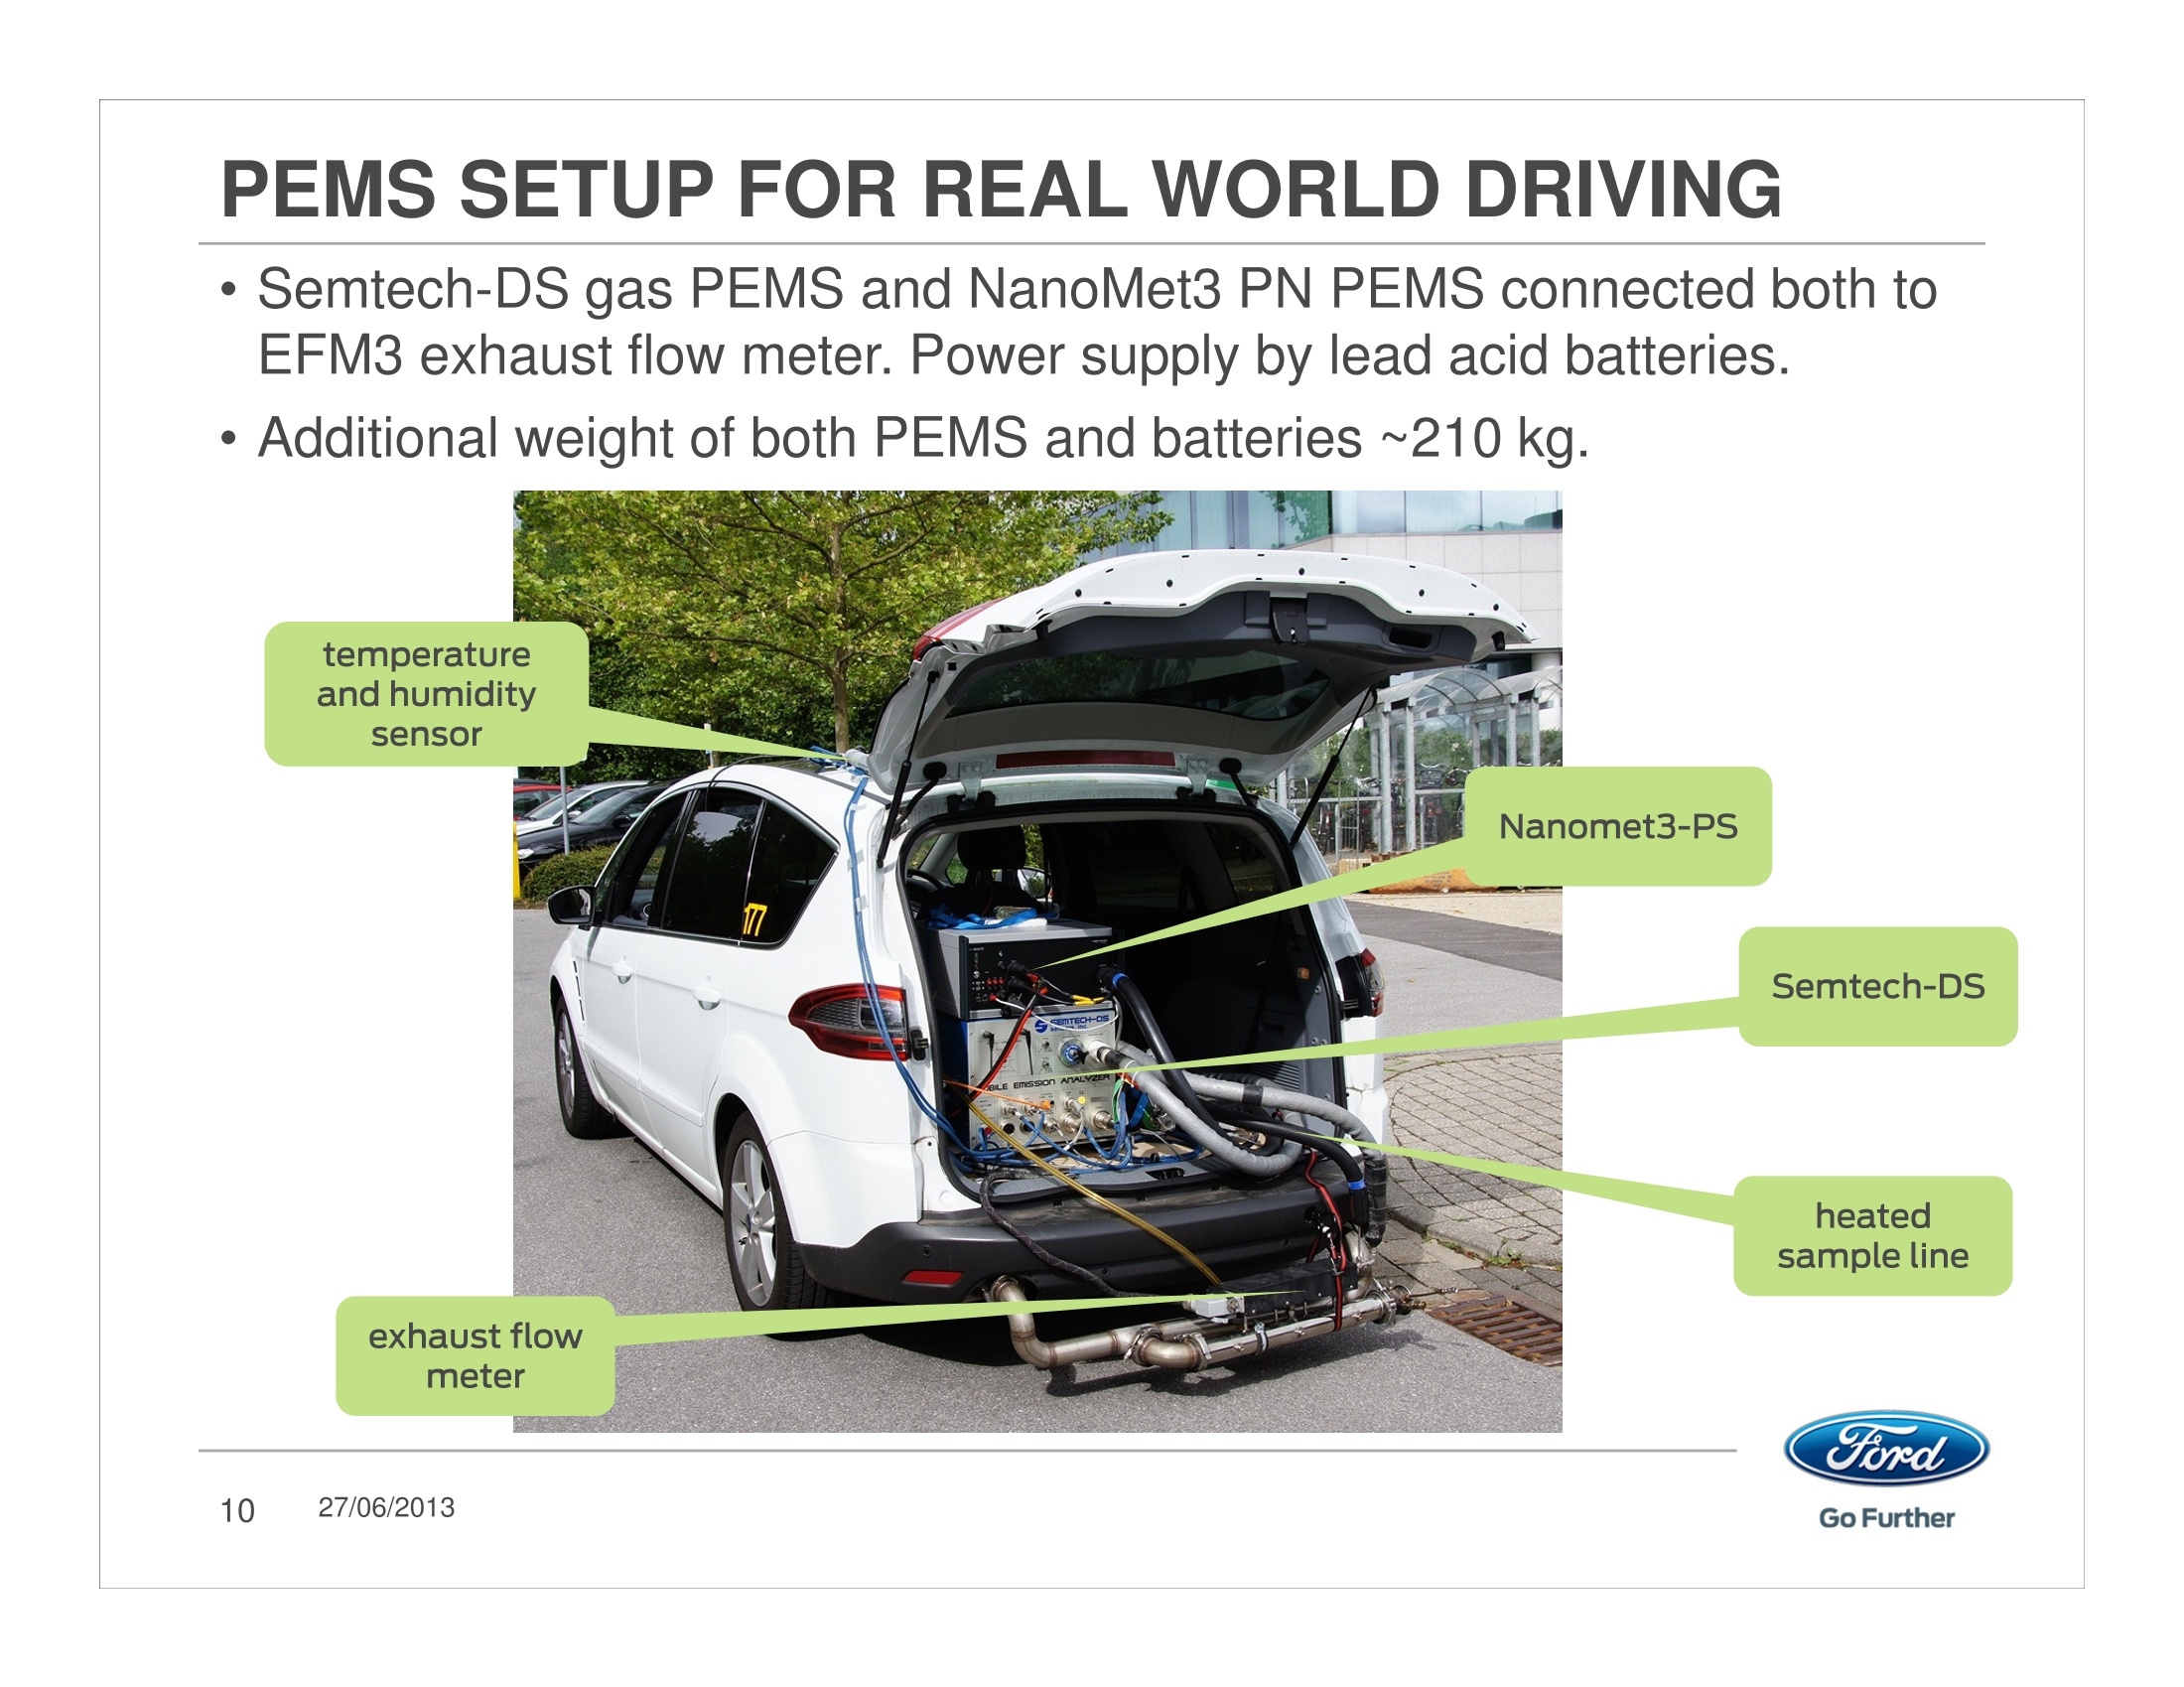
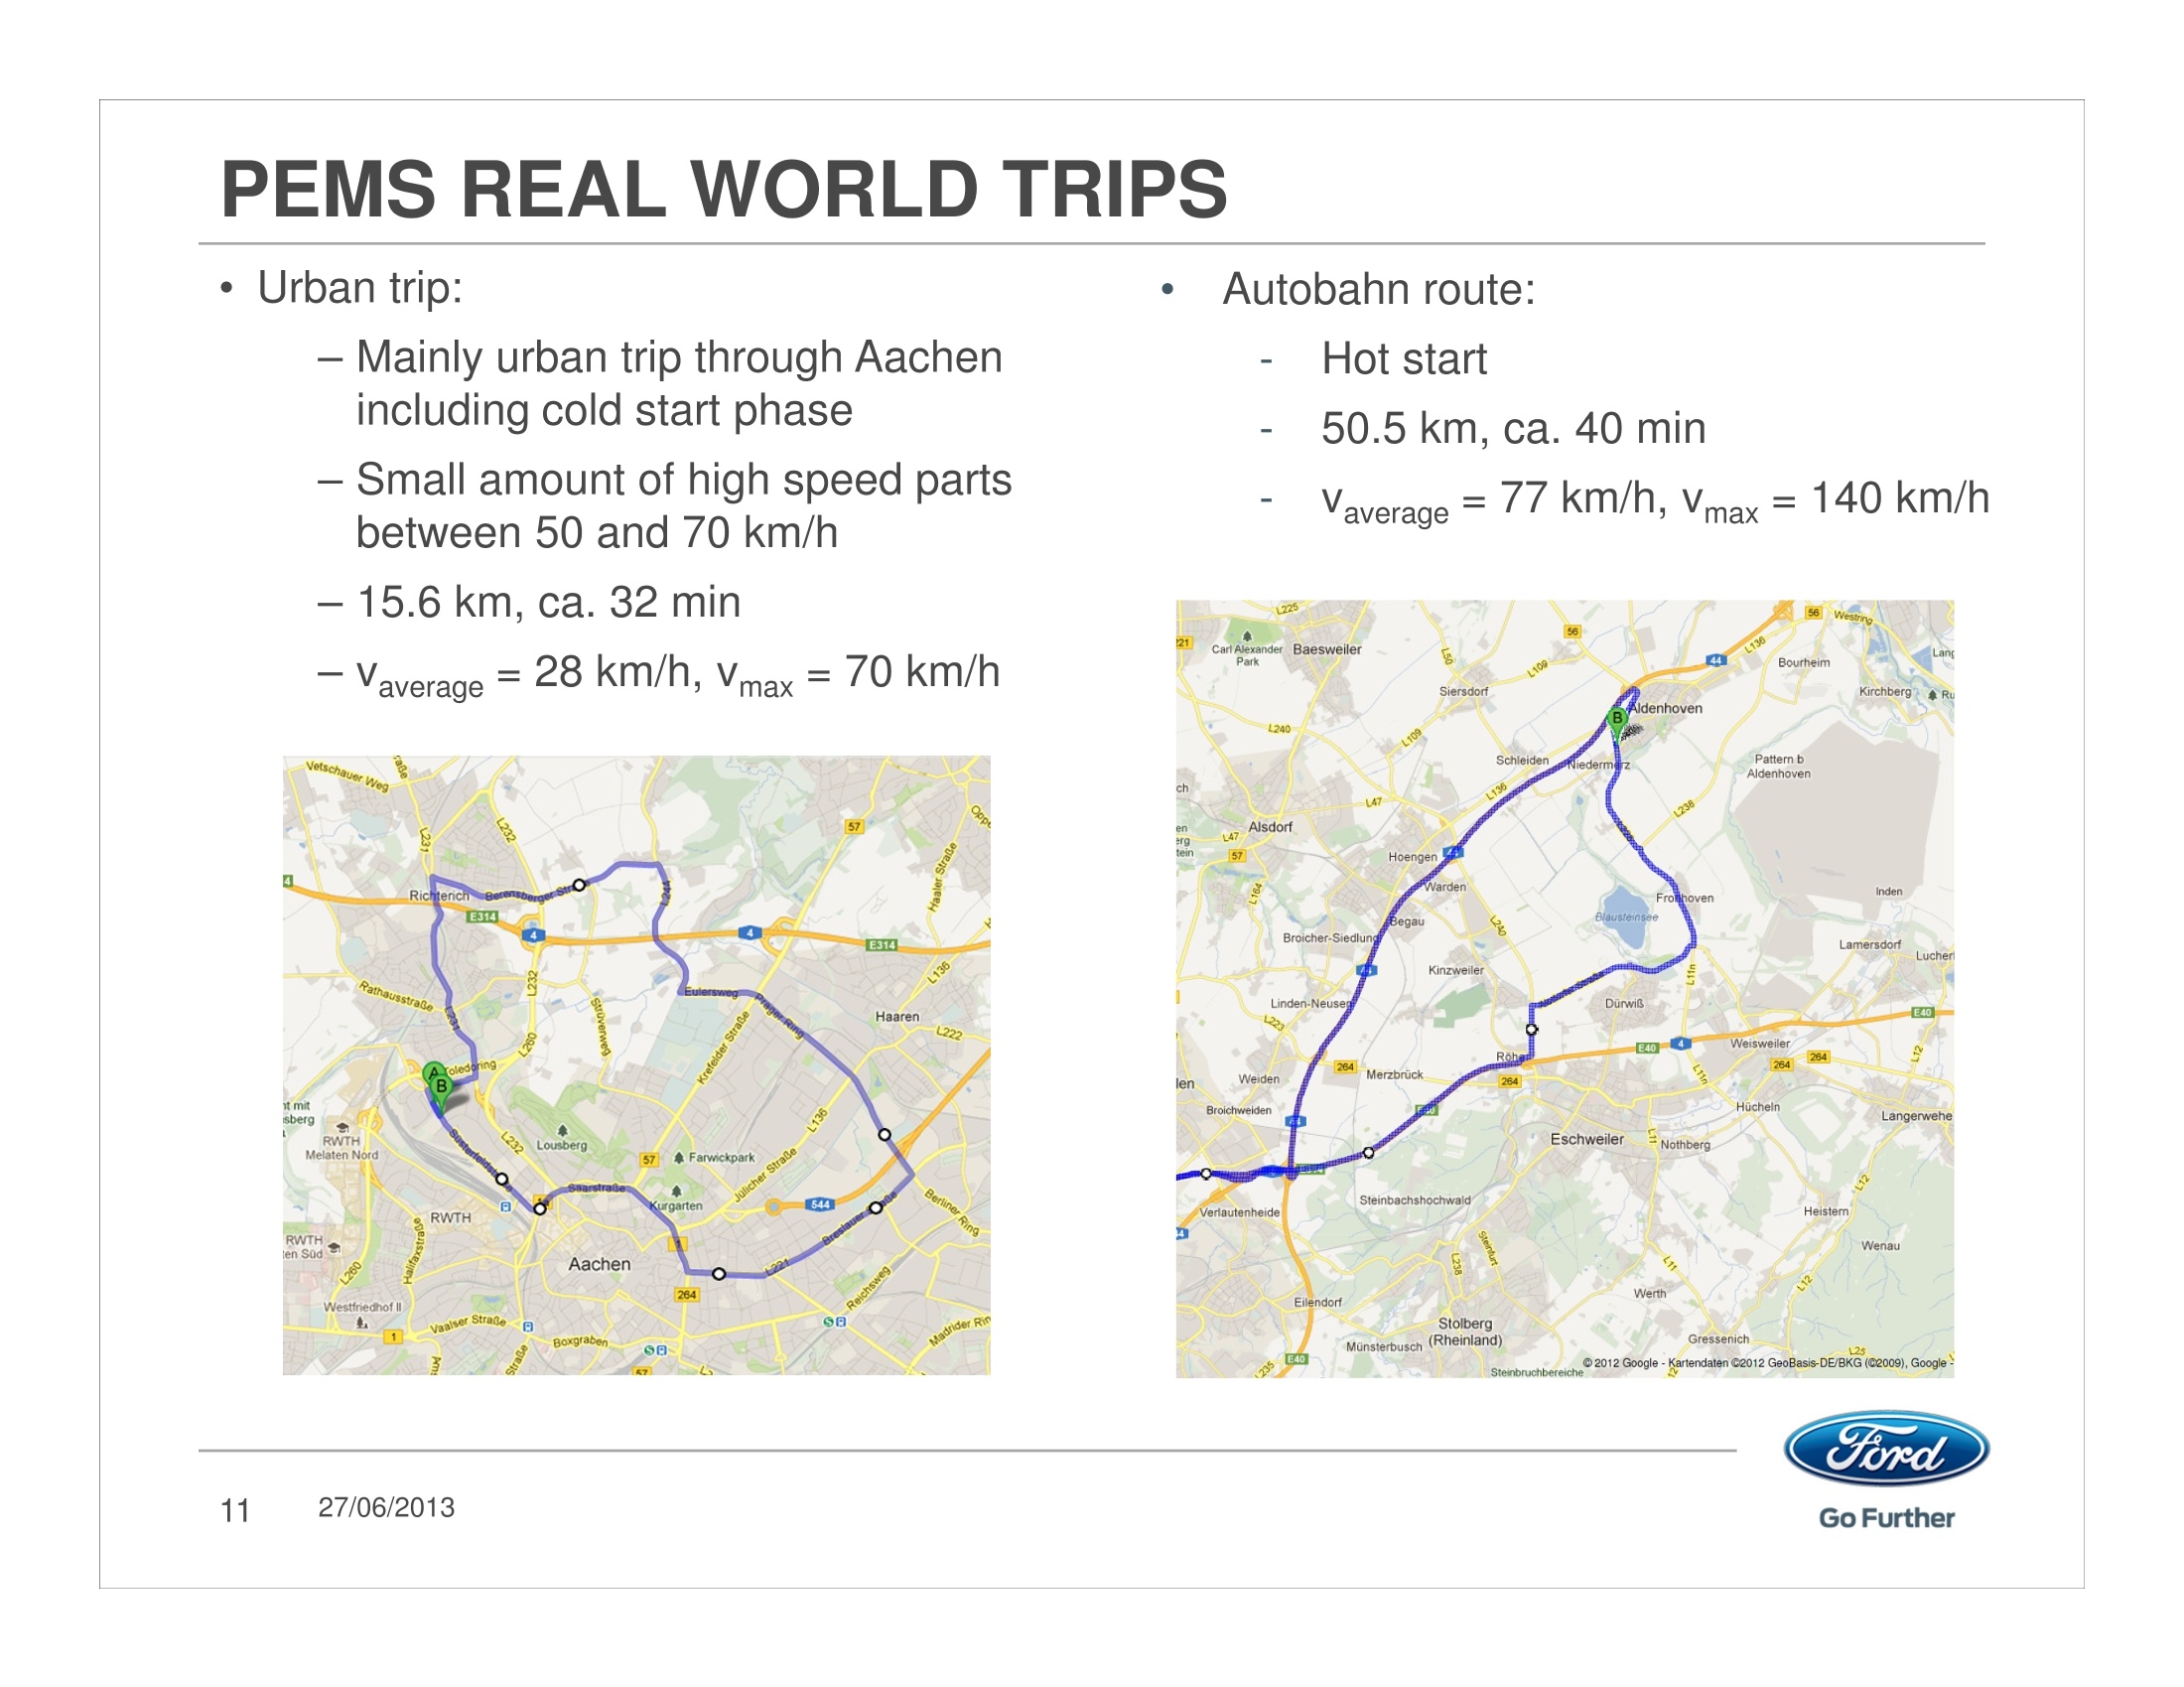
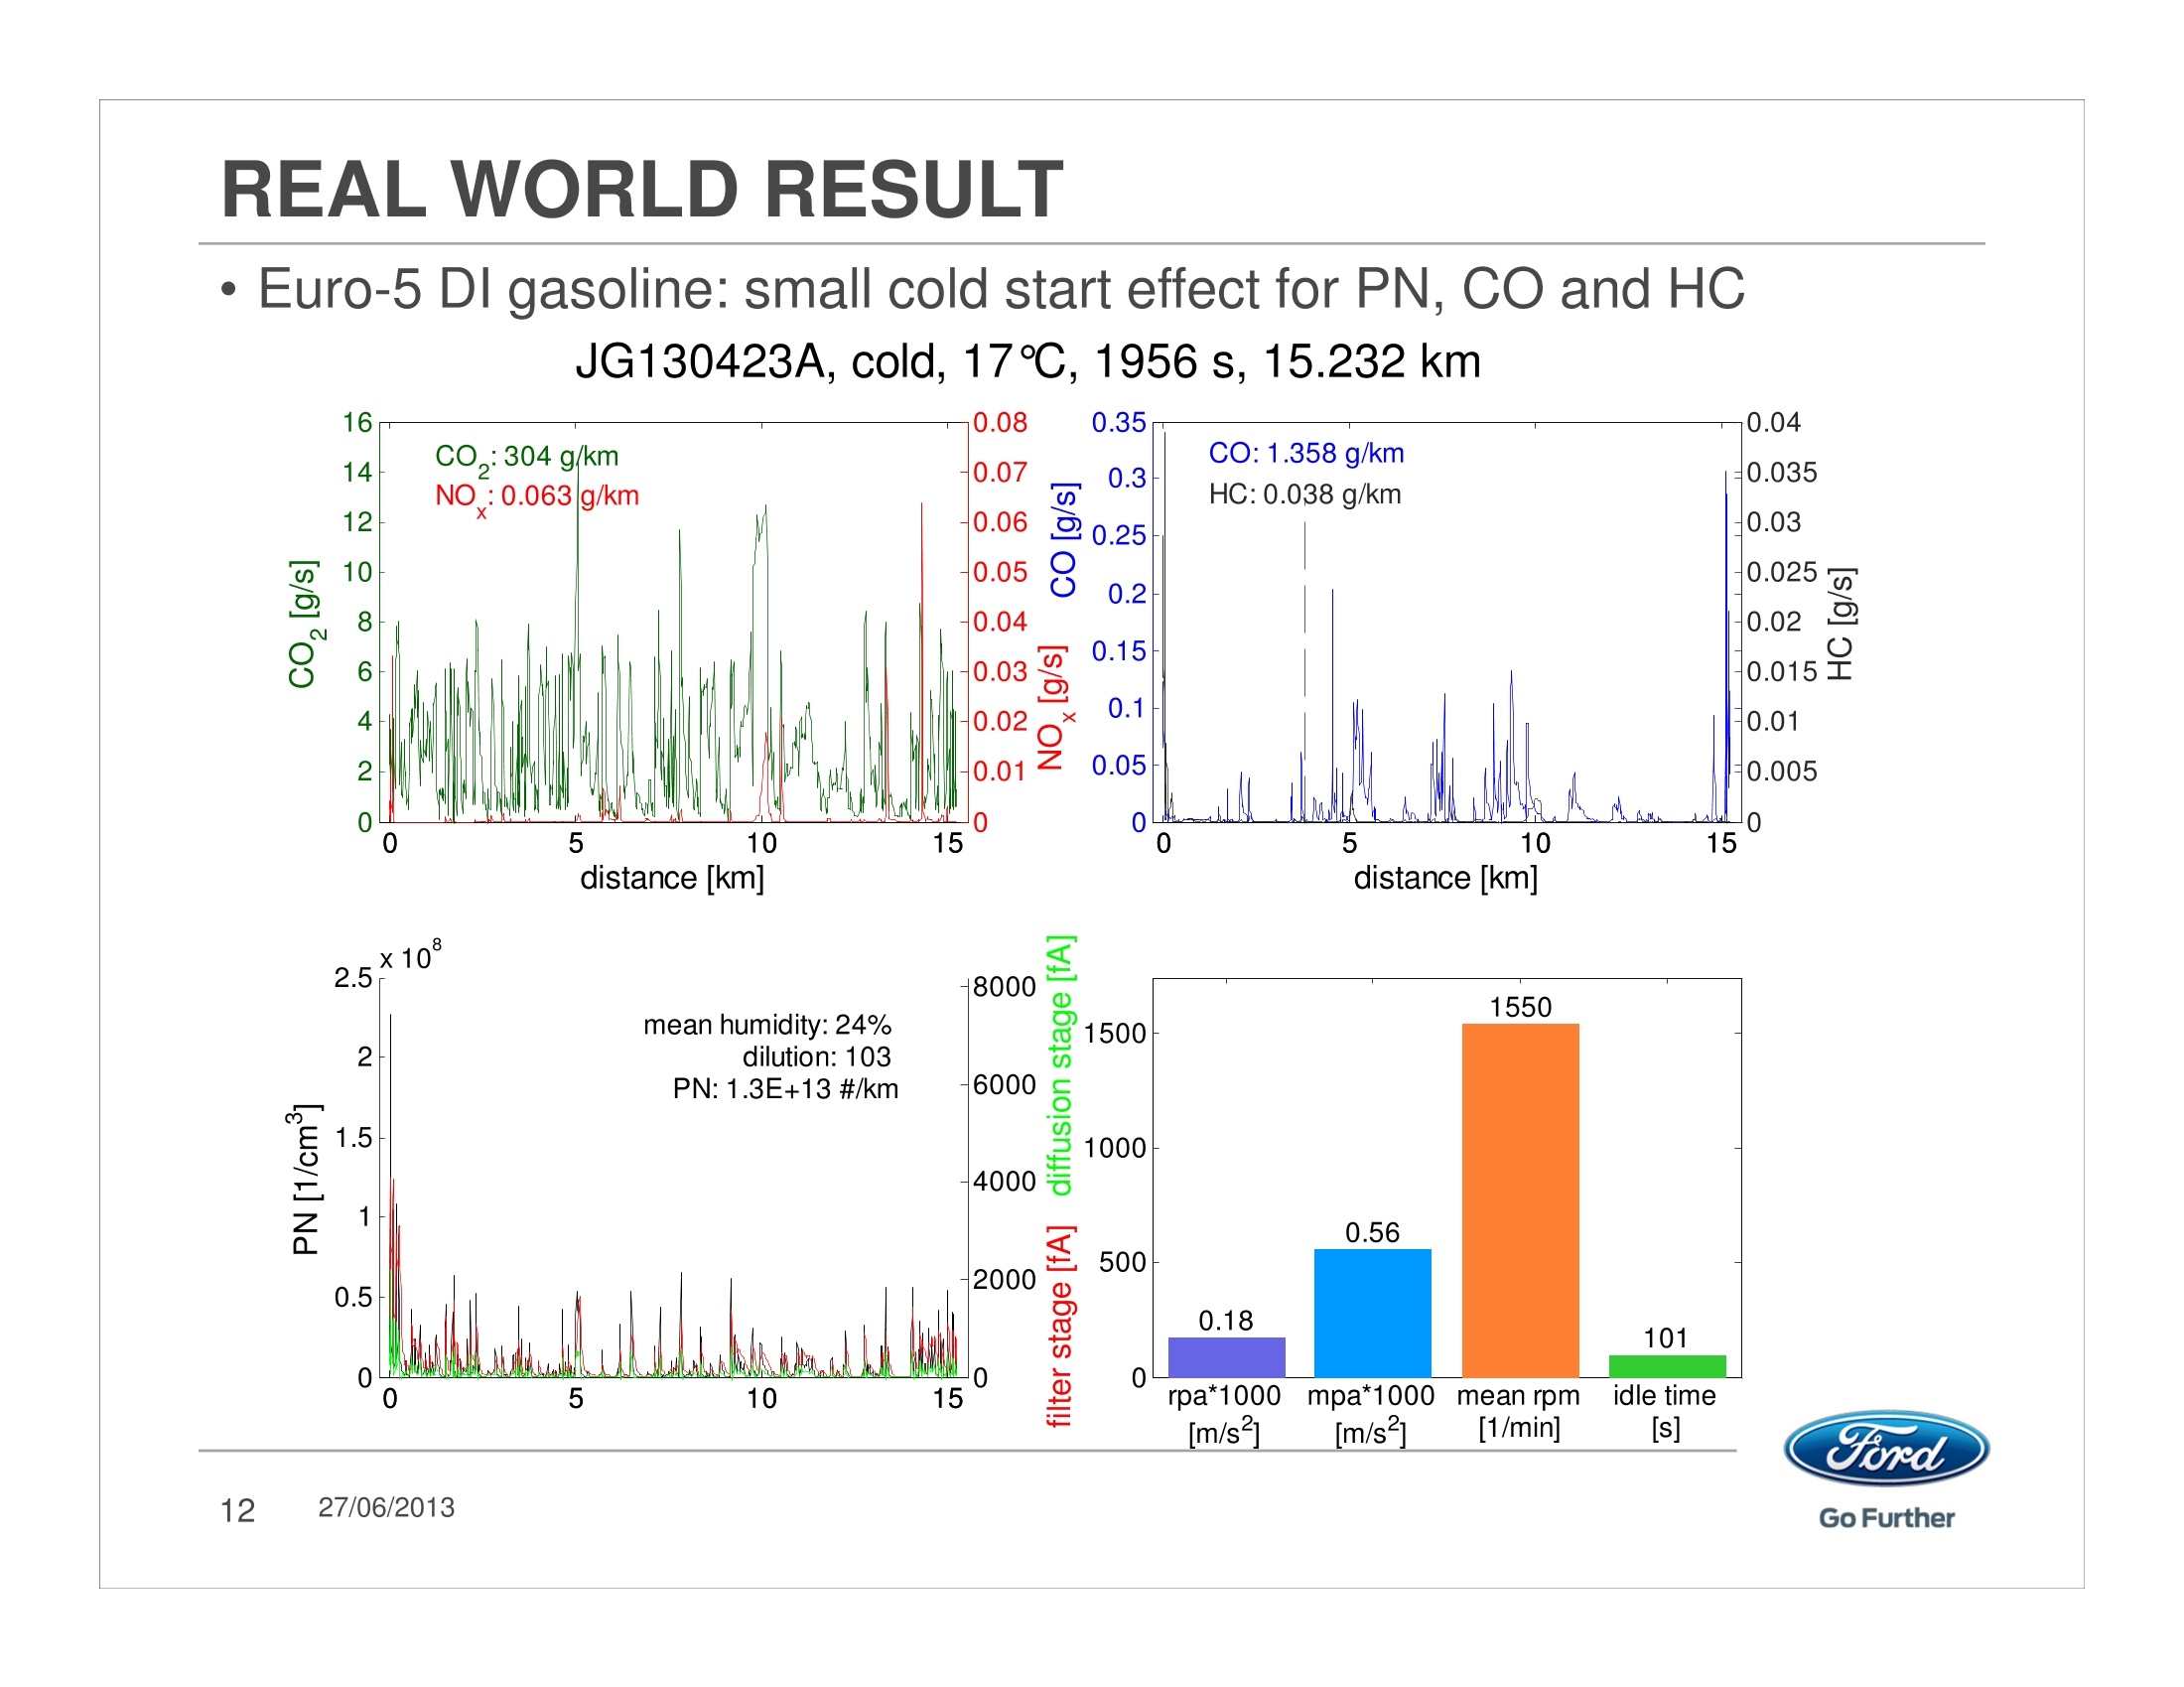
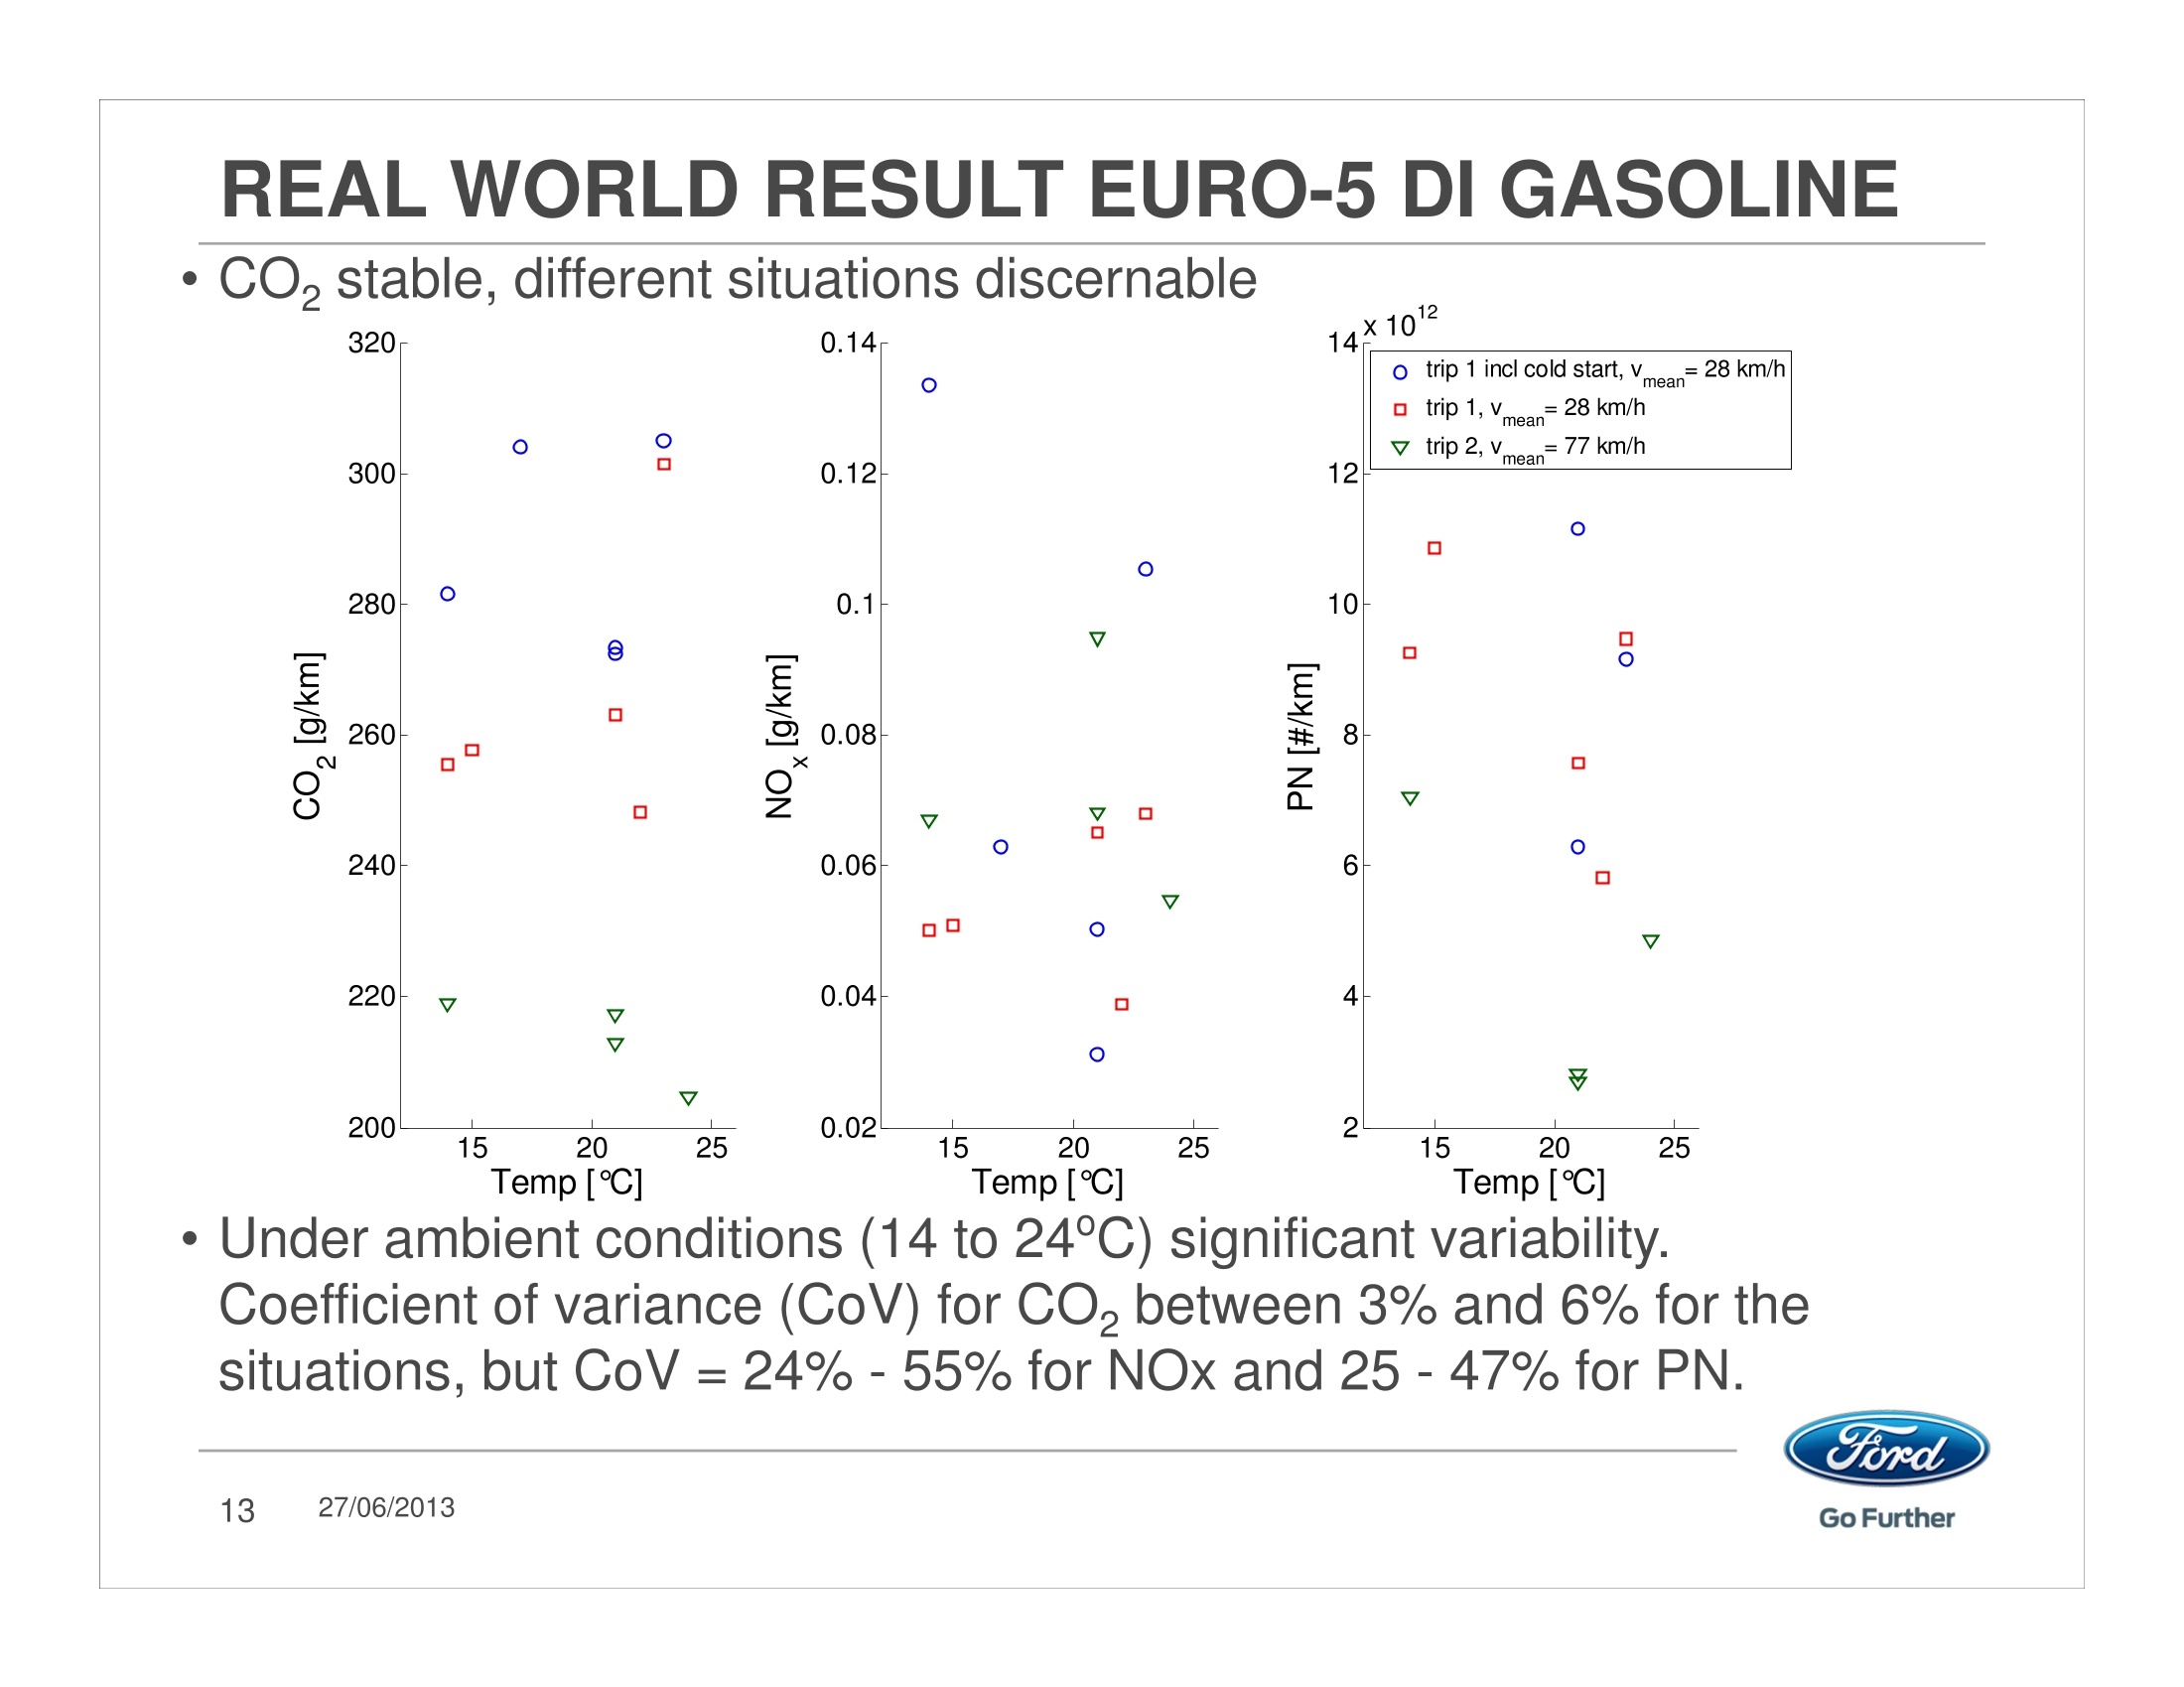
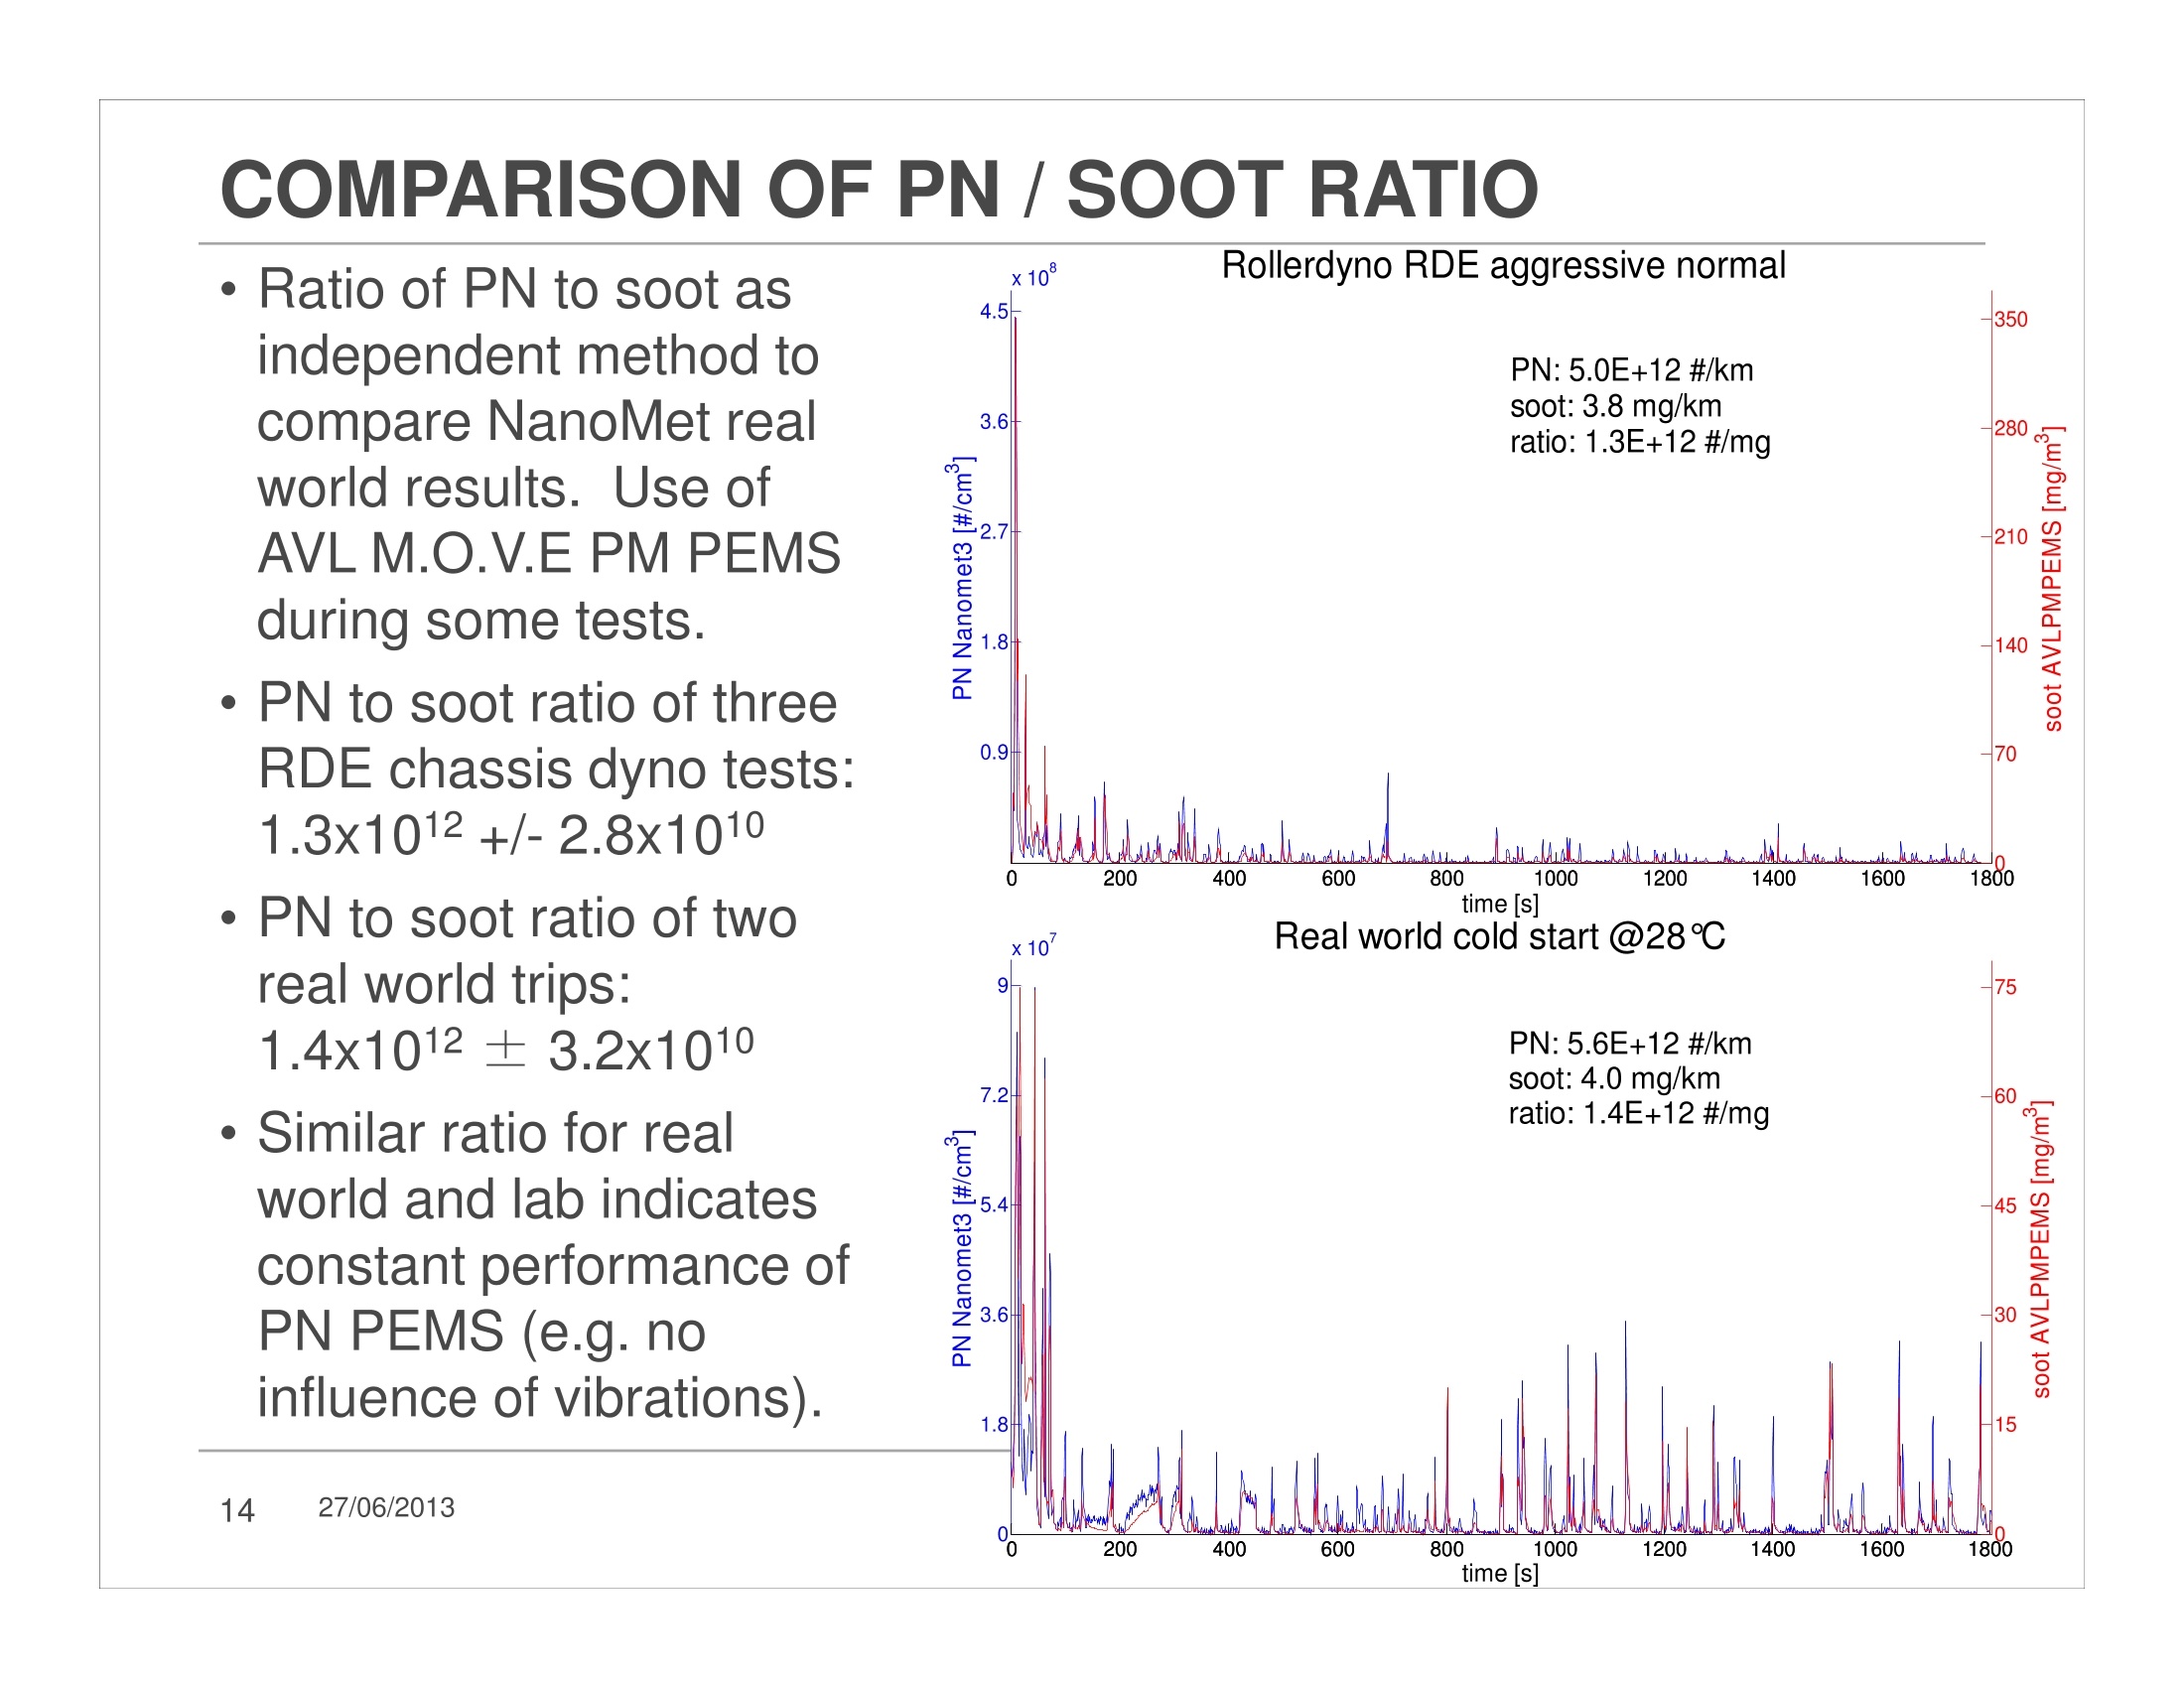
INTRODUCTION COMPARISON OF R83 PN WITH NANOMET3 Particle Number Emission of Light-DutyVehicles during Real-World Driving Ford Research & Advanced Engineering Aachen, Germany UIf Kirchner, Jens Gallus, Christoph Borensen andRainer Vogt ●· EU Commission works on development and implementation of ‘RealDriving Emissions'regulations for Euro-6.2. This is driven by air quality NO, standards, which were exceeded at12% of the stations in the EU (2006-2010) including Germany,Netherlands, Sweden, France, UK etc. ●Roadside measurement / real world driving by Member States indicatesreal driving NOx has not decreased as fast as expected - attributed toincreasing dieselization and different off-cycle NOx performance. Real Driving Emissions (RDE) of regulated gaseous compounds areunder development with Portable Emissions Measurement Systems(PEMS) for Light Duty (LD) vehicles. · Real driving Particle Number (PN) emissions are currently subject ofresearch. Instrumentation under development. The EU has started to investigate methods for real driving PNassessment. PN PEMS instrumentation appears to be a viablemethod. , TThe current laboratory PN instruments according to the PMP protocol/ R83 regulation arenot suited for mobileapplication. · In the NanoMet3instrument undilutedraw exhaust issampled and treatedsimilar to R83. Adifferent detector isused instead of aPNC. Parallel measurement of NanoMet3 sampling raw tailpipe exhaust andconstant volume sampler (CVS) diluted exhaust R83 PN measurement 4 27/06/2013 EXAMPLE OF CORRELATION WITH CVS ·Euro-5 DI gasoline vehicle: similar emission factors with PEMS and Dyno Time alignment by calculation of least squares ●· Fair correlation of peaks, however higher and narrower PEMS peaks Euro-5 diesel vehicle: more than one order of magnitude difference inemission factor · Poor correlation of peaks, (time alignment by least squares) Lwww.. ALAA CORRELATION WITH CVS FOR DIESEL CARS ·Diesel vehicles: NanoMet3 PN 43% higher than CVS. ·Limit of detection ~1x10¹⁰km-1. · Smaller difference between NanoMet3 and CVS for all testedvehicles, when also higher emissions are included. CORRELATION MAP PN PEMS-CVSI ●Euro5 Diesel & DI gasoline on NEDC, WLTC, RDE example cycles · Good correlation between NanoMet3 and R83 PMP (slope 0.85) x10" CORRELATION MAP PN PEMS - CVSII Euro5 Diesel & DI gasoline on NEDC, WLTC, RDE example cycles. ·Detection limit of ~1x 10¹⁰ km-1 visible. 1013 Euro5 Diesel NEDC Euro5 Diesel WLTC Euro5 Gasoline 1 NEDC ,10"12ao七 Euro5 Gasoline 1 NEDC 1-300s Euro5 Gasoline 2 RDE 1:1 correlation 10 10010 10° 1010° 10° 101 10'11 10012 10*13 CVS PN [#/km1 ●Semtech-DS gas PEMS and NanoMet3 PN PEMS connected both toEFM3 exhaust flow meter. Power supply by lead acid batteries. ●Additional weight of both PEMS and batteries ~210 kg. Urban trip: Autobahn route: - Mainly urban trip throughAachenincluding cold start phase -Hot start 50.5 km, ca. 40 min - Small amount of high speed partsbetween 50 and 70 km/h -15.6 km, ca. 32 min Go Further ●Euro-5 DI gasoline: small cold start effect for PN, CO and HCJG130423A, cold, 17℃, 1956 s, 15.232 km REAL WORLD RESULT EURO-5 DI GASOLINE CO, stable, different situations discernable ●Under ambient conditions (14 to 24℃) significant variability.Coefficient of variance (CoV) for CO, between 3% and 6% for thesituations, but CoV=24%-55% for NOx and 25-47% for PN. Rollerdyno RDE aggressive normal . Ratio of PN to soot asindependent method tocompare NanoMet realworld results.Use of ,E#AVL M.O.V.E PM PEMSduring some tests. oEcz1.8 x 10° 4.5- -350 PN:5.0E+12 #/km 3.6- soot: 3.8 mg/km -280 ratio: 1.3E+12 #/mg -210 Ewaa-140>o ·PN to soot ratio of threeRDE chassis dyno tests: 0.9-1.3x10¹² +/-2.8x1010 -70 MALA MMA 0 200 400 600 800 1000 1200 1400 1600 1800 · PN to soot ratio of twoeal world trips: 9-1.4x10¹² ±3.2x10¹⁰ time[S] x10' Real world cold start @28℃ -75 PN: 5.6E+12 #/km soot: 4.0 mg/km 7.2- 60 Similar ratio for realEworld and lab indicates 5.4constant performance of oEcPN PEMS(e.g. no 3.6ainfluence of vibrations). ratio: 1.4E+12 #/mg -45 EEzaa-30> 1.8 15 200 1800 time [S] PN EMISSION OF EURO-4/5 VEHICLES · Real World Trips are in the same range as literature values13 · Laboratory comparison of NanoMet3 with R83 PN measurement:aood correlation at 1012 km-1 level with deviations <15%,●· At a level of 101 km-1 up to 43% difference, limit of detection~1x10¹⁰ km-1. ●· Under ambient conditions (14 to 24°℃) significant variability:Coefficient of variance (CoV) for CO,3%-6% for the situations, butCoV=24%-55% for NOx and 25%-47% for PN. ●Real world driving PN emissions were in the range of results reportedin literature or measured with RDE example cycles and WLTC in thelaboratory. · For application as legal procedure much more work is needed: - further correlations and robust characterization of the internalcalibration, method to repeat or verify calibration,- find solution for extra weight, package, power consumption,-definition of boundary conditions and evaluation method. ●The authors would like to thank Andreas Neidel. Pascal Winistorferand Dr. Luis Cachon from Matter Aerosol AG for their support andvery helpful discussions. Go Further o Further
确定


还剩15页未读,是否继续阅读?

产品配置单
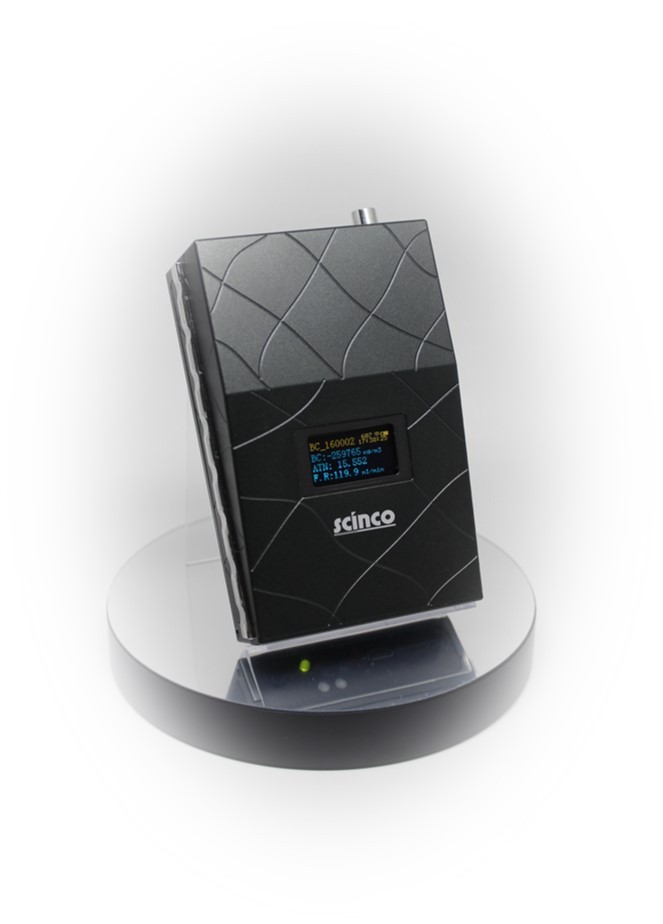
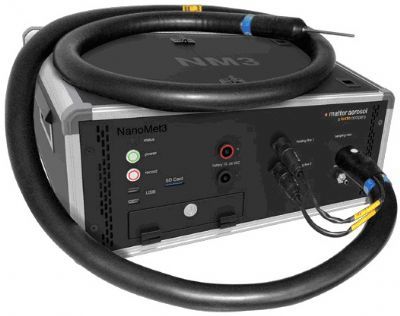
厦门通创检测技术有限公司为您提供《柴油车实际道路行驶过程中颗粒物数量排放规律检测方案(气溶胶)》,该方案主要用于车身及附件中理化分析检测,参考标准--,《柴油车实际道路行驶过程中颗粒物数量排放规律检测方案(气溶胶)》用到的仪器有testo Nanomet3便携式纳米颗粒物测试系统
推荐专场