


生物固体改良农业土壤中大肠杆菌存活和其他肠道微生物存在的实地调查Field investigations on the survival of Escherichia coli and presence of other enteric micro-organisms in biosolids-amended agricultural soil
方案详情

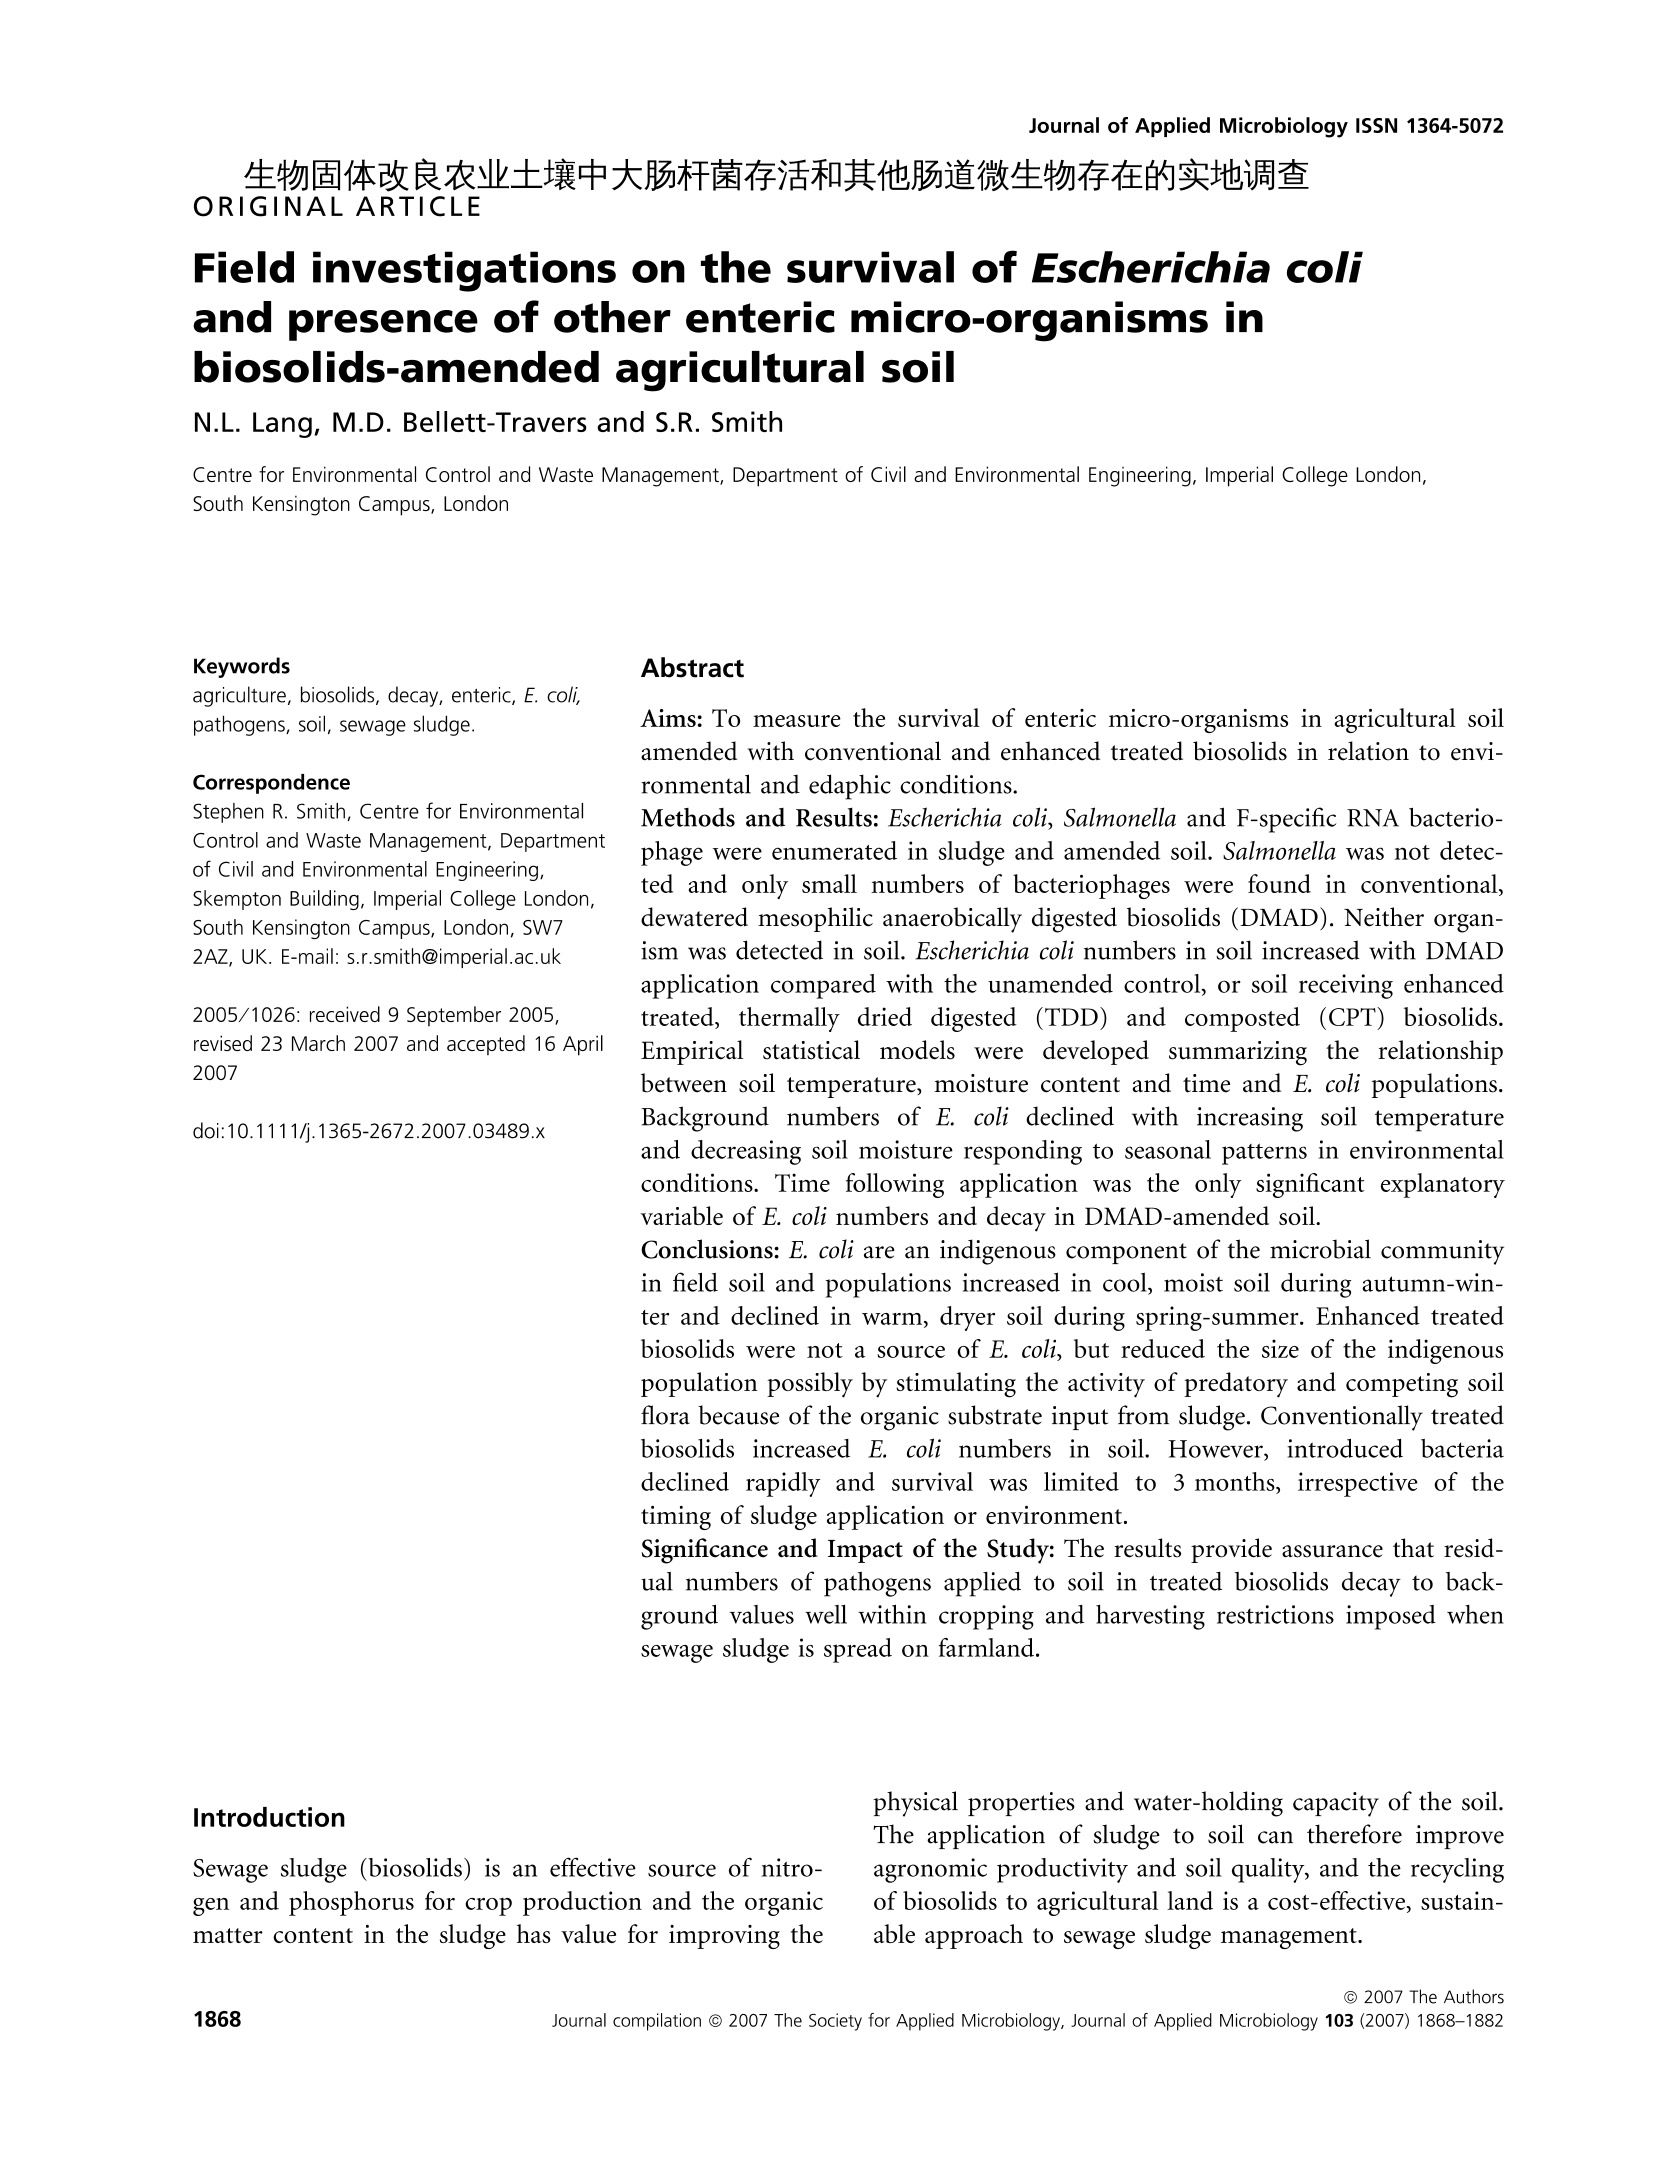
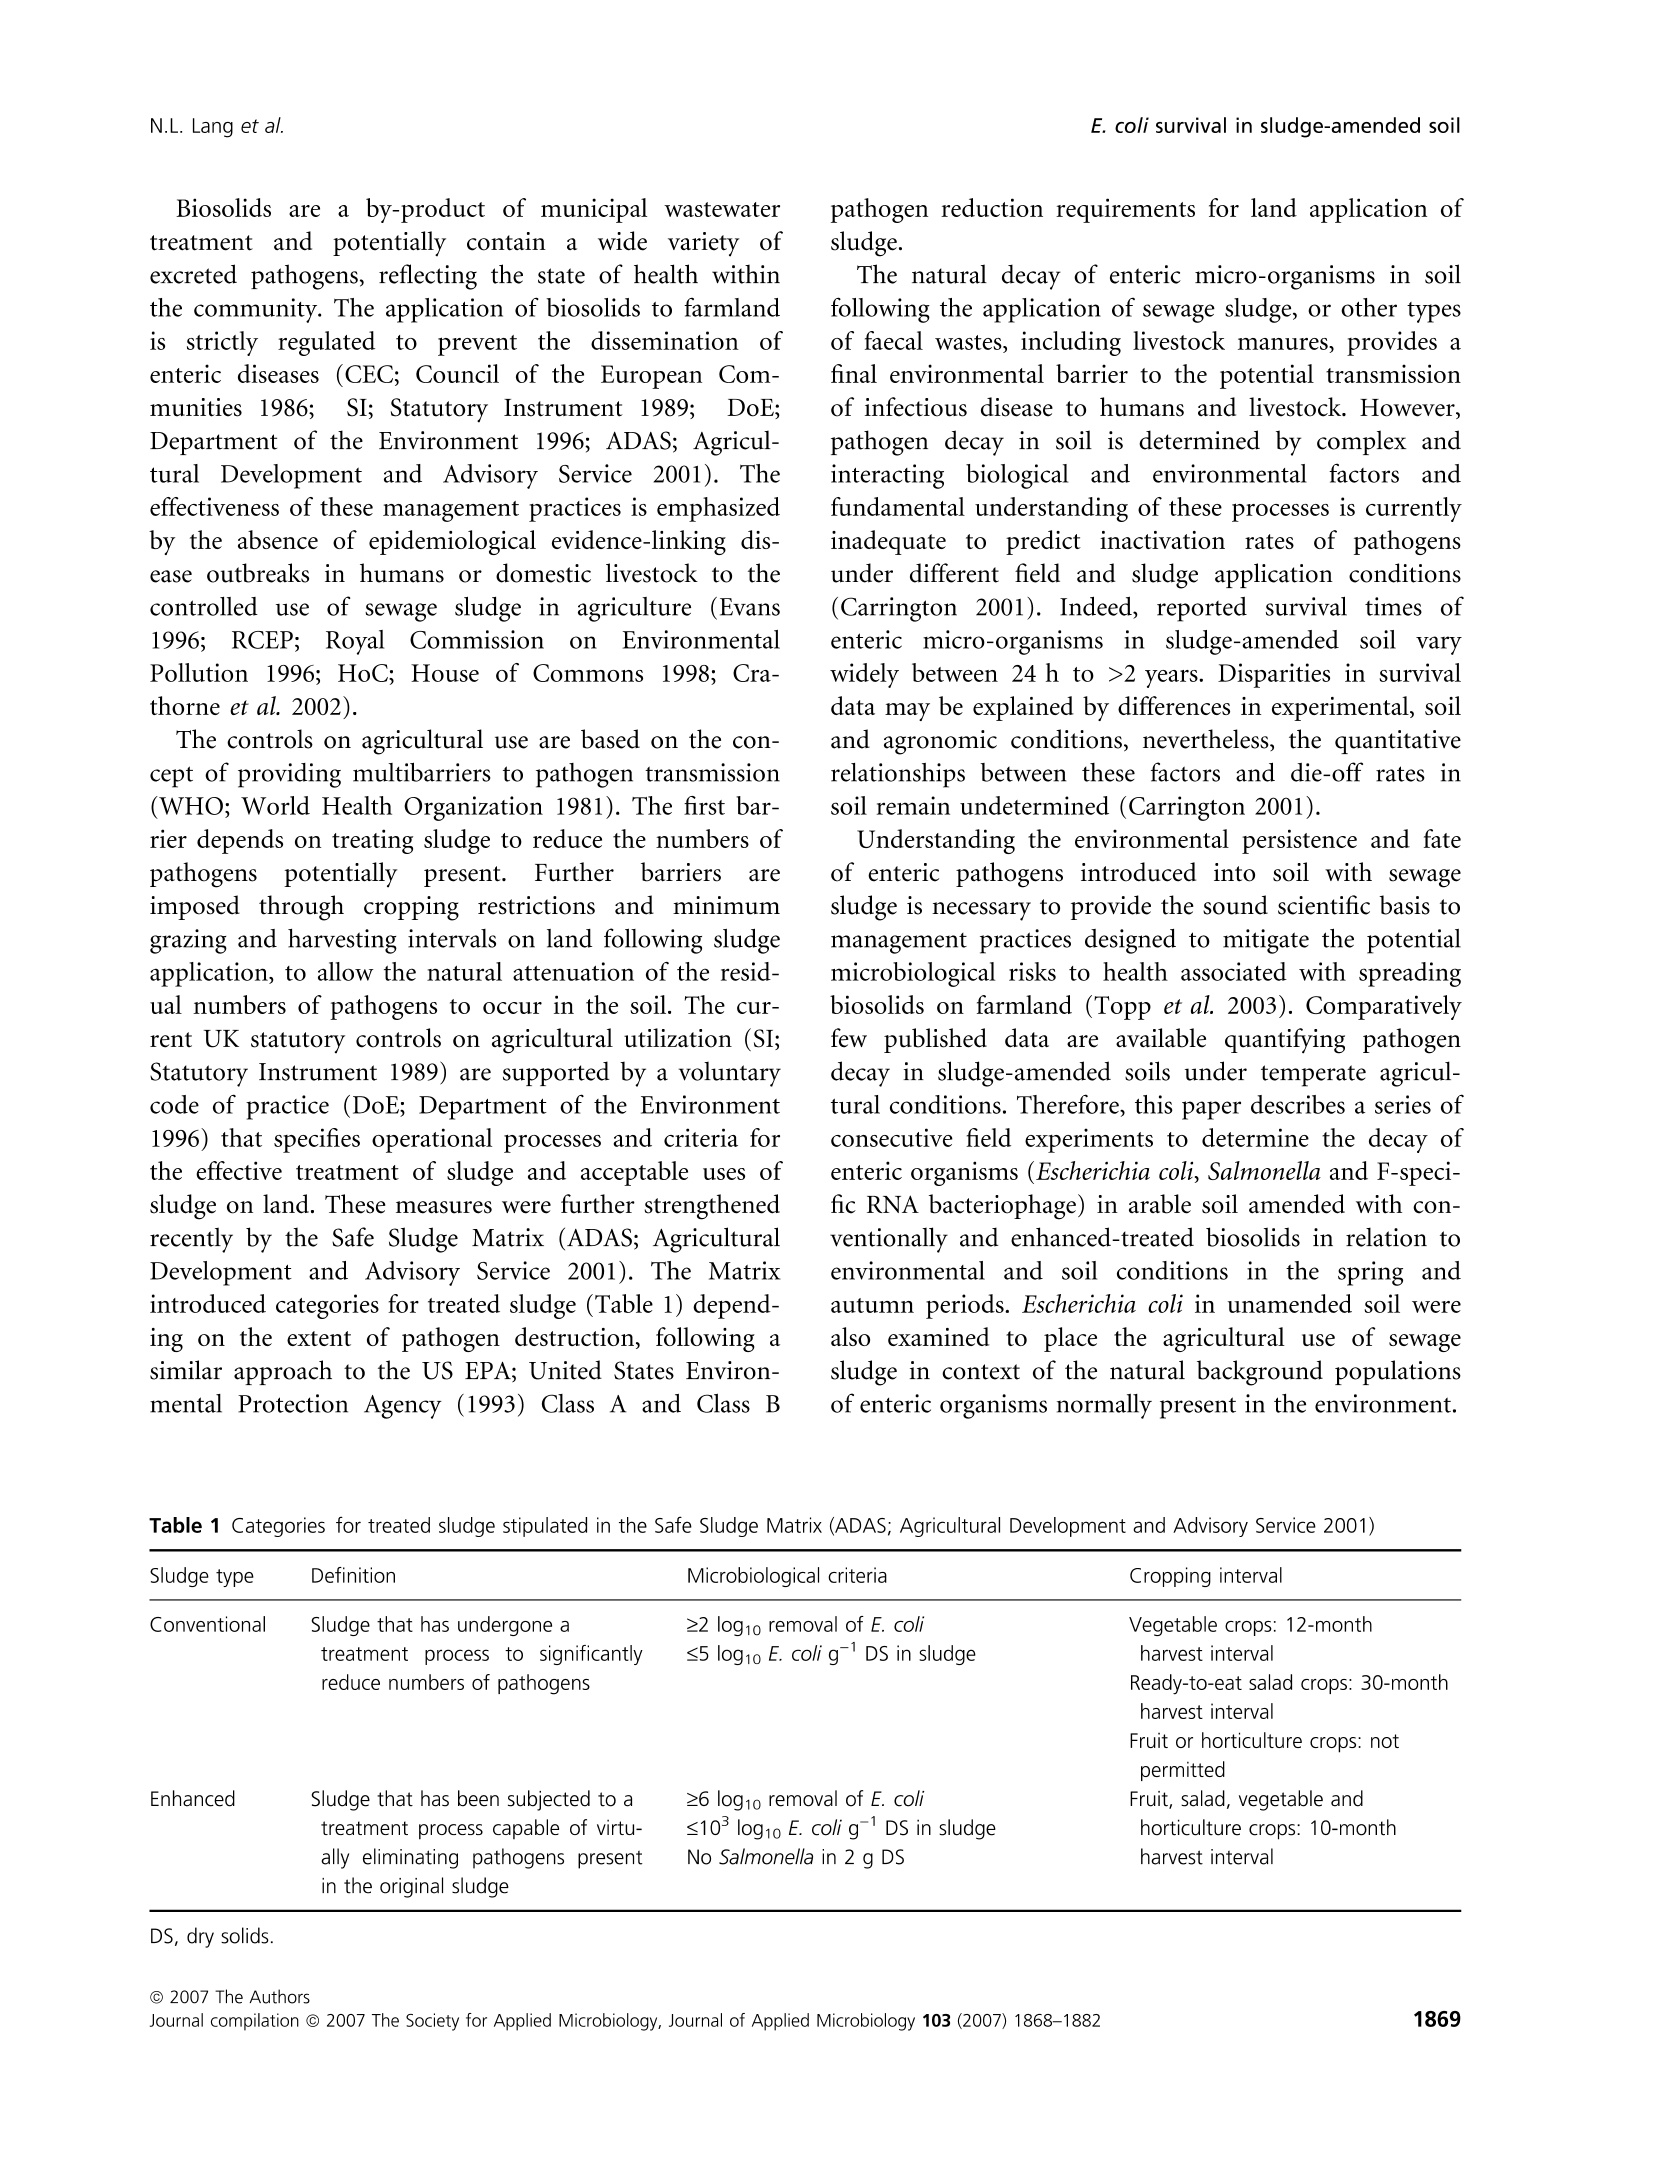
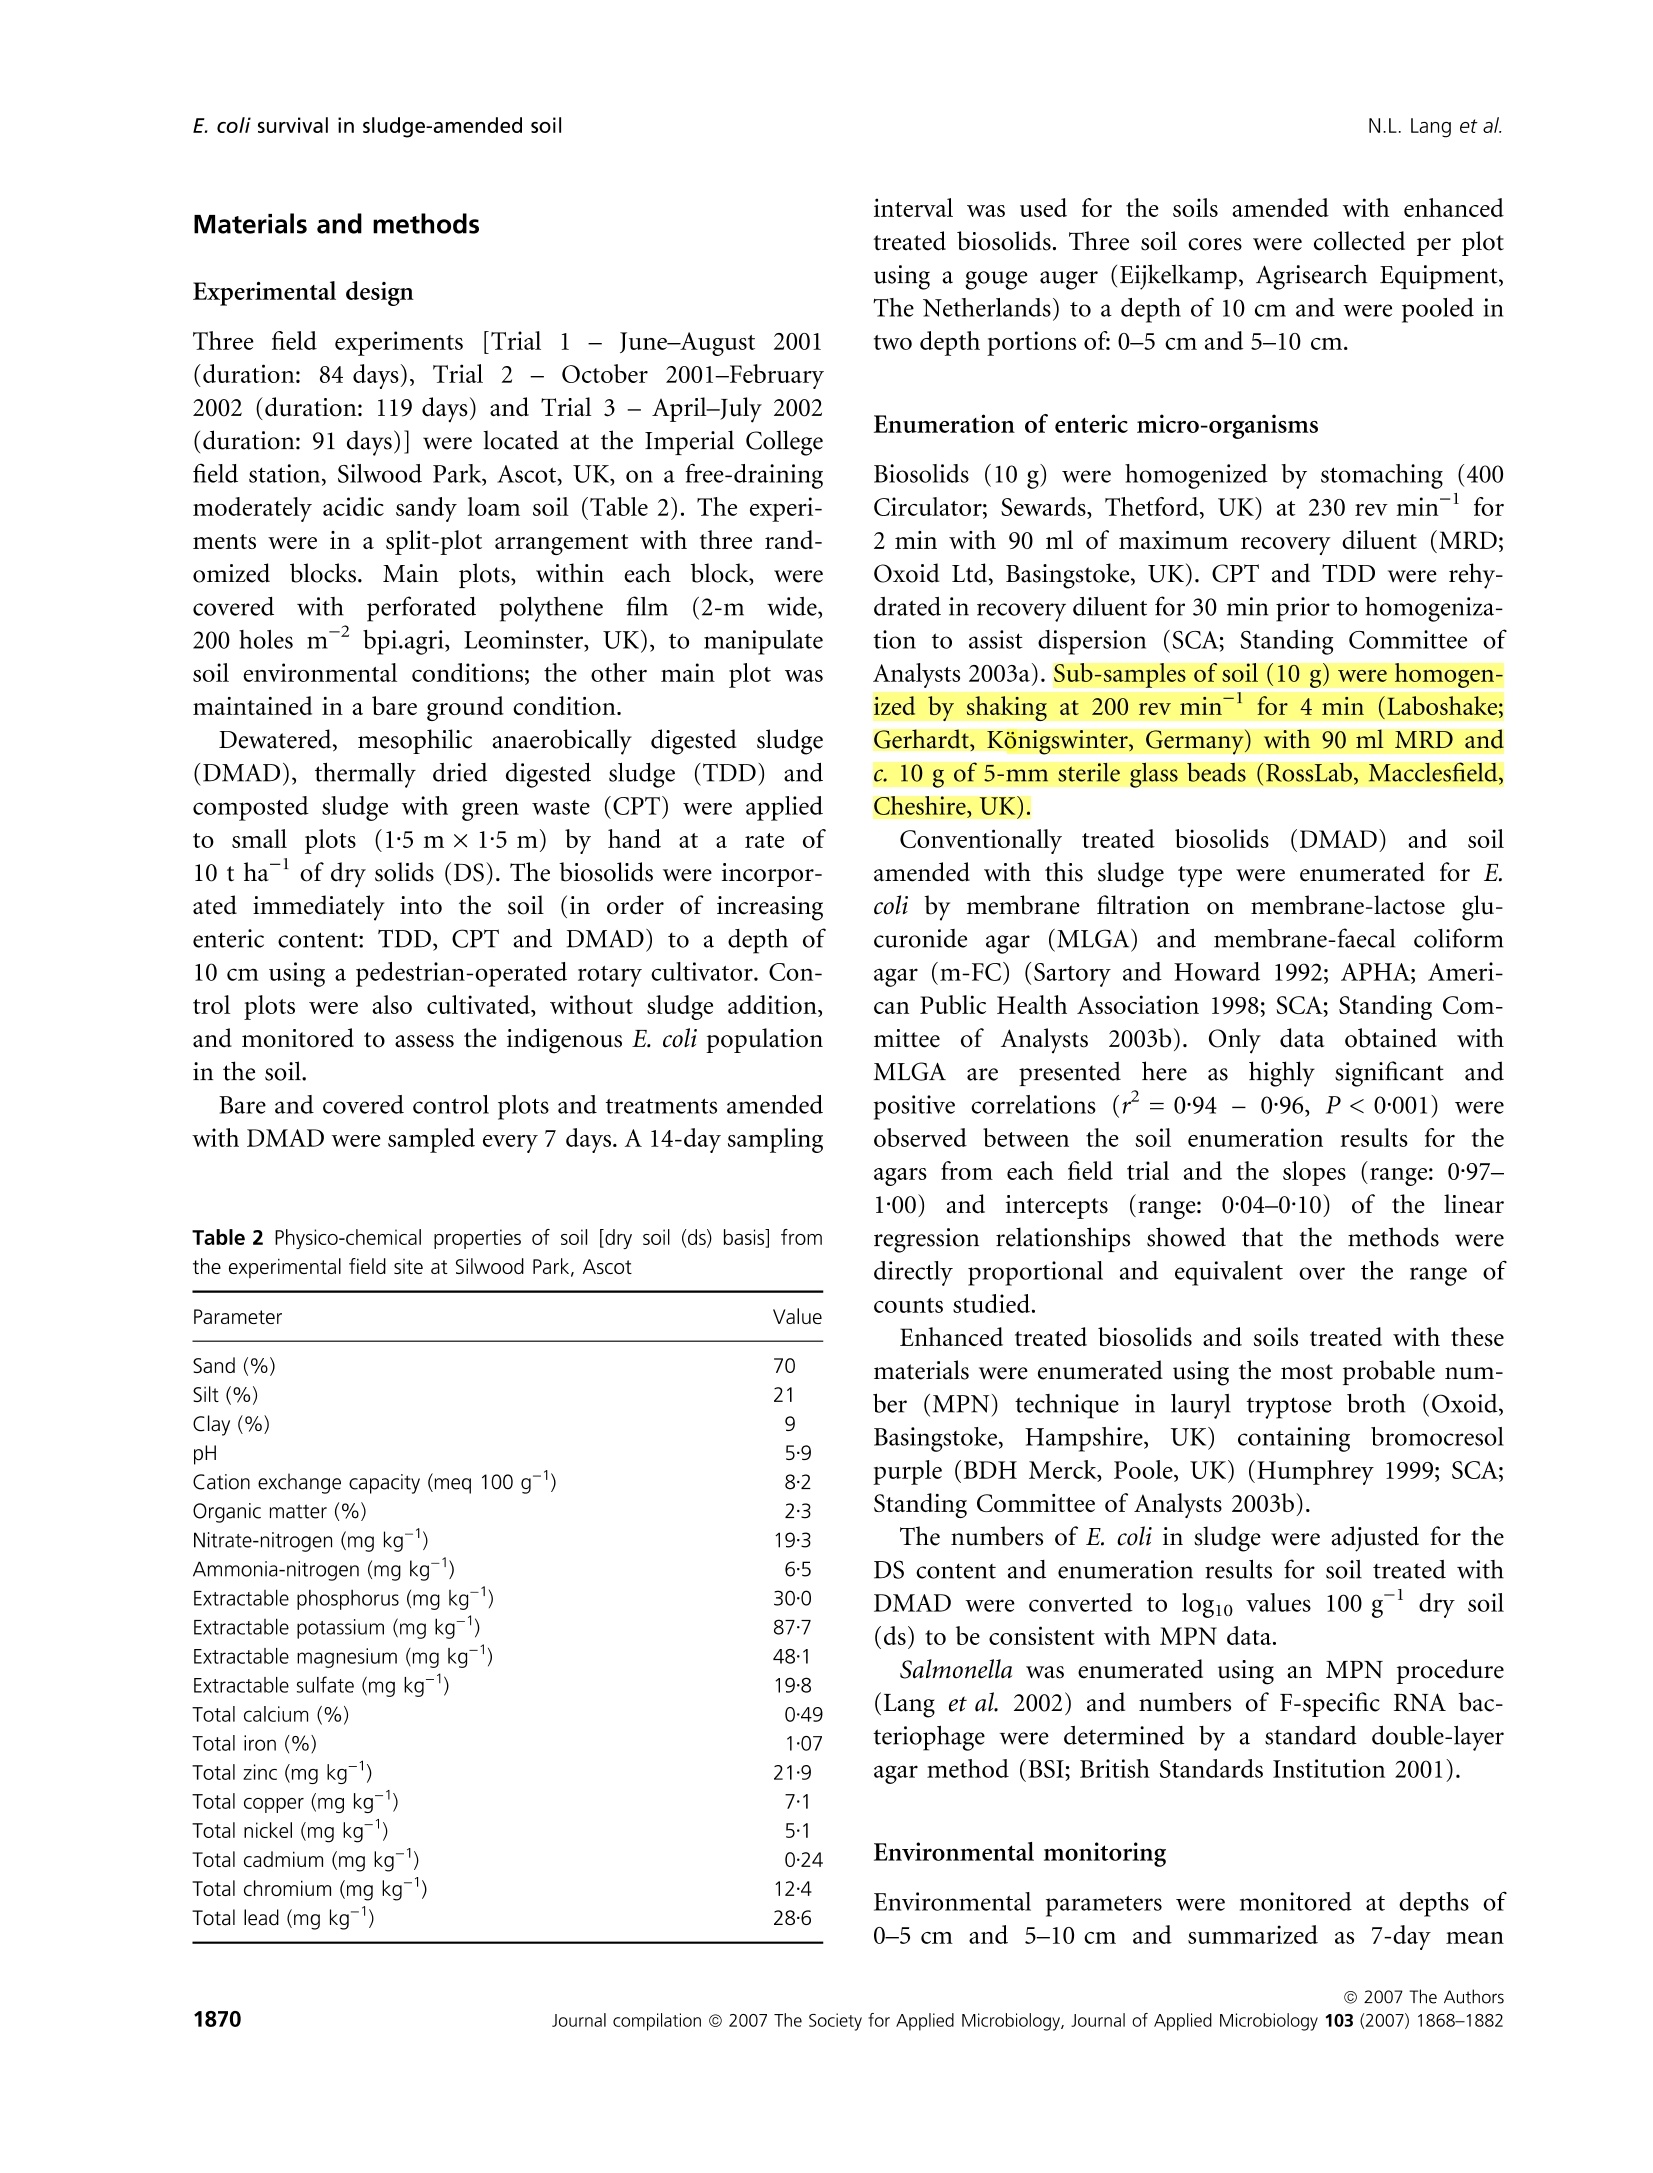
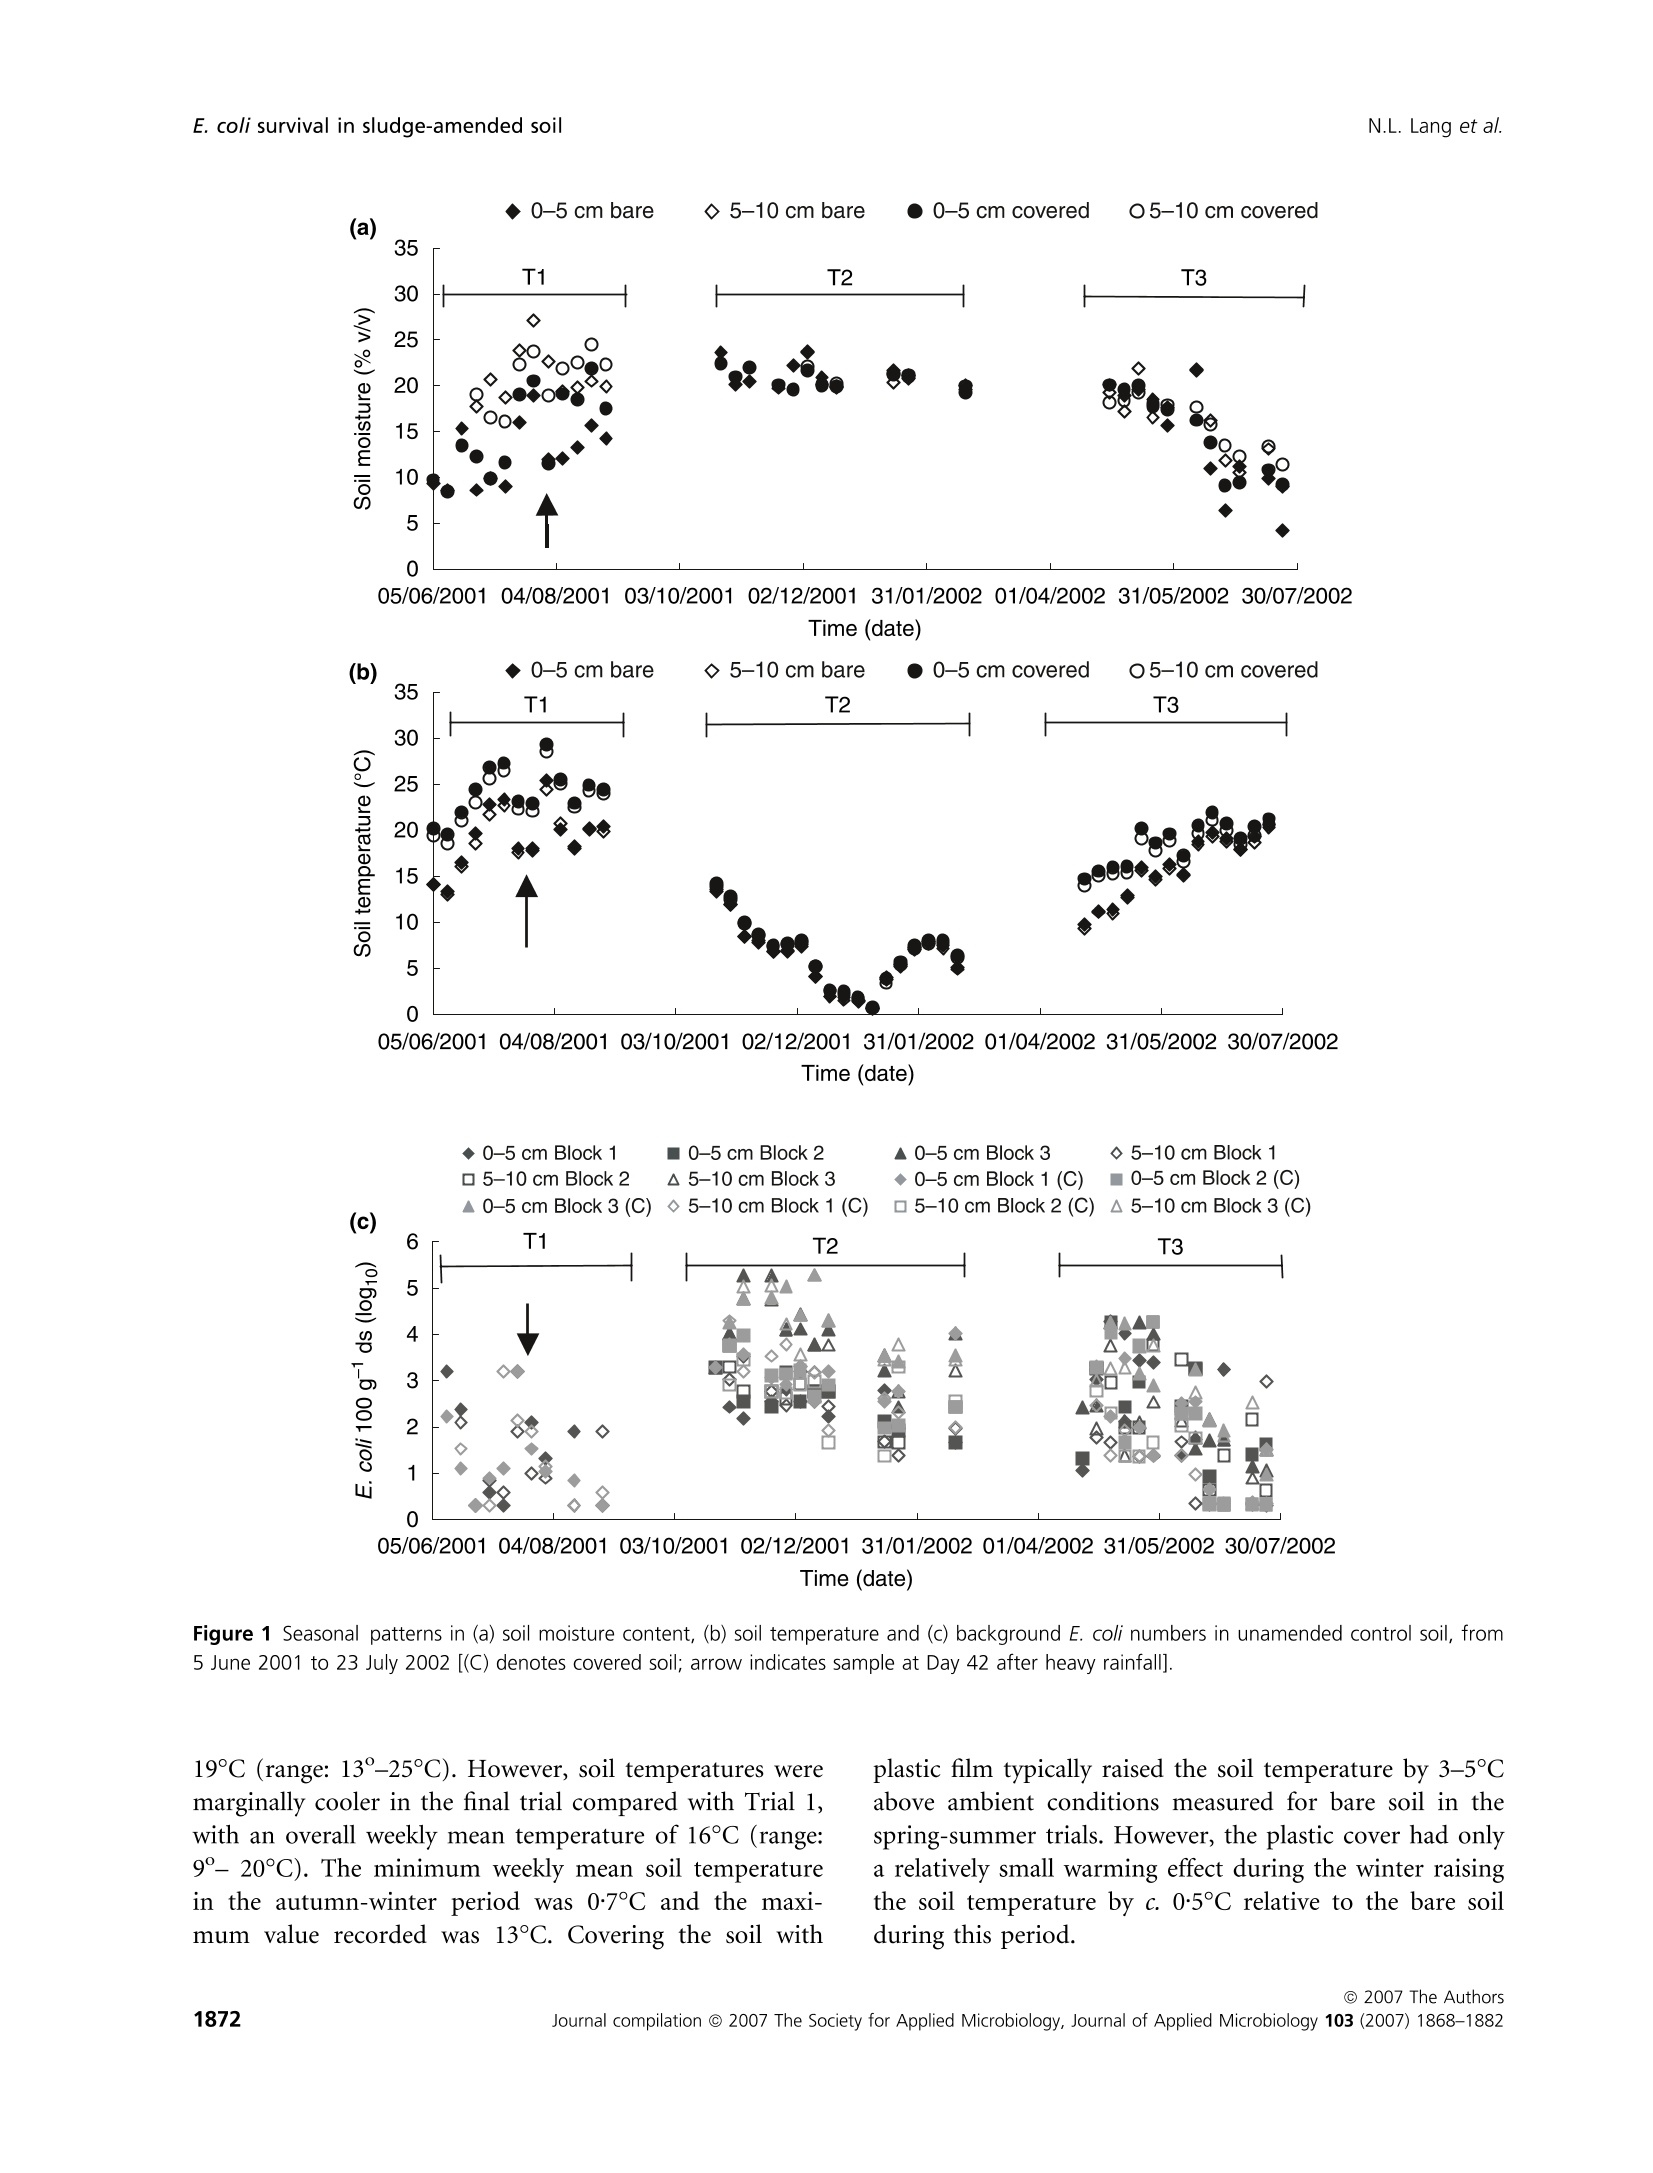
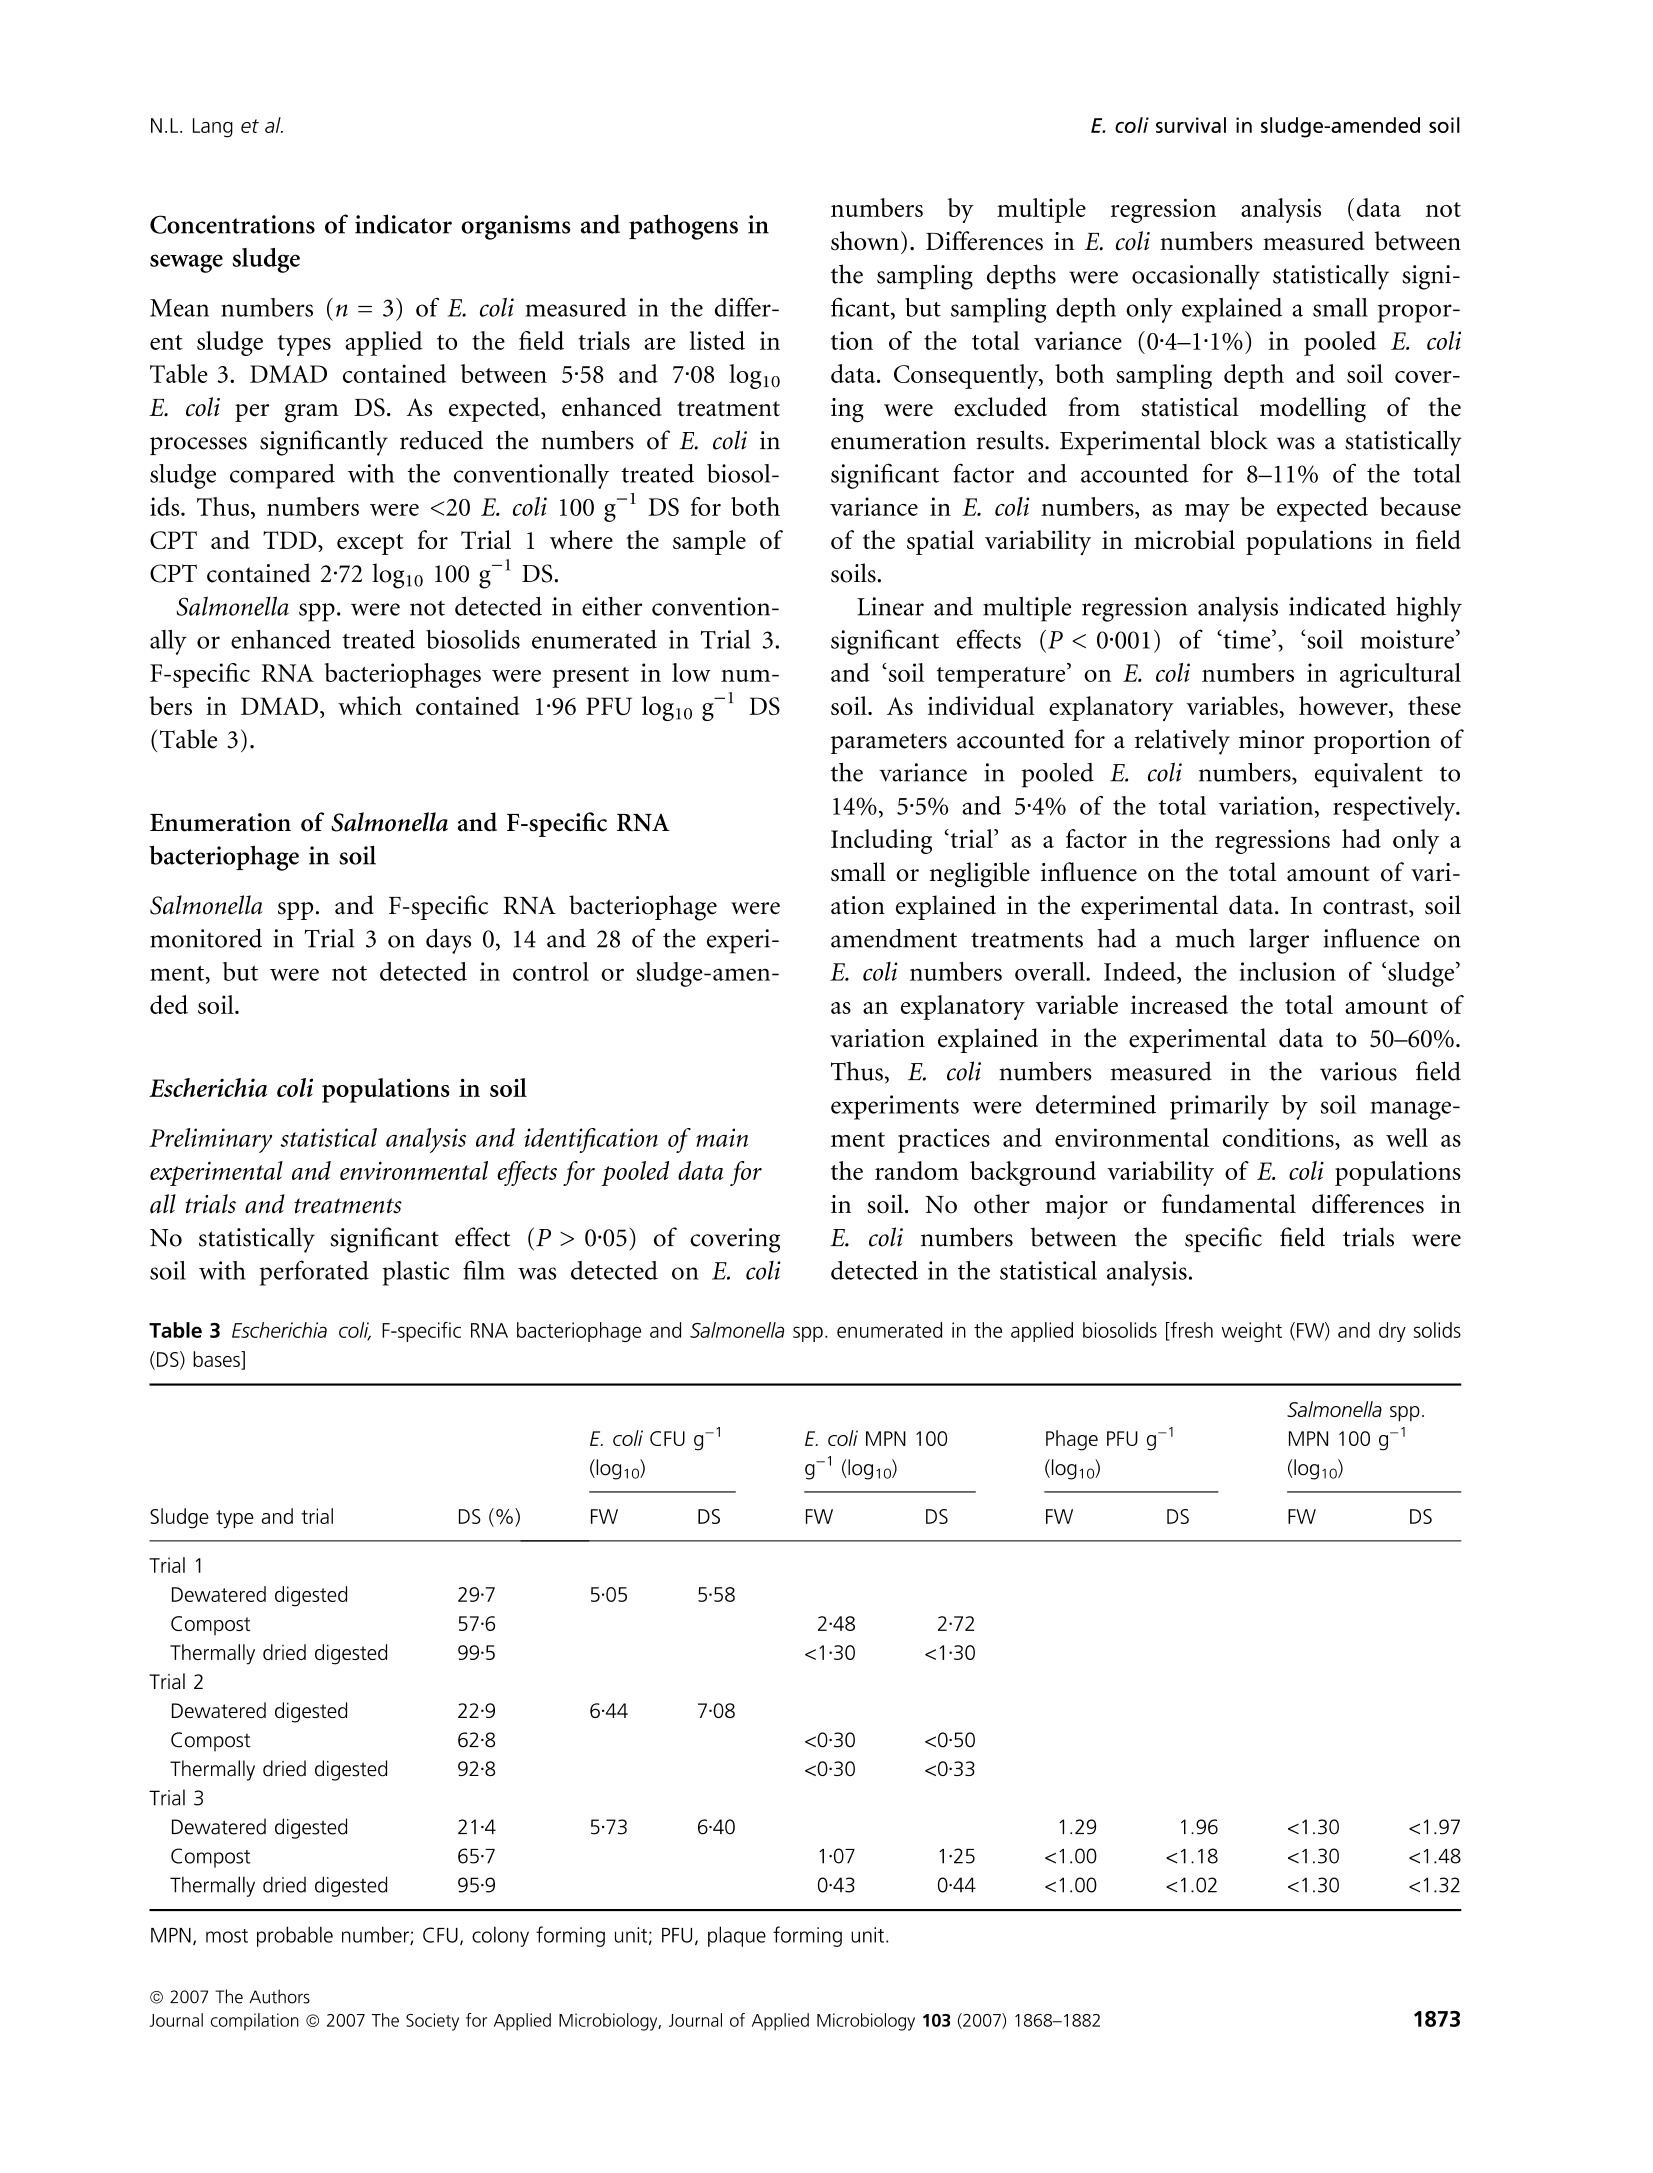
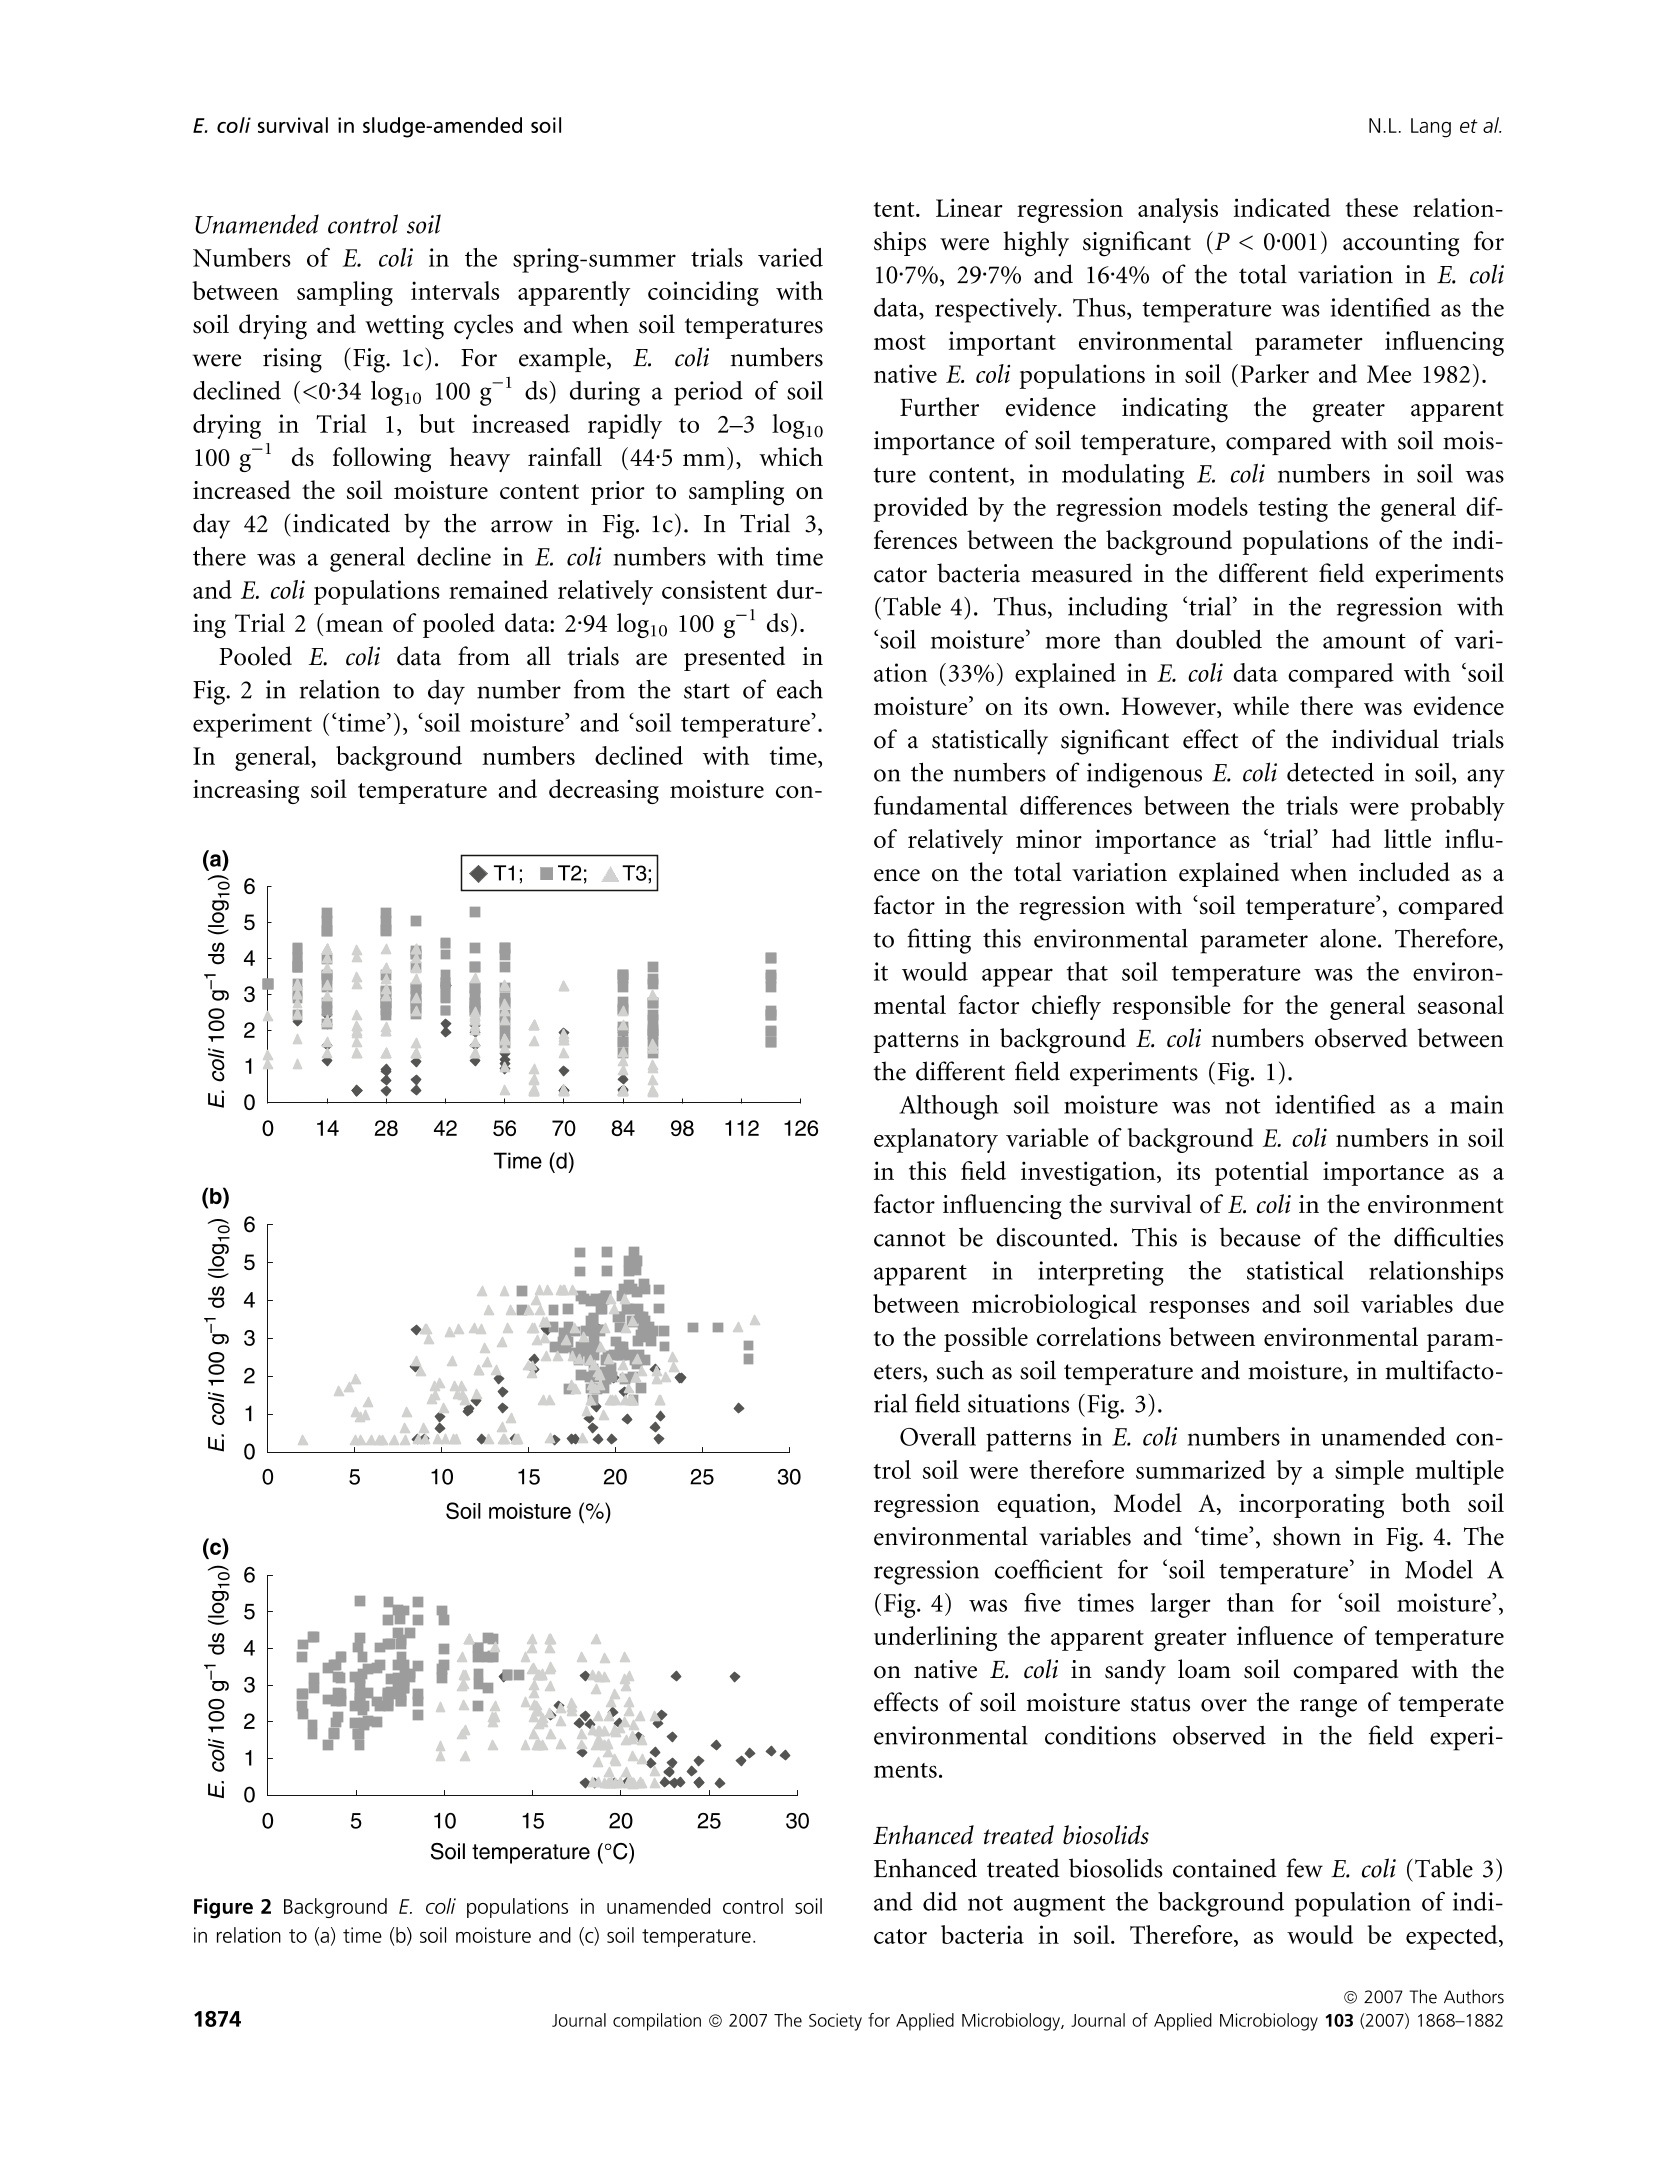
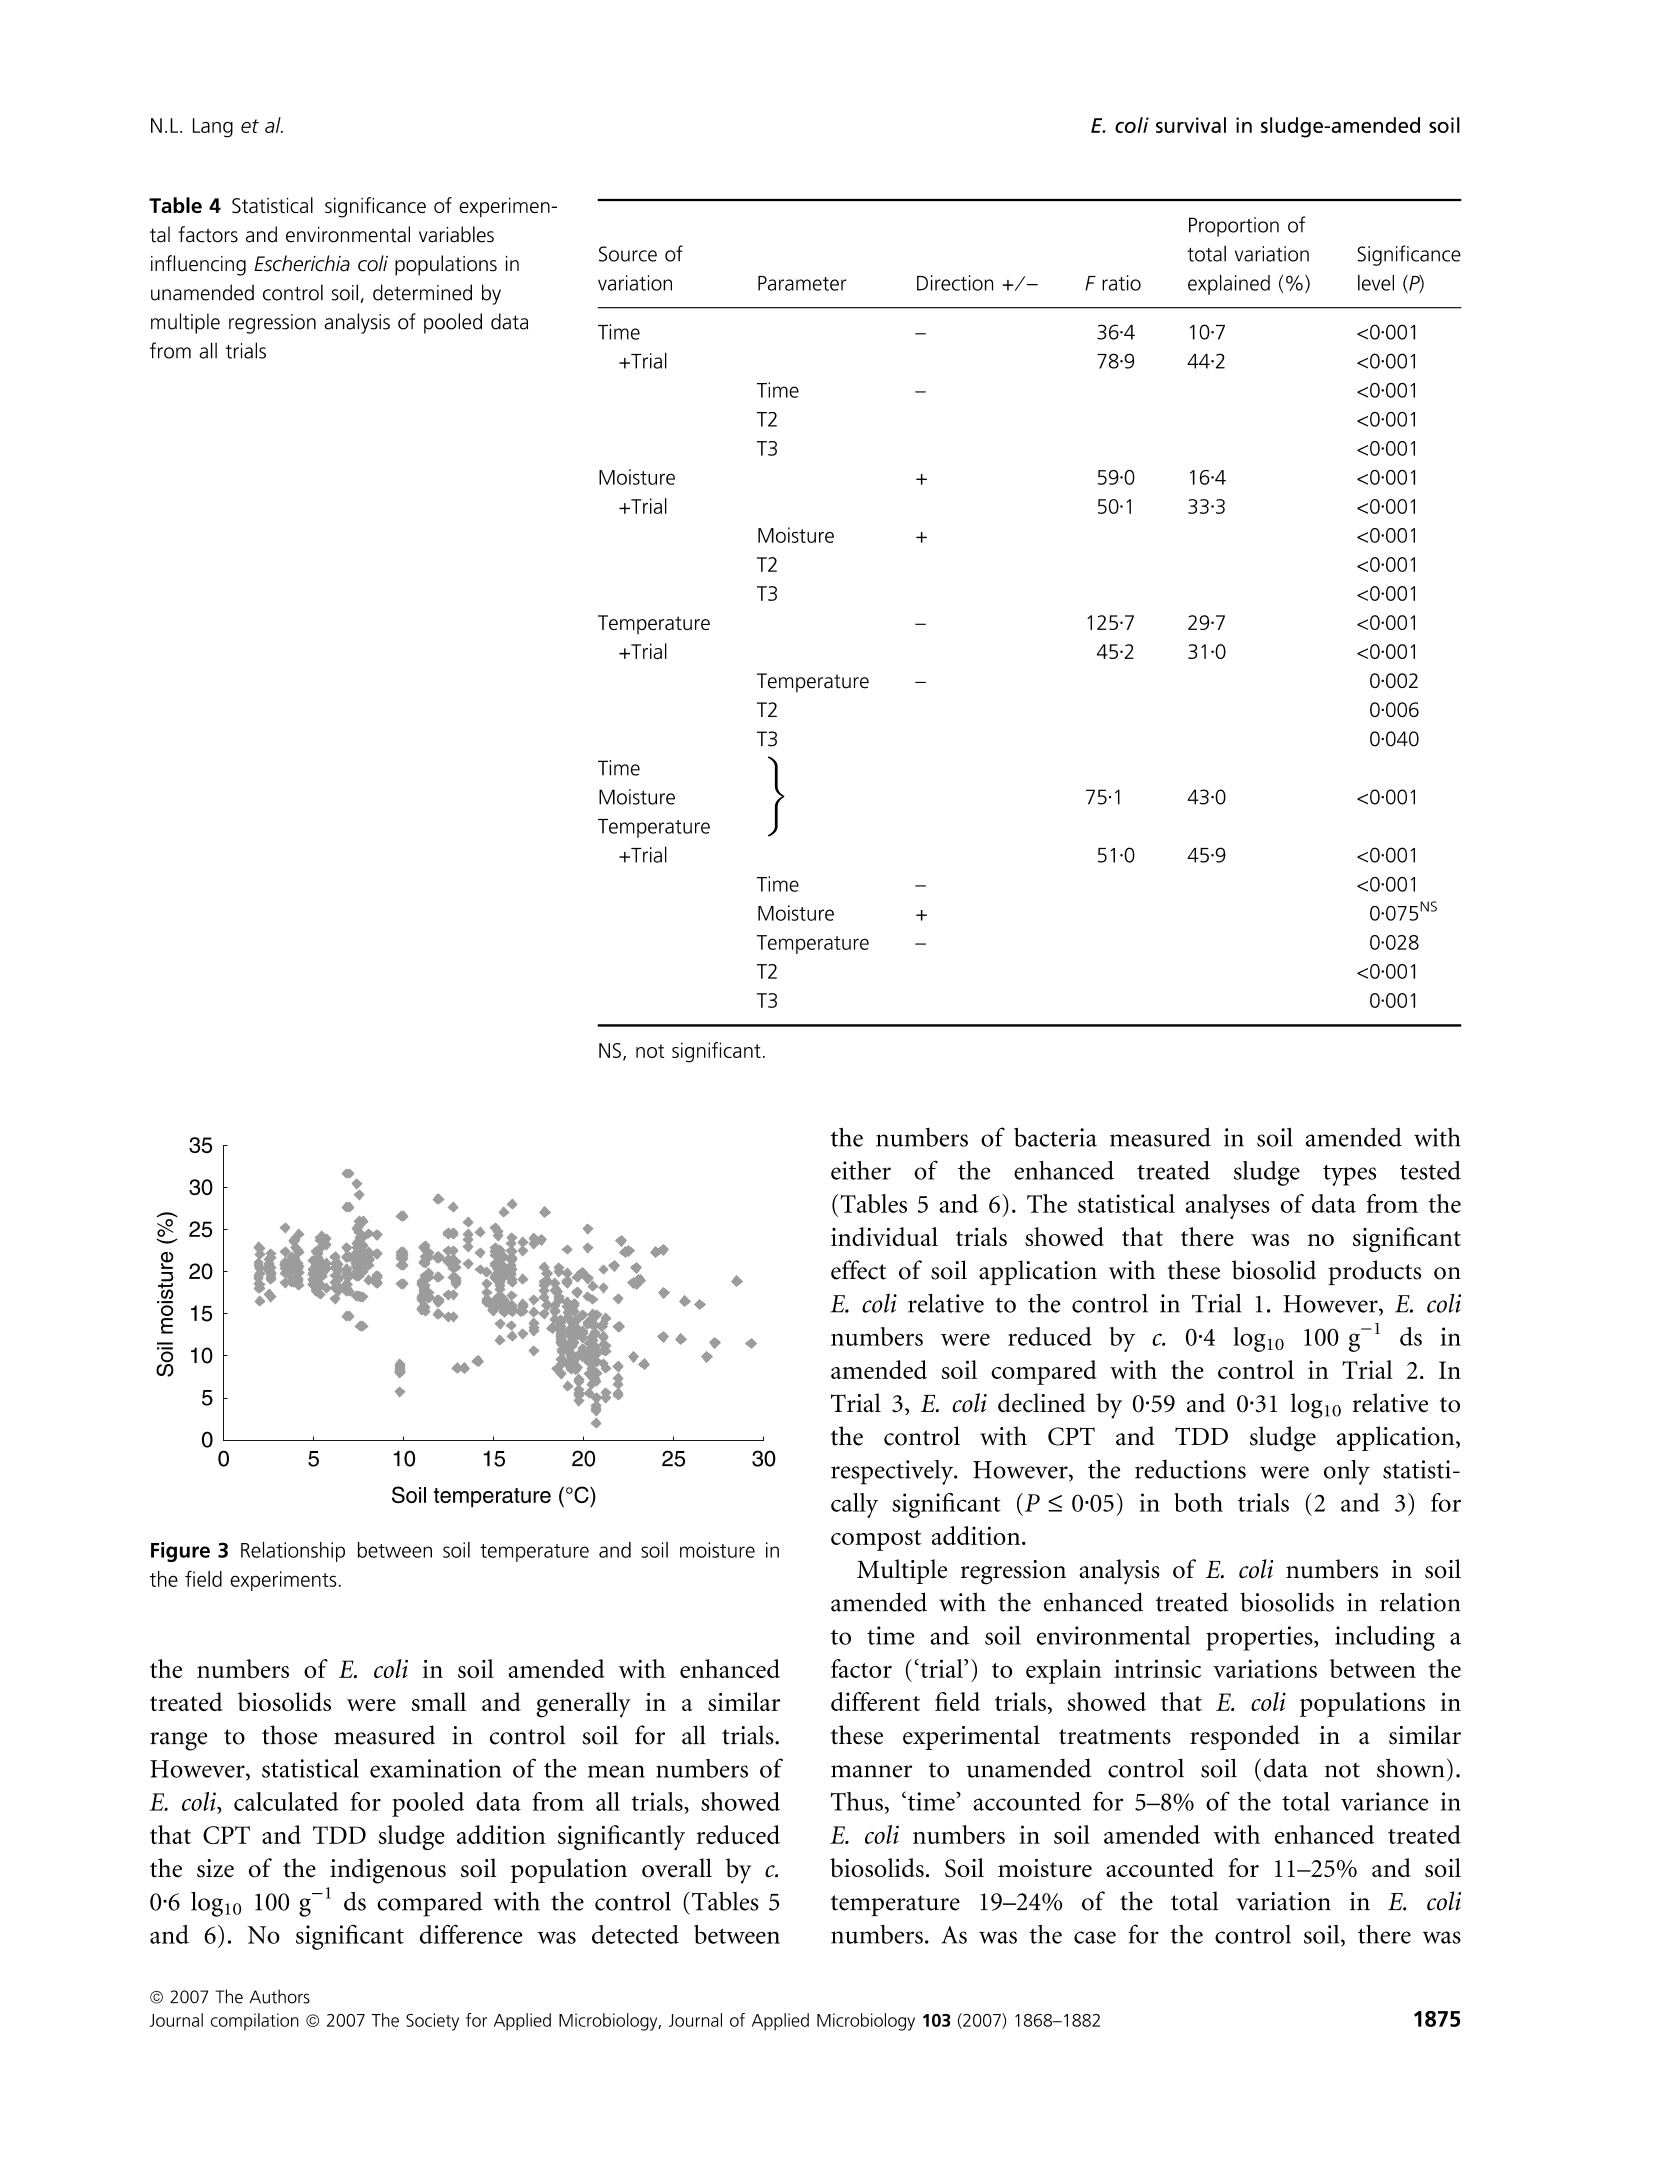
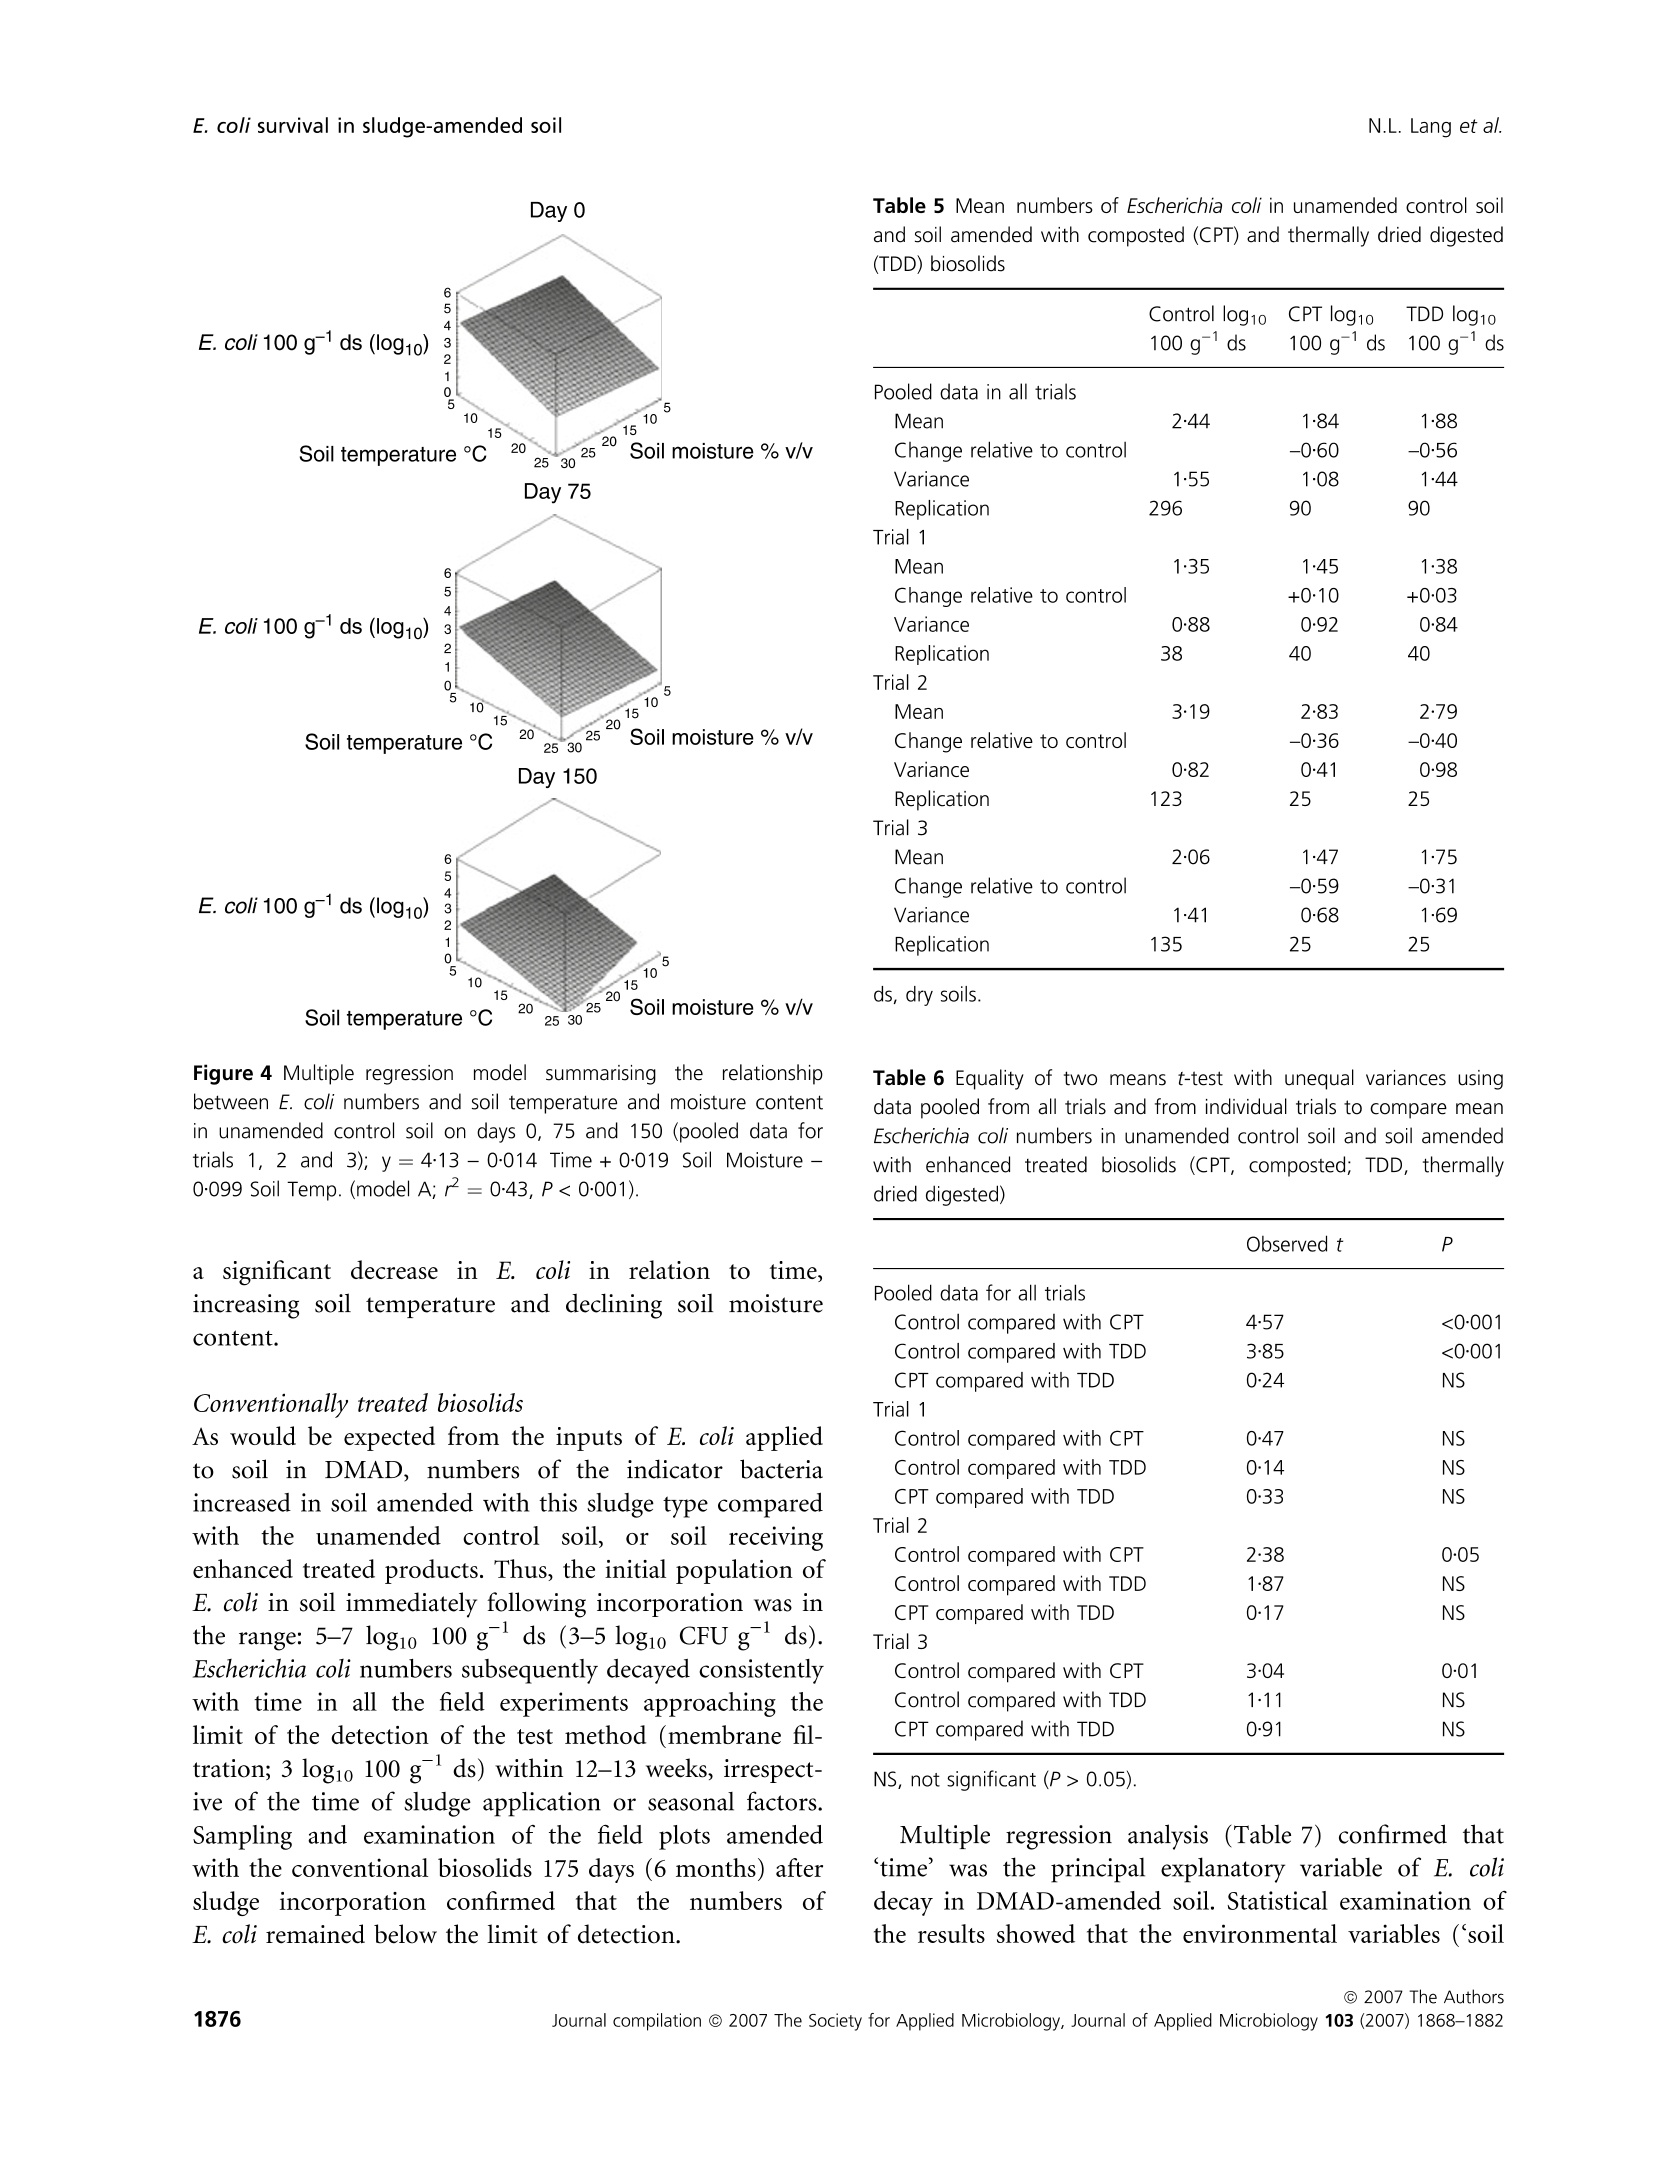
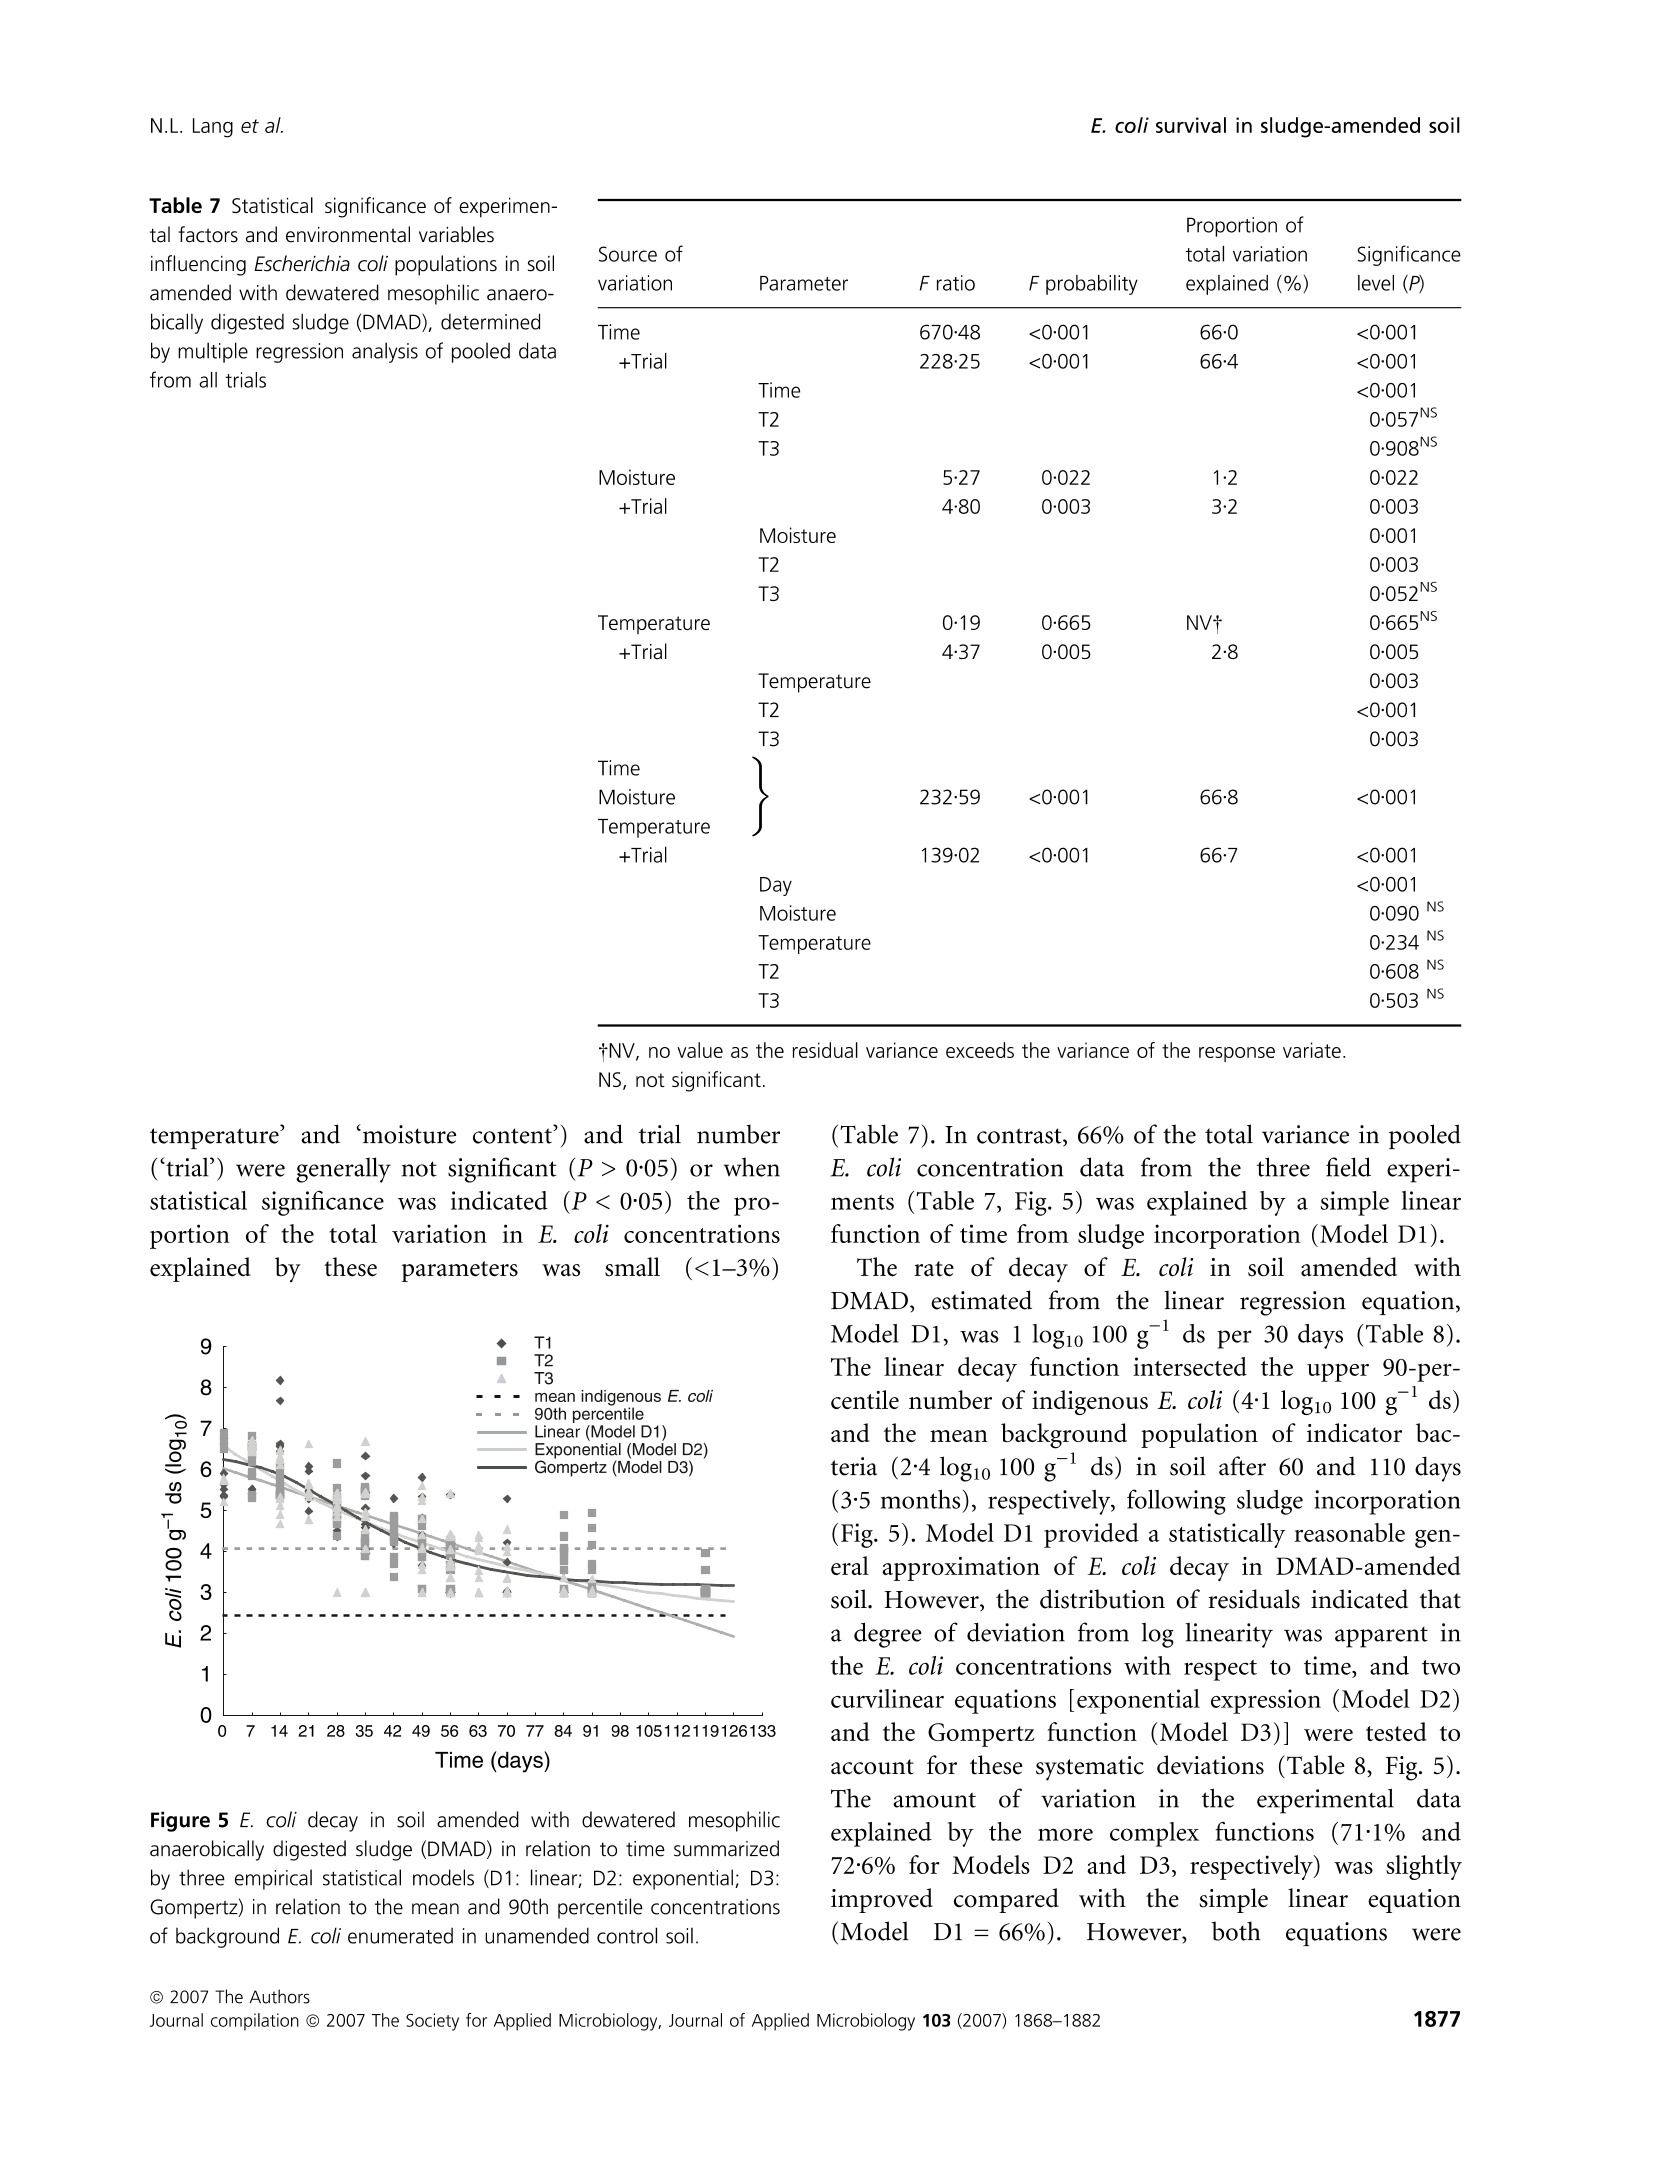
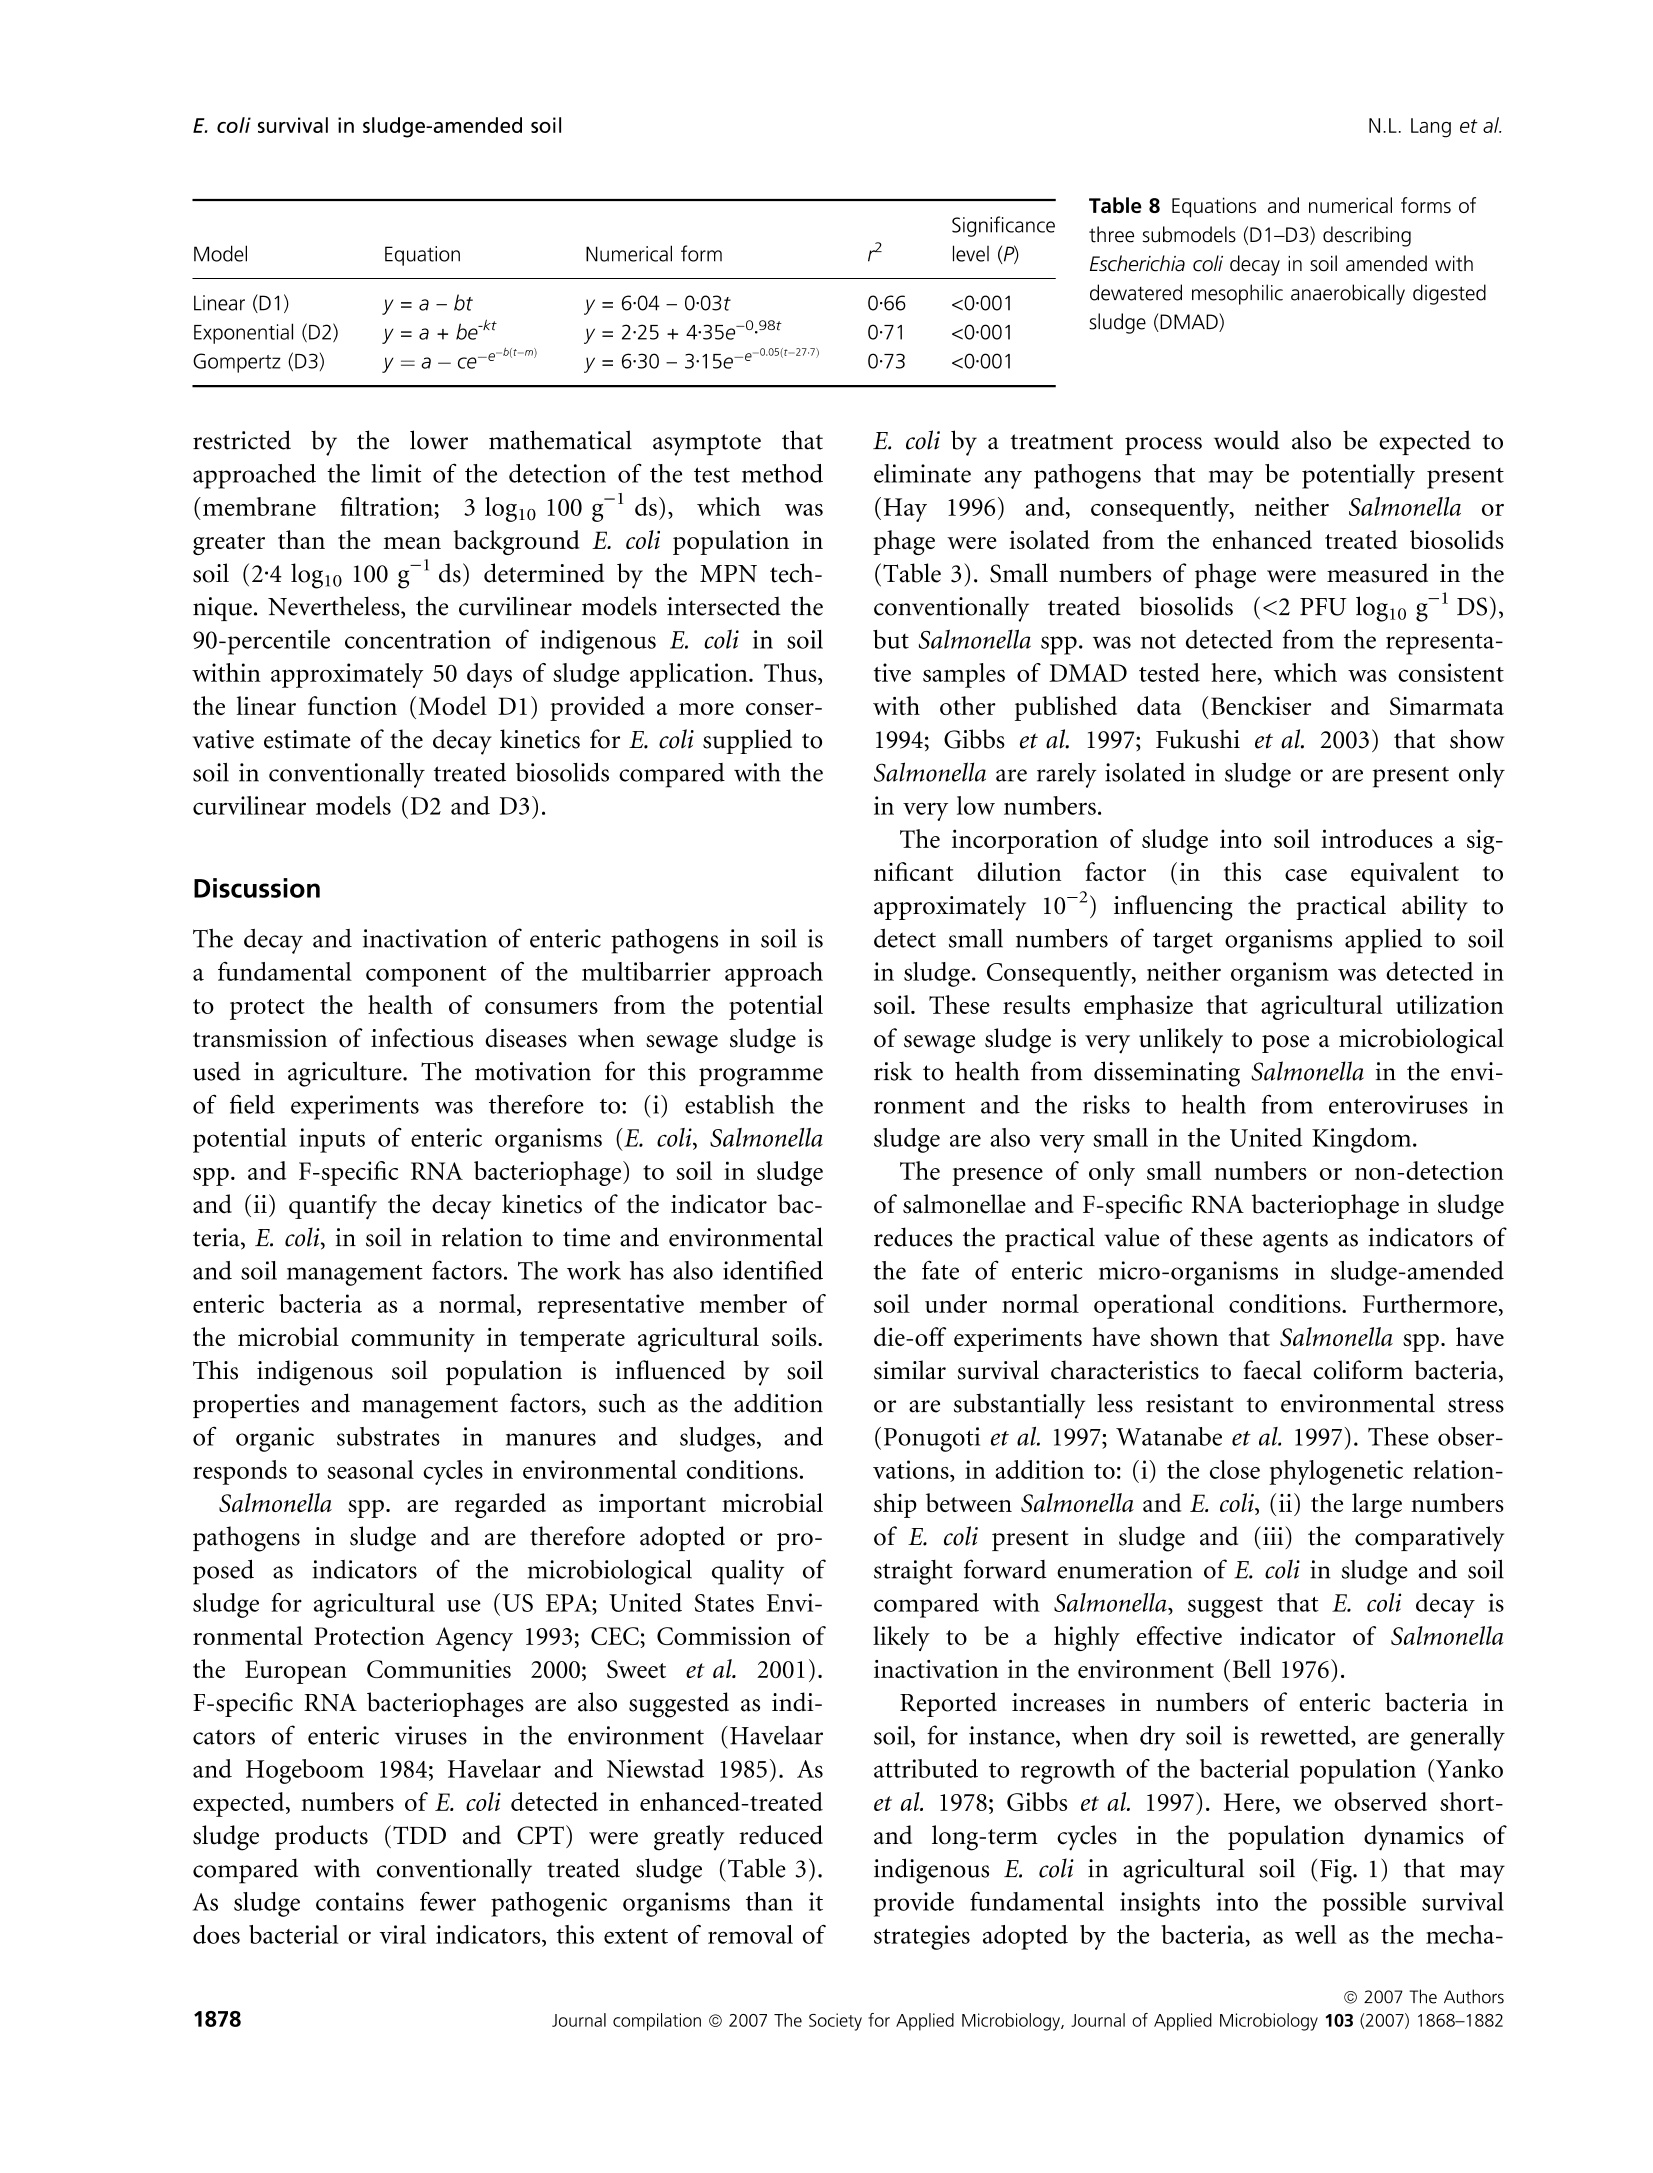
生物固体改良农业土壤中大肠杆菌存活和其他肠道微生物存在的实地调查Field investigations on the survival of Escherichia coli and presence of other enteric micro-organisms in biosolids-amended agricultural soilJournal of Applied Microbiology ISSN 1364-5072 N.L. Lang et al.E. coli survival in sludge-amended soil 生物固体改良农业土壤中大肠杆菌存活和其他肠道微生物存在的实地调查 ORIGINAL ARTICLE Field investigations on the survival of Escherichia coli and presence of other enteric micro-organisms in biosolids-amended agricultural soil N.L. Lang, M.D. Bellett-Travers and S.R. Smith Centre for Environmental Control and Waste Management, Department of Civil and Environmental Engineering, Imperial College London, South Kensington Campus, London Keywords agriculture, biosolids, decay, enteric, E. coli, pathogens, soil, sewage sludge. Correspondence Stephen R. Smith, Centre for Environmental Control and Waste Management, Department of Civil and Environmental Engineering, Skempton Building, Imperial College London, South Kensington Campus, London, SW72AZ, UK. E-mail: s.r.smith@imperial.ac.uk 2005⁄ 1026: received 9 September 2005, revised 23 March 2007 and accepted 16 April 2007 doi:10.1111/j.1365-2672.2007.03489.x Abstract Aims: To measure the survival of enteric micro-organisms in agricultural soil amended with conventional and enhanced treated biosolids in relation to envi-ronmental and edaphic conditions. Methods and Results: Escherichia coli , Salmonella and F-specific RNA bacterio-phage were enumerated in sludge and amended soil. Salmonella was not detec-tedand onlysmall numbers of bacteriophages were found inconventional, dewatered mesophilic anaerobically digested biosolids (DMAD). Neither organ-ismwas detected in soil. Escherichia coli numbers in soil increased with DMAD application compared with the unamended control, or soil receiving enhanced treated, thermally dried digested (TDD) and composted (CPT) biosolids. Empirical statistical models were developed summarizing the relationship between soil temperature, moisture content and time and E. coli populations. Background numbers of E. coli declined with increasing soil temperature and decreasing soil moisture responding to seasonal patterns in environmental conditions.Time following application was theonlysignificant explanatory variable of E. coli numbers and decay in DMAD-amended soil. Conclusions: E. coli are an indigenous component of the microbial community in field soil and populations increased in cool, moist soil during autumn-win-ter and declined in warm, dryer soil during spring-summer. Enhanced treated biosolids were not a source of E. coli , but reduced the size of the indigenous population possibly by stimulating the activity of predatory and competing soil flora because of the organic substrate input from sludge. Conventionally treated biosolids increased E. coli numbers in soil. However, introduced bacteria declined rapidly and survival was limited to 3 months, irrespective of the timing of sludge application or environment. Significance and Impact of the Study: The results provide assurance that resid-ual numbers of pathogens applied to soil in treated biosolids decay to back-ground values well within cropping and harvesting restrictions imposed when sewage sludge is spread on farmland. Introduction Sewage sludge (biosolids) is an effective source of nitro-gen and phosphorus for crop production and the organic matter content in the sludge has value for improving the physical properties and water-holding capacity of the soil. The application of sludge to soil can therefore improve agronomic productivity and soil quality, and the recycling of biosolids to agricultural land is a cost-effective, sustain-able approach to sewage sludge management. Biosolids are a by-product of municipal wastewater treatment and potentially contain a wide variety of excreted pathogens, reflecting the state of health within the community. The application of biosolids to farmland is strictly regulated to prevent the dissemination of enteric diseases (CEC; Council of the European Com-munities1986; SI; Statutory Instrument 1989; DoE; Department of theEnvironment1996; ADAS; Agricul-tural Development and Advisory Service 2001). The effectiveness of these management practices is emphasized bytheabsenceofepidemiologicalevidence-linkingdis-easeoutbreaksinhumans or domesticlivestocktothe controlled use of sewage sludge in agriculture (Evans 1996; RCEP; Royal Commission on Environmental Pollution 1996; HoC; House of Commons 1998; Cra-thorne et al. 2002). The controls on agricultural use are based on the con-cept of providing multibarriers to pathogen transmission (WHO; World Health Organization 1981). The first bar-rier depends on treating sludge to reduce the numbers of pathogens potentially present. Further barriers are imposed through cropping restrictions and minimum grazing and harvesting intervals on land following sludge application, to allow the natural attenuation of the resid-ual numbers of pathogens to occur in the soil. The cur-rent UK statutory controls on agricultural utilization (SI; Statutory Instrument 1989) are supported by a voluntary code of practice (DoE; Department of the Environment 1996) that specifies operational processes and criteria for the effective treatment of sludge and acceptable uses of sludge on land. These measures were further strengthened recently by the Safe Sludge Matrix (ADAS; Agricultural Development and Advisory Service 2001). The Matrix introduced categories for treated sludge (Table 1) depend-ingontheextentofpathogendestruction,following a similar approach to the US EPA; United States Environ-mentalProtection Agency (1993)ClassAandClassB pathogen reduction requirements for land application of sludge. The naturaldecay of enteric micro-organisms in soil following the application of sewage sludge, or other types of faecal wastes, including livestock manures, provides a final environmental barrier to the potential transmission of infectious disease to humans and livestock. However, pathogendecay in soil is determined by complexand interacting biological and environmental factors and fundamental understanding of these processes is currently inadequate to predict inactivation rates of pathogens under differentfield and sludge application conditions (Carrington 2001). Indeed, reported survival times of enteric micro-organisms in sludge-amended soil vary widely between 24 h to >2 years. Disparities in survival data may be explained by differences in experimental, soil and agronomic conditions, nevertheless, the quantitative relationshipsbetweenthesefactorsanddie-offrates in soil remain undetermined (Carrington 2001). Understanding the environmental persistence and fate of enteric pathogens introduced into soil with sewage sludge is necessary to provide the sound scientific basis to management practices designed to mitigate the potential microbiological risks to health associated with spreading biosolids on farmland (Topp et al. 2003). Comparatively few published data are available quantifying pathogen decay in sludge-amended soils under temperate agricul-tural conditions. Therefore, this paper describes a series of consecutive field experiments to determine the decay of enteric organisms (Escherichia coli , Salmonella and F-speci-fic RNA bacteriophage) in arable soil amended with con-ventionally and enhanced-treated biosolids in relation to environmental and soil conditions in the spring and autumn periods. Escherichia coli in unamended soil were also examined to place the agricultural use of sewage sludge in context of the natural background populations of enteric organisms normally present in the environment. Table 1 Categories for treated sludge stipulated in the Safe Sludge Matrix (ADAS; Agricultural Development and Advisory Service 2001) Sludge type Definition Microbiological criteria Cropping interval Conventional Sludge that has undergone a ‡2 log10 removal of E. coli Vegetable crops: 12-month treatment process to significantly £5 log10 E. coli g)1 DS in sludge harvest interval reduce numbers of pathogens Ready-to-eat salad crops: 30-month harvest interval Fruit or horticulture crops: not permitted Enhanced Sludge that has been subjected to a ‡6 log10 removal of E. coli Fruit, salad, vegetable and treatment process capable of virtu- £103 log10 E. coli g)1 DS in sludge horticulture crops: 10-month ally eliminating pathogens present No Salmonella in 2 g DS harvest interval in the original sludge DS, dry solids. Materials and methods Experimental design Three field experiments [Trial 1 – June–August 2001(duration: 84 days), Trial 2 – October 2001–February 2002 (duration: 119 days) and Trial 3 – April–July 2002(duration: 91 days)] were located at the Imperial College field station, Silwood Park, Ascot, UK, on a free-draining moderately acidic sandy loam soil (Table 2). The experi-ments were in a split-plot arrangement with three rand-omized blocks. Main plots, within each block, were covered with perforated polythene film (2-m wide,200 holes m )2 bpi.agri, Leominster, UK), to manipulate soil environmental conditions; the other main plot was maintained in a bare ground condition. Dewatered, mesophilic anaerobically digested sludge (DMAD), thermally dried digested sludge (TDD) and composted sludge with green waste (CPT) were applied to small plots(1Æ 5 m · 1Æ 5 m)by hand at a rate of 10 t ha )1 of dry solids (DS). The biosolids were incorpor-ated immediately into the soil (in orderof increasing enteric content: TDD, CPT and DMAD) to a depth of 10 cm using a pedestrian-operated rotary cultivator. Con-trol plots were also cultivated, without sludge addition, and monitored to assess the indigenous E. coli population in the soil. Bare and covered control plots and treatments amended withDMADwere sampled every 7 days. A 14-day sampling Table 2 Physico-chemical properties of soil [dry soil (ds) basis] from the experimental field site at Silwood Park, Ascot Parameter Value Sand (%) 70 Silt (%) 21 Clay (%) 9 pH 5Æ9 Cation exchange capacity (meq 100 g)1) 8Æ2 Organic matter (%) 2Æ3 Nitrate-nitrogen (mg kg)1) 19Æ3 Ammonia-nitrogen (mg kg)1) 6Æ5 Extractable phosphorus (mg kg)1) 30Æ0 Extractable potassium (mg kg)1) 87Æ7 Extractable magnesium (mg kg)1) 48Æ1 Extractable sulfate (mg kg)1) 19Æ8 Total calcium (%) 0Æ49 Total iron (%) 1Æ07 Total zinc (mg kg)1) 21Æ9 Total copper (mg kg)1) 7Æ1 Total nickel (mg kg)1) 5Æ1 Total cadmium (mg kg)1) 0Æ24 Total chromium (mg kg)1) 12Æ4 Total lead (mg kg)1) 28Æ6 interval was used for the soils amended with enhanced treated biosolids. Three soil cores were collected per plot using a gouge auger (Eijkelkamp, Agrisearch Equipment, The Netherlands) to a depth of 10 cm and were pooled in two depth portions of: 0–5 cm and 5–10 cm. Enumeration of enteric micro-organisms Biosolids (10 g) were homogenized by stomaching (400Circulator; Sewards, Thetford, UK) at 230 rev min )1 for 2 min with 90 ml of maximum recovery diluent (MRD; Oxoid Ltd, Basingstoke, UK). CPT and TDD were rehy-drated in recovery diluent for 30 min prior to homogeniza-tiontoassistdispersion(SCA;StandingCommitteeof Analysts 2003a). Sub-samples of soil (10 g)were homogen-ized by shaking at 200 rev min )1 for 4 min (Laboshake; Gerhardt, K¨onigswinter, Germany) with 90 ml MRD and c. 10 g of 5-mm sterile glass beads (RossLab, Macclesfield, Cheshire,UK). Conventionally treated biosolids (DMAD) and soil amended with this sludge type were enumerated for E. coli by membrane filtration on membrane-lactose glu-curonide agar (MLGA) and membrane-faecal coliform agar (m-FC) (Sartory and Howard 1992; APHA; Ameri-can Public Health Association 1998; SCA; Standing Com-mittee of Analysts 2003b). Only data obtained with MLGA are presented here as highly significant and positive correlations(r 2 = 0Æ 94–0Æ 96,P < 0Æ 001) were observed between the soil enumeration results for the agars from each field trial and the slopes (range: 0Æ 97–1Æ 00) and intercepts (range: 0Æ 04–0Æ 10) of the linear regressionrelationshipsshowed that the methods were directly proportional and equivalentover therangeof counts studied. Enhanced treated biosolids and soils treated with these materials were enumerated using the most probable num-ber(MPN) technique in lauryltryptose broth(Oxoid, Basingstoke, Hampshire, UK) containing bromocresol purple (BDH Merck, Poole, UK) (Humphrey 1999; SCA; Standing Committee of Analysts 2003b). The numbers of E. coli in sludge were adjusted for the DS content and enumeration results for soil treated with DMAD were converted to log10 values 100 g )1 dry soil (ds) to be consistent with MPN data. Salmonella was enumerated using an MPN procedure (Lang et al. 2002) and numbers of F-specific RNA bac-teriophage were determinedbyastandarddouble-layer agar method (BSI; British Standards Institution 2001). Environmental monitoring Environmental parameters were monitored at depths of 0–5 cm and 5–10 cm and summarized as 7-day mean values. Soil temperatures were collected automatically at the field site using thermistor probes (Campbell Scientific, Loughborough, UK) attached to a data logger (Campbell C21X Micrologger; Campbell Scientific). Soil moisture content was determinedgravimetricallybyovendrying overnight at (BSI; British Standards Institution 1994) except in Trial 1 where an automated time domain reflectometry(TDR) system (EasyTest,Lubin,Poland) was piloted. Statistical analysis Thestatistical significanceoftheeffectsofthe experi-mental treatments, and soil and environmental variables, on the survival of E. coli in soil was examined by linear and multiple regression analysis methodsusing pooled E. coli and environmental data for all experimental tri-als. Effects of the enhanced treated products on E. coli numbers in soil were compared with the unamended controlusinganequalityof means t -test with unequal variances. Regression analysis was performed using the Genstat 5statistical analysis package (version 4.1, Lawes Agricultural Trust, Rothamsted Experimental Station) and Microsoft al Excel 2000. Comparison of means t -tests were calculated by the CoStat computer programme (version 6.2; CoHort Software, Monterery, CA, USA). Statistical significance is denoted by the symbols: *P < 0Æ 05, **P < 0Æ 01,***P < 0Æ 001 and NS, not significant (P > 0Æ 05). A backward selection procedure was followed to elim-inate those explanatory variables accounting for the smallest proportions of the total variance in soil E. coli concentration data (Quinn and Keough 2002). Empirical statistical models were developed to explain the observed behaviour of E. coli populations in unamended controlsoil(Model A)andsoilamended with DMAD (Models D1, D2 and D3). The generalform of Model A was: y ¼ a þ b :time þ c :soil moisture þ d :soil temperature where y isthe E. coli concentrationinthesoil(log10100 g )1 ds) and a, b, c and d are regression constants. Note that time refers to d from sludge incorporation, and the units for soil moisture and soil temperature are %w ⁄w and CC C, respectively. A simple linear function (Model D1) was fitted to the E.coli datainrelationtotime forsoilamended with DMAD. This equation had the form: where y is the E. coli concentration in the soil(log10 100 g )1 ds) at t, a is the initial E. coli population in the soil (log10 100 g )1 ds), b is the maximum change in E. coli population in the soil (log10 100 g )1 ds) and t is the time (d from sludge incorporation). An exponential decay function (Model D2) and Gom-pertz equation (Model D3), which describe an asymmetri-cal sigmoidal decay response, were also used to describe the decay of E. coli in DMAD-amended soil in relation to time. The general form of the exponential equation (Model D2) is shown next: where y isthe E.coli concentrationinthesoil(log10100 g )1 ds) at t, a is the background E. coli population in the soil (log10 100 g )1 ds), b is the size of the decaying E. coli population in the soil (log10 100 g )1 ds), a + b is the initial E. coli population in the soil (log10 100 g )1 ds), k is the rate constant (log10 100 g )1 ds day )1) and t is the time (d from sludge incoporation). The Gompertz equation (Model D3) has the form: where y is the E. coli concentration in the soil (log10 100 g )1 ds) at t, a is the initial population, c is the maximum change in E. coli population in the soil (log10 100 g )1 ds), b is the shape factor (curve), t is the time (d from sludge incorporation) and m is the time at maximum rate (day number from the start of the experi-ment). Results Environmental monitoring Mean soil moisture contents recorded during the spring-summer experiments (Trials 1 and 3) were in the range:12Æ 5–21% and there was an underlying seasonal decline in the soil moisture content during the final trial (Fig. 1a). As may be expected, soil moisture declined with seasonal increases in air temperature (data not shown) and the soil was therefore generally drier during warmer periods.Theplasticcovers maintainedthesoil moisture status at a higher value after rainfall compared withbaresoil, whichdriedrapidlyduringthe spring-summer periods. Soil at the 5–10-cm sample depth generally contained up to 25% more moisture than the surface soil (0–5 cm) (Fig. 1a). In Trial 2, the soil moisture content was relatively consistent during the autumn-winter period in both covered and bare soil and was in the range: 19–23%. Soil temperatures recorded during the spring-summer seasons (Trials 1 and 3) were warmer than those recorded during the winter season of Trial 2 (Fig. 1b). In the first trial, the weekly average temperature of bare soil was 05/06/2001 04/08/2001 03/10/2001 02/12/2001 31/01/2002 01/04/2002 31/05/2002 30/07/2002Time (date) 05/06/2001 04/08/2001 03/10/2001 02/12/2001 31/01/2002 01/04/2002 31/05/2002 30/07/2002Time (date) Figure 1 Seasonal patterns in (a) soil moisture content, (b) soil temperature and (c) background E. coli numbers in unamended control soil, from 5 June 2001 to 23 July 2002 [(C) denotes covered soil; arrow indicates sample at Day 42 after heavy rainfall]. 19℃℃C (range: 13o–25℃℃C). However, soil temperatures were marginally cooler in the final trial compared with Trial 1, with an overall weekly mean temperature of 16℃℃C (range:9o– 20℃℃C). The minimum weekly mean soil temperature intheautumn-winterperiod was 0Æ 7xi Candthe maxi-mum valuerecorded was 13. C.Coveringthesoil with plastic film typically raised the soil temperature by 3–5℃℃C above ambient conditions measured for bare soil in the spring-summer trials. However, the plastic cover had only a relatively small warming effect during the winter raising the soil temperature by c. 0Æ 5℃℃C relative to the bare soil during this period. Concentrations of indicator organisms and pathogens in sewage sludge Mean numbers (n = 3) of E. coli measured in the differ-ent sludge types applied to the field trials are listed in Table 3. DMAD containedbetween 5Æ 58 and 7Æ 08 log10E.coli per gram DS. As expected,enhancedtreatment processes significantly reduced the numbers of E. coli in sludge compared with the conventionally treated biosol-ids. Thus, numbers were <20 E. coli 100 g )1DS for both CPT and TDD, except for Trial 1 where the sample of CPT contained 2Æ 72 log10 100 g )1DS. Salmonella spp. were not detected in either convention-ally or enhanced treated biosolids enumerated in Trial 3. F-specific RNA bacteriophages were present in low num-bers in DMAD, which contained 1Æ 96 PFU log10 g )1 DS (Table 3). Enumeration of Salmonella and F-specific RNA bacteriophage in soil Salmonella spp. and F-specificRNA bacteriophage were monitored in Trial 3 on days 0, 14 and 28 of the experi-ment, but were not detected in control or sludge-amen-ded soil. Escherichia coli populations in soil Preliminary statistical analysis and identification of main experimental and environmental effects for pooled data for all trials and treatments No statistically significanteffect(P > 0Æ 05)ofcovering soil with perforated plastic film was detected on E. coli numbers by multiple regression analysis (data not shown). Differences in E. coli numbers measured between the sampling depths were occasionally statistically signi-ficant, but sampling depth only explained a small propor-tionofthetotalvariance(0Æ 4–1Æ 1%) in pooled E.coli data. Consequently, both sampling depth and soil cover-ing were excluded from statistical modelling of the enumeration results. Experimental block was a statistically significant factor and accounted for 8–11% of the total variance in E. coli numbers, as may be expected because of the spatial variability in microbial populations in field soils. Linear and multiple regression analysis indicated highly significant effects(P < 0Æ 001)of ‘time’, ‘soil moisture’and ‘soil temperature’ on E. coli numbers in agricultural soil. As individualexplanatory variables, however, these parameters accounted for a relatively minor proportion of the variance in pooled E. coli numbers, equivalent to 14%, 5Æ 5% and 5Æ 4% of the total variation, respectively. Including ‘trial’ as a factor in the regressions had only a small or negligible influence on the total amount of vari-ation explained in the experimental data. In contrast, soil amendment treatments had a much larger influence on E. coli numbers overall. Indeed, the inclusion of ‘sludge’as an explanatory variable increased the total amount of variation explained in the experimental data to 50–60%. Thus, E. coli numbers measured in the various field experiments were determined primarily by soil manage-ment practices and environmental conditions, as well as the random background variability of E. coli populations insoil. No other major or fundamentaldifferences in E. coli numbers between the specific field trials were detected in the statistical analysis. Table 3 Escherichia coli, F-specific RNA bacteriophage and Salmonella spp. enumerated in the applied biosolids [fresh weight (FW) and dry solids (DS) bases] Salmonella spp. E. coli CFU g)1 E. coliMPN 100 Phage PFU g)1 MPN 100 g)1 (log10) g)1 (log10) (log10) (log10) Sludge type and trial DS (%) FW DS FW DS FW DS FW DS Trial 1 Dewatered digested 29Æ7 5Æ05 5Æ58 Compost 57Æ6 2Æ48 2Æ72 Thermally dried digested 99Æ5 <1Æ30 <1Æ30 Trial 2 Dewatered digested 22Æ9 6Æ44 7Æ08 Compost 62Æ8 <0Æ30 <0Æ50 Thermally dried digested 92Æ8 <0Æ30 <0Æ33 Trial 3 Dewatered digested 21Æ4 5Æ73 6Æ40 1.29 1.96 <1.30 <1.97 Compost 65Æ7 1Æ07 1Æ25 <1.00 <1.18 <1.30 <1.48 Thermally dried digested 95Æ9 0Æ43 0Æ44 <1.00 <1.02 <1.30 <1.32 MPN, most probable number; CFU, colony forming unit; PFU, plaque forming unit. Unamended control soil Numbersof E.coli inthe spring-summer trials varied between sampling intervals apparently coinciding with soil drying and wetting cycles and when soil temperatures were rising (Fig. 1c). For example, E. coli numbers declined (<0Æ 34 log10 100 g )1 ds) during a period of soil drying in Trial 1, but increased rapidly to 2–3log10100 g )1ds following heavy rainfall (44Æ 5 mm), which increased the soil moisture content prior to sampling on day 42 (indicatedby the arrow in Fig. 1c). In Trial3, there was a general decline in E. coli numbers with time and E. coli populations remained relatively consistent dur-ing Trial 2 (mean of pooled data: 2Æ 94 log10 100 g )1 ds). Pooled E. coli data from all trials are presented in Fig. 2 in relation to day number from the start of each experiment (‘time’), ‘soil moisture’ and ‘soil temperature’. In general, background numbers declined with time, increasing soil temperature and decreasing moisture con- Figure 2 Background E. coli populations in unamended control soil in relation to (a) time (b) soil moisture and (c) soil temperature. tent.Linearregressionanalysisindicatedtheserelation-ships were highly significant (P < 0Æ 001) accounting for 10Æ 7%, 29Æ 7% and 16Æ 4% of the total variation in E. coli data, respectively. Thus, temperature was identified as the most important environmental parameter influencing native E. coli populations in soil (Parker and Mee 1982). Further evidence indicating the greater apparent importance of soil temperature, compared with soil mois-ture content, in modulating E. coli numbers in soil was provided by the regression models testing the general dif-ferences between the background populations of the indi-cator bacteria measured in the different field experiments (Table 4).Thus,including‘trial’intheregression with ‘soil moisture’ more than doubled the amount of vari-ation (33%) explained in E. coli data compared with ‘soil moisture’ on its own. However, while there was evidence of a statistically significant effect of the individual trials on the numbers of indigenous E. coli detected in soil, any fundamental differences between the trials were probably of relatively minor importance as ‘trial’ had little influ-ence on the total variation explained when included as a factor in the regression with ‘soil temperature’, compared to fitting this environmental parameter alone. Therefore, it would appear that soil temperature was the environ-mental factor chiefly responsible for the general seasonal patterns in background E. coli numbers observed between the different field experiments (Fig. 1). Althoughsoil moisture was not identifiedas a main explanatory variable of background E. coli numbers in soil in this field investigation,its potential importance as a factor influencing the survival of E. coli in the environment cannot be discounted. This is because of the difficulties apparent in interpreting the statistical relationships between microbiological responses and soil variables due to the possible correlations between environmental param-eters, such as soil temperature andmoisture, inmultifacto-rial field situations (Fig. 3). Overall patterns in E. coli numbers in unamended con-trol soil were therefore summarized by a simple multiple regression equation, Model A, incorporating both soil environmental variables and ‘time’, shown in Fig. 4. The regressioncoefficientfor‘soil temperature’in Model A (Fig. 4) was five times larger than for ‘soil moisture’, underlining the apparent greater influence of temperature on native E. coli in sandy loam soil compared with the effects of soil moisture status over the range of temperate environmental conditions observed in the field experi-ments. Enhanced treated biosolids Enhanced treated biosolids contained few E. coli (Table 3) and did not augment the background population of indi-cator bacteria in soil. Therefore, as would be expected, Table 4 Statistical significance of experimen-tal factors and environmental variables influencing Escherichia coli populations in unamended control soil, determined by multiple regression analysis of pooled data from all trials Proportion of Source of total variation Significance variation Parameter Direction +⁄ ) F ratio explained (%) level (P) Time – 36Æ4 10Æ7 <0Æ001 +Trial 78Æ9 44Æ2 <0Æ001 Time – <0Æ001 T2 <0Æ001 T3 <0Æ001 Moisture + 59Æ0 16Æ4 <0Æ001 +Trial 50Æ1 33Æ3 <0Æ001 Moisture + <0Æ001 T2 <0Æ001 T3 <0Æ001 Temperature – 125Æ7 29Æ7 <0Æ001 +Trial 45Æ2 31Æ0 <0Æ001 Temperature – 0Æ002 T2 0Æ006 T3 0Æ040 Time Moisture 75Æ1 43Æ0 <0Æ001 Temperature +Trial 51Æ0 45Æ9 <0Æ001 Time – <0Æ001 Moisture + 0Æ075NS Temperature – 0Æ028 T2 <0Æ001 T3 0Æ001 35 Figure 3 Relationship between soil temperature and soil moisture in the field experiments. the numbers of E. coli insoil amended with enhanced treatedbiosolids weresmallandgenerallyinasimilar range to those measured in control soil for all trials. However, statistical examination of the mean numbers of E. coli , calculated for pooled data from all trials, showed that CPT and TDD sludge addition significantly reduced the size of the indigenous soil population overall by c.0Æ 6 log10 100 g )1 ds compared with the control (Tables 5and6). No significantdifference was detectedbetween the numbers of bacteria measured in soil amended with either of the enhanced treated sludge types tested (Tables 5 and 6). The statistical analyses of data from the individual trials showed that there was no significant effect of soil application with these biosolid products on E. coli relative to the control in Trial 1. However, E. coli numbers were reduced by c. 0Æ 4 log10100 g )1ds in amended soil compared with the control in Trial 2. In Trial 3, E. coli declined by 0Æ 59 and 0Æ 31 log10 relative to the control with CPT and TDD sludge application, respectively. However, the reductions were only statisti-callysignificant(P £ 0Æ 05)inbothtrials(2and3) for compost addition. Multiple regression analysis of E. coli numbers in soil amended with the enhanced treated biosolids in relation totime andsoilenvironmental properties, includinga factor (‘trial’) to explain intrinsic variations between the differentfield trials, showed that E.coli populationsin these experimental treatments responded in a similar manner to unamended control soil (data not shown). Thus, ‘time’ accounted for 5–8% of the total variance in E. coli numbers in soil amended with enhanced treated biosolids. Soil moisture accounted for 11–25% and soil temperature 19–24% of the total variation in E. coli numbers. As was the case for the control soil, there was Day 0 Figure 4 Multiple regression model summarising the relationship between E. coli numbers and soil temperature and moisture content in unamended control soil on days 0, 75 and 150 (pooled data for trials 1, 2 and 3);y ¼ 4Æ 13 ) 0Æ 014Time + 0Æ 019Soil Moisture )0Æ 099 Soil Temp. (model A; r 2 ¼ 0Æ 43, P < 0Æ 001). a significant decrease in E. coli in relation to time, increasingsoiltemperatureanddecliningsoil moisture content. Conventionally treated biosolids As would be expected from the inputs of E. coli applied to soil in DMAD, numbers of the indicator bacteria increased in soil amended with this sludge type compared with the unamended control soil, or soil receiving enhanced treated products. Thus, the initial population of E. coli in soil immediately following incorporation was in the range: 5–7 log10 100 g )1 ds (3–5 log10 CFU g )1 ds). Escherichia coli numbers subsequently decayed consistently with time in allthefieldexperimentsapproachingthe limit of the detection of the test method (membrane fil-tration; 3 log10 100 g )1 ds) within 12–13 weeks, irrespect-ive of the time of sludge application or seasonal factors. Sampling and examination of the field plotsamended with the conventional biosolids 175 days (6 months) after sludge incorporation confirmed that the numbers of E. coli remained below the limit of detection. Table 5 Mean numbers of Escherichia coli in unamended control soil and soil amended with composted (CPT) and thermally dried digested (TDD) biosolids Control log10 CPT log10 TDD log10 100 g)1 ds 100 g)1 ds 100 g)1 ds Pooled data in all trials Mean 2Æ44 1Æ84 1Æ88 Change relative to control –0Æ60 –0Æ56 Variance 1Æ55 1Æ08 1Æ44 Replication 296 90 90 Trial 1 Mean 1Æ35 1Æ45 1Æ38 Change relative to control +0Æ10 +0Æ03 Variance 0Æ88 0Æ92 0Æ84 Replication 38 40 40 Trial 2 Mean 3Æ19 2Æ83 2Æ79 Change relative to control –0Æ36 –0Æ40 Variance 0Æ82 0Æ41 0Æ98 Replication 123 25 25 Trial 3 Mean 2Æ06 1Æ47 1Æ75 Change relative to control –0Æ59 –0Æ31 Variance 1Æ41 0Æ68 1Æ69 Replication 135 25 25 ds, dry soils. Table 6 Equality of two means t -test with unequal variances using data pooled from all trials and from individual trials to compare mean Escherichia coli numbers in unamended control soil and soil amended with enhanced treated biosolids (CPT, composted; TDD, thermally dried digested) Observed t Observed t P Pooled data for all trials Control compared with CPT 4Æ57 <0Æ001 Control compared with TDD 3Æ85 <0Æ001 CPT compared with TDD 0Æ24 NS Trial 1 Control compared with CPT 0Æ47 NS Control compared with TDD 0Æ14 NS CPT compared with TDD 0Æ33 NS Trial 2 Control compared with CPT 2Æ38 0Æ05 Control compared with TDD 1Æ87 NS CPT compared with TDD 0Æ17 NS Trial 3 Control compared with CPT 3Æ04 0Æ01 Control compared with TDD 1Æ11 NS CPT compared with TDD 0Æ91 NS NS, not significant (P > 0.05). Multipleregression analysis(Table 7)confirmed that ‘time’ was theprincipalexplanatoryvariableof E.coli decay in DMAD-amended soil. Statistical examination of the results showed that the environmental variables (‘soil Table 7 Statistical significance of experimen- tal factors and environmental variables influencing Escherichia coli populations in soil amended with dewatered mesophilic anaero-bically digested sludge (DMAD), determined by multiple regression analysis of pooled data from all trials Proportion of Source of total variation Significance variation Parameter F ratio F probability explained (%) level (P) Time 670Æ48 <0Æ001 66Æ0 <0Æ001 +Trial 228Æ25 <0Æ001 66Æ4 <0Æ001 Time <0Æ001 T2 0Æ057NS T3 0Æ908NS Moisture 5Æ27 0Æ022 1Æ2 0Æ022 +Trial 4Æ80 0Æ003 3Æ2 0Æ003 Moisture 0Æ001 T2 0Æ003 T3 0Æ052NS Temperature 0Æ19 0Æ665 NVt 0Æ665NS +Trial 4Æ37 0Æ005 2Æ8 0Æ005 Temperature 0Æ003 T2 <0Æ001 T3 0Æ003 Time Moisture 232Æ59 <0Æ001 66Æ8 <0Æ001 Temperature +Trial 139Æ02 <0Æ001 66Æ7 <0Æ001 Day <0Æ001 Moisture 0Æ090 NS Temperature 0Æ234 NS T2 0Æ608 NS T3 0Æ503 NS Nt NV, no value as the residual variance exceeds the variance of the response variate. NS, not significant. temperature’and‘moisture content’)andtrialnumber (‘trial’) were generally not significant (P > 0Æ 05) or when statistical significance was indicated (P < 0Æ 05) the pro-portionofthetotal variationin E.coli concentrations explained by these parameters was small (<1–3%) Figure 5 E. coli decayinsoilamended with dewatered mesophilic anaerobically digested sludge (DMAD) in relation to time summarized by three empirical statistical models (D1: linear; D2: exponential; D3:Gompertz) in relation to the mean and 90th percentile concentrations of background E. coli enumerated in unamended control soil. (Table 7). In contrast, 66% of the total variance in pooled E. coli concentrationdata from thethree field experi-ments (Table 7, Fig. 5) was explained by a simple linear function of time from sludge incorporation (Model D1). The rate of decay of E. coli in soil amended with DMAD, estimated from the linearregression equation, Model D1, was 1 log10 100 g )1 ds per 30 days (Table 8). The linear decay function intersected the upper 90-per-centile number of indigenous E. coli (4Æ 1 log10 100 g )1 ds) and the mean background population of indicator bac-teria (2Æ 4 log10 100 g )1 ds) in soil after 60 and 110 days (3Æ 5 months), respectively, following sludge incorporation (Fig. 5). Model D1 provided a statistically reasonable gen-eral approximation of E. coli decay in DMAD-amended soil. However, the distribution of residuals indicated that a degree of deviation from log linearity was apparent in the E. coli concentrations with respect to time, and two curvilinear equations [exponential expression (Model D2) and the Gompertz function (Model D3)] were tested to account for these systematic deviations (Table 8, Fig. 5). The amount of variation in the experimental data explained by the more complex functions(71Æ 1% and 72Æ 6% for Models D2 and D3, respectively) was slightly improved compared with the simple linear equation (Model D1 = 66%). However, both equations were Significance Model Equation Numerical form r2 level (P) Linear (D1) y = a – bt y = 6Æ04 – 0Æ03t 0Æ66 <0Æ001 Exponential (D2) y = a + be-kt y = 2Æ25 + 4Æ35e)0Æ98t 0Æ71 <0Æ001 Gompertz (D3) y=a-ce-e-o(t-m) y = 6Æ30 – 3Æ15e7) 0Æ73 <0Æ001 Table 8 Equations and numerical forms of three submodels (D1–D3) describing Escherichia coli decay in soil amended with dewatered mesophilic anaerobically digested sludge (DMAD) restricted by the lower mathematical asymptote that approached the limit of the detection of the test method (membrane filtration; 3 log10 100 g )1 ds), which was greater than the mean background E. coli population in soil (2Æ 4 log10 100 g )1 ds) determined by the MPN tech-nique. Nevertheless, the curvilinear models intersected the 90-percentile concentration of indigenous E. coli in soil within approximately 50 days of sludge application. Thus, the linear function (Model D1) provided a more conser-vative estimate of the decay kinetics for E. coli supplied to soil in conventionally treated biosolids compared with the curvilinear models (D2 and D3). Discussion The decay and inactivation of enteric pathogens in soil is a fundamental component of the multibarrier approach toprotectthehealthofconsumersfrom thepotential transmission of infectious diseases when sewage sludge is used in agriculture. The motivation for this programme offield experiments was therefore to:(i)establish the potential inputs of enteric organisms (E. coli , Salmonella spp. and F-specific RNA bacteriophage) to soil in sludge and (ii) quantify the decay kinetics of the indicator bac-teria, E. coli , in soil in relation to time and environmental and soil management factors. The work has also identified entericbacteriaasanormal,representative member of the microbial community in temperate agricultural soils. This indigenous soil population is influenced by soil properties and management factors, such as the addition of organic substrates in manures and sludges, and responds to seasonal cycles in environmental conditions. Salmonella spp.are regarded as important microbial pathogensin sludge andare thereforeadoptedor pro-posed as indicators of the microbiological quality of sludge for agricultural use (US EPA; United States Envi-ronmental Protection Agency 1993; CEC; Commission of the European Communities 2000; Sweet et al. 2001). F-specific RNA bacteriophages are also suggested as indi-cators ofenteric virusesinthe environment (Havelaar and Hogeboom 1984; Havelaar and Niewstad 1985). As expected, numbers of E. coli detected in enhanced-treated sludgeproducts (TDD and CPT) weregreatly reduced compared withconventionally treated sludge(Table 3). Assludgecontainsfewer pathogenicorganisms thanit does bacterial or viral indicators, this extent of removal of E. coli by a treatment process would also be expected to eliminate any pathogens that may be potentially present (Hay 1996) and, consequently, neither Salmonella or phage were isolated from the enhanced treated biosolids (Table 3). Small numbers of phage were measured in the conventionally treated biosolids(<2 PFU log10 g )1DS), but Salmonella spp. was not detected from the representa-tive samples of DMAD tested here, which was consistent with other published data (Benckiser and Simarmata 1994; Gibbs et al. 1997; Fukushi et al. 2003) that show Salmonella are rarely isolated in sludge or are present only in very low numbers. The incorporation of sludge into soil introduces a sig-nificant dilution factor (in this case equivalent to approximately10)2)influencing thepractical ability to detect small numbers of target organisms applied to soil in sludge. Consequently, neither organismwas detected in soil. These results emphasize that agricultural utilization of sewage sludge is very unlikely to pose a microbiological risk to health from disseminating Salmonella in the envi-ronment andtheriskstohealthfrom enterovirusesin sludge are also very small in the United Kingdom. The presence of only small numbers or non-detection of salmonellae and F-specific RNA bacteriophage in sludge reduces the practical value of these agents as indicators of thefateofenteric micro-organisms insludge-amended soilundernormal operationalconditions.Furthermore, die-off experiments have shown that Salmonella spp. have similar survival characteristics to faecal coliform bacteria, or are substantially less resistant to environmental stress (Ponugoti et al. 1997; Watanabe et al. 1997). These obser-vations, in addition to: (i) the close phylogenetic relation-ship between Salmonella and E. coli , (ii) the large numbers of E.coli presentinsludge and (iii)the comparatively straight forward enumeration of E. coli in sludge and soil compared with Salmonella , suggest that E. coli decay is likely to be a highly effective indicator of Salmonella inactivation in the environment (Bell 1976). Reportedincreasesinnumbersofentericbacteriain soil, for instance, when dry soil is rewetted, are generally attributed to regrowth of the bacterial population (Yanko et al. 1978; Gibbs et al. 1997). Here, we observed short-and long-term cycles in the population dynamics of indigenous E.coli inagriculturalsoil(Fig. 1) that may provide fundamental insightsinto thepossiblesurvival strategies adopted by the bacteria, as well as the mecha- nisms responsible for the decay of enteric organisms in the environment. For example, the rapid increase in E. coli numbers observed following a rainfall event (Fig. 1), that raised the soil moisture content after a dry period when previously only small bacterial densities were enu-merated, suggested that an alternative survival and main-tenance mechanism to regrowth might be operating. For instance, thesurvival and rapid recoveryof the enteric community could be explained by a population modifica-tion in response to environmental stress, inducing bacter-ial cells to enter a resistant, metabolically inactive state without loss of viability (Brock and Madigan 1991; Adams and Moss 2000). The organisms may then return to the biochemically active phase under more favourable soil conditions (Alexander 1977). However, the results presented here have generally indicated that, under tem-perate conditions, soil moisture status is not a major fac-tor influencing the survival of enteric bacteria indigenous to the soil microbial community (Table 4; Fig. 4). This is particularly emphasized as the field experiments were conducted on a coarse-textured, sandy loam soil (Table 2) that was potentially vulnerable to moisture stress. The cycles in background E. coli population observed here(Fig. 1) wereconsistent with thegeneral seasonal patterns of total bacterial biomass content measured in temperate soils (Alexander 1977). The bacterial biomass in temperate soils generally increases in autumn and spring, because of favourable conditions of temperature and moisturefor microbial growth and with substrate inputs in the form of crop residues, and it declines in the intervening periods, particularly during the summer when soil conditions are warm and dry. The significant reduc-tion in background numbers of E. coli with time observed in these field experiments (Table 4, Fig. 2a) was therefore probably explained because the trials were established when bacterial numbers were initially at their highest val-ues in the spring or autumn periods and monitoring occurredduringthe normal cycle of microbialdecline during winter or summer. Survival times of enteric bacteria are generally consid-ered to decline in warm soils compared with cooler soil conditions (Van Donsel et al. 1967; Andrews et al. 1983). However,E.coli are relativelythermotolerantandhave the ability to grow at 44Æ 5℃℃C. Consequently, soil tempera-tures observed in the field (0Æ 7°°–25℃℃C) would be expected to modulate the growth rate of the bacteria, as with other soil micro-organisms, but they do not directly determine thecompetenceoftheorganism to surviveinthesoil environment. Several possible mechanisms can be proposed to explain the population dynamics of the background E. coli popula-tion in field soil in relation to short-term (e.g. wetting–drying cycles) and seasonal fluctuations in environmental conditions (Fig. 1). For instance, the observed decline in E. coli in response to rising soil temperatures (Table 4, Figs 2c and 4) is consistent with the increased predatory and grazing activity of protozoa on the soil bacterial biomass observed in warm compared with cooler soil con-ditions (Van Donsel et al. 1967; Acea et al. 1988; Barker et al. 1999; Trevisan et al. 2002). Escherichia coli numbers may also be determined by the presence of antagonistic, lytic or antibiotic-producing flora, which release toxic sub-stances that control the size of the soil bacterial biomass (Grossard 1952; Acea et al. 1988). However, E. coli may adopt a range of possible survival strategies against such inimical conditions including, for instance, chemical defence mechanisms similar to those observed in benthic marine organisms to protect against potential predators (Peters et al. 2003). The ability of E. coli to survive in a diverse range of soil conditions may also be attributable to Rpo-S d s, whichisthe masterregulatorofacomplex network of responsive genes (Barker et al. 1999). These genes have a major role in genetic and physiological responses to environmental stress or nutritional depriva-tion and bacteria, such as E. coli , may become preadapted for survival by exposure to such stress factors. A general stress resistance may therefore develop permitting rapid adaptation to changing environmental conditions (O’Neal et al.1994; Van Overbeek et al.1995;Schellhorn et al.1998).For example,E. coli cells can exhibit enhanced resistancetovariousstresses,suchashightemperature (Jenkins et al. 1988, 1990), so it is possible that they may also become adapted for survival in extreme environmental conditions experienced in the soil. Expression of Rpo-S d s genesmay also permit E. coli to evade digestion if internal-ized withinprotozoa andthussurvivegrazing by soil predators (Barker et al. 1999). The survival of enteric bacteria in soil not only depends ontheir ability to withstand environmental stressand predatory grazing, but also to adapt and compete with other indigenous soil micro-organisms for nutrients. Star-vation resistance, for example, increases the ability to compete for nutrients and this has been shown to play a role in faecal indicator survival in natural environments (Desmarais et al. 2002).Acea et al.(1988)showed that starvation-resistant bacteria suspended in potassium phosphate buffer survived when inoculated into a loam and silt loam soil. However, strains that were susceptible to starvation did not persist in the soil, although follow-ing a nutrient addition (glucose) survival was enhanced. Escherichia coli also demonstrate the ability to adapt to starvation conditions increasing the diversity and survival potentialofthepopulation(Topp et al.2003).Conse-quently, the composition of the soil bacterial community ingeneralandof E.coli inparticular, may changein responsetotheseenvironmental andcompetitivepres- suresaspopulations adapt to improvesurvivalin the environment (Topp et al. 2003). Further evidence of the potentially important role of predators and microbial competitors in regulating E. coli populations in soil was provided from the enumeration of soil amended with the enhanced treated biosolids, which contained significantly fewer indigenous enteric bacteria than the unamended control (Tables 5 and 6). This behaviour may be linked to the multiplication of soil predators and competitors in response to the increased availability of organic substrates applied to the soil in the sludge products (Van Donsel et al. 1967; Opperman et al.1989;Recorbert et al.1992). Differenttypesoforganic soil amendment may stimulate predatory and antagonistic organisms to varying degrees depending on the extent of biological stabilization of the organic matter content. For example, Griffiths et al. (1998) found that protozoa activ-ity increased in soil amended with pig slurry compared with cattle slurry, because of the higher carbon availability ofthe pig waste for microbial utilization in soil. The sludge products applied to the field experiments described here also had contrasting physico-chemical and biological properties. Furthermore, compost supports a diverse aerobic microbial community whereas thermally dried biosolids are practically sterile and devoid of micro-organisms. However, the organic matter content of both products was biologically stabilized by the sludge treat-ment processes. The absence of a statistically significant difference in E.coli populationsinsoil amended with either of these products suggested that the generic micro-biological properties and carbon availabilities of the sludge types were not major factors controlling bacterial suppression in soil. In summary, therefore, enhanced treated biosolids do not contribute E. coli to the soil, but the substrates supplied in the sludge may stimulate the growth and activity of the soil flora potentially suppres-sing background E. coli populations in soil. Conventional treatment processes, such as mesophilic anaerobic digestion, provide a barrier to infectious disease transmission when sludge is used in agriculture by signifi-cantly reducing the pathogen content of the sludge and this is demonstrated by the reduction in E. coli numbers in the treated product compared with the untreated sludge. A 2 log10 removal and a maximum concentration of 105 g )1DS of E. coli are required in the United King-dom for sludgetobeclassedasconventionallytreated andacceptablefor agriculturaluse(Sweet et al. 2001). Therefore, as would be expected, a transient increase in the numbers of E. coli was observed when this sludge type was incorporated into the soil. The decay in E. coli fol-lowing sludge incorporation was rapid and consistent and was independent of the prevailing environmental condi-tions in three individual field experiments established at different times (Tables 7 and 8, Fig. 5). Indeed, the num-bers of E. coli in arable soil amended with DMAD were indistinguishable from those of the background popula-tion within c .3 monthsof sludgeapplication.Further-more, this response occurred independently of the E. coli concentration in the applied sludge, which varied between 5Æ 6 and 7Æ 1 log10 g )1DS (Table 3). The initial numbers of E. coli measured in the experimental soil were also likely to be much larger than those obtained under normal operational conditions as the sludge was incorporated to a depth of 10 cm, whereas cultivation to a depth of 22–25 cm would be more typical of agricultural practice in the field. These observations have a number of important potential implications relating to the practical significance of the numerical microbiological standards for E. coli in conventionalbiosolidsand thepotential riskto health from the agricultural use of this sludge type. 1. A 2 log10 reduction in E. coli demonstrates that the sludge treatment process has exerted a degree of stress on the enteric microbial population in sludge and conse-quently: a. pathogen numbers will be reduced b. residual pathogens will be potentially more sus-ceptible to decay when environmentally exposed c. an effective barrier to transmission is imposed. 2. Given 1 above, there would appear to be no practical or technical requirement for also establishing a maximum limit on E. coli numbers in conventionally treated sludge. This is supported because: a. decay occurs rapidly in temperate soil conditions and is largely independent of seasonal factors and input concentrations in the sludge b. soil is a naturally aggressive, suppressive environ-ment for the survival of enteric bacteria and the biological andecological mechanisms responsible forreducing E. coli numbersinagricultural soil operate over the range of environmental conditions that occur in the temperate field soils of the United Kingdom. 3. The data reported here provides assurance that resid-ual numbers of pathogens applied to soil in treated biosolids decay to background values well within the cropping and harvesting restrictions stipulated for agricul-turaluse(DoE; Department oftheEnvironment1996; ADAS; Agricultural Development and Advisory Service 2001) and that the waiting periods specified in the con-trols provide a significant margin of safety. The general survival responses of enteric organisms to environmentaland soil factors are relatively well docu-mented. However, further experimental work is necessary to develop specific quantitative relationships between pathogensurvivalpropertiesindifferentsoiltypesand environmental conditions. Fundamental investigations into the biological suppression mechanisms operating in agricultural soil are also required. This information is necessary to predict the long-term behaviour and fate of pathogens in soil to determine the potential risks to health from spreading sewage sludge and livestock man-ures on land used for food production. Acknowledgements The work presentedhere was partofaprogramme of research: Predicting Agricultural Benefit of Novel Biosolids Products , funded by the Environment Agency, Severn Trent Water,Thames Water,Yorkshire Water,Scottish Water and the EPSRC. The authors thank Dr Eddie Pike and members of the Project Steering Group for their advice and suggestions during the course of the research. References Acea, M.J., Moore, C.R. and Alexander, M. (1988) Survival and growth of bacteria introduced into soil. Soil Biol Bio-chem 20, 509–515. Adams, M.R. and Moss, M.O. (2000) Food Microbiology , 2nd edn. Cambridge, UK: Royal Society of Chemistry. ADAS; Agricultural Development and Advisory Service (2001) The Safe Sludge Matrix. Guidelines for the Application of Sewage Sludge to Arable and Horticultural Crops , 3rd edn.(http://www.adas.co.uk). Alexander, M. (1977) Introduction to Soil Microbiology , 2nd edn. New York, USA: John Wiley and Sons. Andrews, D.A., Mawer, S.L. and Matthews, P.J. (1983) Survival of salmonellae in sewage sludge injected into soil. Effluent Water Treat J 23, 72–74. APHA; American Public Health Association (1998) Standard Methods for the Examination of Water and Wastewater ,20th edn. Maryland, USA: United Book Press. Barker, J., Humphrey, T.J. and Brown, M.W.R. (1999) Survival of Escherichia coli O157 in a soil protozoan: implications for disease. FEMS Microbiol Lett 173, 291–295. Bell, R.G. (1976) Persistence of faecal coliform indicator bac-teria on alfalfa irrigated with municipal sewage lagoon effluent. J Environ Quality 5, 39–42. Benckiser, G. and Simarmata, T. (1994) Environmental impact of fertilizing soil by using sewage and animal waste. Ferti-liser Res 37, 1–22. Brock, T.D. and Madigan, M.T. (1991) Biology of Microorgan-isms , 6th edn. New Jersey, USA: Prentice Hall Inc. BSI; British Standards Institution (1994) Soil Quality – Part 3:Chemical Methods – Section 3.1. Determination of Dry Mat-ter and Water Content on a Mass Basis by a Gravimetric Method . BS 7755-3.1:1994; ISO 11465:1993. London, UK:BSI. BSI; British Standards Institution (2001)Water Quality – Part 1: Detection and Enumeration of Bacteriophages – Enumer- ation of F-specific RNA Bacteriophage . BS 6068-4.11:1996; BS EN ISO 10705-1:2001. London, UK: BSI. Carrington, E.G.(2001) Evaluation of Sludge Treatments for Pathogen Reduction – Final Report . Study Contract No. B4-3040⁄ 2001⁄ 322179⁄MAR ⁄ A2 for the European Commis-sion Directorate-General Environment. WRc Ref:CO5026⁄ 1. Marlow, UK: WRc Medmenham (http://ec.eur-opa.eu/environment ⁄waste ⁄ sludge ⁄ sludge_eval.pdf). CEC; Commission of the European Communities (2000) Working Document on Sludge 3rd Draft . 27 April 2000, DG ENV.E.3⁄ LM. European Commission, Directorate-General Environment, Brussels (http://ec.europa.eu/environment/waste ⁄ sludge ⁄ sludge_en.pdf). CEC; Council of the European Communities (1986) Council Directive of 12 June 1986 on the protection of the envi-ronment, and in particular of the soil, when sewage sludge is used in agriculture (86⁄ 278⁄ EEC).Official Journal of the European Communities No. L181, 6–12. Crathorne, B., Rowlands, C., Bryson, P., Cochrane, J. and Sweet, N.(2002) Implementation of HACCP controls under the new sludge (use in agriculture) regulations. Proceedings of the Joint CIWEM Aqua Enviro Consultancy Services 7th European Biosolids and Organic Residuals Conference , 18–20 November, Wakefield, UK. Desmarais, T.R., Solo-Gabriele, H.M. and Palmer, C.J. (2002) Influence of soil on faecal indicator organisms in a tidally influenced subtropical environment. Appl Environ Micro-biol 68, 1165–1172. DoE; Department of the Environment (1996) Code of Practice for Agricultural Use of Sewage Sludge . London, UK: HMSO. Evans, S.J. (1996) A case control study of multiple resistant Salmonella typhimurium DT 104 infection of cattle in Great Britain. Cattle Practice 4, 259–263. Fukushi, K., Babel, S. and Burakrai, S. (2003) Survival of Salmonella spp. in a simulated acid-phase anaerobic digester treating sewage sludge. Bioresour Technol 86, 53–57. Gibbs, R.A., Hu, C.J., Ho, G.E. and Unkovich, I. (1997) Re-growth of faecal coliforms and salmonellae in stored biosolids and soil amended with biosolids.Water Sci Tech-nol 35, 269–275. Griffiths, B.S., Wheately, R.E., Olesen, T., Henriksen, K., Ekel-und, F. and Ronn, R. (1998) Dynamics of nematodes and protozoa following the experimental addition of cattle or pig slurry to soil. Soil Biol Biochem 30, 1379–1387. Grossard, E. (1952) Antibiotic production by fungi on organic manures and in soil. J Gen Microbiol 6, 295–310. Havelaar, A.H. and Hogeboom, W.M. (1984) A method for the enumeration of male-specific bacteriophages in sewage. J Appl Bacteriol 56, 439–447. Havelaar, A.H. and Niewstad, T.J. (1985) Bacteriophages in faecal bacteria as indicators of chlorination efficiency of geologically treated wastewater. J Water Pollut Control Fed-eration 57, 1084–1088. Hay, J.C. (1996) Pathogen destruction and biosolids compost-ing. Biocycle 37, 67–76. HoC; House of Commons (1998) Sewage Treatment and Dis-posal . Second Report of the Environment, Transport and Regional Affairs Committee, HC 266-1. London, UK: The Stationery Office. Humphrey, N. (1999) A Survey of E. coli in UK Sludges . Report No.: Sewage Sludge-99⁄ SL ⁄ 06⁄ 3.London, UK: UKWater Industry Research. ISBN: 1 84057 168 3 (http://www. ukwir.org/ukwirlibrary/346). Jenkins, D.E., Schultz, J.E. and Matin, A. (1988) Starvation-induced cross protection against heat or H2O2 challenge in Escherichia coli . J Bacteriol 170, 3910–3914. Jenkins, D.E., Chaisson, S.A. and Matin, A. (1990) Starvation-induced cross protection against osmotic challenge in Escherichia coli . J Bacteriol 172, 2779–2781. Lang, N.L., Smith, S.R., Pike, E.B. and Rowlands, C.L.(2002) Methods for the enumeration of Salmonella species in sewage sludge and soil. Proceedings of the Joint CIWEM Aqua Enviro Technology Transfer 7th European Biosolids and Organic Residuals Conference , 18–20 November, Wakefield, UK. O’Neal, C.R.,Gabriel,W.M., Turk, A.K., Libby, S.J., Fang, F.C. and Spector,M.P. (1994) RpoS is necessary for both the positive and negative regulation of starvation survival genes during phosphate, carbon and nitrogen starvation in Salmonella typhimurium . J Bacteriol 176, 4610–4616. Opperman, M.H., Wood, M. and Harris, P.J. (1989) Changes in microbial population following the application of cattle slurry to soil at two temperatures. Soil Biol Biochem 21,263–268. Parker, W.F. and Mee, B.J. (1982) Survival of Salmonella ade-laide and faecal coliforms in coarse sands and swan coastal plain, Western Australia. Appl Environ Microbiol 43, 981–986. Peters, L., Ko¨nig, G.M., Wright, A.D., Pukall, R., Stackebrandt, E., Eberl, L. and Riedel, K. (2003) Secondary metabolites of Flustra foliacea and their influence on bacteria. Appl Environ Microbiol 69, 3469–3475. Ponugoti, P.R., Dahab, M.F. and Surampalli, R. (1997) Effects of different biosolids treatment systems on pathogen and pathogen indicator reduction.Water Environ Res 69, 1195–1206. Quinn, G.P. and Keough, M.J. (2002) Experimental Design and Data Analysis for Biologists . Cambridge, UK: Cambridge University Press. RCEP; Royal Commission on Environmental Pollution (1996) Nineteenth Report: Sustainable Use of Soil . Cm 3165. Lon-don, UK: HMSO. Recorbert, G., Steinberg, C. and Faurie, G. (1992) Survival in soil of genetically engineered Escherichia coli as related to inoculum density, predation and competition. FEMS Microbiol Ecol 101, 251–260. Sartory, D.P. and Howard, L. (1992) A medium detecting b -glucuronidase for the simultaneous membrane filtration enumeration of Eschericha coli and coliforms from drink-ing water. Lett Appl Microbiol 15, 273–276. SCA; Standing Committee of Analysts (2003a) The Microbio-logy of Sludge – Part 2 – Practices and Procedures for Samp-ling and Sample Preparation .Methods for the Examination of Waters and Associated Materials No. 189. London, UK:HMSO. SCA; Standing Committee of Analysts (2003b) The Microbio-logy of Sludge – Part 3 – Methods for the Isolation and Enu-meration of Escherichia coli Including Verocytotoxigenic Escherichia coli .Methods for the Examination of Waters and Associated Materials No. 190. London, UK: HMSO. Schellhorn, H.E., Audia, J.P., Wei, L.I.C. and Chang, L. (1998) Identification of conserved, RpoS-dependent stationary-phase genes of Escherichia coli . J Bacteriol 180, 6283–6291. SI; Statutory Instrument (1989) The Sludge (Use in Agriculture) Regulations . SI No. 1263 as amended (1990) SI No. 880. London, UK: HMSO. Sweet, N., McDonnell, E., Cochrane, J. and Prosser, P. (2001) The new sludge (use in agriculture) regulations. Proceed-ings of the Joint CIWEM Aqua Enviro Consultancy Services 6th European Biosolids and Organic Residuals Conference ,12–14 November, Wakefield, UK. Topp, E., Welsh, M., Tien, Y.C., Dang, A., Lazarovits, G., Conn, K. and Zhu, H. (2003) Strain-dependent variability in growth and survival of Escherichia coli in agricultural soil. FEMS Microbiol Ecol 44, 303–308. Trevisan, D., Vansteelant, J.Y. and Dorioz, J.M. (2002) Survival and leaching of faecal bacteria after slurry spreading on mountain hay meadows: consequences for the manage-ment of water contamination risk.Water Res 36, 275–283. US EPA; United States Environmental Protection Agency (1993) Part 503 standards for the use or disposal of sewage sludge. Federal Register 58, 9387–9404. Van Donsel, D.J., Geldreich, E.E. and Clarke, N.A. (1967) Sea-sonal variations in survival of indicator bacteria in soil and their contribution to stormwater pollution. Appl Microbiol 15, 1361–1370. Van Overbeek, L.S., Eberl, L., Givskov, M., Molin, S. and Van Elas, J.D. (1995) Survival of, and induced stress resistance in, carbon-starved Pseudomonas fluorescens cells residing in soil. Appl Environ Microbiol 61, 4202–4208. Watanabe, H., Kitamura, T., Ochi, S. and Ozaki, M. (1997) Inactivation of pathogenic bacteria under mesophilic and thermophilic conditions. Water Sci Technol 36,25–32. WHO;World Health Organization (1981) The Risk to Health of Microbes in Sewage Sludge Applied to Land . Report on a WHOWorking Group, Stevenage, 6–9 January 1981, EURO Reports and Studies No. 54. Copenhagen: World Health Organization, Regional Office for Europe. Yanko, W.A., Glass, J.S., Van Sluis, R.J., Dahlegren, J.A. and Easly, R.C. (1978) Survival of Pathogenic and Indicator Microorganisms in Sewage Sludge Amended Agricultural Soil: Winter and Summer Growing Seasons, 1977. Whittier California, US: County Sanitation Districts of Los Angeles County, San Jose Creek Water Quality Lab.
确定
还剩13页未读,是否继续阅读?

产品配置单
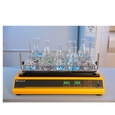

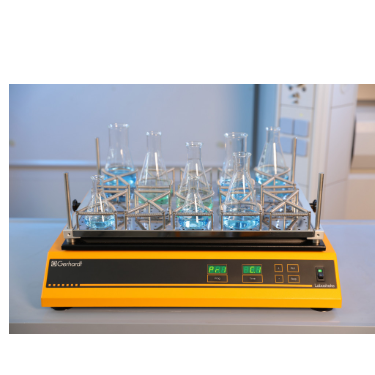
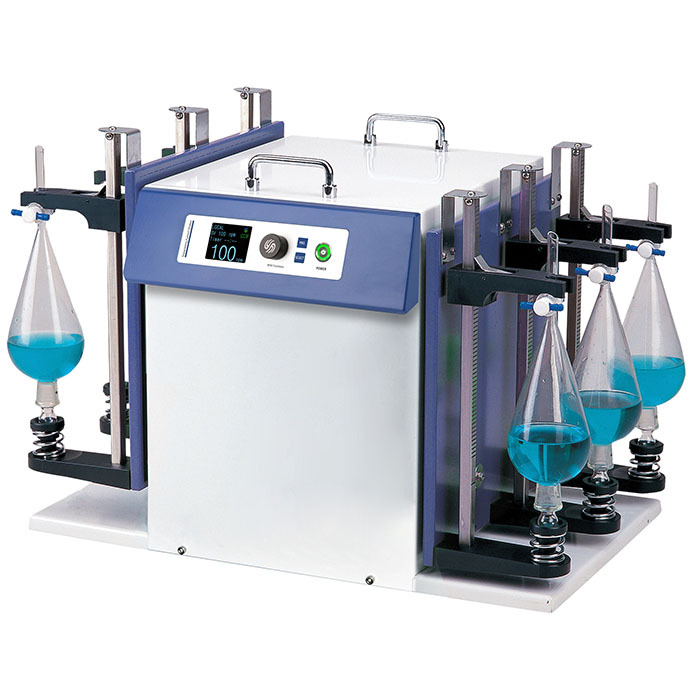
中国格哈特为您提供《污泥和改良土壤中大肠杆菌、沙门氏菌和噬菌体检测的样品振荡》,该方案主要用于土壤中样品振荡检测,参考标准--,《污泥和改良土壤中大肠杆菌、沙门氏菌和噬菌体检测的样品振荡》用到的仪器有格哈特强力高重现振荡器LS500/RO500、格哈特快速干燥仪STL56、德国移液器MM
推荐专场
快速干燥仪
更多

相关方案
更多
该厂商其他方案
更多