


光学显微镜的空间分辨率受到可见光波长的限制(“衍射极限”,大约250nm)。小于此限制的亚细胞结构的分辨率可以通过随机光学重建显微镜(STORM)和超分辨率光学波动成像(SOFI)等超分辨率方法实现。本文中研究者旨在使用STORM和SOFI解析完整白质内的亚细胞结构(轴突,髓鞘和星形胶质细胞过程)。
方案详情

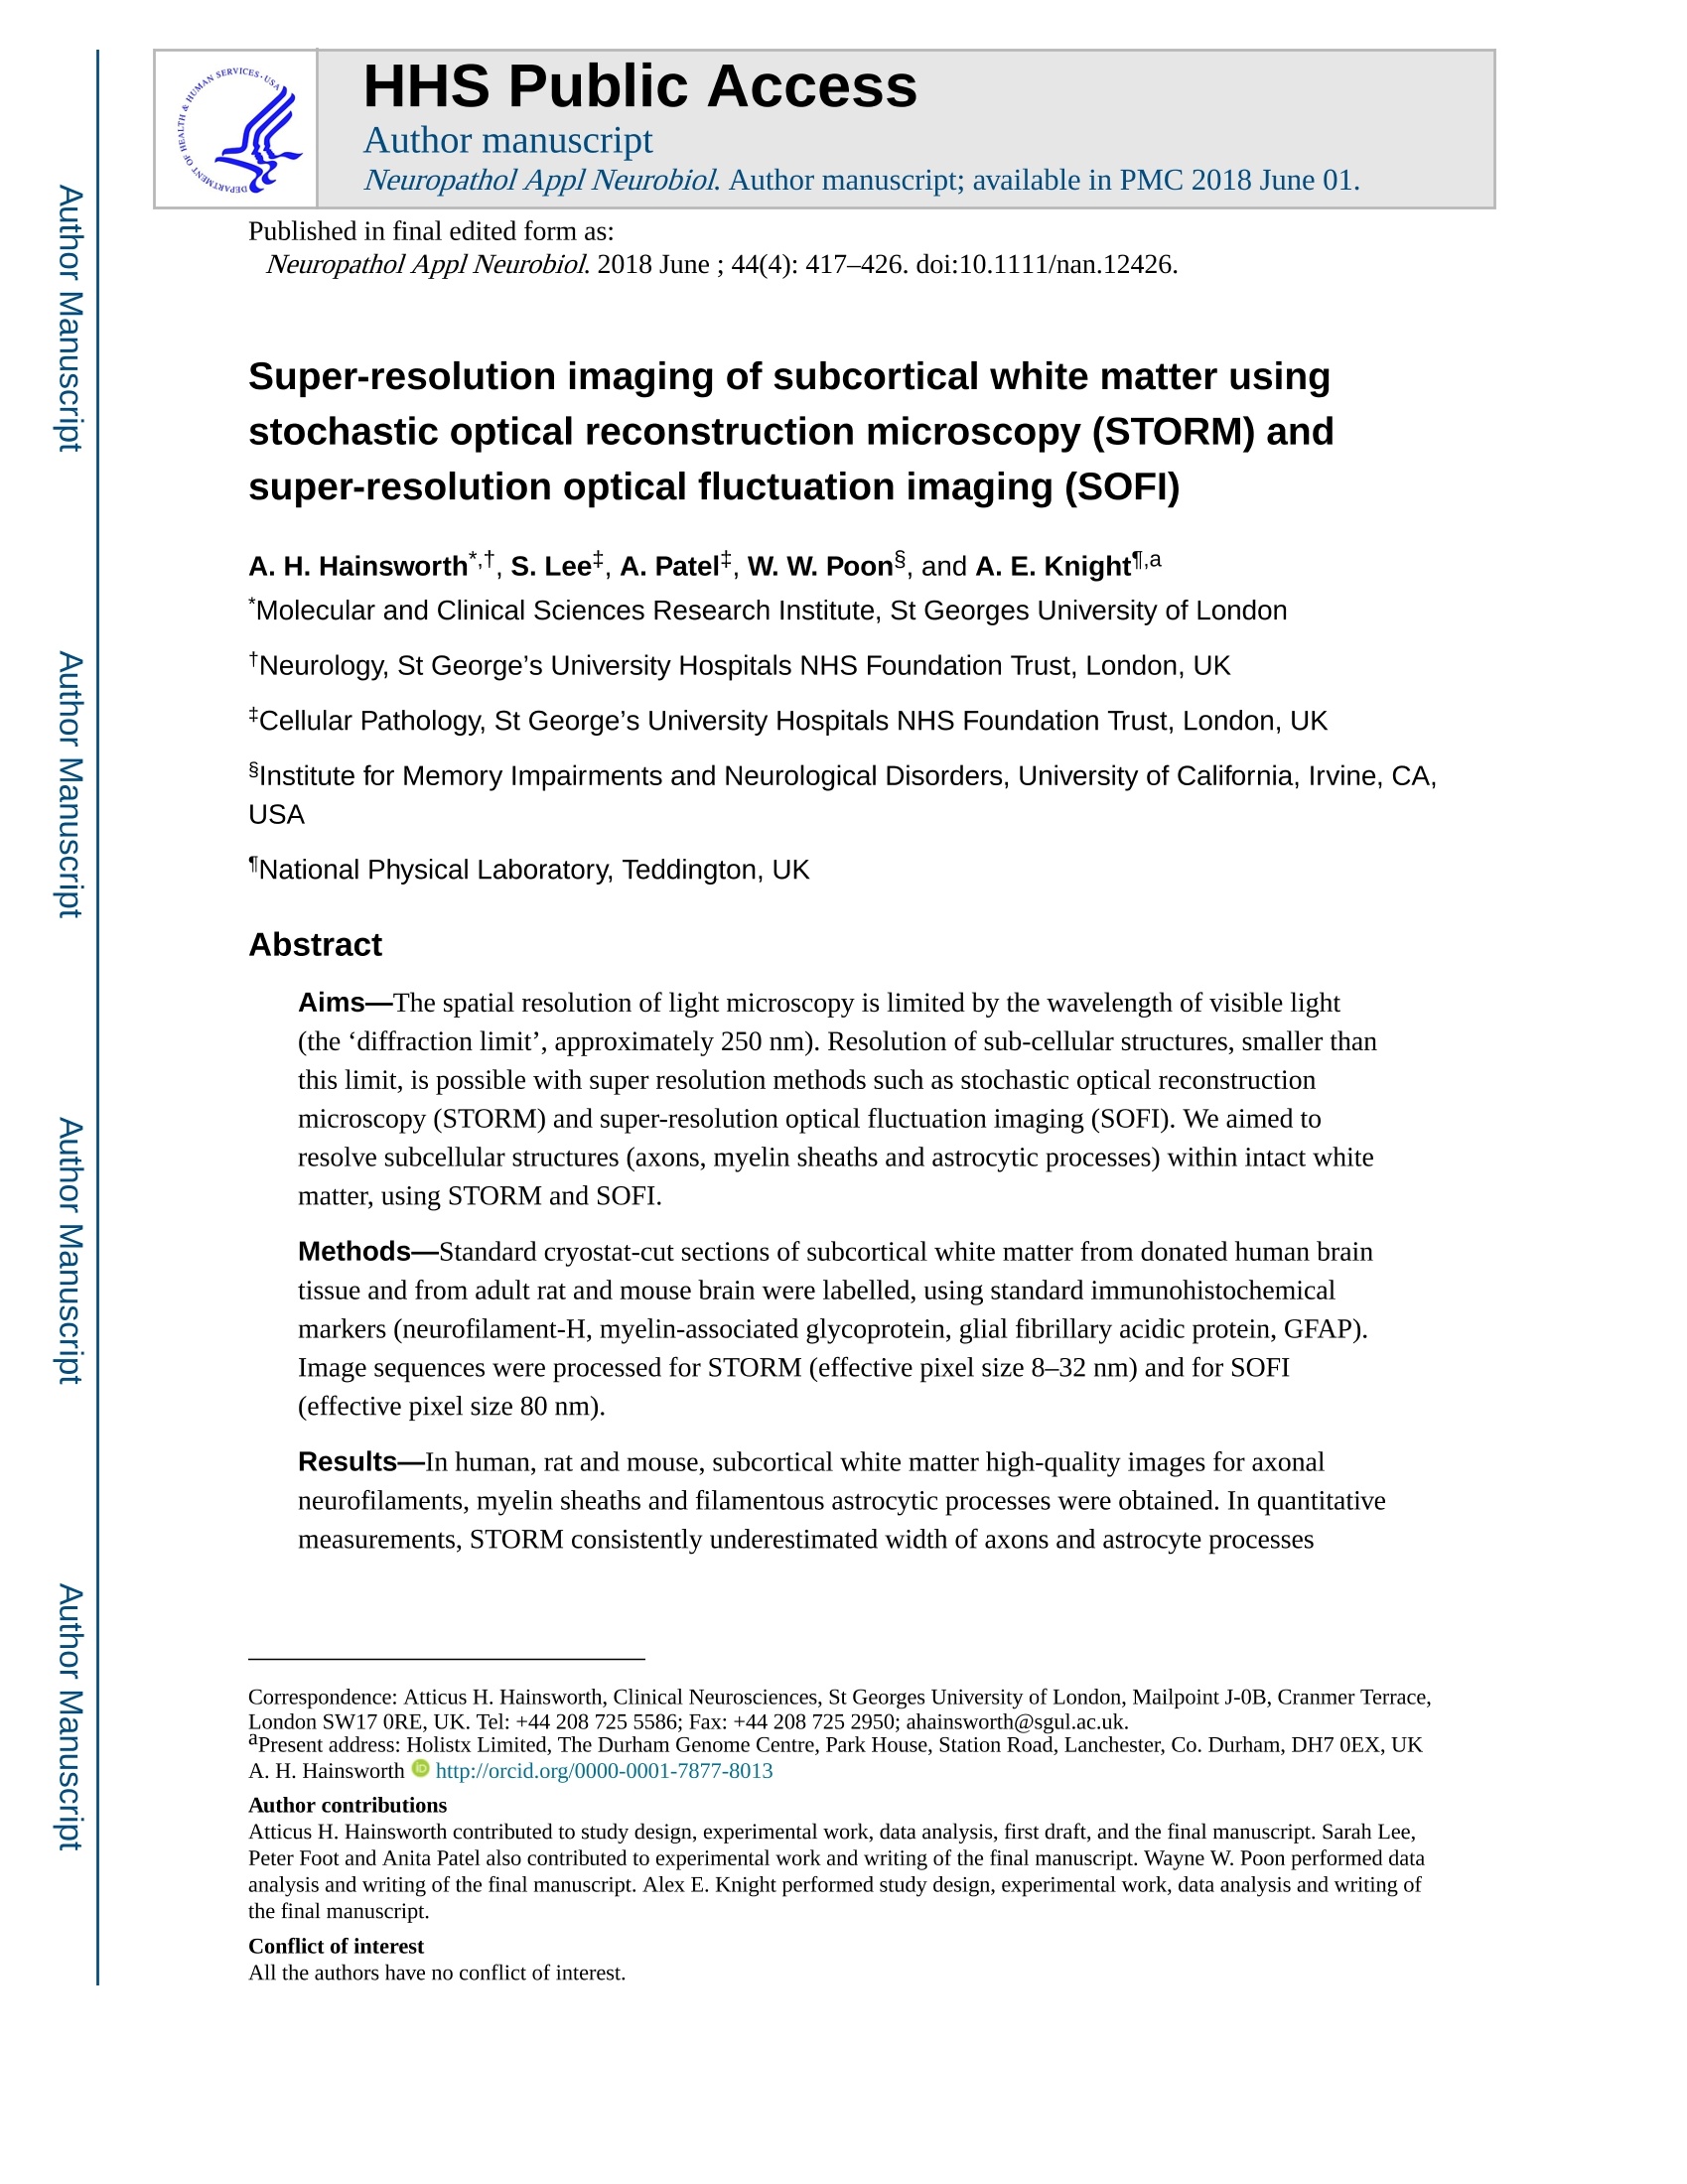
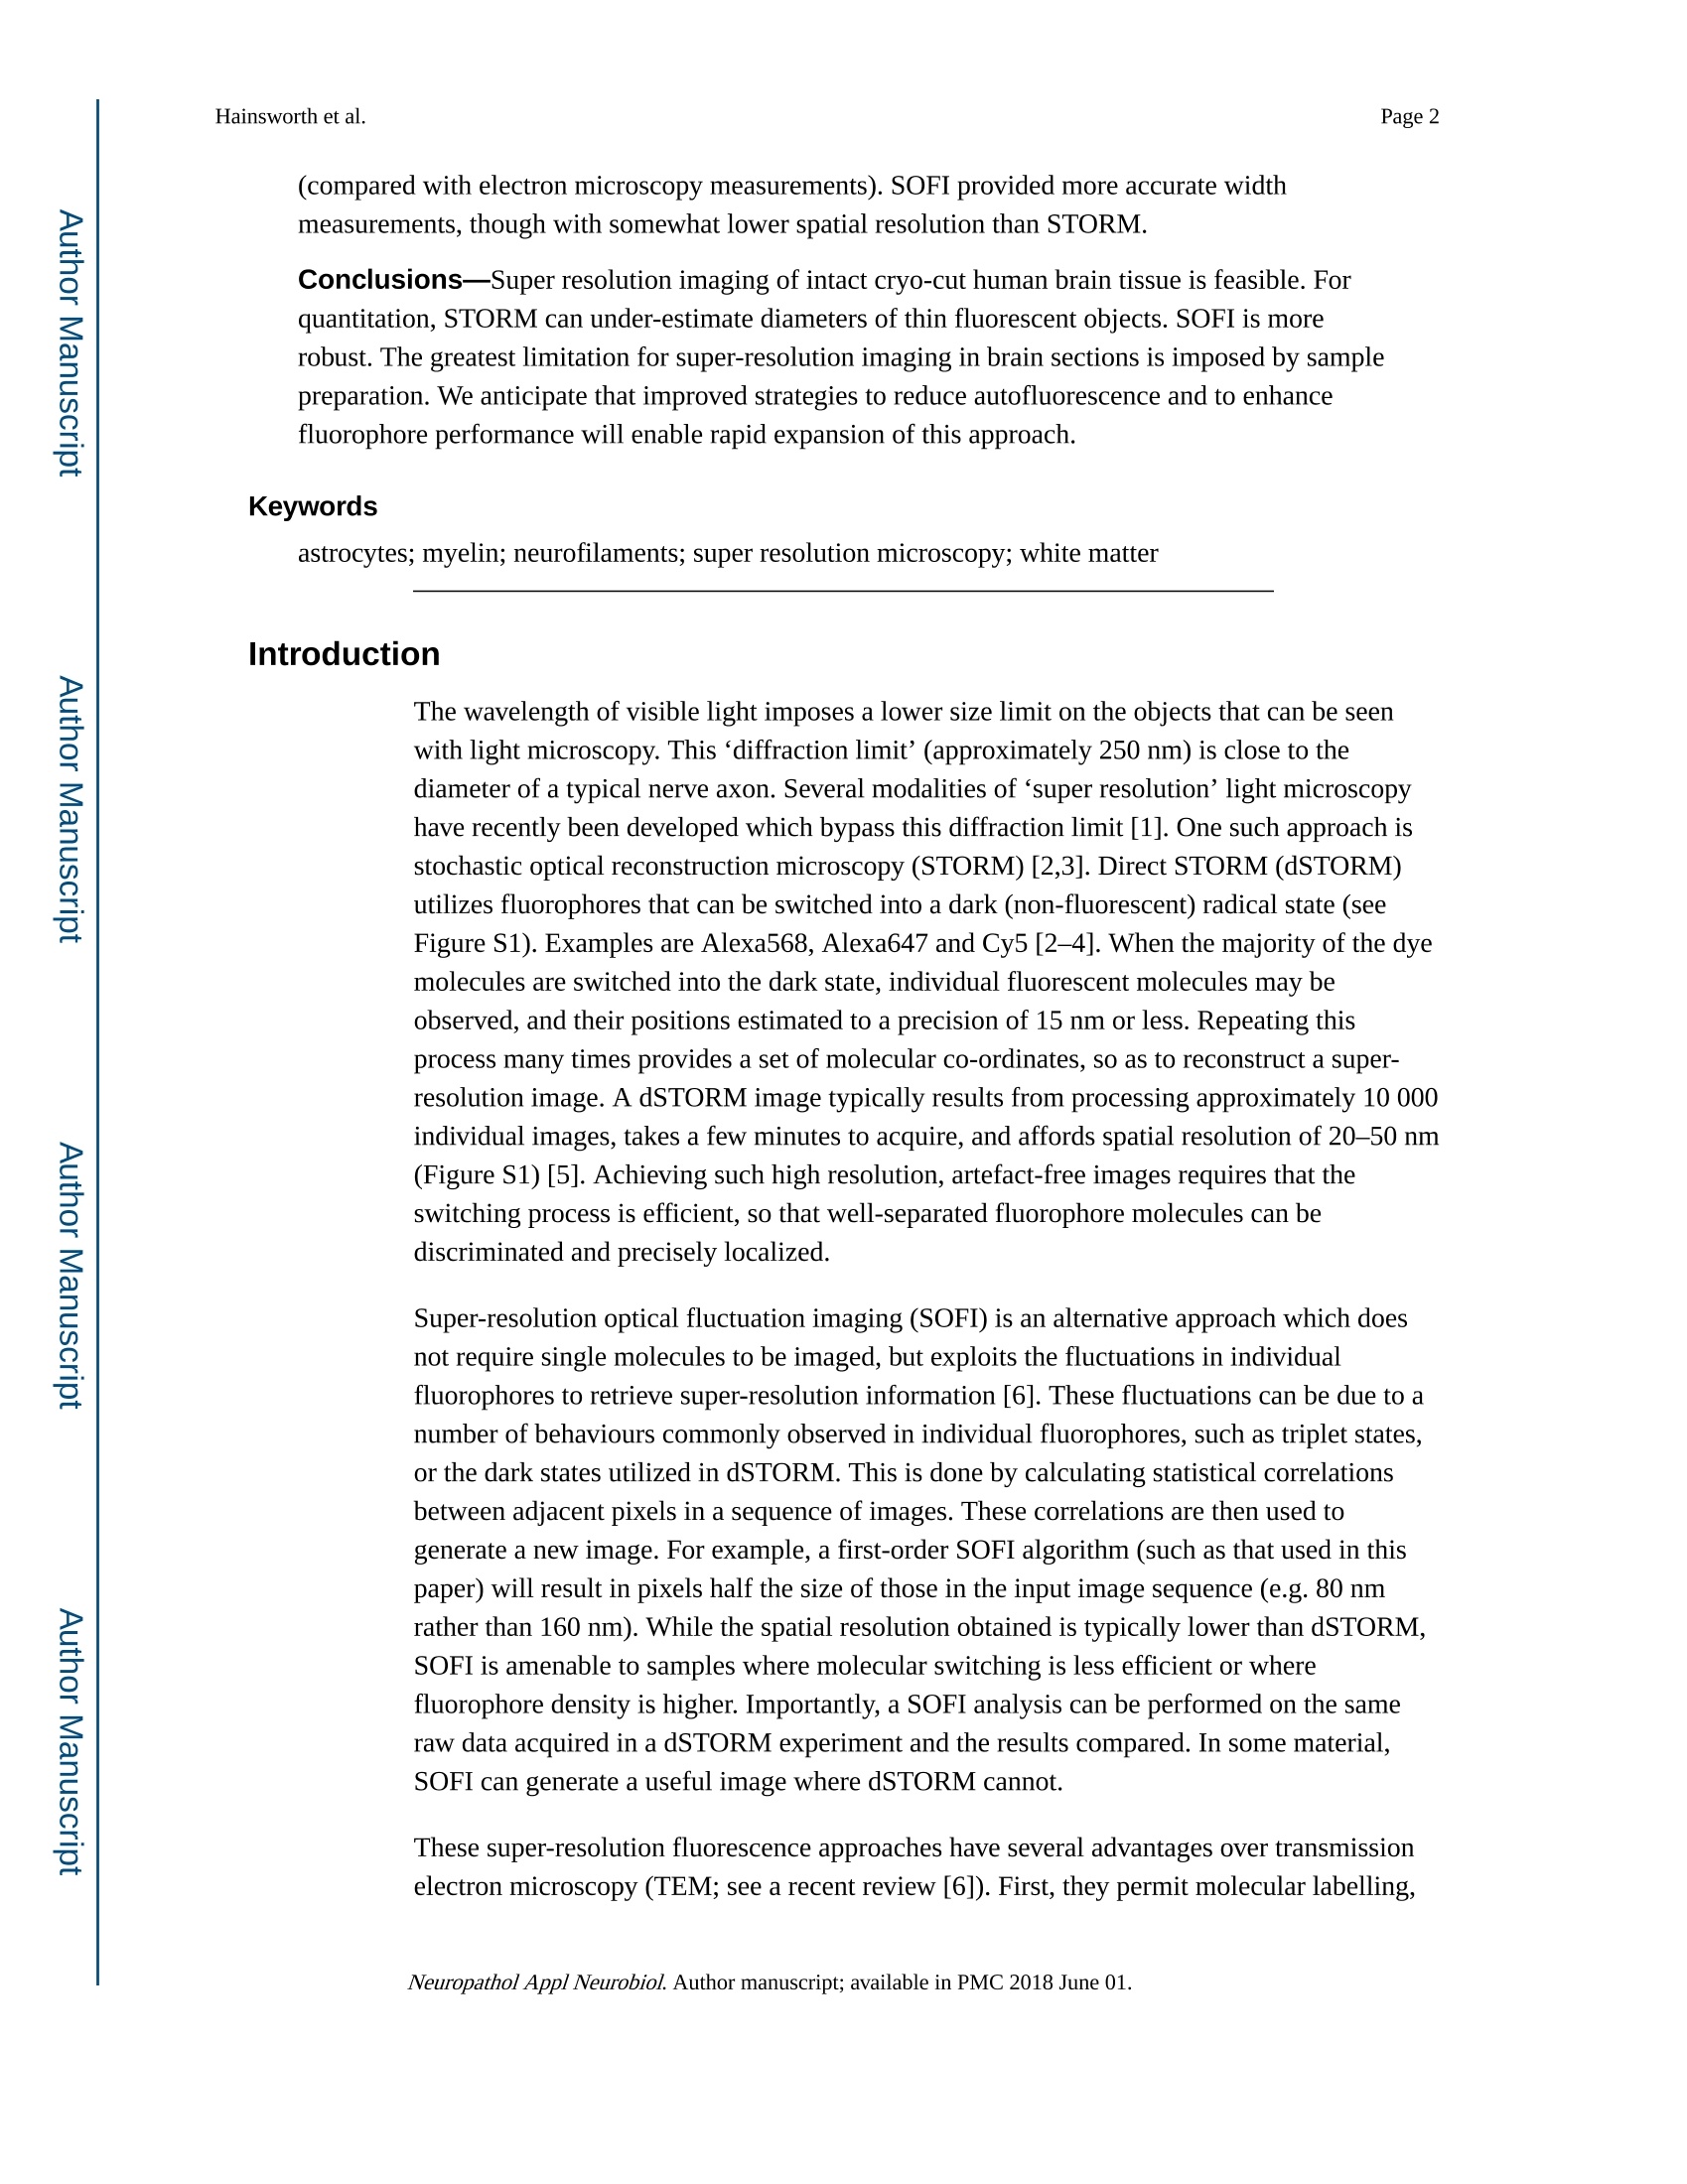
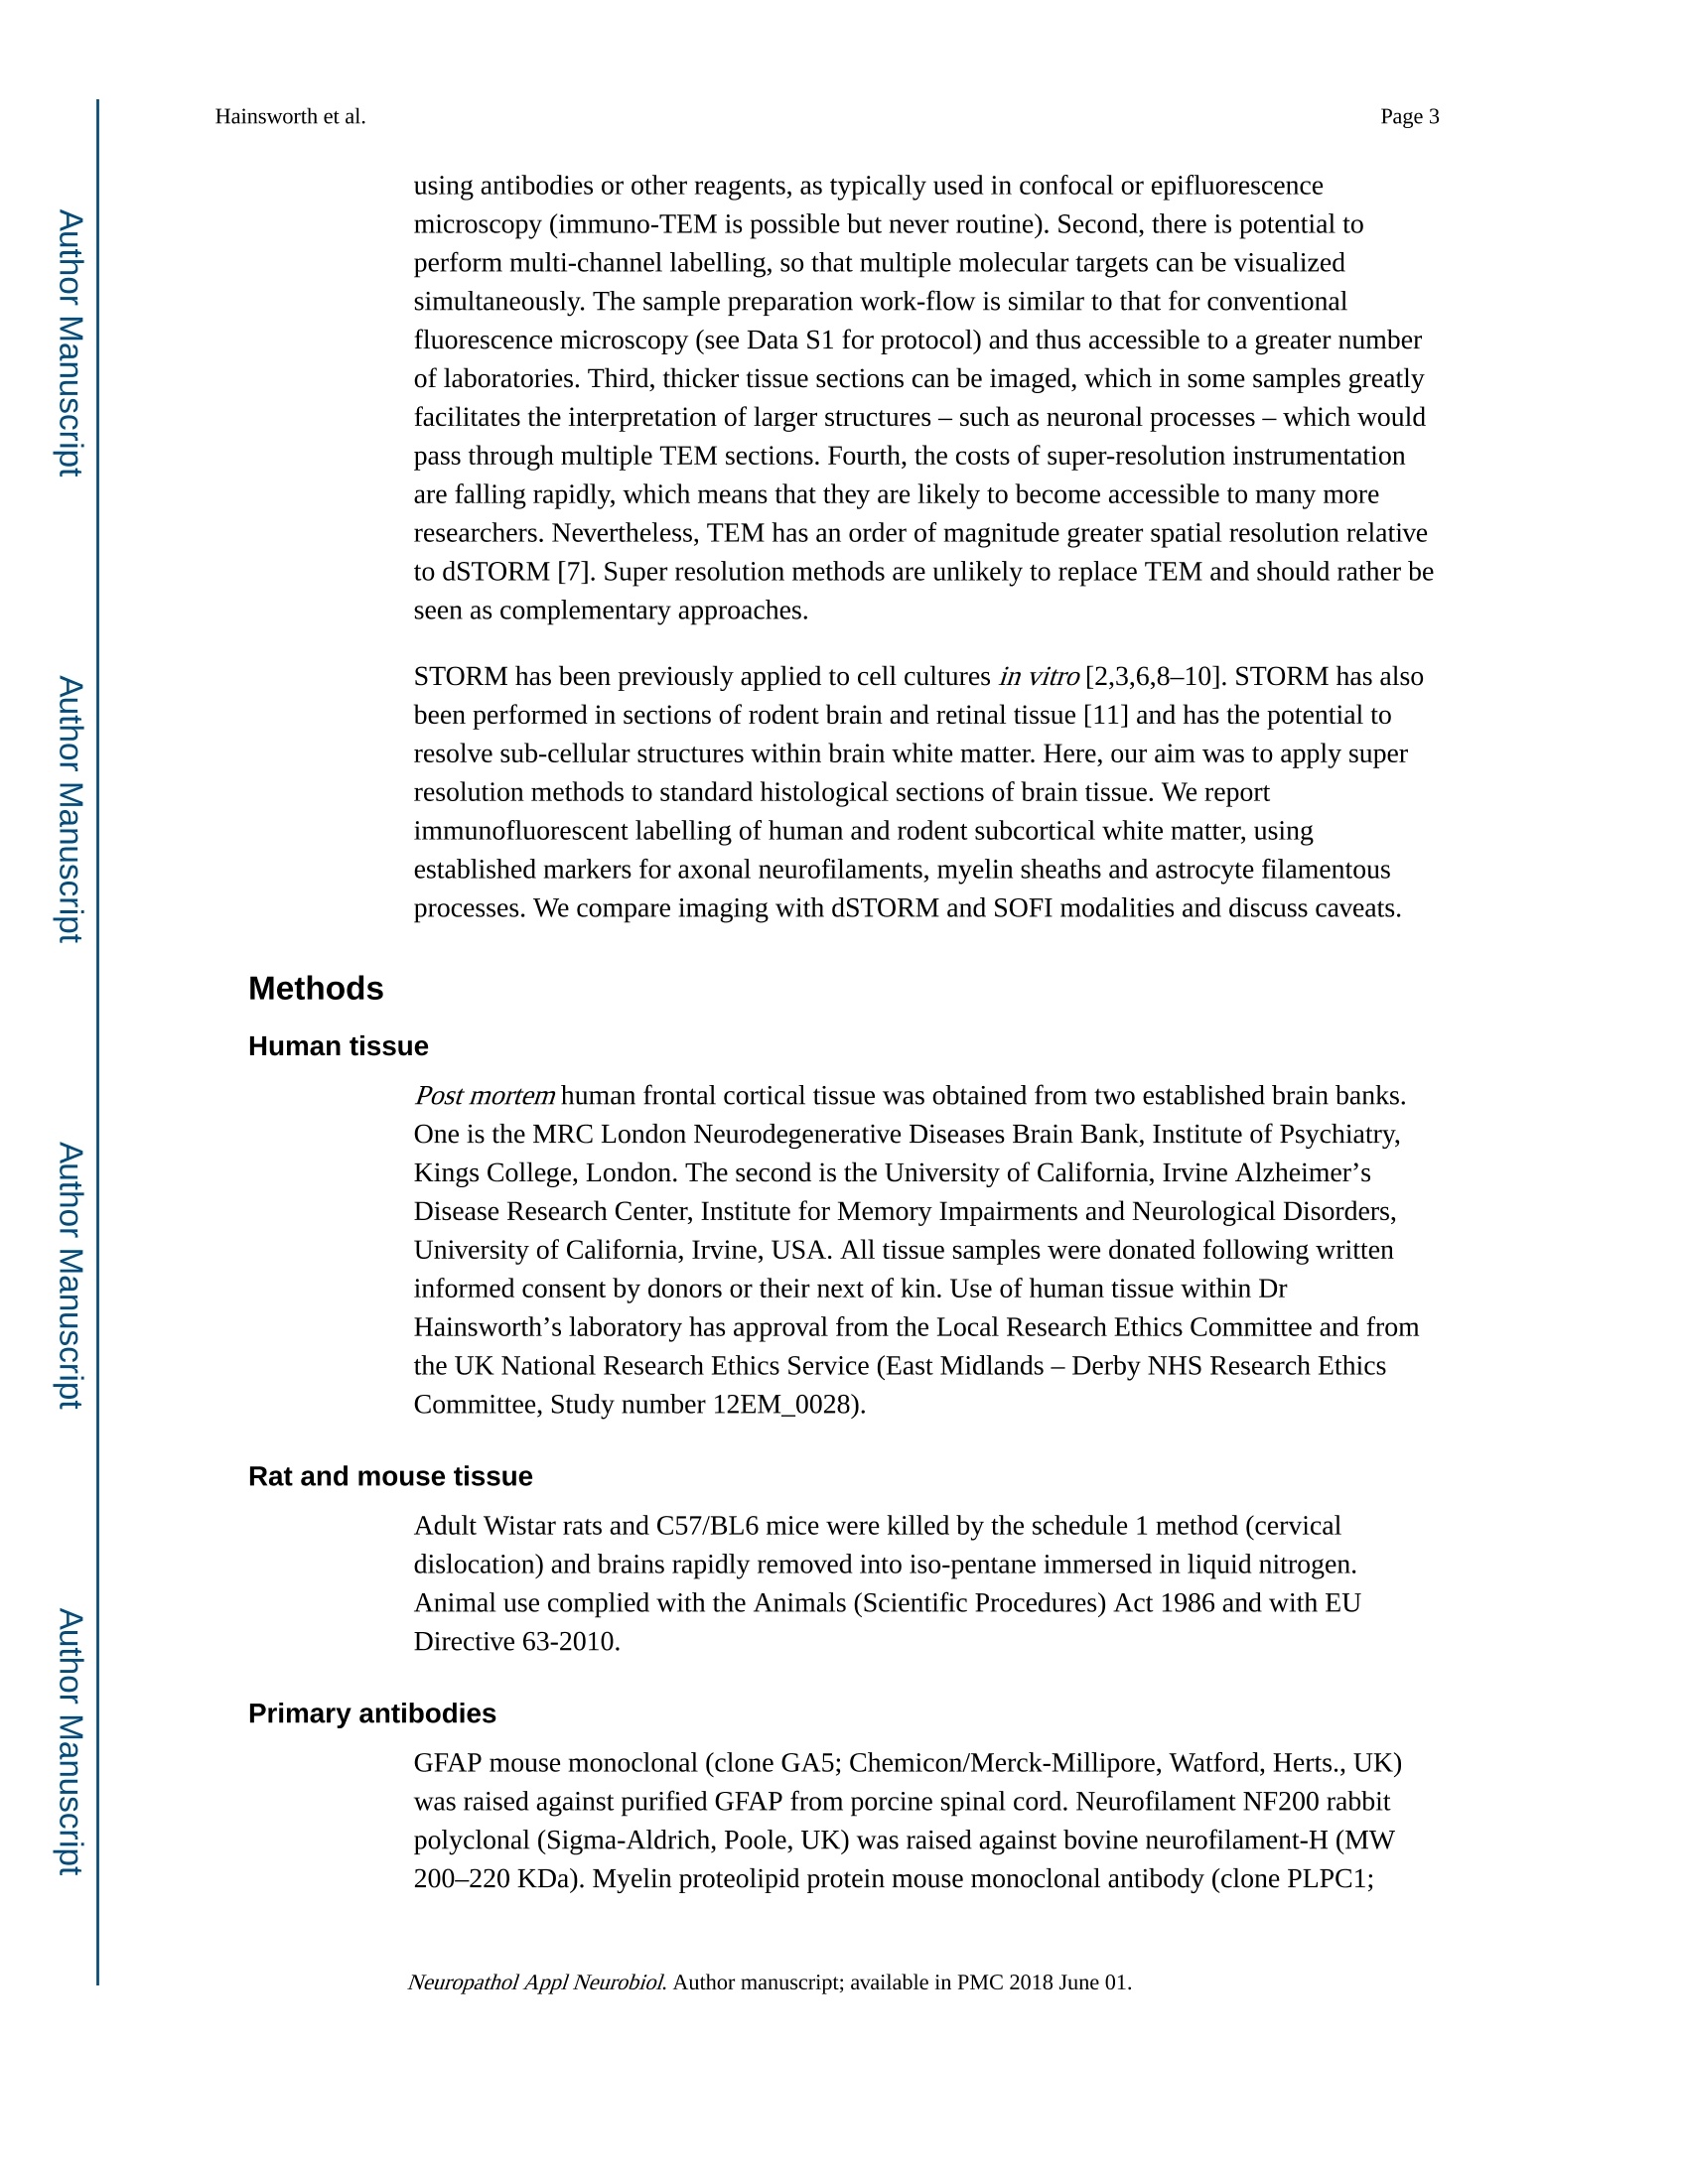
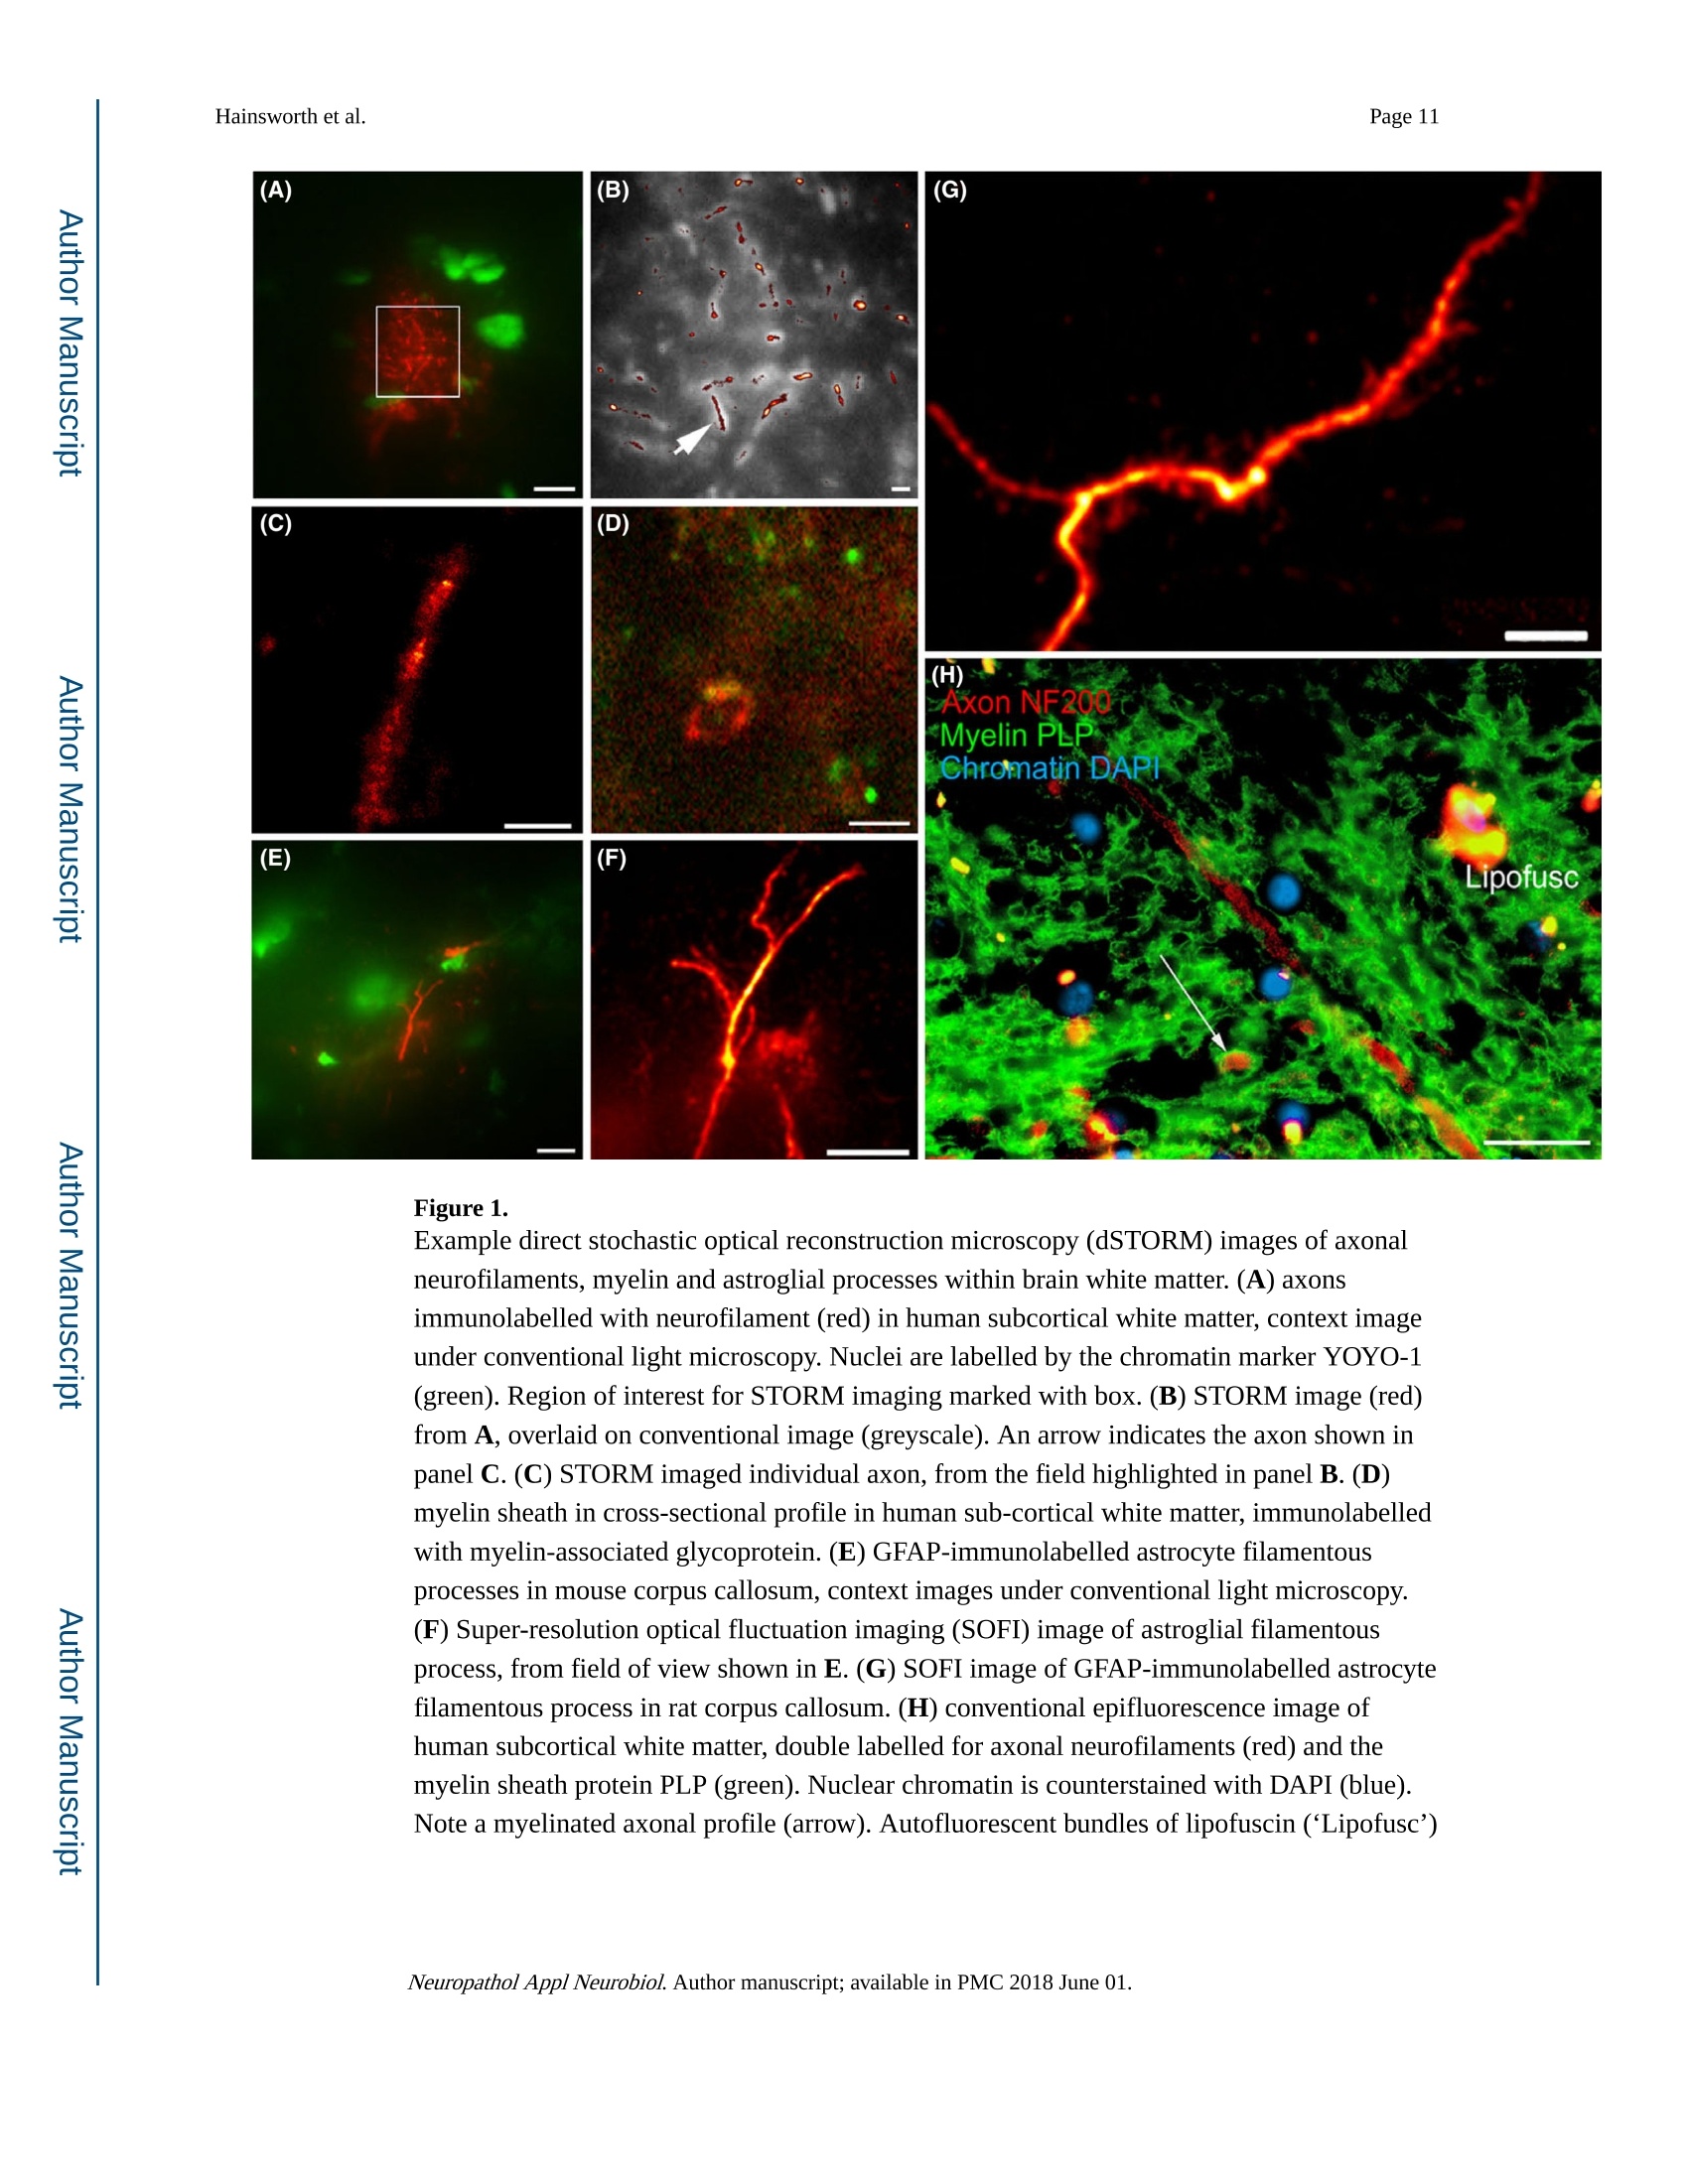
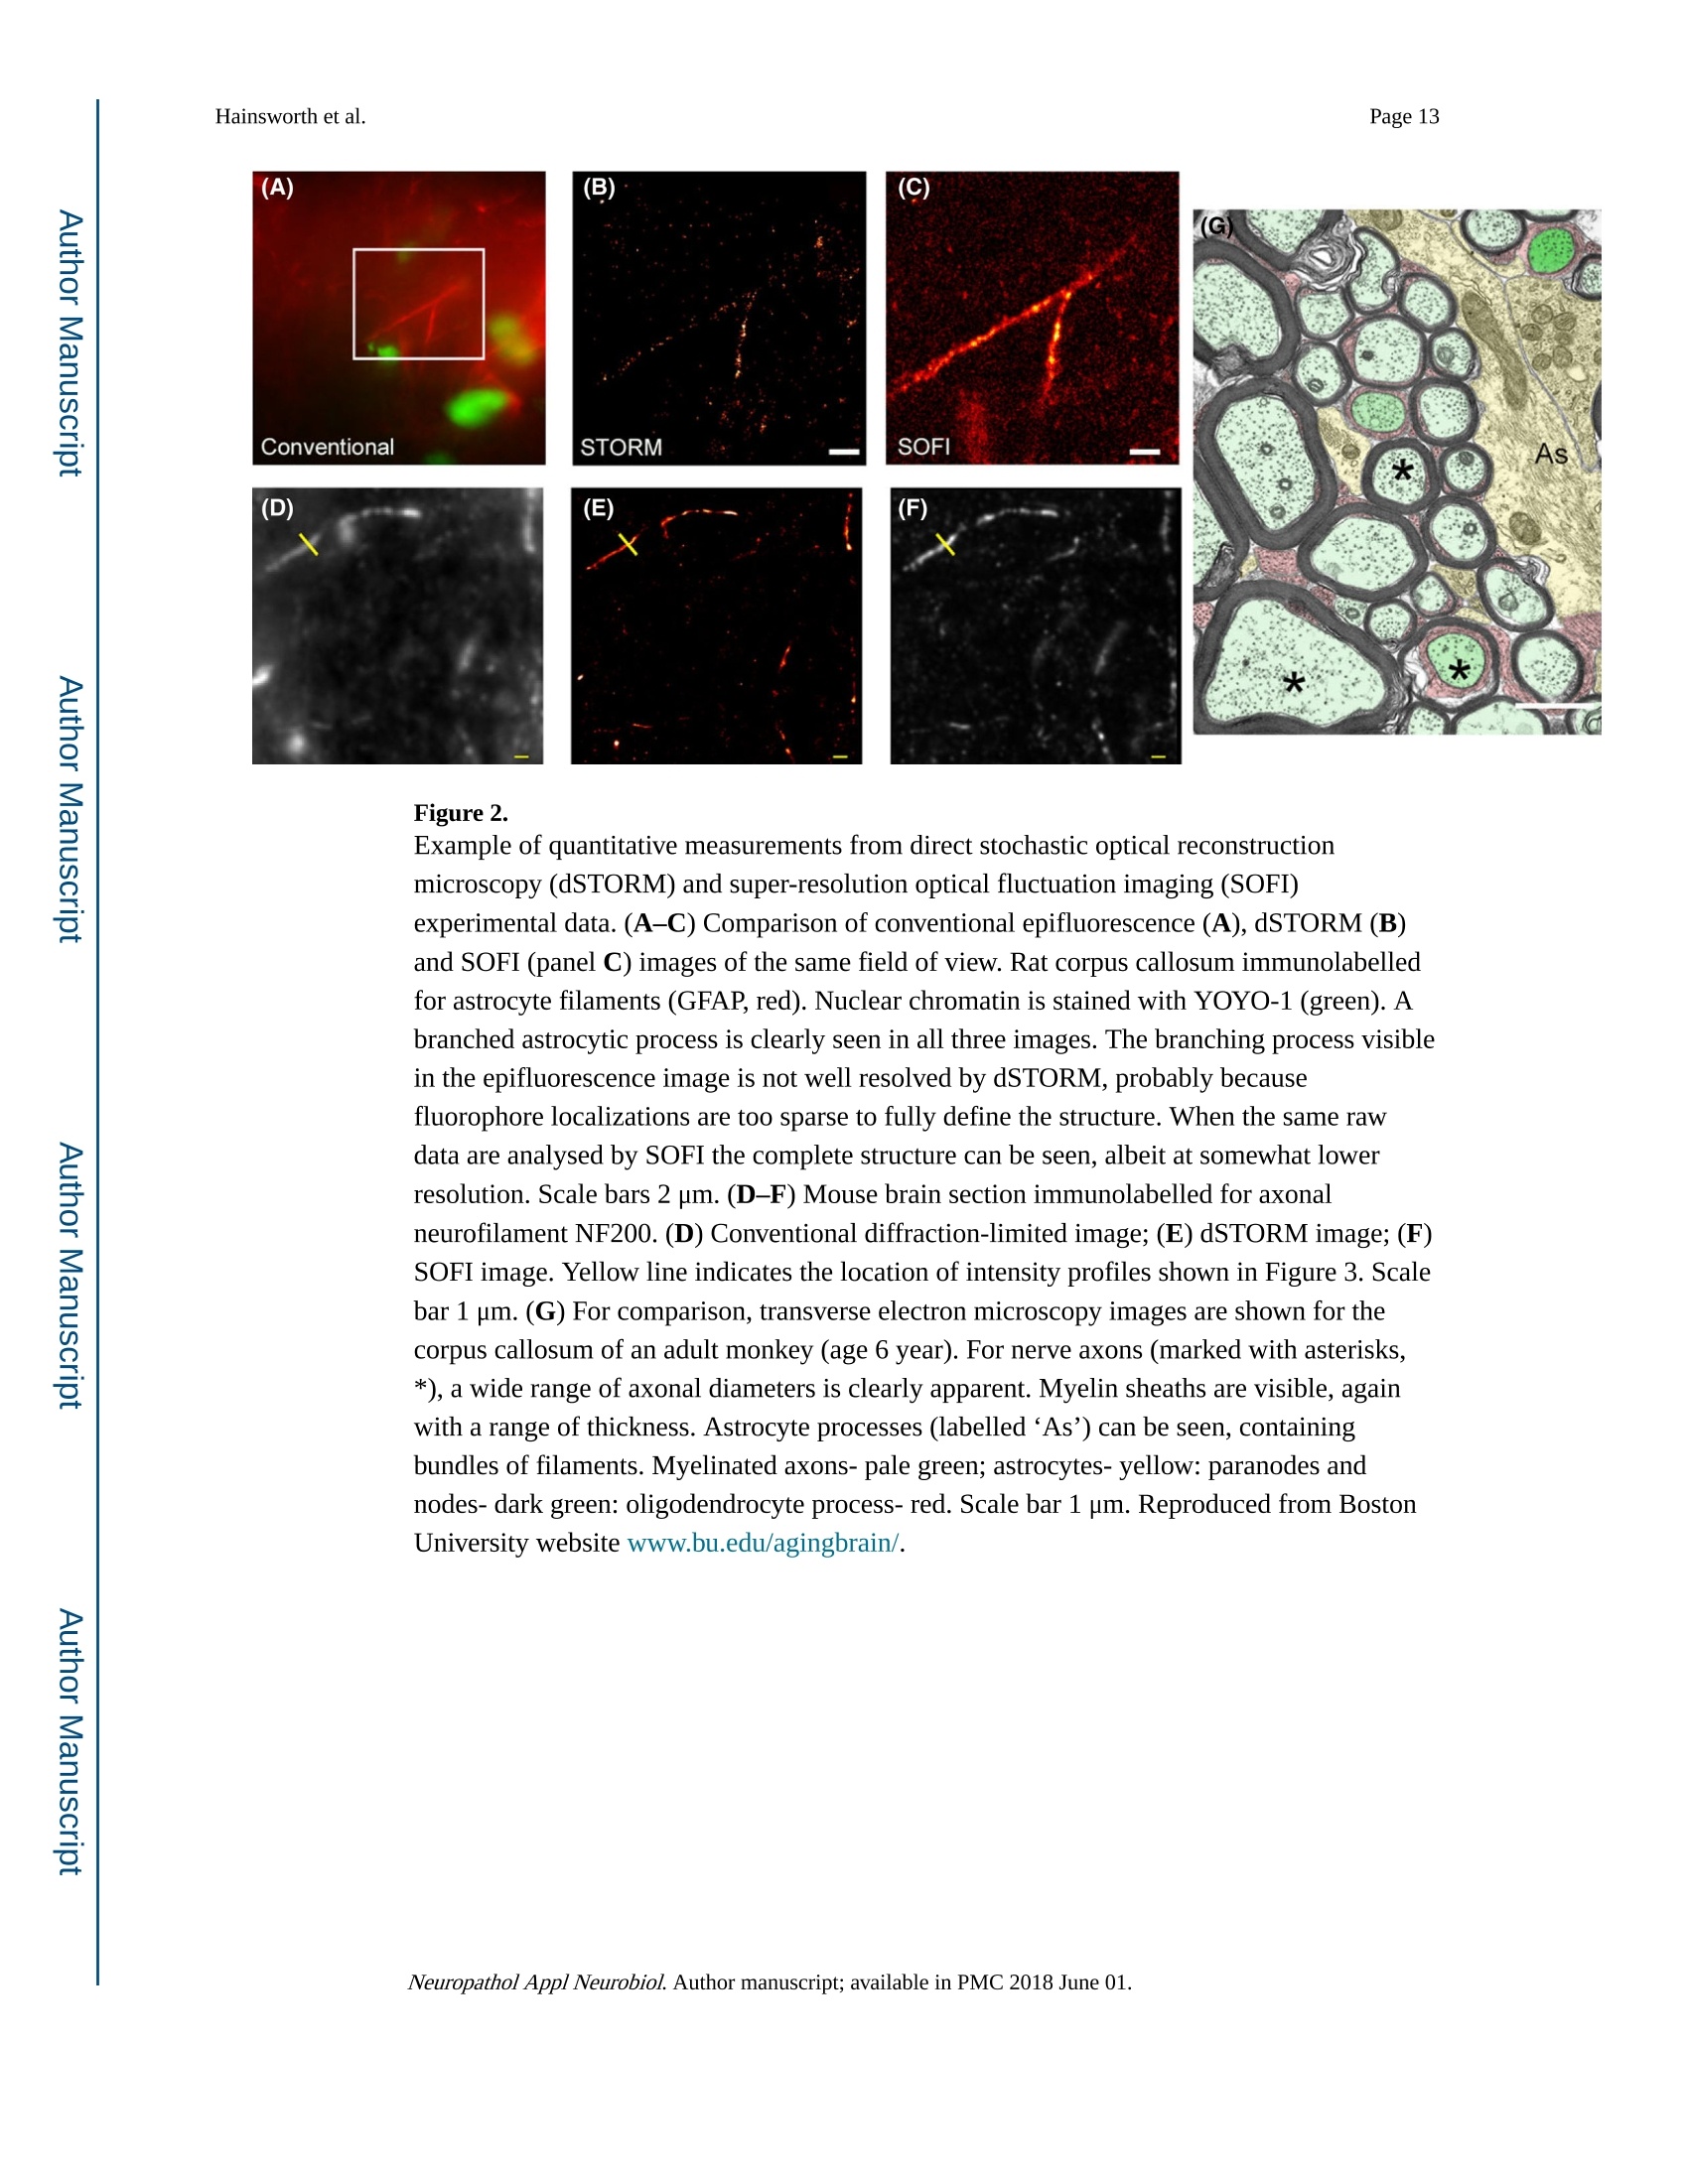
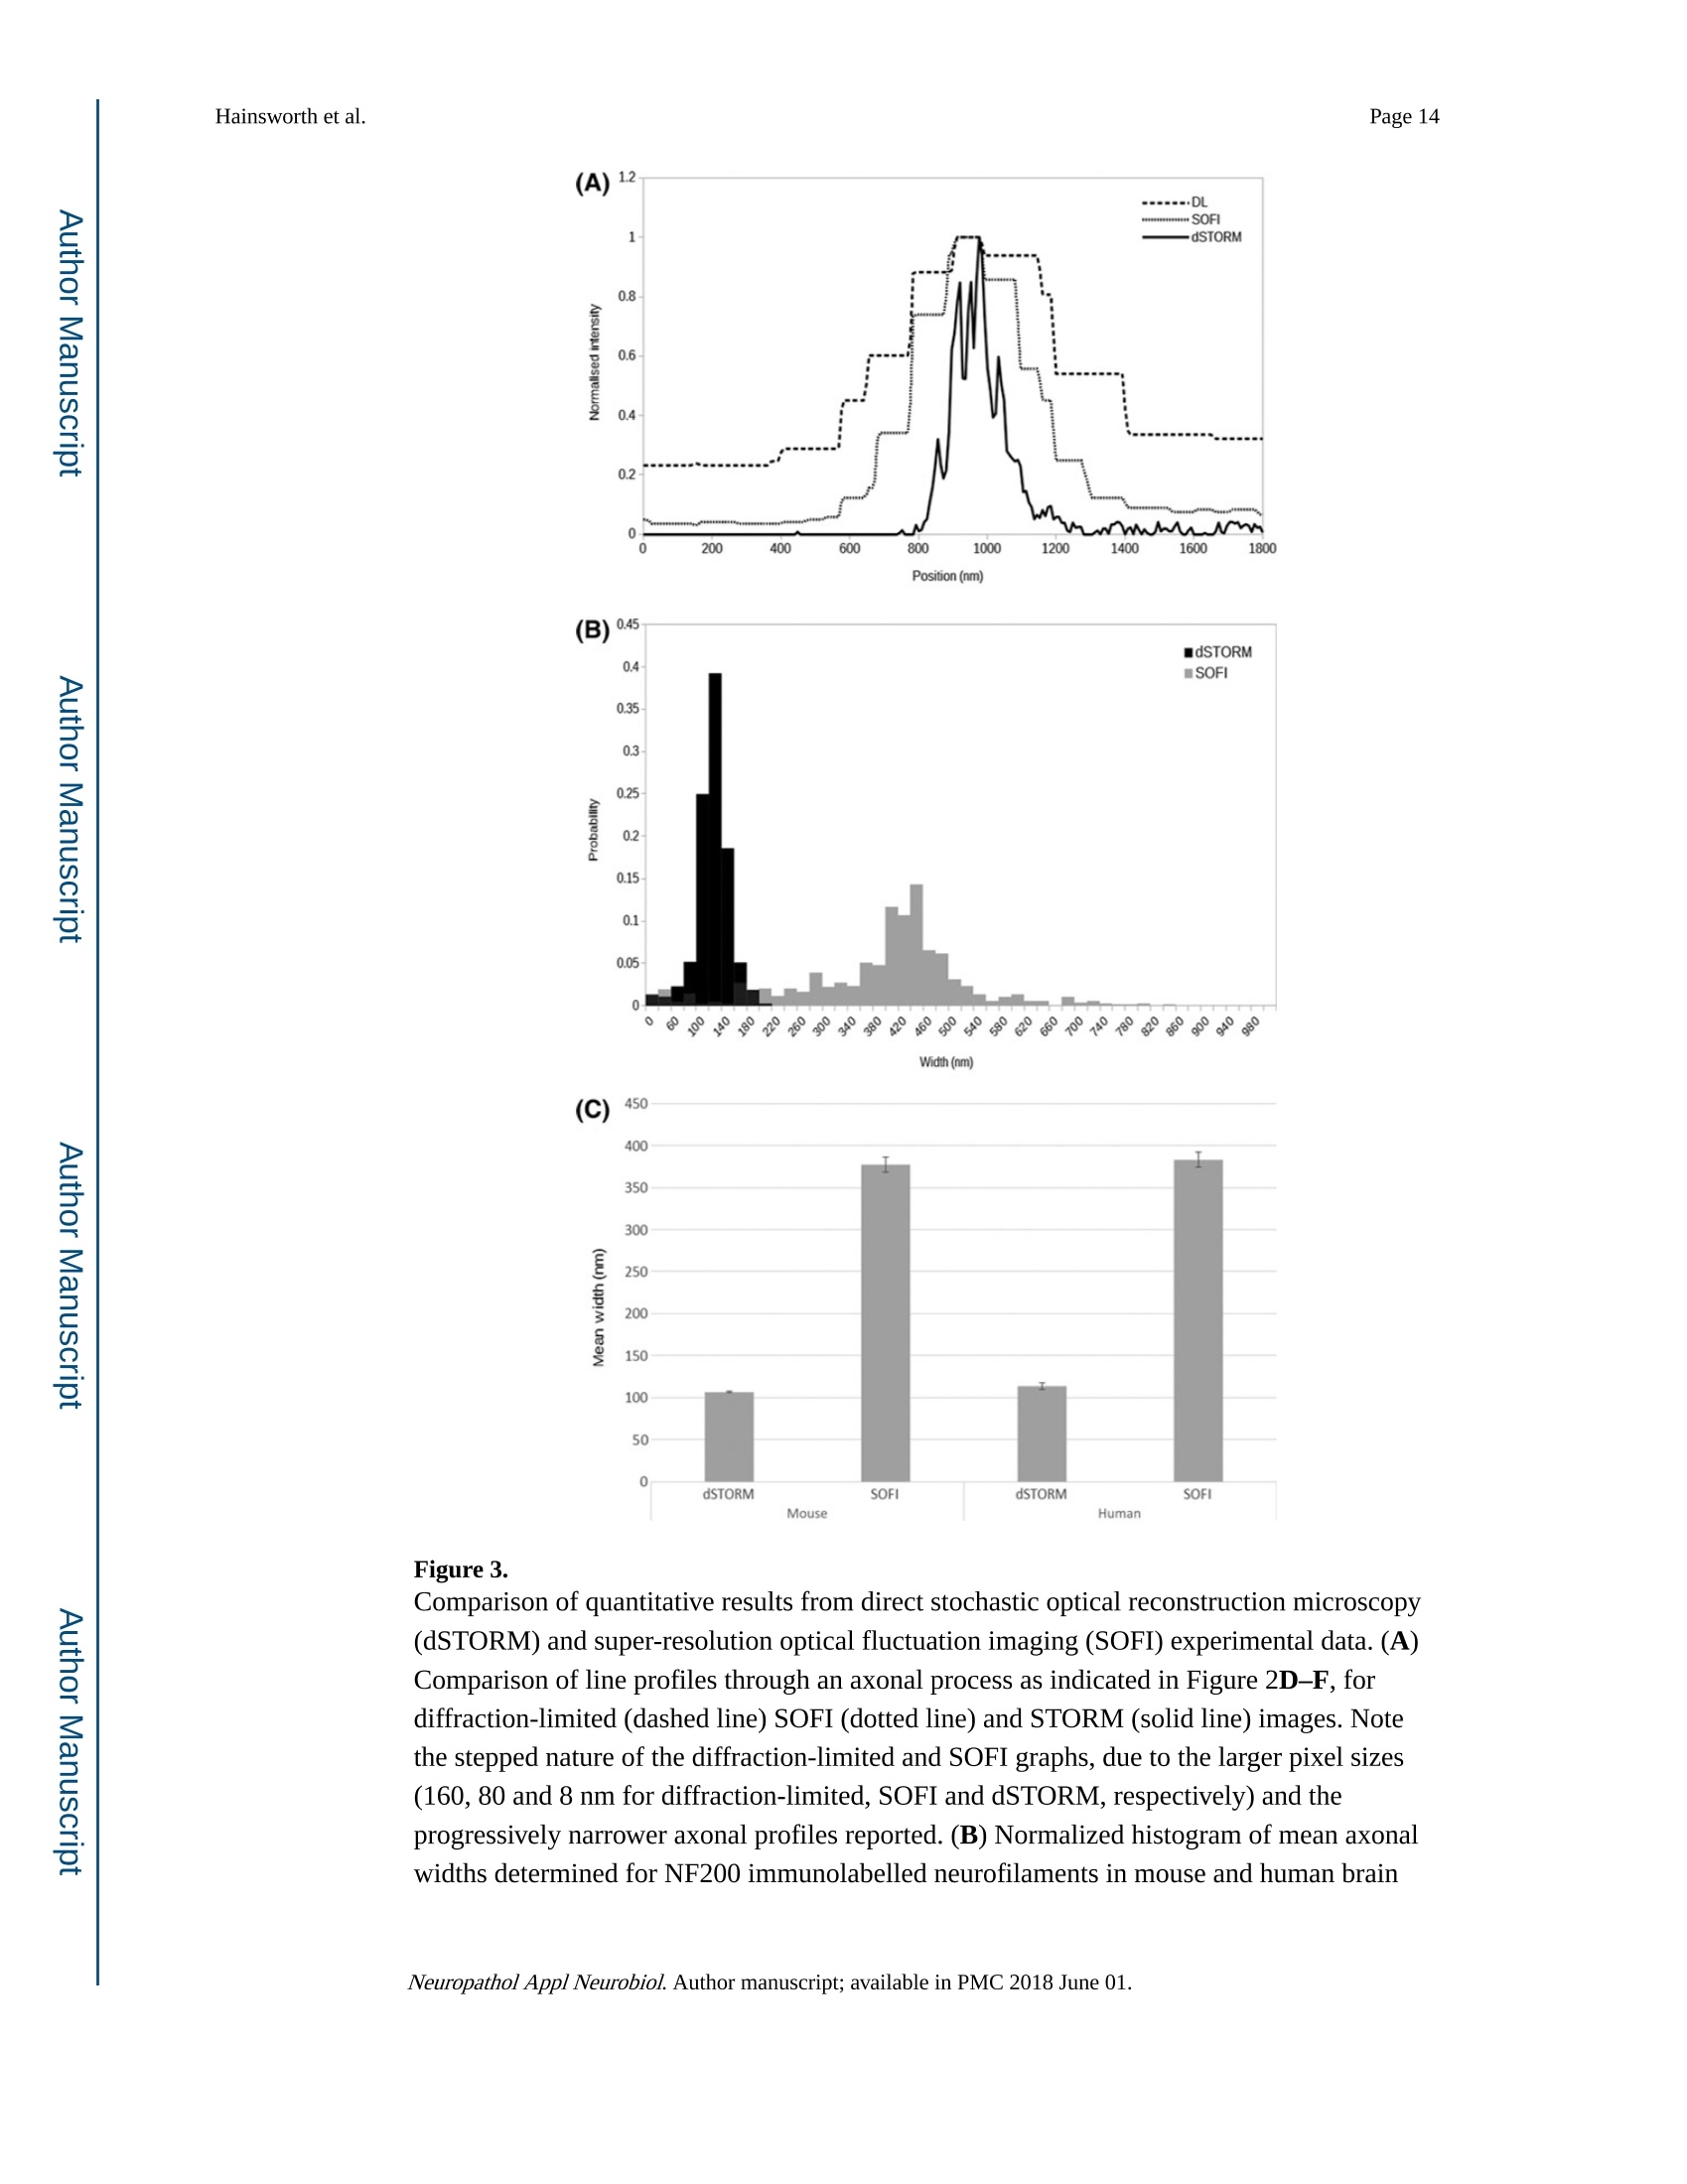
Author manuscriptNeuropathol Appl Neurobiol. Author manuscript; available in PMC 2018 June 01.Published in final edited form as: Page 2Hainsworth et al. HHS Public Access Neuropathol Appl Neurobiol. 2018 June ; 44(4):417-426. doi:10.1111/nan.12426. Super-resolution imaging of subcortical white matter using stochastic optical reconstruction microscopy (STORM) and super-resolution optical fluctuation imaging (SOFI) A. H. Hainsworth*t , S. Leet, A. Patelf,W. W. Poons, and A. E. Knightll.a "Molecular and Clinical Sciences Research Institute, St Georges University of London tNeurology, St George’s University Hospitals NHS Foundation Trust, London, UK +Cellular Pathology, St George's University Hospitals NHS Foundation T rust, London, UK SInstitute for Memory Impairments and Neurological Disorders, University of California, Irvine, CA,USA lNational Physical Laboratory, Teddington, UK Abstract Aims-The spatial resolution of l ight microscopy is l imited by the wavelength of visible light (the ‘di f fraction l imit ', approximately 250 nm). Resolution of sub-cellular structures, smaller than this limit, is possible with super resolution methods such as stochastic optical reconstruction microscopy (STORM) and super-resolution optical fluctuation imaging (SOFI). We aimed to resolve subcel l ular structures (axons, myelin sheaths and astrocytic processes) within i ntact white matter, using STORM and SOFI. c 牛 c Methods—Standard cryostat-cut sections of subcortica l white matter from donated human brain tissue and from adult rat and mouse brain were labelled, using standard immunohistochemical markers (neurofilament-H, myelin-associated glycoprotein, glial fibrillary acidic protein, GFAP).Image sequences were processed for STORM (effective pixel size 8-32 nm) and for SOFI (effective pixel size 80 nm). Results-In human, rat and mouse , subcortical white matter high-quality images for axonal neurofi l aments, myelin sheaths and fi l amentous astrocytic processes were obtained. In quantitative measurements, STORM consistently underestimated width of axons and astrocyte processes Correspondence: Att i cus H. Hainsworth, Cl i nical Neurosciences, St Georges University of London, Mai l poin t J-0B, Cranmer Terrace,London SW17 0RE, UK. Tel : +44 208 725 5586; Fax: +44 208 725 2950; ahainsworth@sgul.ac.uk. "Present address: Holistx Limited, The Durham Genome Centre, Park House, Station Road, Lanchester, Co. Durham, DH7 0EX,UK A. H. Hainsworth D htt p ://orcid.org /0000-0001-7877-8013 Author contributions Atticus H. Hainsworth contributed to study design, experimental work, data analysis, first draft, and the f i nal manuscript. Sarah Lee,Peter Foot and Anita Pate l also contributed to experimental work and writ i ng of t he f inal manuscript. Wayne W. Poon performed data analysis and writing of t he final manuscript. Alex E . Knight performed study design, experimenta l work, data analysis and writing of the fina l manuscript. Conflict of interest Al l the authors have no conflict of interest. (compared with electron microscopy measurements). SOFI provided more accurate width measurements, though with somewhat lower spatial resolution than STORM. Conclusions—Super resolution i maging of i ntact cryo-cut human brain tissue i s feasible. For quantitation, STORM can under-estimate diameters of thin fluorescent objects. SOFI is more robust. The greatest l imitation for super-resolution imaging i n brain sections i s i mposed by sample preparation. We anticipate that improved strategies to reduce autofluorescence and to enhance f l uorophore performance wi l l enable rapid expansion of this approach . Keywords astrocytes; myelin; neurofilaments; super resolution microscopy; white matter Introduction The wavelength of visible l ight imposes a lower size l imit on the objects that can be seen with light microscopy. This ‘diffraction l imit'(approximately 250 nm) i s close to the diameter of a typical nerve axon. Several modalities of ‘super resolution 'light microscopy have recently been developed which bypass this diffraction l imit [1]. One such approach is stochastic optical reconstruction microscopy (STORM) [2,3]. Direct STORM (dSTORM)ut i lizes f luorophores t hat can be switched into a dark (non-f luorescent ) radical state (see Figure S1). Examples are Alexa568,Alexa647 and Cy5 [2-4]. When the majority of the dye molecules are switched i nto the dark state, individua l f l uorescent molecules may be observed, and their positions estimated to a precision of 15 nm or less. Repeating this process many times provides a set of molecular co-ordinates, so as to reconstruct a super-resolution i mage. A dSTORM i mage typically results from processing approximately 10 000individual images, takes a few minutes to acquire, and affords spatial resolution of 20-50nm (Figure S1) [5]. Achieving such high resolution, artefact-free images requires that the switching process is efficient, so that well-separated fluorophore molecules can be discriminated and precisely localized. c c t Super-resolution optical fluctuation imaging (SOFI) is an alternative approach which does not require single molecules to be i maged, but exploits the fluctuations in individual fluorophores to retrieve super-resolution information [6]. These f luctuations can be due to a number of behaviours commonly observed in i ndividual fluorophores, s uch as t riplet states,or t he dark states uti l ized in dSTORM. This is done by calculating statistica l correlations between adjacent pixels in a sequence of images. These correlations are then used to generate a new i mage. For example, a f irst-order SOFI algorithm (such as that used in this paper) will result in pixels hal f the size of those i n the i nput i mage sequence (e.g. 80 nm rather than 160 nm). While the spatial resolution obtained is typically lower than dSTORM,SOFI is amenable to samples where molecular switching is less ef f icient or where f l uorophore density is higher. Importantly, a SOFI analysis can be performed on the same raw data acquired in a dSTORM experiment and the results compared. I n some material,SOFI can generate a useful i mage where dSTORM cannot. These super-resolution fluorescence approaches have several advantages over transmission electron microscopy (TEM; see a recent review [6]). First, they permit molecular labelling, Neuropathol Appl Neurobiol. Author manuscript ; available in PMC 2018 June 01. using antibodies or other reagents, as typically used in confocal or epifluorescence microscopy (immuno-TEM is possible but never routine). Second , there is potential to perform multi-channel labelling, so that multiple molecular targets can be visualized simultaneously. The sample preparation work-flow is similar to that for conventional fluorescence microscopy (see Data S1 for protocol) and thus accessible to a greater number of l aboratories. Third, t hicker t issue sections can be imaged, which i n some samples greatly facilitates the interpretation of larger structures - such as neuronal processes - which would pass through multiple TEM sections. Fourth, the costs of super-resolution instrumentation are fal l ing rapidly, which means that they are likely to become accessible to many more researchers. Nevertheless, TEM has an order of magnitude greater spatial resolution relative to dSTORM [7]. Super resolution methods are unlikely to replace TEM and should rather be seen as complementary approaches. STORM has been previously applied to cell cultures in vitro [2,3,6,8-10]. STORM has also been performed in sections of rodent brain and retinal tissue [11] and has the potential to resolve sub-cellular structures within brain white matter. Here, our aim was to apply super resolution methods to standard histological sections of brain tissue. We report immunofluorescent labelling of human and rodent subcortical white matter, using established markers for axonal neurofi l aments, myelin sheaths and astrocyte f i l amentous processes. We compare imaging with dSTORM and SOFI modalities and discuss caveats. Methods Human tissue D c 宁 a c t Post mortem human frontal cortical tissue was obtained from two established brain banks.One is the MRC London Neurodegenerative Diseases Brain Bank, Institute of Psychiatry,Kings College, London. The second is the University of California, Irvine Alzheimer’s Disease Research Center, Institute for Memory Impairments and Neurological Disorders,University of California, Irv i ne, USA. All tissue samples were donated following written informed consent by donors or their next of kin. Use of human tissue within Dr Hainsworth’s l aboratory has approval from the Local Research Ethics Committee and from the UK National Research Ethics Service (East Midlands - Derby NHS Research Ethics Committee, Study number 12EM _0028). Rat and mouse tissue Adult Wistar rats and C57/BL6 mice were killed by the schedule 1 method (cervical dislocation) and brains rapidly removed into iso-pentane immersed i n liquid nitrogen.Animal use complied with the Animals (Scientific Procedures) Act 1986 and with EU Directive 63-2010. Primary antibodies GFAP mouse monoclonal (clone GA5; Chemicon/Merck-Mil l ipore, Watford, Herts., UK)was raised against purified GFAP from porcine spinal cord. Neurofilament NF200 rabbit polyclonal (Sigma-Aldrich, Poole, UK) was raised against bovine neurofilament-H (MW 200-220 KDa). Myelin proteol i pid protein mouse monoclonal antibody (clone PLPC1; Neuropathol Appl Neurobiol. Author manuscript ; available in PMC 2018 June 01. BioRad-AbD Serotec, Oxford, UK) was raised against PLP C-terminal hexapeptide GRGTKF. Myelin-associated glycoprotein (MAG) mouse monoclonal antibody (ab89780;Abcam, Cambridge, UK) was raised against amino acids 119-208 of Human MAG.Alexa647 and Alexa568 conjugated secondary ant i bodies were from Life Technologies-Molecular Probes, Paisley, UK. YOYO-1 (Molecular Probes, Paisley, UK) was stored as 1mM in DMSO at-20°C and aliquots were diluted shortly before use. Immunohistochemistry Human tissue blocks and rodent brains were stored at -80°C. Tissue samples were mounted in standard cryo-mountant (OCT) at -20℃ within t he cryostat hood. Frozen sections (8-12um t hick) were cut by standard cryostat methods and retrieved onto 25 mm diameter #1.5circular cover slips (Electron Microscopy Sciences, Hatfield, PA, USA) then air-dried for 20min and fixed with ice-cold 100% ethanol. Heat-induced ant i gen retrieval was performed,using a Menarini-Biocare decloaker, (120℃, 30 s, in c i trate buffer pH 6). Sections were treated with a strong reducing agent, sodium borohydride (5% w/v in PBS; Sigma-Aldrich)for 30 min at room temperature, to reduce tissue autofluorescence. After at least three washes with PBS to remove NaBH4, non-specific protein binding was blocked by incubation with 3% w/v BSA (Jackson Immunochemicals, West Grove, PA, USA) in PBS-T for 1 h at room temperature. Sections were i ncubated with primary antibodies diluted in 3% w/v BSA in PBS-T overnight in a humidified chamber at 4°C. GFAP antibody was diluted 1:3000,NF200 ant i body 1:2000, MAG 1:200. Sections were incubated with appropriate secondary ant i bodies conjugated to Alexa647, diluted 1:1000 in 3% BSA in PBS-T at room temperature for 1 h. Nuclear chromatin l abelling wi t h YOYO-1 (20 min, 3 nM i n PBS-T)sections were immersed in i ce-cold PBS-T, stored overnight at 4C, and imaged within 24 h.For further details, see Data S 1 for protocol. D c宁 Sample preparation a c t For super-resolution i maging, cover sl i ps were placed in Attofluor Cell Chambers (Thermo Fisher Scientific, Waltham, MA,USA), and dSTORM buffer was added to overfill the bottom chamber. A further cover slip was then applied so as to avoid trapping air bubbles in the sample chamber. The cover sl i p holder was then placed on the microscope stage for observation. The buffer is made up of three stock solutions: 50 ul of enzyme stock solution (A), 400 u l of glucose stock solution (B), 50-100 pl of MEA stock solution (C) made up to 1000 ul with PBS. Enzyme stock solution A is 2 ug/ml catalase, 0.1% w/v glucose oxidase,4 mM TCEP, 50% v/v glycerol, 25 mM KCl, 20 mM Tris-HCl (pH 7.5). Glucose stock solution (B) is 0.5 M glucose, 10% v/v glycerol in aqueous solution. MEA-stock solution (C) is 1 M MEA -HCl in aqueous solution. A, B and C are stored as aliquots at -20℃. c Super resolution data acquisition c t Direct STORM (dSTORM) measurements were performed, using a custom-built total internal reflection fluorescence (TIRF) objective system based on an Olympus IX71 inverted microscope body with a UAPON 100× OTIRF objective [12]. Image sequences at 128×128pixels were acquired, using an Andor iXon Ultra 897 EMCCD camera (Andor Technology Ltd., Belfast, UK), and were saved in a raw binary format. Exposure t ime was 10 ms and the frame i nterval was 19 ms. In thi s microscope configuration, the effective pixel size is 160 Neuropathol Appl Neurobiol. Author manuscript ; available in PMC 2018 June 01. nm (in raw unprocessed data). Typically 10 000 frames were acquired in each sequence.Fluorescence was excited, using objective TIRF or highly inclined illumination, with the angle of incidence adjusted empirically to obtain the best contrast fluorescence. Laser excitation was at 488, 561 or 640 nm as appropriate for the fluorophore. The system was equipped with a quad-band dichroic and emission filter; additional bandpass emission f ilters were used to reduce cross-talk between f luorescence channels. For multi-colour images, the channels were acquired sequentially. I maging at lower laser power (1-10% of maximum)was used to select promising fields of view, whereas dye ‘blinking’was i nitiated by increasing to maximum power. In addition, a 405 nm laser was used to re-activate’fluorophores which had entered the dark state when the number of molecules visible in each frame fell due to photo-bleaching. Super-resolution Image reconstruction For dSTORM, reconstructions were performed in rain-STORM software [5], using the ‘jit t ered histogram’visualization method. This approach adaptively selects t he best pixel size for reconstructions based on the localization precision determined by the analysis. The software also returns i nformation about the qual i ty of t he reconstruction i ncluding the mean localization precision and the number of molecules localized to generate the i mage. For SOFI , first order SOFI analyses were performed, using a Localizer i mplementation [13] and custom MATLAB scripts, and deconvolved by the Lucy -Richardson method, using a Gaussian point spread function (PSF). The pixel size for first-order SOFI images is 80 nm. Simulated data for dSTORM and SOFI was generated, using a modified form of the testSTORM programme [14]. Parameters were set to emulate the experimental data, except that the time constants ton and toff for the blinking process were varied, to i llustrate the effect of overlapping localizations. D c 宁 a c t Ridge detection (ImageJ). To measure the thickness of processes, i mages were further analysed in FIJI/ImageJ [14,15]. Processes were identified and their widths measured using the ImageJ ‘Ridge Detection’plugin [15] (ht t ps://doi .org /10.5281/zen o d o .35440). This algorithm is a generic machine vision tool for identifying and measuring l inear and curved structure in images, and this i s ideal for this application. The results were saved as text files for further analysis. Statistical analysis Custom MATLAB scripts were used to i mport the process width data and to convert the width measurements from pixels to nanometres. The resulting data were then analysed statistically to derive mean widths and 95% confidence l imi t s for each combination of species , process type and method. c Results c t STORM i maging was achieved in frozen sections of subcortical white matter from adult mouse, adult rat and older adult human brain tissue (tissue samples used are listed in Table 1). Immunofluorescent labelling of axonal cytoskeleton (labelled with neurofilament-H),myelin sheaths (labelled with MAG) and astrocytic processes (labelled with GFAP) were Neuropathol Appl Neurobiol. Author manuscript ; available in PMC 2018 June 01. clearly seen in super resolution i mages. Examples are shown in Figure 1A-G). The nuclear chromatin marker YOYO-1 was helpful for tissue orientation (Figure 1A,E). For comparison a multiple-labelled conventional immunofluorescence image is shown, derived from the same human tissue material (Human sample #5, Figure 1H). Tissue autofluorescence, due to l i pofuschin and other tissue components, was an issue wi t h human samples. Technical issues with STORM i maging of cryo-cut intact brain tissue are outlined in Supporting Information. We performed quantification of specific cel l ular features (Figures 2,3). In particular we attempted to measure the apparent diameters of astrocyte fi l amentous processes (GFAP immunolabelled, example in Figure 2A-C) and apparent axonal diameter (derived from neurofilament immunolabelling, Figure 2D-F). Diameter measurements derived from dSTORM processing were internally consistent (Table 2), as were those derived from SOFI.Surprisingly, diameter measurements of any given structure differed substantially between the two modalities (Figure 3A-C; Table 2). White matter tissue from primate brain, imaged by TEM, is shown i n Figure 2G for compar i son. To estimate diameter, cross-sectional width was estimated at multiple locations along the length of a long f ilamentous structure (axon or astrocyte f i l ament ). For a given structure, the estimates of diameter were narrowly distributed (Figure 3A-B). The mean diameter estimates derived from human tissue were similar to those derived from mouse tissue (Figure 3C). Mean diameters der i ved from SOFI were substantially greater than equivalent dSTORM-derived values (Figure 3B,C; Table 2). Further details are given i n Figure S2 and Table S1. D c 宁 a c t We carried out analyses of simulated data, using thin l ines of different widths, to assess the accuracy of the two modalities (see Figure S3). In conditions where overlap of adjacent fluorophores is likely, dSTORM consistently under-estimated the width of thin objects (Figure S3). The l ikely rationale for t his consistent error is overlap of the probabil i ty density functions for adjacent fluorophore molecules, result i ng i n cancel l ation of their signa l s (see Figures S4,S5). Discussion dSTORM and SOFI images of axonal neurofilament bundles, myelin sheaths and astrocytic filamentous processes were obtained from mouse, rat and human subcortical white matter.The greatest technical challenge was autofluorescence in human white matter t issue. This was mitigated by ethanol f ixation (avoiding aldehydes), intensive quenching of autofluorescence with sodium borohydride, and use of a far-red fluorophore, Alexa 647 (see Data S2 for technical issues). c c t Other l aboratories have reported super resolution i mages of neuronal cells in culture or i n rodent brain tissue. Rat hippocampal neurone cultures were transfected with STORM-compatible f luorophores (YFP, TagBFP and mCherry) [8]. This strategy yielded high fluorescent signal throughout neuronal processes, requi r ing l itt l e histological processing.Axonal structural components (adducin, β-II and B-IV spectrin) have also been immunolabelled in neuronal cultures [16] and i n tissue sections of mouse hippocampus, Neuropathol Appl Neurobiol. Author manuscript ; available in PMC 2018 June 01. labelled with the actin marker phalloidin or i mmunolabel l ed with β-IV spectrin [16].STORM i maging of presynaptic and postsynaptic membranes, immunolabelled with the markers Bassoon and Homer1, respectively, was performed i n cryo-cut (10 um) sections of mouse olfactory bulb and ventral orbital cortex [17]. STORM imaging of Bassoon and the glutamate receptors GluR1 and GluR2 was also achieved in 4% paraformaldehyde-fixed mouse brain tissue [18]. A combination of immunohistochemistry for the synaptic scaffolding protein gephyrin, with transgenic expression of the fluorophores GFP and YFP,was performed i n mouse retinal sections [11]. This permit t ed detailed structural i maging of pre-and postsynaptic domains i n glycinergic and GABAergic synapses within the retina. The tissue preparation protocol i ncluded refinements such as post-fixing with glutaraldehyde and epoxy resin embedding followed by ultra-thin sectioning (70 nm) [11]. Similar protocols have been used for mitochondria l labelling in 10-20 pm sections of mouse brain, heart and kidney [19]. c o c t D c 宁 a c t Our measurements o f axonal diameter and astroglial process diameter (Table 2) are comparable with stereology values i n the EM l iterature [20-25]. There i s a wide range of axonal diameters within any given brain region (Figure 2) though the distribution is quite similar across species (rodent, cat, primate, human) [21,23,24,26]. Unmyel i nated axon diameters were in the range 100-500 nm in rodent, cat , primate and human white matter,though the majority were 100-200 nm [21]. An average width of 250 nm is reported for unmyelinated axons in the mouse corpus callosum [25]. Myel i nated axona l diameters were generally larger , most i n the range 300-1100 nm [21], though even greater axonal diameters are observed (up to 3 pm), especially at the axonal initial segment [20-22]. For myelinated axons within brain tissue, average widths of 460 nm are reported in murine corpus callosum [25], 620 nm in human corpus callosum [22] and 670 nm in the cingulate bundle of young monkeys [26,27]. The myel i n sheath thickness is naturally variable, depending on the number of lamellae (Figure 2). Trans-myelin diameter i s typically 800-1100 nm i n central myelinated fibres [20,22-24,26]. In non-elderly human corpus callosum an average myel i n thickness of 180 nm was measured [22]. While axonal diameter did not differ significantly between young adult and old monkeys, myelin sheaths were t hicker and more variable in older monkeys [26]. EM measurements of astrogl i a l processes also show a range of thickness (200-500 nm) i n rodents and primates, Table 2 [20,27]. Fibrous astrocytes (the type most l ikely to be seen in our material) have thicker processes than protoplasmic astrocytes and processes that are more distant from the cel l body are generally thinner [28].The filamentous bundles within astrocytic processes are typically 150-250 nm in diameter [20,271. c c t There clearly is a difference between detecting a structure and accurately measuring its size.In conventional microscopy, the apparent width of a structure is given by a convolution of the true width with the PSF of the imaging system [29]. For structures much wider than the PSF accurate widths can be measured, whereas for structures narrower than the PSF, the apparent size will be spuriously enlarged. While a similar relationship applies in super-resolution microscopy, the relationship i s more complex and is also sample-dependent [5]. In addition, super-resolution can result in apparent narrowing of structures [14]. This arises because the analysis software assumes that each ‘spot’i n an image corresponds to a single fluorophore. However, because the ‘blinking’of t he molecules is stochastic, occasionally Neuropathol Appl Neurobiol. Author manuscript ; available in PMC 2018 June 01. adjacent fluorophore molecules wil l blink at the same time (Figures S4,S5), resulting i n an erroneous localization (Figures S3,S5). This effect is more common where fluorophores are present at a high density, or where the switching process is i nefficient. Using simulated data,we demonstrated this effect i n dSTORM and compared the results with a SOFI analysis of the same data (Figure S3). It is readily apparent that SOFI is not affected by this artefactual narrowing (Figure S3). However, the lower resolution of SOFI (relative to dSTORM) means that thin structures may appear wider than is in fact the case. For example, in our data, the pixel size is 80 nm, therefore t he minimum apparent size of any structure will be at least 80nm. Therefore, the technique giving the most robust estimates of the size of features will vary depending on a) t he frequency of overlapping i mages of fluorophore molecules b) the true size of the structure to be measured. Our results show t hat it is important to critically appraise t he qual i ty of the raw data obtained from super-resolution microscopy, particularly where challenging samples are being imaged.While super-resolution microscopies have provided new insights into neuronal structure, this has been achieved almost entirely with cultured cells. Obtaining high-quality data from sectioned brain tissue, in particular human post mortem brains f rom elderly patients, is much more challenging due to the higher levels of background fluorescence [30-32]. The wide-field super-resolution techniques, such as SIM and STORM [6], are in general very vulnerable to background fluorescence, as they require a contrast between the patterned fluorescence (i n SIM) or t he single f l uorophore molecules (in dSTORM) and the background in the raw data. Methods using a pinhole or 2-photon excitation may have an advantage in this scenario, but are also vulnerable to aberrations which may perturb i maging at a depth more than a few microns into a tissue section, due to variations in the refractive index and light scattering. D c 宁 a c t We conclude t hat while super-resolution imaging has great potential for imaging in brain sections, the experimenter needs to understand the l i mi t ations of each approach. We deduce that the dSTORM modality can underestimate diameters of thin fluorescent objects within the i nteract tissue samples. SOFI serves as a useful adjunct when high background or poor photo-switching makes dSTORM analysis problematic, since SOFI is more robust to the presence of overlapping single-molecule images. The biggest l i mitation for super-resolution imaging in brain sections is currently imposed by sample preparation. We anticipate that improved methods to reduce autofluorescence and to enhance the photo-swi t ching performance of fluorophores wil l enable a rapid expansion of this approach. Supplementary Material Refer to Web version on PubMed Central for supplementary material.c c t Acknowledgments This study received financial suppor t from Alzheimer’s Research UK (ARUK PPG2014A-8) to AHH and AEK.AHH gratefully acknowledges financial support from Alzheimer’s Society (UK) (PG146/151), Alzheimer's Drug Discovery Foundation (Project Re f 20140901) and St George’s Hospital Charity. Funding for the Univers i ty of Cal i fornia, Irvine-ADRC i s provided by NIH/NIA Grant P50 AG016573. The MRC London Neurodegenerative Diseases Brain Bank i s supported by the UK Medical Research Council (Centre grant Number: NMRC /CG/NUHS/2010) and Brains for Dementia Research (BDR). Ultrastruc t ural EM data in Figure 2 are reproduced f rom the Neuropathol Appl Neurobiol. Author manuscript ; available in PMC 2018 June 01. References 1. Hell SW, Sahl SJ, Bates M, Zhuang X, Heintzmann R, Booth MJ, Cordes T. The 2015 super resolution microscopy roadmap. J Phys D: Appl Phys. 2015; 48:443001. 2. Rust MJ, Bates M, Zhuang X. Sub-dif f raction-l imi t i maging by stochast i c optica l reconstruction microscopy (STORM). Nat Methods. 2006;3:793-5. [PubMed: 16896339] 3. Bates M, Huang B, Dempsey GT, Zhuang X. Mult i color super-resolution imaging with photo-switchable fluorescent probes. Science. 2007;317:1749-53. [PubMed: 17702910] 4. Metcalf DJ , Edwards R, Kumarswami N, Knight AE. Test samples for optimizing STORM super- resolution microscopy . J Vis Exp. 2013 Sep 6.79doi: 10.3791/50579 5. Rees E, Erdelyi M, Pinotsi D, Knight AE , Metcalf D, Kaminski CF. Blind assessment of localisation microscope image resolution . Opt Nanoscopy. 2012;1:12. 6. Sydor AM, Czymmek KJ, Puchner EM, Mennella V. Super-resolution microscopy: f rom single molecules to supramolecular assemblies. Trends Cel l Biol. 2015;25:730-48. [PubMed:26546293] 7. Henstridge CM, Jackson RJ, Kim JM, Herrmann AG, Wright AK, Harris SE, Bastin ME, Starr JM, Wardlaw J , Gillingwater TH, Smith C,McKenzie CA, Cox SR, Deary IJ, Spires-Jones TL. Post- mortem brain analyses of the Lothian Birth Cohort 1936: extending lifet i me cognitive and brain phenotyping to the level of the synapse. Acta Neuropathol Commun . 2015;3:53.[PubMed: 263351011 8. Lakadamyali M, Babcock H, Bates M, Zhuang X, Lichtman J. 3D multicolor super-resolution imaging of f ers i mproved accuracy i n neuron tracing. PLoS ONE . 2012;7:e30826. [PubMed: 222920511 9. Cella ZF, Lavagnino Z, Perrone DM, Del BA, Furia L, Faretta M, Diaspro A. Live-cell 3D super-resolution imaging in thick biological samples. Nat Methods. 2011;8:1047-9.[PubMed: 21983925] 10. Vaziri A, Tang J , Shroff H, Shank CV. Multilayer three-dimensional super resolution i maging of thick biological samples. Proc Natl Acad Sc i U S A. 2008; 105:20221-6. [PubMed: 19088193] 11. Sigal YM, Speer CM, Babcock HP, Zhuang X. Mapping synaptic i nput fields of neurons with super-resolution imaging. Ce l l. 2015; 163:493-505. [PubMed: 26435106] 12. Erdelyi M, Rees E, Metcalf D, Schierle GS, Dudas L, Sinko J, Knight AE, Kaminski CF. Correcting chromat i c offset in mult i color super-resolut i on localization microscopy. Opt Express. 2013;21:10978-88.[PubMed: 236699541 13. Dedecker P, Duwe S, Neely RK, Zhang J . Localizer: fast, accurate, open-source, and modular software package for superresolution microscopy. J Biomed Opt. 2012;17:126008.[PubMed: 232082191 14. Sinko J, Kakonyi R, Rees E, Metcalf D, Knight AE, Kaminsk i CF, Szabo G, Erdelyi M. TestSTORM: simulator for optimizing sample labeling and i mage acquisition in local i zation based super-resolution microscopy. Biomed Opt Express. 2014;5:778-87.[PubMed: 24688813] 15. Steger C. An unbiased detector of curvilinear structures. IEEE Trans Pattern Anal Mach Intel l . 1998;20:113-25. 16. Xu K, Zhong G, Zhuang X. Actin, spectrin, and associated proteins form a periodic cytoskeletal structure in axons. Science. 2013;339:452-6. [PubMed: 23239625] 17. Dani A, Huang B, Bergan J, Dulac C , Zhuang X. Superresolution imaging of chemical synapses in the brain. Neuron. 2010; 68:843-56.[PubMed: 21144999] 18. Beaudoin GM II I , Schofield CM, Nuwal T, Zang K, Ul l ian EM, Huang B, Reichardt LF. Afadin, a Ras/Rap effector that controls cadherin func t ion, promotes spine and excitatory synapse density in the hippocampus. J Neurosci. 2012;32:99-110.[PubMed: 22219273] 19. Barna L, Dudok B, Miczan V, Horvath A, Laszlo ZI, Katona I . Correlated confoca l and super- resolution i maging by VividSTORM. Nat Protoc.2016;11:163-83.[PubMed:26716705] 20. Peters, A ., Palay, SL., Webster, HF. The Fine Structure of the Nervous System. W.B. Saunders Company; Philadelphia,PA, USA: 1976. 21. Wang SS, Shultz JR, Burish MJ, Harrison KH, Hof PR, Towns LC, Wagers MW, Wyat t KD.Functional tradeoffs in white matter axonal scaling. J Neurosci. 2008; 28:4047-56.[PubMed:184009041 22. Wohlschlaeger J, Wenger E, Mehraein P, Weis S. White matter changes in HIV-1 infected brains: a combined gross anatomical and ultrastructural morphometric investigation of the corpus callosum.Cl i n Neurol Neurosurg. 2009;111:422-9.[PubMed: 19185416] 23. Tang Y, Nyengaard JR, Pakkenberg B, Gundersen HJ. Age-induced white matter changes in the human brain: a stereological investigation. Neurobiol Aging. 1997;18:609-15. [PubMed:94610581 24. Riise J, Pakkenberg B. Stereological estimation of the total number of myelinated callosal fibers in human subjects. J Anat. 2011;218:277-84. [PubMed: 21250987] 25. Sturrock RR. Myelination of the mouse corpus callosum. Neuropathol Appl Neurobiol. 1980;6:415-20. [PubMed: 7453945] 26. Bowley MP, Cabral H, Rosene DL, Peters A. Age changes in myelinated nerve f ibers of the cingulate bundle and corpus callosum in the rhesus monkey. J Comp Neurol . 2010;518:3046-64.[PubMed: 205333591 27. Peters, A., Sethares, CF . The Fine Structure of the Aging Brain. Boston University; 2016. Available at: www .bu .edu /ag i n g br a in /[last accessed 7 J uly 2016] 28. Oberheim NA, Takano T, Han X, He W, Lin JH, Wang F, Xu Q, Wyatt JD, Pilcher W, Ojemann JG,Ransom BR, Goldman SA, Nedergaard M. Uniquely hominid features of adult human astrocytes. J Neurosci . 2009;29:3276-87.[PubMed: 19279265] 29. Schermelleh L, Heintzmann R, Leonhardt H. A guide to super-resolution fluorescence microscopy.J Cel l Biol. 2010;190:165-75. [PubMed: 20643879] 30. Tsuchida M, Miura T , Aibara K. Lipofuscin and li pofuscin-like substances. Chem Phys Lipids.1987;44:297-325. [PubMed: 3311421] 31. Jones PB, Rozkalne A, Meyer-Luehmann M, Spires-Jones TL, Makarova A, Kumar AT ,Berezovska O, Bacskai BB, Hyman BT. Two postprocessing techniques for the elimination of background autofluorescence for fluorescence l ifet i me i maging microscopy. J Biomed Opt. 2008;13:014008.[PubMed: 183153661 D c 宁 a c t 32. Boellaard JW, Schlote W, Hofer W. Species-specific ul t rastructure of neuronal lipofuscin in hippocampus and neocortex of subhuman mammals and humans. Ultrastruct Pathol . 2004;28:341-51.[PubMed: 15764582] Hainsworth et al . (A) (B)(G) Figure 1. Example direct stochastic optical reconstruction microscopy (dSTORM) images of axonal c c t neurofilaments, myelin and astroglial processes within brain white matter. (A) axons immunolabelled with neurofilament (red) in human subcortical white matter, context image under conventional light microscopy. Nuclei are labelled by the chromatin marker YOYO-1(green). Region of interest for STORM imaging marked with box. (B) STORM image (red)from A, overlaid on conventional i mage (greyscale). An arrow indicates the axon shown in panel C. (C) STORM imaged individual axon, f rom the f ield highlighted in panel B.(D)myelin sheath in cross-sectional profi l e in human sub-cortical white matter, i mmunolabelled with myelin-associated glycoprotein. (E) GFAP-immunolabelled astrocyte f ilamentous processes i n mouse corpus callosum, context images under conventional light microscopy.(F) Super-resolution optical fluctuation i maging (SOFI ) image of astroglial filamentous process, from field of view shown in E. (G) SOFI image of GFAP-immunolabelled astrocyte filamentous process i n rat corpus callosum. (H) conventional epifluorescence image of human subcortical white matter, double labelled for axonal neurofilaments (red) and the myel i n sheath protein PLP (green). Nuclear chromat i n is counterstained with DAPI (blue).Note a myel i nated axonal profile (arrow). Autofluorescent bundles of lipofuscin (‘Lipofusc’) Neuropathol Appl Neurobiol. Author manuscript ; available in PMC 2018 June 01. are relatively sparse in this field of view. Scale bars: 10 um (A,E), 1 um (B), 500 nm (C),2um (D,G), 5 um (F), 20 pm (H). Neuropathol Appl Neurobiol. Author manuscript ; available in PMC 2018 June 01. Hainsworth et al . (A) (B) Conventional STORM (D)(E)(F) Figure 2. Example of quantitative measurements from direct stochastic optical reconstruction microscopy (dSTORM) and super-resolution optical f luctuation i maging (SOFI)experimental data. (A-C) Comparison of conventional epifluorescence (A), dSTORM (B)and SOFI (panel C) images of the same field of view. Rat corpus callosum immunolabelled for astrocyte filaments (GFAP, red). Nuclear chromatin i s stained with YOYO-1 (green). A branched astrocytic process is clearly seen in all three images. The branching process visible in the epif l uorescence i mage is not well resolved by dSTORM, probably because fluorophore localizations are too sparse to fully define the structure. When the same raw data are analysed by SOFI the complete structure can be seen, albeit at somewhat lower resolution. Scale bars 2 um. (D-F) Mouse brain section immunolabelled for axonal neurofilament NF200. (D) Conventional diffraction-limited image;(E) dSTORM i mage; (F)SOFI image. Yellow line i ndicates the location of intensity profiles shown in Figure 3. Scale bar 1 um. (G) For comparison, transverse electron microscopy images are shown for the corpus callosum of an adult monkey (age 6 year). For nerve axons (marked with asterisks,*), a wide range of axonal diameters is clearly apparent . Myelin sheaths are visible, again wi t h a range of thickness. Astrocyte processes (labelled ‘As’) can be seen, containing bundles of filaments. Myelinated axons- pale green; astrocytes- yellow: paranodes and nodes- dark green: ol i godendrocyte process- red. Scale bar 1 um. Reproduced from Boston University website www.bu.edu/a gingbr a in/. Hainsworth et al . (A)12 --mm-m .DL ·SOF I 一-dSTO R M 0.8 Figure 3. c c t Comparison of quantitative results from direct stochastic optical reconstruction microscopy (dSTORM) and super-resolution optical fluctuation imaging (SOFI ) experimental data. (A)Comparison of line profiles through an axona l process as i ndicated in Figure 2D-F, for diffraction-limited (dashed l ine) SOFI (dotted l ine) and STORM (solid l ine) images. Note the stepped nature of the diffraction-limited and SOFI graphs, due to the larger pixel sizes (160,80 and 8 nm for diffraction-limited, SOFI and dSTORM, respectively) and the progressively narrower axonal profi l es reported. (B) Normalized histogram of mean axonal widths determined for NF200 immunolabelled neurofilaments in mouse and human brain Neuropathol Appl Neurobiol. Author manuscript ; available in PMC 2018 June 01. white matter, derived f rom dSTORM (solid bars) and SOFI analyses (grey bars). (C) Mean axonal widths, derived from neurofilament (NF200) immunolabelled mouse brain tissue by dSTORM and SOFI . Error bars indicate 95% confidence limits. Neuropathol Appl Neurobiol. Author manuscript ; available in PMC 2018 June 01. Tissue samples used Samplenumber Laboratory identifier M/F, age, PMI Notes Human #1 C2 Male, age 71 year. PMI: 5 h Normal adult brain Human #2 C3 Male, age 61 year. PMI: 53 h Normal adult brain Human #3 C8 Female, age 68 year. PMI: 9h Normal adult brain Human #4 AD10 Male, age 71 year. PMI: 5 h Braak stage V-VI. Human #5 UCI-41-08 Female, age 91 year. PMI: 5 h Aged brain Mouse #1 MS #12 C57BL6, Male, age 10 weeks Young wild-type mouse Rat #1 WKY 13A Wistar, Male, age 12 months Aged normotensive rat Rat #2 S3 Wistar, Male, age 3 months Young control rat PMI , post mortem interval (hours) Neuropathol Appl Neurobiol. Author manuscript ; available in PMC 2018 June 01. Diameters of axonal f ilaments and astrocytic processes, est i mated from direct stochastic optical reconstruction microscopy (dSTORM) and super-resolution optical fluctuation imaging (SOFI ) images dSTORM SOFI Prior literature Axons (neurofilament labelled) 107±1.1 nm (mouse) 377±8.5 nm (mouse) Unmyelinated: 100-500 nm [21,25] 114±4.0 nm (human) 383±8.8 nm (human) Myelinated: 300-1100 nm [20,22,25,26] Astroglial processes (GFAP labelled) 102±1.5 nm (rat)/ 492±7.8 nm (rat) 200-500 nm [20,27] 388±2.4 nm (human) Each value comes f rom measurements of a t least two i ndividual objects (range 2-277) estimated from multiple automated diameter measurements (range 319-9896, see Table S1). Data values shown are mean values with 95% conf i dence li mits.
确定
还剩15页未读,是否继续阅读?

产品配置单

宁波力显智能科技有限公司为您提供《【应用实例】使用随机光学重建显微镜STORM对皮质下白质进行超分辨率成像》,该方案主要用于其他中超高分辨率显微镜检测,参考标准--,《【应用实例】使用随机光学重建显微镜STORM对皮质下白质进行超分辨率成像》用到的仪器有超高分辨显微镜iSTORM、力显智能科技INVIEW激光共聚焦超分辨STORM原理显微镜iSTORM
推荐专场
相关方案
更多