


方案详情
文
近年来,细菌细胞外囊泡(EV)被认为在多种生物学过程中发挥着重要作用,在肿瘤治疗和生物医学方面具有巨大的发展潜力。然而,对细菌EV的研究主要集中在从革兰氏阴性细菌释放的外膜囊泡,因为认为革兰氏阳性细菌中的最外层肽聚糖层作为物理屏障阻止EV的释放。
方案详情

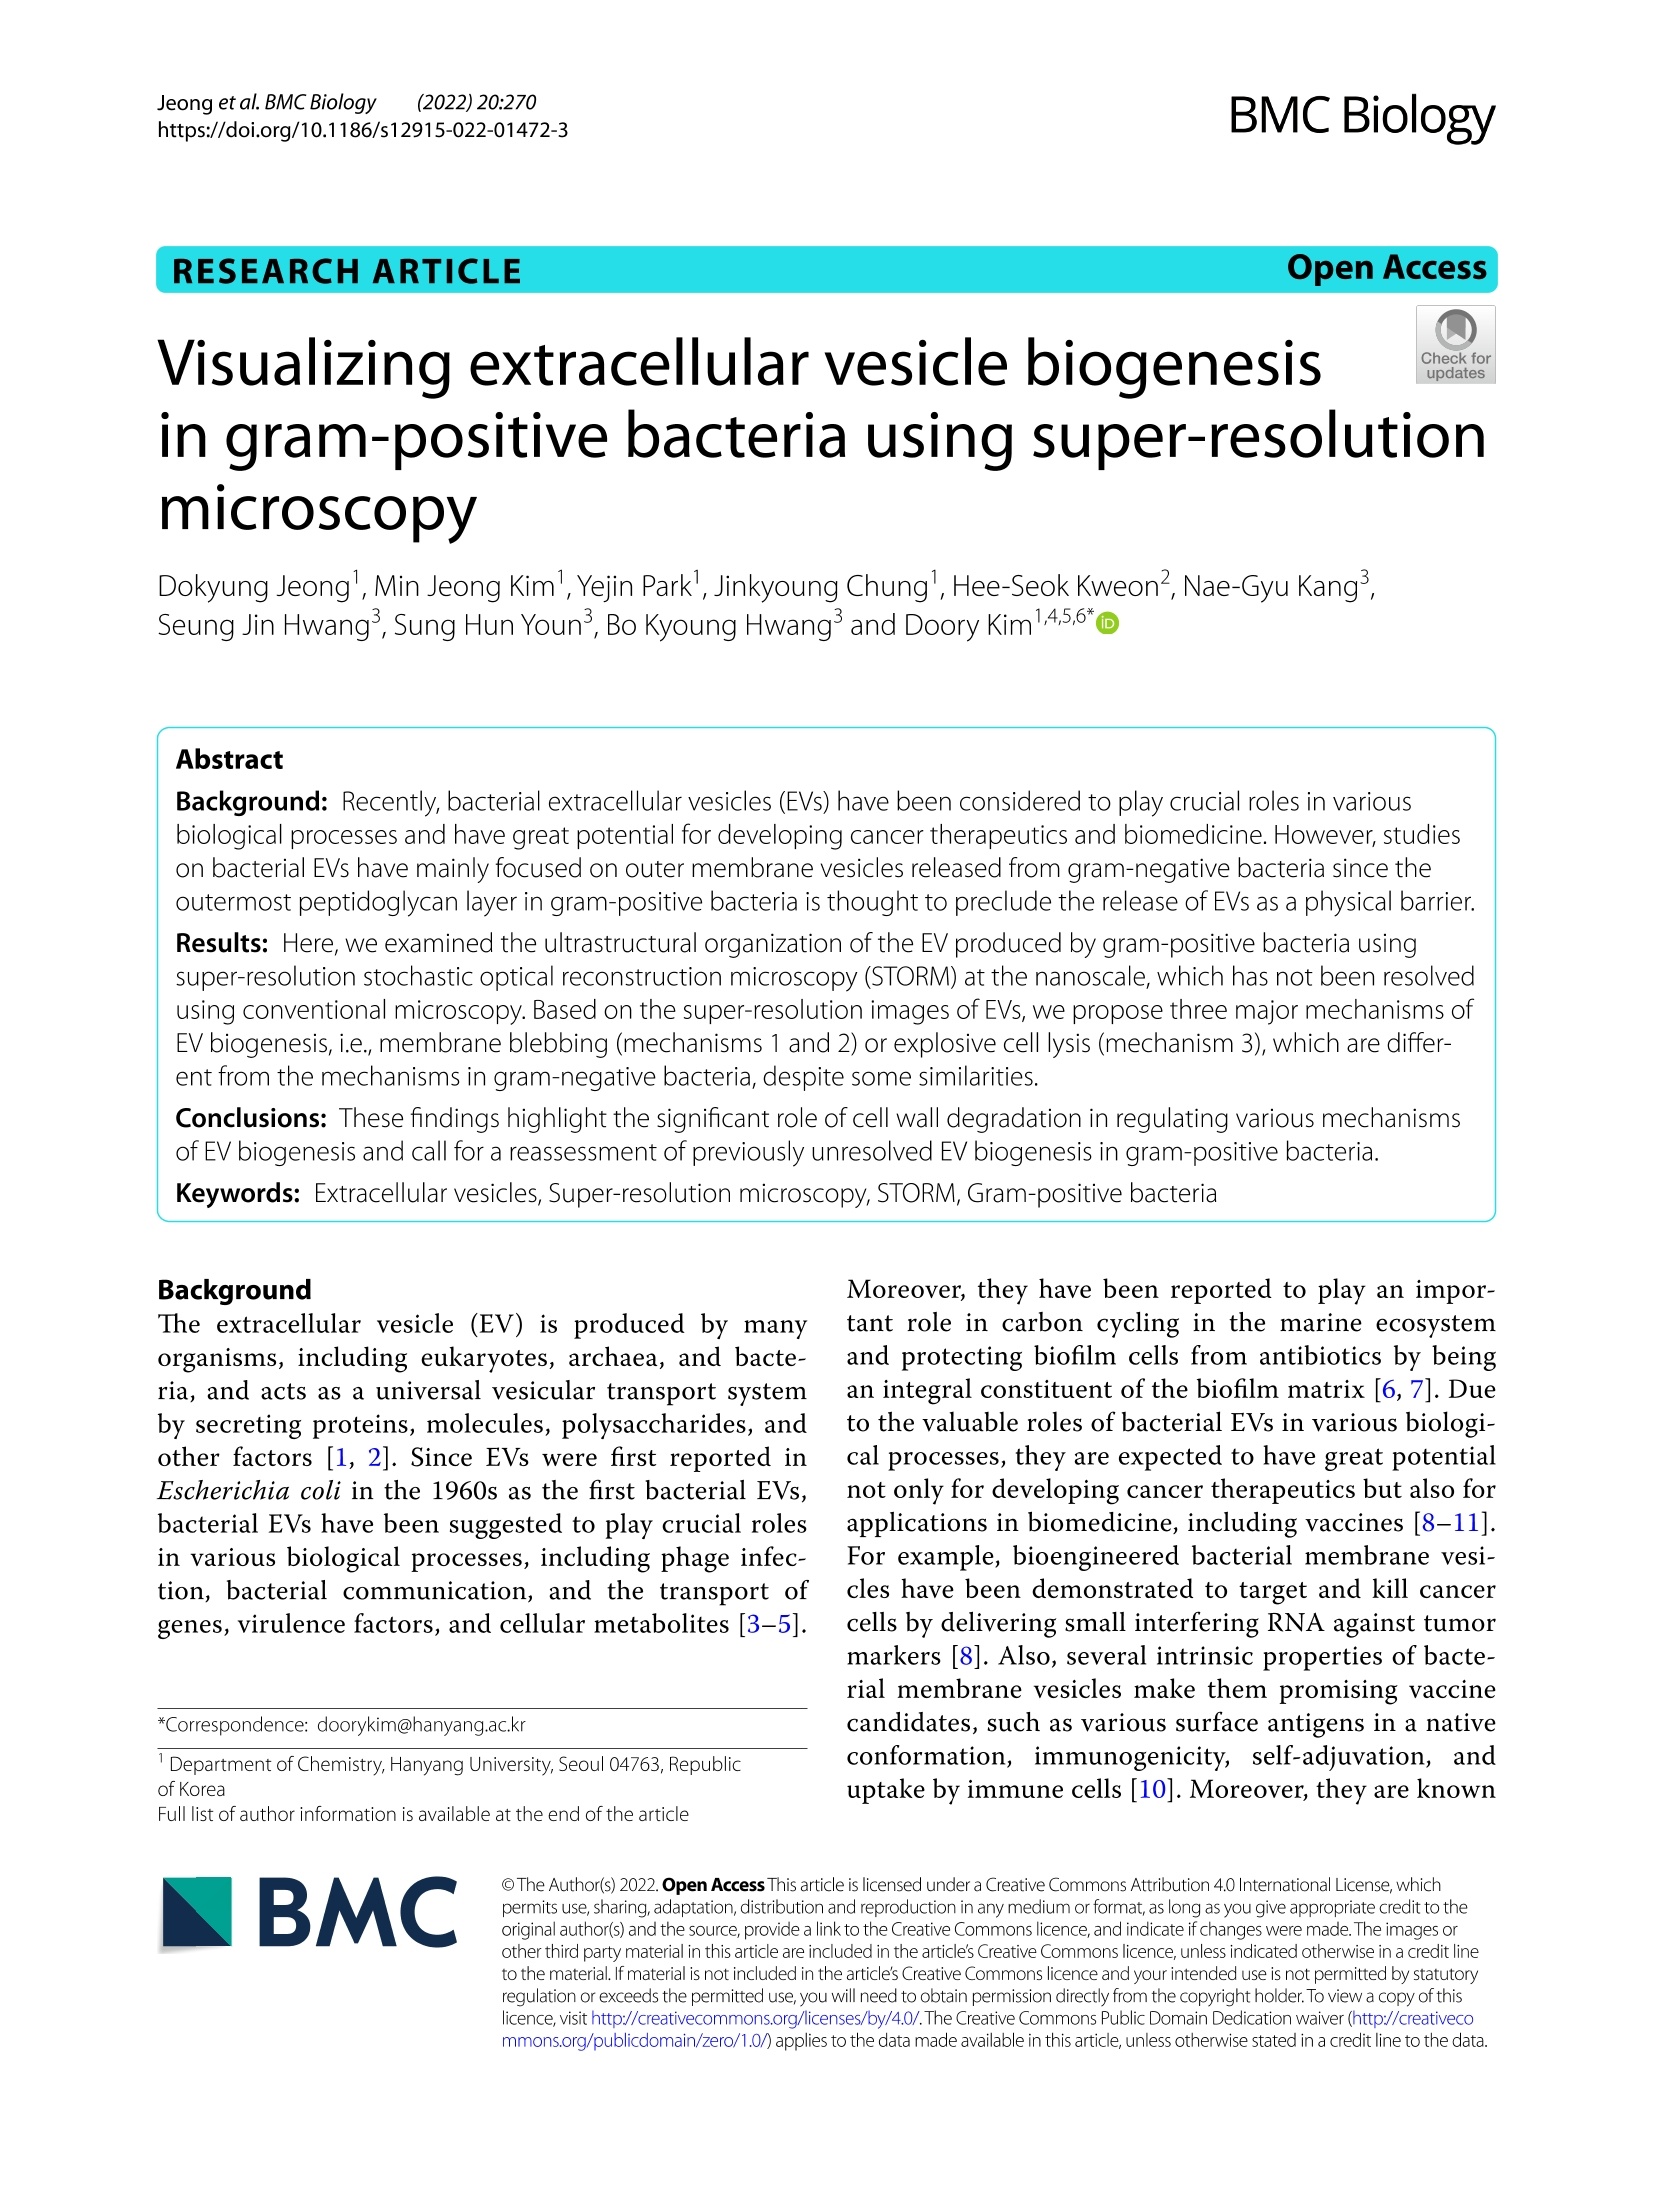
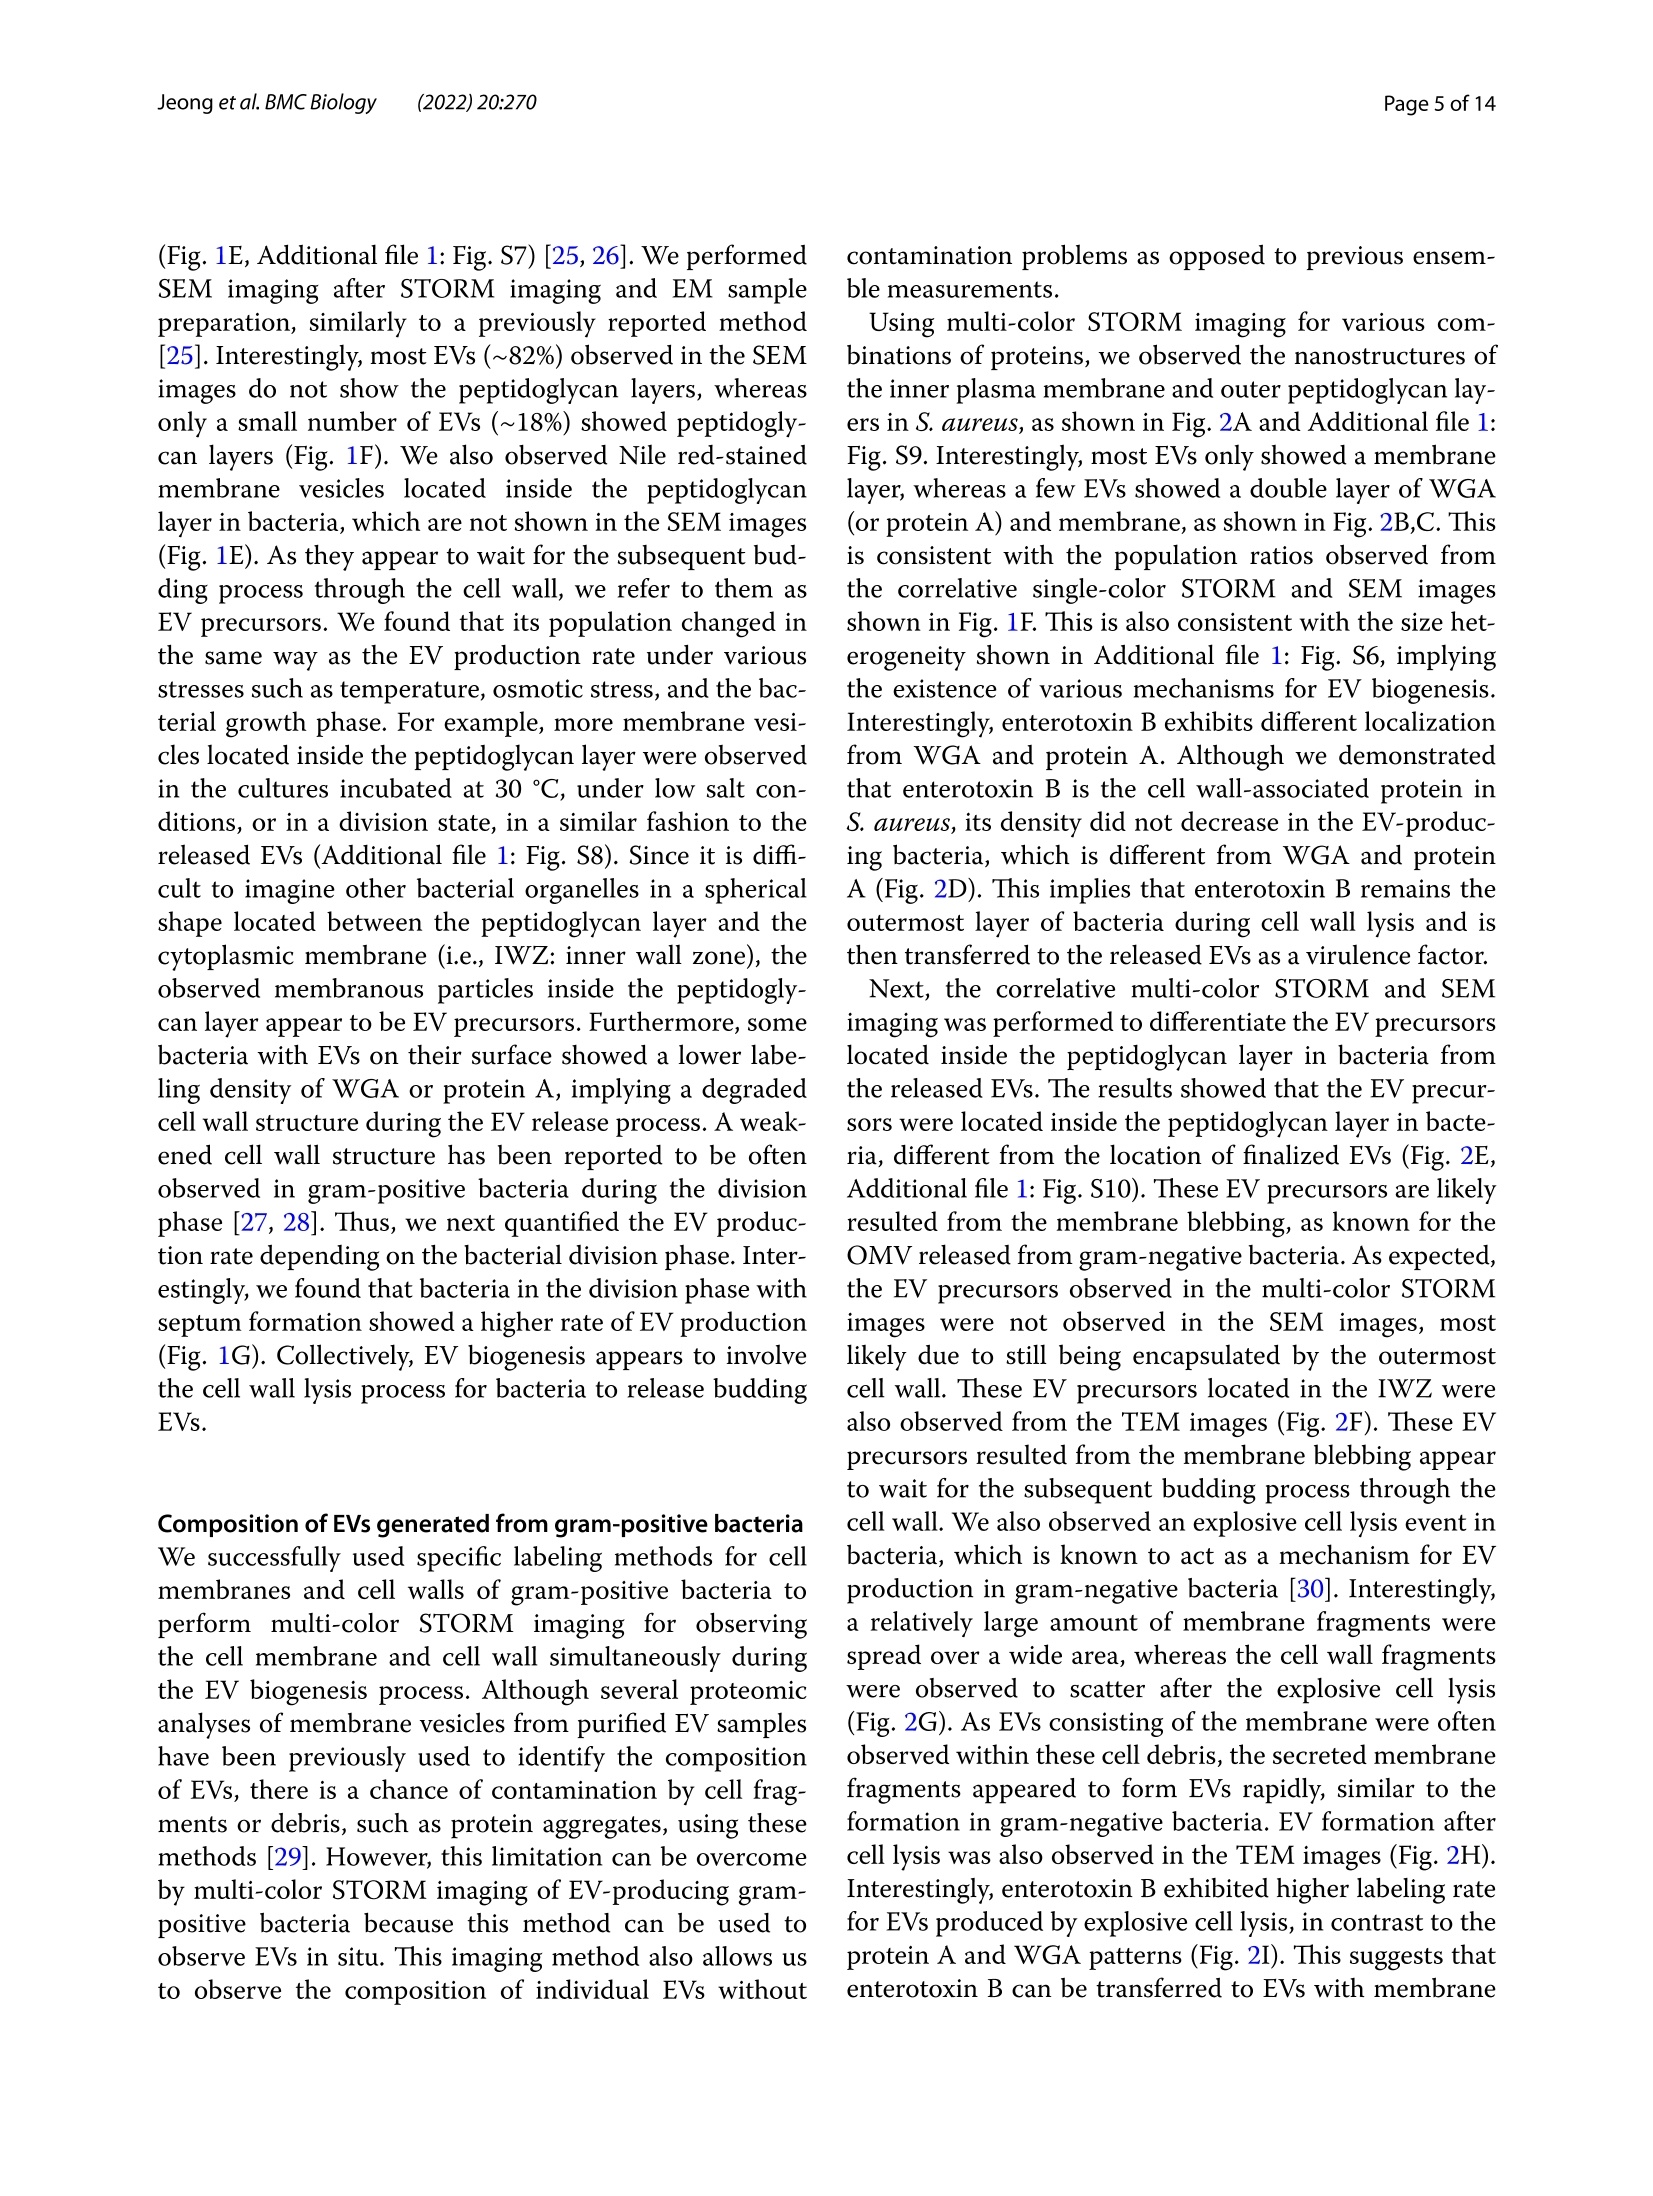
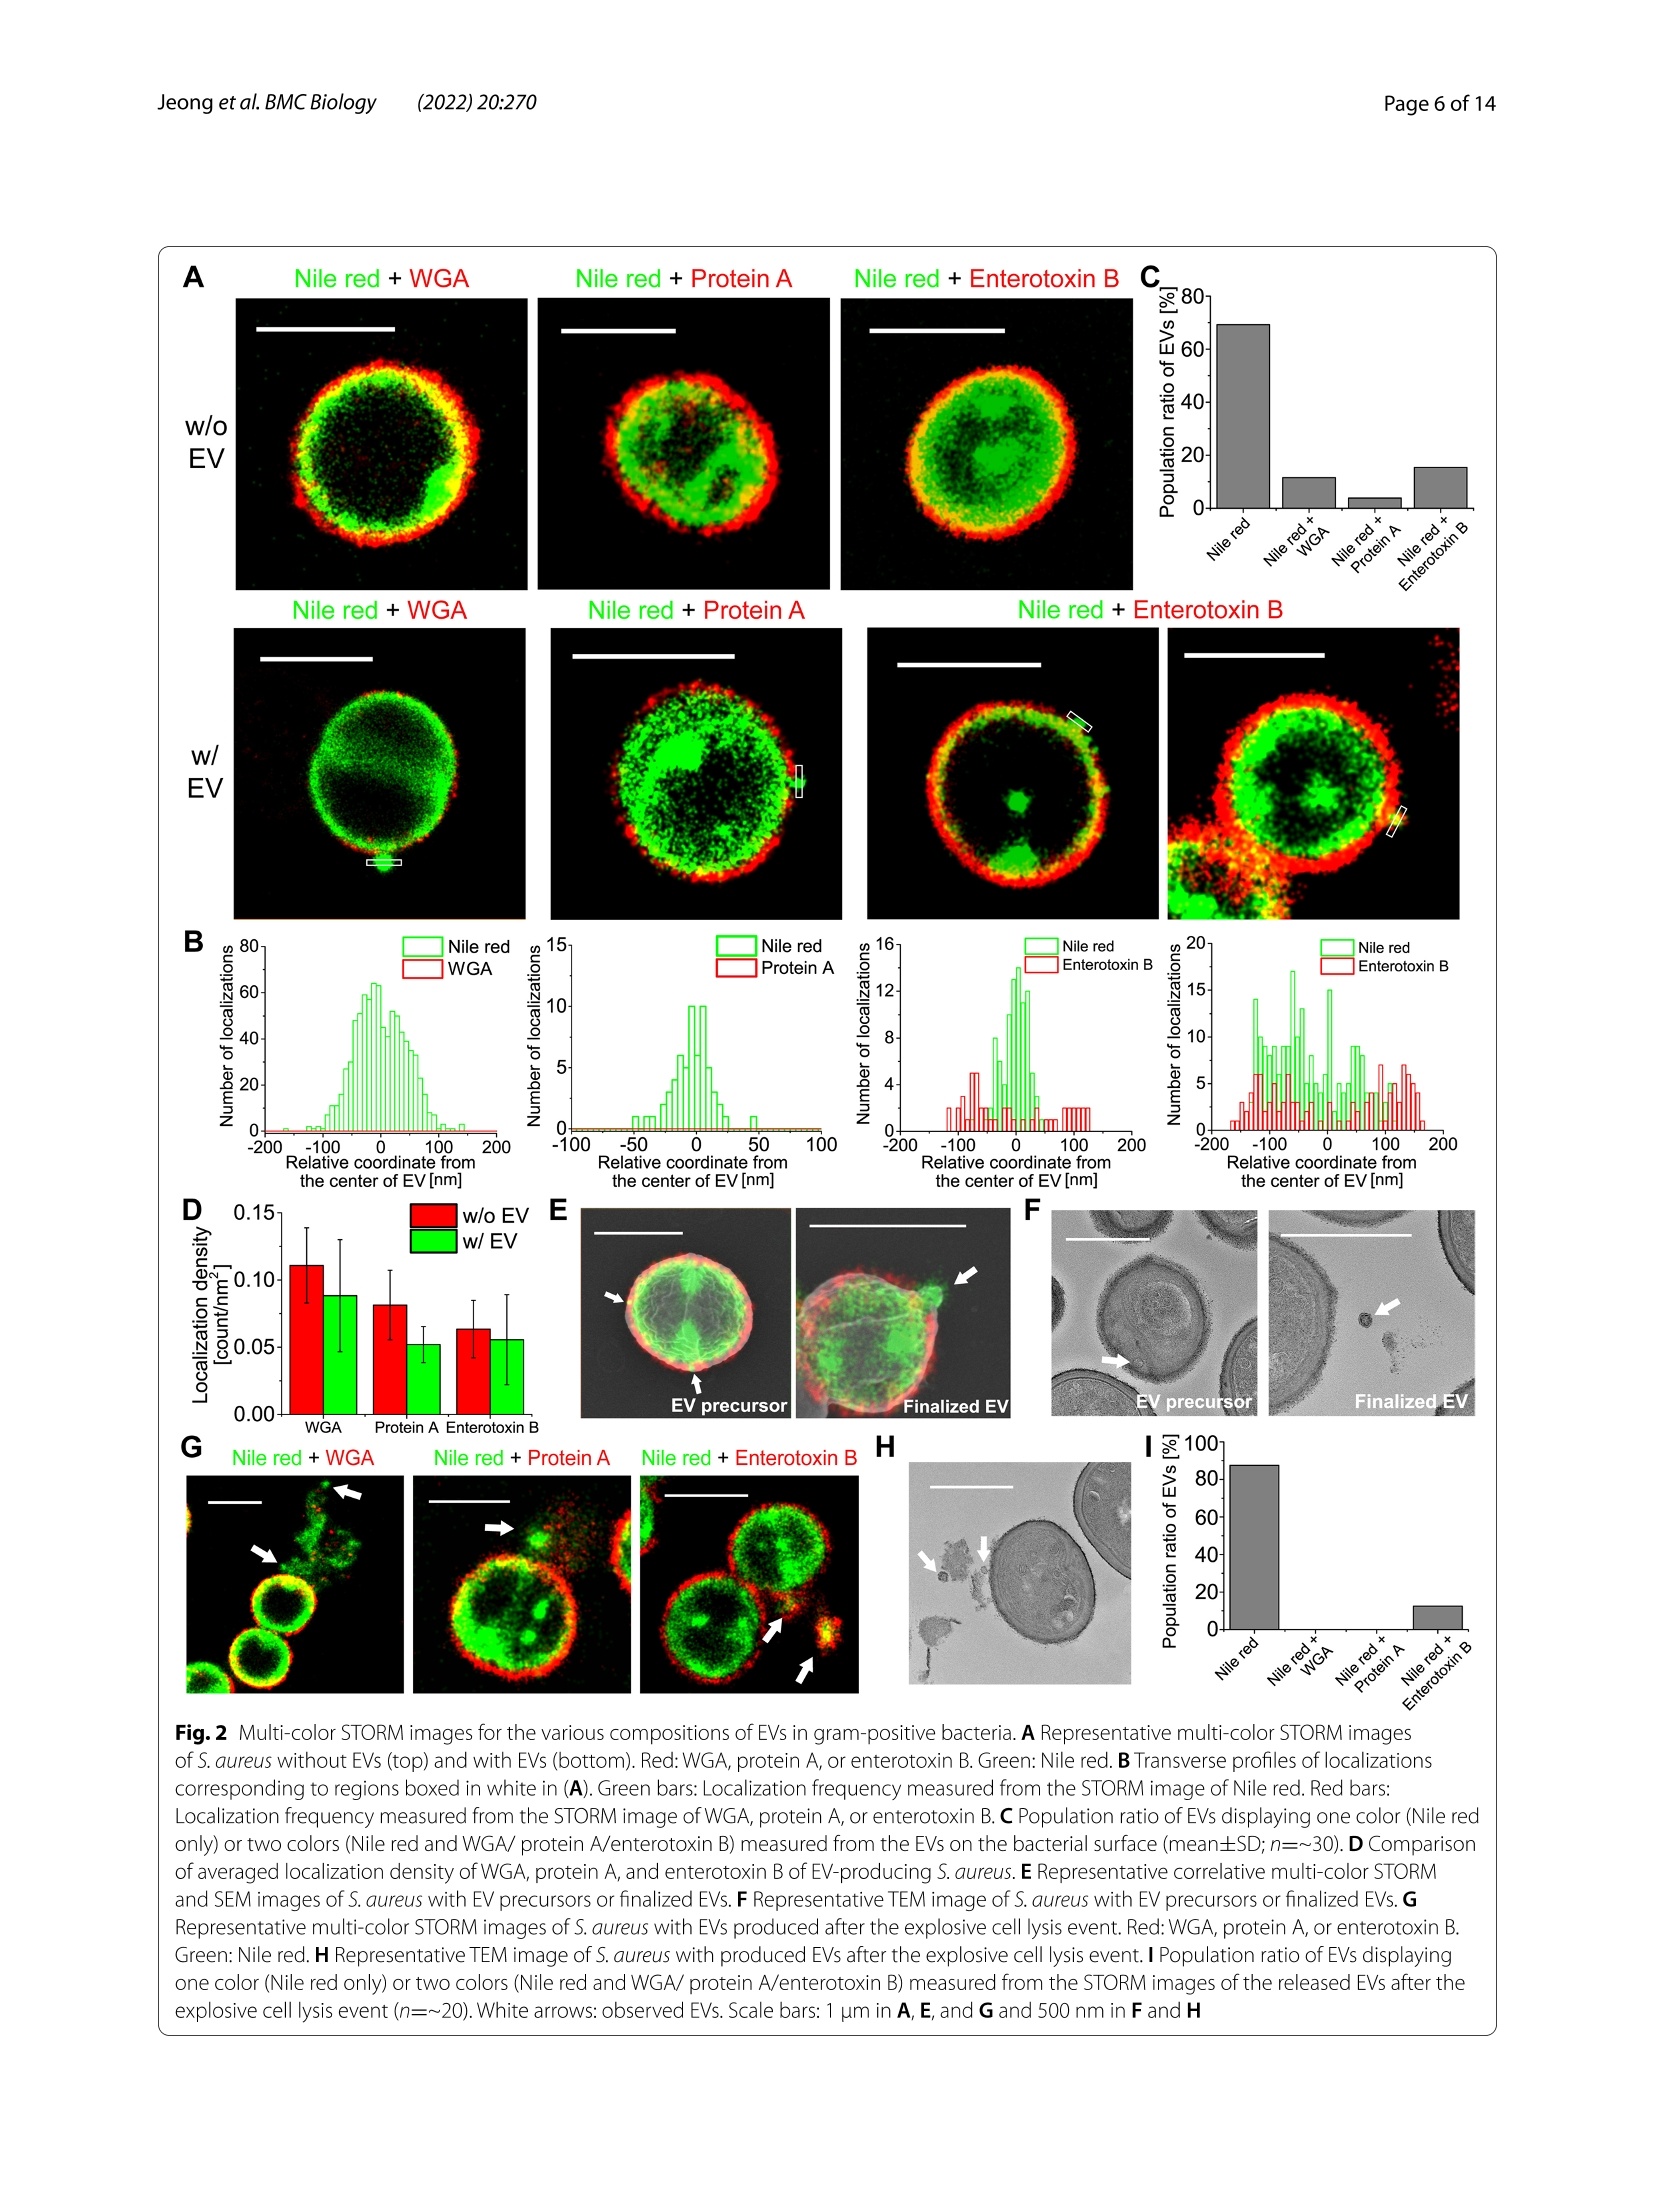
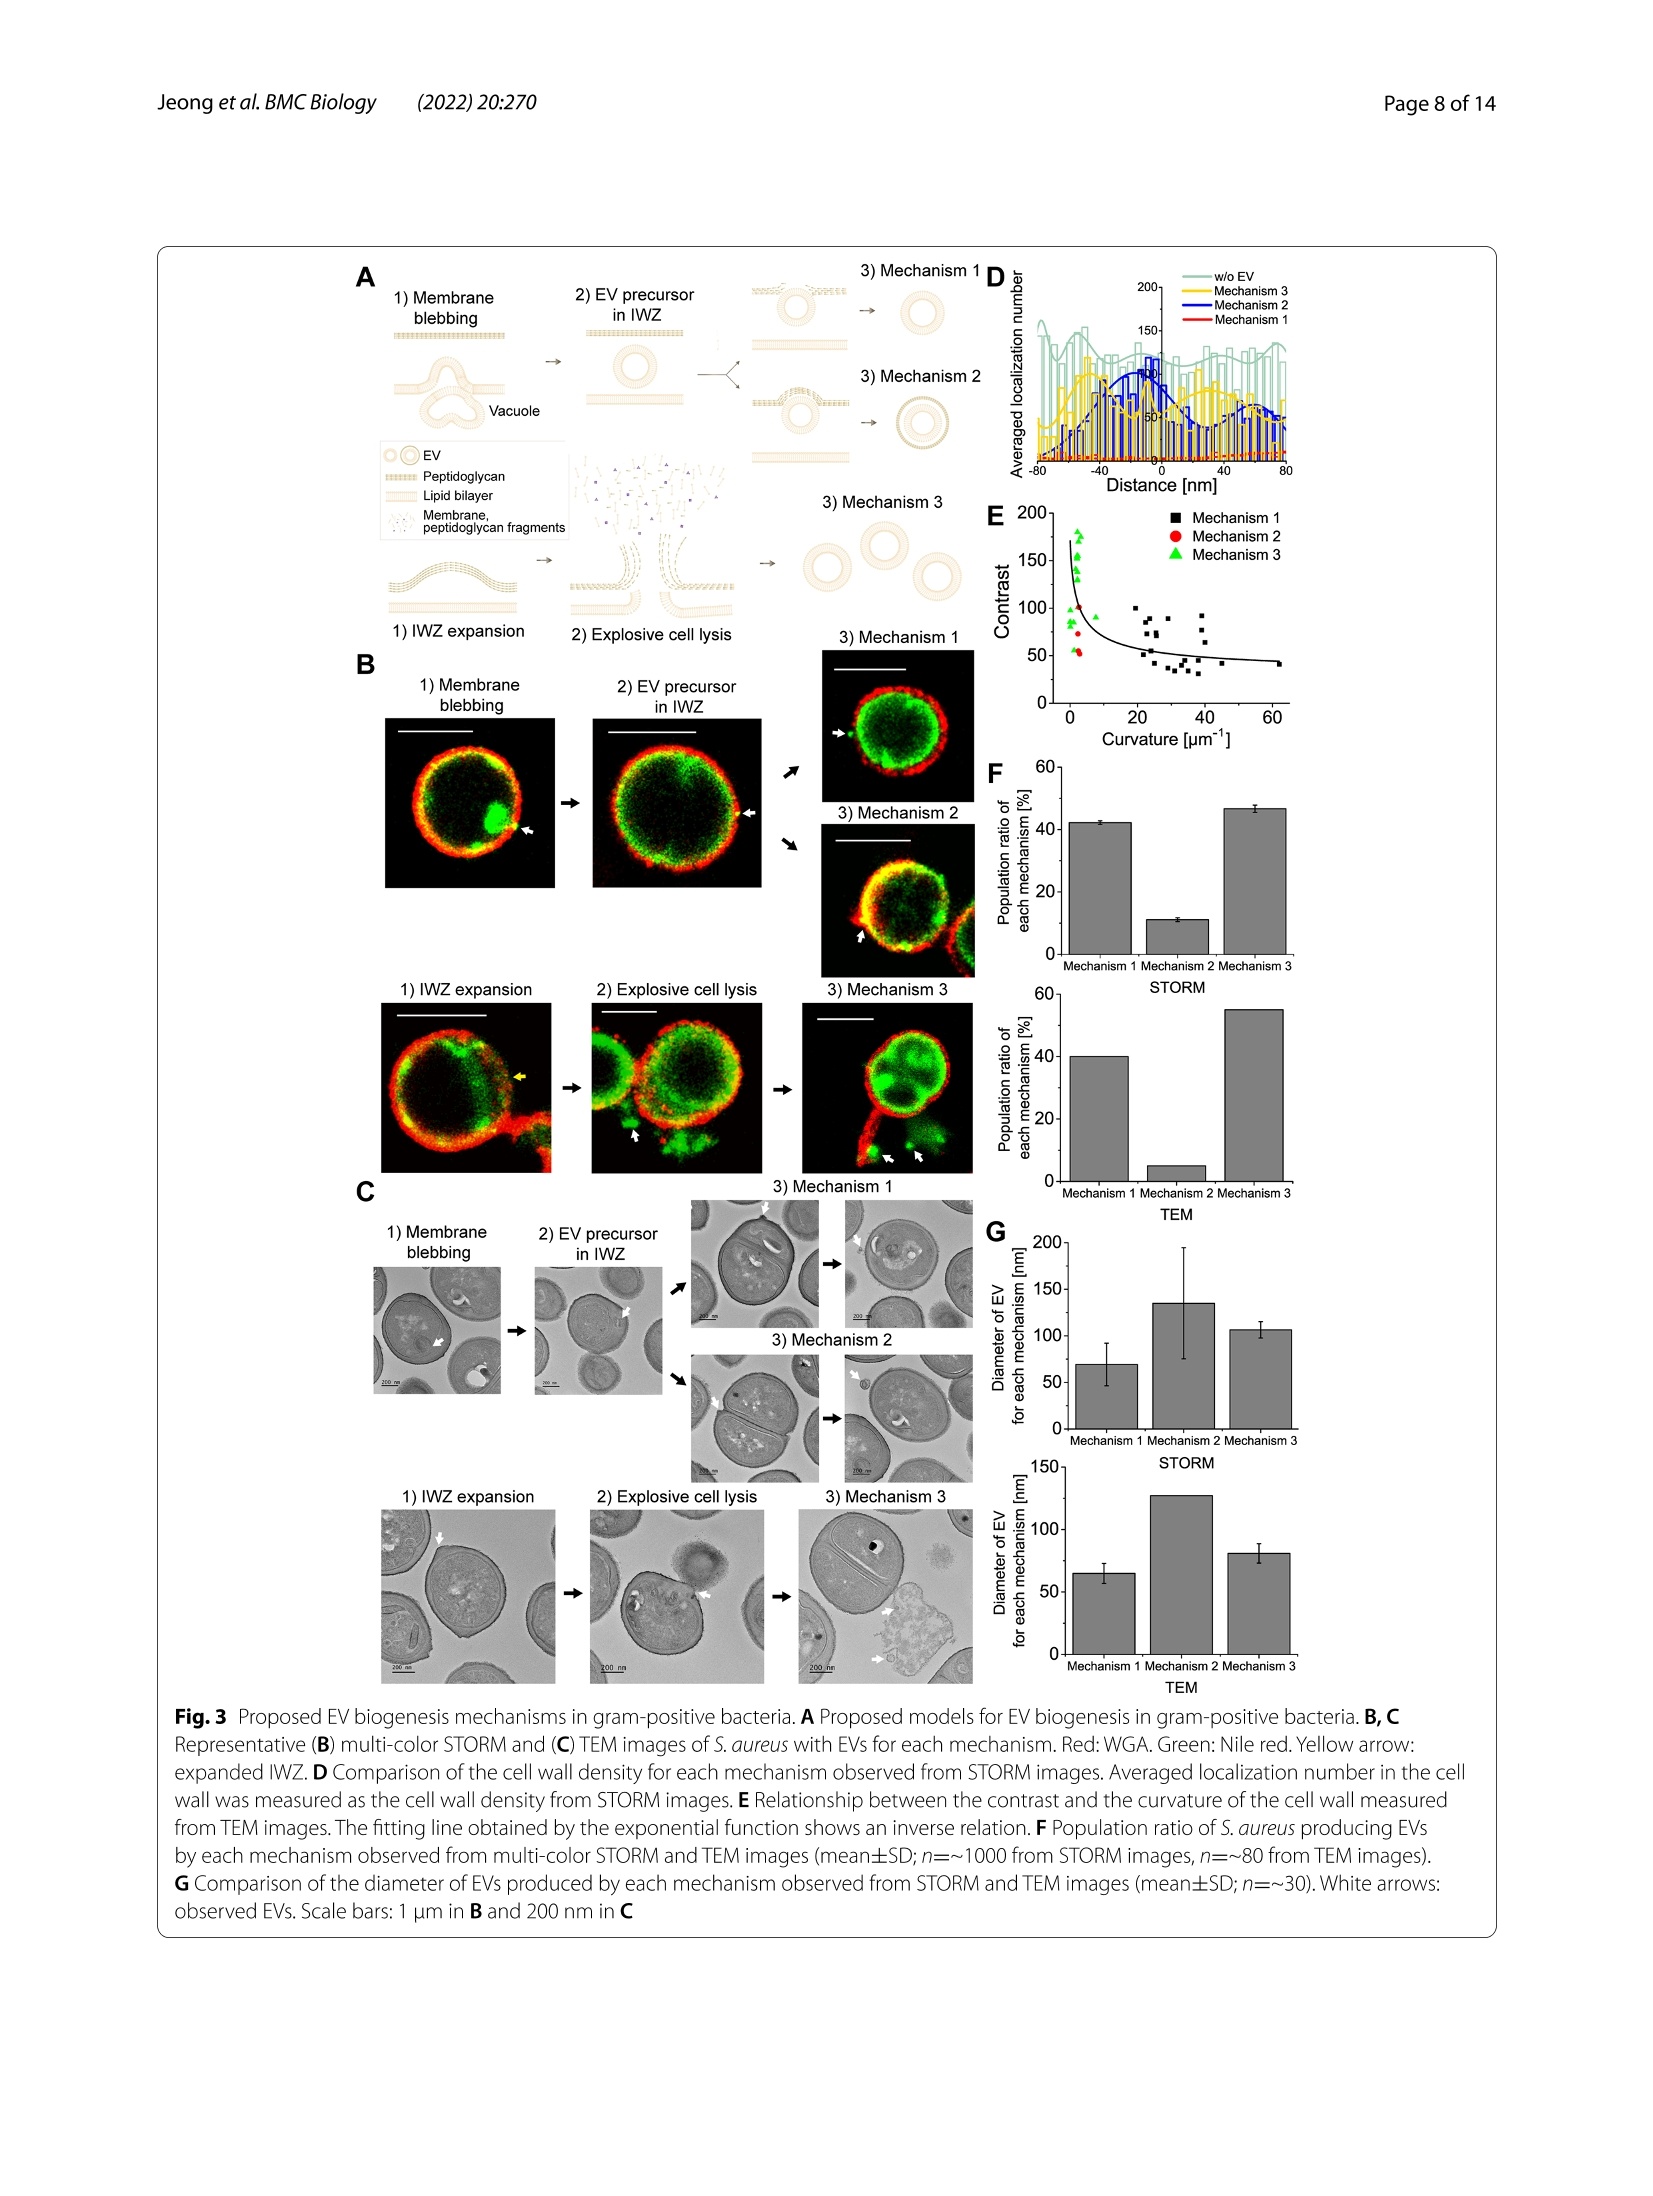
背景:近年来,细菌细胞外囊泡(EV)被认为在多种生物学过程中发挥着重要作用,在肿瘤治疗和生物医学方面具有巨大的发展潜力。然而,对细菌EV的研究主要集中在从革兰氏阴性细菌释放的外膜囊泡,因为认为革兰氏阳性细菌中的最外层肽聚糖层作为物理屏障阻止EV的释放。结果:在这里,作者研究了超分辨率随机光学重建显微镜(STORM),基于EV的超分辨率图像,作者提出EV生物发生的三种主要机制,即膜起泡(机制1和2)或爆炸性细胞溶解(机制3),尽管有一些相似之处,但与革兰氏阴性菌的机制不同。结论:这些发现突出了细胞壁降解在调节EV生物发生的各种机制中的重要作用,并呼吁重新评估革兰氏阳性菌中以前未解决的EV生物发生。关键词:胞外囊泡,超分辨率显微镜,STORM,革兰氏阳性菌研究结果(节选)来自革兰氏阳性细菌的EV的纳米成像图1 来自革兰氏阳性细菌的细胞外囊泡(EV)的超分辨率图像3D STORM图像的S.没有EV的金黄色葡萄球菌(顶部)和具有EV的金黄色葡萄球菌(底部)。金黄色葡萄球菌用尼罗红、WGA、抗蛋白A或抗肠毒素B标记。相同区域的衍射极限荧光图像。B S.不含EV和含EV的金黄色葡萄球菌。C从STORM(尼罗红、WGA、蛋白A和肠毒素B)、SEM和TEM图像测量的EV的平均直径(平均值±SD; n=11-75)。D. S.从用尼罗红/WGA/抗蛋白A/抗肠毒素B标记的样品的STORM图像观察到的分泌金黄色的EV(平均值±SD; n=700-1400)。E用尼罗红、WGA、抗蛋白A或抗肠毒素B标记的EV的相关STORM和SEM图像。白色箭头:从STORM和SEM图像观察到EV。黄色箭头:从尼罗红图像观察到的EV,其未在SEM图像中示出,这意味着在通过细胞壁的出芽过程之前位于肽聚糖层内部的膜囊泡。蓝色箭头:从SEM图像观察到的EV,其未在细胞壁的STORM图像中显示,这意味着没有肽聚糖层的EV。F来自相关STORM和SEM图像的SEM图像中所示的EV中用尼罗红、WGA、抗蛋白A或抗肠毒素B标记的EV的分数(n=8-22)。G代表性STORM图像和尼罗红标记的S.分泌金黄色葡萄球菌的EV处于静息状态或分裂状态。(mean±SD; n=170- 540)比例尺:A、E和G为1 μm,B为500 nm由革兰氏阳性菌产生的EV的组成图2 革兰氏阳性细菌中EV的各种组成的多色STORM图像A代表性的多色STORM图像S.没有EV的金黄色葡萄球菌(顶部)和具有EV的金黄色葡萄球菌(底部)。红色:WGA、蛋白A或肠毒素B。绿色:尼罗红。B对应于(A)中白色方框的区域的定位的横向概况。绿色条:从尼罗红的STORM图像测量的定位频率。红色条:从WGA、蛋白A或肠毒素B的STORM图像测量的定位频率。C从细菌表面上的EV测量的显示一种颜色(仅尼罗红)或两种颜色(尼罗红和WGA/蛋白A/肠毒素B)的EV的群体比率(平均值土SD; n=~30)。D产EV链球菌的WGA、蛋白A和肠毒素B的平均定位密度的比较。金黄色。E代表性的S.具有EV前体或最终EV的金黄色葡萄球菌。F S.具有EV前体或最终EV的金黄色葡萄球菌。G代表性的S.金黄色葡萄球菌与爆发性细胞裂解事件后产生的EV的细胞裂解。红色:WGA、蛋白A或肠毒素B。绿色:尼罗红。H S.金黄色葡萄球菌在爆发性细胞裂解事件后产生EV。I显示一种颜色(仅尼罗红)或两种颜色(尼罗红和WGA/蛋白A/肠毒素B)的EV的群体比率,其从爆炸性细胞裂解事件后释放的EV的STORM图像测量(n=~20)。白色箭头:观察EV。比例尺:A、E和G为1 μm,F和H为500 nm革兰氏阳性菌的EV生物发生机制图3 革兰氏阳性细菌中提出的EV生物发生机制革兰氏阳性菌中EV生物发生的拟议模型。B、C代表性的S.金黄色葡萄球菌与EV的每种机制。红色:WGA。绿色:尼罗红。黄色箭头:扩展IWZ。D从STORM图像观察到的每种机制的细胞壁密度的比较。测量细胞壁中的平均定位数作为来自STORM图像的细胞壁密度。E由TEM图像测量的对比度和细胞壁曲率之间的关系。由指数函数得到的拟合线显示出反比关系。F S.从多色STORM和TEM图像观察到的通过每种机制产生EV的金黄色葡萄球菌(平均值±SD;来自STORM图像的η = 〜 1000,来自TEM图像的η = 〜 80)。G从STORM和TEM图像观察到的由每种机制产生的EV的直径的比较(平均值土SD; n=~30)。白色箭头:观察EV。比例尺:B中为1 μm,C中为200 nm结论作者的研究结果突出了革兰氏阳性菌EV生物发生的不同机制,这在以前的研究中被忽视。基于作者使用各种超分辨率显微镜技术的纳米级观察,作者提出了EV生物发生的三个主要机制,通过膜起泡(机制1和2)和爆炸性细胞裂解(机制3),这是类似的机制在革兰氏阴性细菌中观察到,尽管有一些显着的差异。这些技术通过成像其他EV成分,如基因,毒力因子和细胞代谢物,揭示EV生物发生的分子机制。此外,活细胞超分辨率成像的EV生物发生在革兰氏阳性细菌作为一个未来的工作是有用的可视化EV形成在真实的,这将需要确认在本研究中提出的模型。总体而言,本次研究使我们更好地理解革兰氏阳性菌中EV产生的分子机制将促进治疗剂和生物医学的发展。目前在国内,随机光学重建显微镜STORM已成功实现商用,有需要STORM成像技术进行实验研究的专家老师们,即可预约获得 iSTORM 超高分辨率显微成像系统试拍服务~力显智能现已发布的超高分辨率显微成像系统 iSTORM,成功实现了光学显微镜对衍射极限的突破,使得在20纳米的分辨率尺度上从事生物大分子的单分子定位与计数、亚细胞及大分子复合物结构解析、生物大分子生物动力学等的研究成为现实,从而给生命科学、医学等领域带来重大突破。BMC BiologyJeong et al. BMC Biology (2022) 20:270https://doi.org/10.1186/s12915-022-01472-3 Jeong et al. BMC Biology (2022) 20:270Page 2 of 14 RESEARCH ARTICLE Open Access Visualizing extracellular vesicle biogenesis C u h p e d c a k t e fo s r in gram-positive bacteria using super-resolution microscopy Dokyung Jeong , Min J eong Kim , Yejin Park , J inkyoung Chung, Hee-Seok Kweon?, Nae -Gyu Kang,Seung Jin Hwang3, Sung Hun Youn, Bo Kyoung Hwang and Doory Kim14.5.6*o Abstract Background: Recently, bacterial extracellular vesicles (EVs) have been considered to play crucial roles in var i ous biological processes and have great potential for developing cancer therapeutics and biomedicine. However, studies on bacterial EVs have mainly focused on outer membrane vesicles released f rom gram-negative bacter i a since the outermos t pept i doglycan layer in gram-positive bacter i a i s thought to preclude the release of EVs as a physical barrier. Results: H e re, we examined the ultras t ructural organization of the EV produced by gram-posit i ve bacteria u s ing super-resolut i on stochastic optical reconstruction microscopy (STORM) at the nanoscale, which has not been resolved using conventional microscopy. Based on the super-resolution images of EVs , we propose three major mechanisms of EV biogenesis, i.e ., membrane blebbing (mechanisms 1 and 2) or explosive cell lysis (mechanism 3), which are differ-ent from the mechanisms i n gram-negative bacteria, desp i te some similarities. Conclusions: These findings highlight the significant ro l e of cell wall degradation in regulating various mechanisms of EV biogenesis and cal l fo r a reassessment of previously unresolved EV biogenesis in gram-positive bacteria. Keywords: Extracellular vesicles , Super -resolution microscopy, STORM, Gram-positive bacteria Background The extracel l ular vesicle (EV) is produced by many organisms, including eukaryotes, archaea, and bacte-ria, and acts as a universal vesicular transport system by secreting proteins, molecules, polysaccharides, and other factors [1, 2]. Since EVs were first reported in Escherichia coli in the 1960s as the first bacterial EVs,bacterial EVs have been suggested to play crucial roles in various biological processes, including phage infec-tion, bacterial communication, and the transport of genes, virulence factors, and cellular metabolites [3-5]. *Corr e s p onde nc e: d oorykim@hanya n g.ac.kr D epar t me nt of C he mistry, Hanyang U ni v e rs i ty, Seoul 04763,R e pu b l i c of K or ea Ful l list o f a utho r i nf ormat i on i s av a i l a bl e at t h e e nd of the art ic le Moreover, they have been reported to play an impor-tant role in carbon cycling in the marine ecosystem and protecting biofilm cells from antibiotics by being an integral constituent of the biofilm matrix [6, 7].Due to the valuable roles of bacterial EVs in various biologi-cal processes, they are expected to have great potential not only for developing cancer therapeutics but also for applications in biomedicine, including vaccines [8-11].For example , bioengineered bacterial membrane vesi-cles have been demonstrated to target and kill cancer cells by delivering small interfering RNA against tumor markers [8]. Also, several intrinsic properties of bacte-rial membrane ves i cles make them promising vaccine candidates, such as various surface antigens in a native conformation, i mmunogenicity, self-adjuvation, and uptake by immune ce l ls [10]. Moreover, they are known to be versatile as they can be bioengineered to express any chosen antigen and manipulated to reduce their endotoxicity [9]. Therefore, research attention on the bacterial EV has increased substantially over the past decade. Until now, studies on bacterial EVs have mainly focused on the outer membrane vesicles (OMVs) released from gram-negative bacteria, which originate from the outer membrane of gram-negative bacter i a under the control of membrane blebbing [2, 5]. In contrast, EV production by gram-posi t ive bacteria has been overlooked due to the absence of an outer membrane and the inference that the thick peptidoglycan cell wall in gram-positive bacteria precludes the release of EV as a physical barr i er [2, 5].However, recent studies have reported biologically active EVs from gram-positive bacteria, stimulating research on the biogenesis of EVs in gram-positive bacteria [12].Although the mechanisms underlying EV formation in gram-posit i ve bacteria remain unclear, several models for EV biogenesis in gram-negative bacteria have been proposed, including increased turgor pressure from the periplasmic space, repulsion between charged l ipopoly-saccharide molecules, and depletion of the peptidoglycan and outer membrane l inkage [2, 5, 11]. Given the differ-ent cell wall compositions in gram-positive and gram-negative bacteria, they could differ in the routes for EV formation. Currently, the observation and quantification of EV formation in gram-positive bacteria remains challeng-ing due to the technical difficulties associated with imag-ing the ultrastructure of small-sized EVs (20-400 nm in diameter) within the di f fraction-limited area using conventional light microscopy (LM) techniques [5].Although electron microscopy (EM) can provide higher resolution than LM, the molecular-specific labeling effi-ciency i s l imited in EM i mages [13-15]. These difficulties can be overcome using recently developed super-resolu-tion fluorescence microscopy, which enables nanoscale imaging with high molecular spec i ficity [16-19]. In t his study, the mechanisms underlying EV biogenesis in gram-positive bacteria were i nvestigated using super-resolution stochastic optical reconstruction microscopy (STORM). For comparison, various EM techniques were also performed, including scanning electron microscopy (SEM), transmission electron microscopy (TEM), and correlative STORM and EM. These approaches were used to reveal ultrastructural changes i n the EV at the cell envelope during the maturation process via observations of N-acetylglucosamine, protein A, enterotoxin B, and the membrane at the nanoscale. These f indings indicate the existence of diverse mechanisms for EV biogenesis in gram-posi t ive bacteria, which have not yet been resolved using conventional microscopy. Results Nanoimaging of EVs from gram-positive bacteria We f irst investigated whether EVs could be observed in gram-positive bacteria using super-resolution STORM.We chose Staphylococcus aureus and Staphylococcus epi-dermidis because they are common members of the nor-mal human microbiota. S. aureus and S. epidermidis were first labeled with Nile red dye to observe their membrane structures and then imaged using 3D STORM imaging.From the single-molecule localization distribution analy-sis and the xy-cross-section images of Nile red-stained bacteria, we confirmed the nanoscale resolution of this imaging method (Additional file 1: Fig. S1). From the STORM images of Nile red-stained S. aureus, we also observed the septum structure in the dividing bacteria,implying successful membrane l abeling of the bacteria by Nile red dye molecules (Additional file 1: Fig. S2). As shown in Fig. 1A, Additional file 2: movie 1, and Addi-tional file 3: movie 2, most S. aureus isolates (~90%) did not have EVs with spherical shapes. In contrast, ~10% of S. aureus isolates were shown to have EVs on their sur-faces, which has not been previously observed by diffrac-tion-limited LM owing to their small size (~60-150 nm in diameter). To i nvestigate whether they are Nile red precipitates or real EVs, we performed a single-molecule distribution analysis of the Nile red-only sample without EVs under our experimenta l conditions (Additional file 1: Fig. S1B).Any precipitate would result in noticeable changes in the single-molecule distribution, such as large positional variations with large FWHM values or an asymmetric distribution. However, the positional variation statistics within each nanocluster resulted in an FWHM (localiza-tion uncertainties) of 26-28 nm, in agreement with what is typically achieved for a single Nile red molecule in STORM, i mplying that aggregation was prevented under our optimized conditions and the observed nanoc l usters were real EVs, not Nile red precipitates. We also tested other membrane dyes , including CellMask and CellBrite.As shown in Additional file 1: Fig. S3, we observed EVs from the staining of CellMask and CellBrite similar to Nile red-stained EVs. From the quantitative analysis of EV diameter measurement, they showed spherical shapes with a similar diameter (99-108 nm), regardless of the type of membrane dye. To further confirm that the observed small-sized spherical particles were indeed EVs, we purified the EVs from cultured S. aureus and then performed STORM imaging after Nile red labeling. As shown in Additional file 1: Fig. S4, the Nile red-labeled EVs from purified sam-ples also exhibited a spherical shape with a size similar to that of the observed nanoparticles in Fig. 1A, confirm-ing that the observed small nanopart i cles on the bacteria Fig.1 Super-r esolutio n images o f ext r acellu l a r ves i cles (EVs ) fro m gra m -pos it ive b acteria. A 3D S T ORM i m ages of S. aureus wi t hout EVs (top) a n d wit h EVs (b otto m). S. aureus was l ab eled w i t h N i le r ed,WGA,a n t i -p rotein A, or a nti-entero t oxi n B. I n set: Di f fractio n -li mited f luo r escence i m ages of t h e sa m e a rea . B SEM (l eft ) a n d TEM (rig h t ) images of S . aureus wi t hout EVs and with EVs. C T he ave r age dia m eter of E Vs measured f ro m STORM (N i le r ed, WGA, p ro t ein A, a n d enterotoxin B ), SEM, and T E M images (mean±S D ;n =11-75).D Compa ri son of t he population ra t io of S . aure u s -secreting E Vs observed fr om STORM images of the sample l abe l ed w i t h N i le r ed/WGA/a n ti-protei n A/anti -enterotoxi n B (mean±SD ;n =700-1400).E Cor r el a tive STORM and SEM images o f EVs labeled wi t h Ni l e red , WGA, anti-protein A, or an ti-enterotoxin B . White a r row: EV observed both fr om STORM a nd SEM images. Yel l ow ar ro w: E V observed fr om t he N i l e r ed image, wh ic h was not show n in t he S E M i mage, implyin g a membra n e ves i cle l ocated i n side t he peptidoglycan layer before t he budding proces s t h ro u gh the cell wall . B l u e a rrow: EV o b served fr om t h e S E M image, which was not shown in t h e STORM image o f the cell wal l , imp l ying EVs w i t h ou t t h e p e p tidog l yca n l a yer. F F r action o f labeled E Vs wit h N i le r ed, WGA,a n t i -p rotein A, or a nti -e n terotoxin B among the EVs shown i n SEM images from c orrel a tive STORM and SEM im a g es (n =8-22). G R epresentat i ve ST O RM image s and the populat i on ra tio of N i le r ed-l abe l ed S . a u r e us-s ecret i ng EVs in t h e r est i ng state or in t he d i vis i on state.(mean ±S D ;n =170-540) Scale bar s: 1 um in A, E,a n d G a n d 500 n m in B are real EVs. Thus, it suggests that our super-resolution imaging method can be useful in identifying EVs by con-firming both the particle morphology and membrane composition, which have not been simultaneously ana-lyzed at the single EV level from any conventional EV detection methods, such as nanoparticle tracking analy-sis, SEM/TEM imaging, or proteomic analysis. We also found that EVs were also observed in the STORM images of the Nile red-stained S. epidermidis (Additional f ile 1:Fig. S5). However, only a few S. epidermidis (~2.5%) were observed to have EVs on their surfaces compared to S.aureus (~10%), which may imply the distinct roles of EVs in different strains. Next, we investigated whether EVs could also be observed in the cell wall of S. aureus after staining. We used wheat germ agglutinin (WGA) and anti-protein A to label the bacterial cell wall. WGA binds to N-acetyl-glucosamine in the outer peptidoglycan layer of gram-positive bacteria [20], and protein A is known to be a cell wall-associated protein [21, 22]. Since WGA can bind only to the peptidoglycan layer, hollow and spheri-cal shapes of bacteria were observed from 3D STORM images, whereas the septum i n the dividing bacteria was not observable in the cell wall i mages (Fig. 1A, Additional file 1: Fig. S2). Interestingly, we also observed EVs in the STORM images of the surface of S. aureus l abeled with WGA and anti-protein A; these EVs were not resolved in the di f fraction-limited fluorescence images. Next, we immunolabelled enterotoxin B in S. aureus. Enterotoxins are known to be one of the most common causes of food poisoning due to uncontrolled T cell activation, followed by toxic shock and death [23]. Since it has been reported that enterotoxin A and B are bound to microvillus mem-brane vesicles in vitro, we expected to observe EVs from bacterial enterotoxin i mages [23]. As shown i n Fig. 1A,EVs were observed on the surface of S. aureus in the cor-responding enterotoxin B-stained STORM images. The observed staining patterns in bacteria were similar to those of the peptidoglycan layer rather than the cytoplas-mic membrane because the septum in the dividing bacte-ria was not stained with the enterotoxin B immunolabel,implying that the immunolabeled-enterotoxin B Was located in the cell wall of gram-positive bacteria . This observation is also supported by a previous study demon-strating that enterotoxin B is associated with the cell wall after i ts precursor form i s processed and released from the membrane [24]. This previous study also reported that the cell wall-associated enterotoxin B level decreased proportionately as the extracellular fraction of entero-toxin B increased during a pulse-chase experiment [24].The observations of our STORM images and the findings of this previous study suggest that enterotoxin B appears to be released into the extracellular environment in the form of EV. Thus, this secreted virulence factor may be transferred from the cell wall of gram-positive bacteria to EVs. We also performed SEM and TEM imaging to observe EVs released from S. aureus. As shown in Fig. 1B,some S. aureus cells were observed to have EVs on their surfaces in the SEM and TEM images, similar to the STORM images. Using the various EV images, we analyzed the size of t MD:he observed EVs. First, we compared the membrane diameters measured from the STORM images of EVs secreted f rom bacteria and the purified EVs. The average membrane diameters measured from EVs on bacteria and the purified EVs were ~113 and ~107 nm, respectively,confirming that the observed smal l nanopartic l es on bac-teria are real EVs (Additional file 1: Fig. S4B). From the diameter measurement of EVs, we found that the aver-aged diameters of EVs observed from STORM images of a membrane and a peptidoglycan layer range between 100 and 110 nm, which is within the reported EV size range [5] (Fig. 1C). As expected, the EVs observed in the SEM and TEM images appeared smaller than those observed in the STORM images owing to the absence of a tag and the shrinkage effect during the dehydration step in EM. Interestingly, we observed at least two populations based on the size in the STORM images, SEM images,and TEM i mages, i mplying the heterogeneity of EVs gen-erated from different biogenesis mechanisms (Additional f ile 1: Fig. S6). Next, we analyzed the EV production rates of S. aureus from each type of i mage. Interestingly, the STORM images of the bacterial membrane exhibited a higher rate of EV production (~10%) than the STORM images of the cell wall (~1 and ~2% from WGA and pro-tein A images, respectively) (Fig. 1D). Furthermore, the STORM images of enterotoxin B-l abeling exhibited a higher rate of EV production (~4%) than the STORM images of the cell wall. These results suggest various compositions of EV for the membrane and peptidogly-can layers. Such variations i n the composition of EV have not been resolved at a single EV level with conventional EV analysis techniques, emphasizing the importance of our nanoscale imaging-based analysis technique. Mean-while, it was noted that fewer EVs were observed from the SEM images compared with the STORM images of the bacterial membrane. This could be because some EVs observed from membrane images had not yet budded out to the outside of the bacterial outer surface and were still located inside the peptidoglycan layer. Thus, they were not observable in the topography of the SEM images. The different production rates observed from various images prompted us to investigate the composition and location of EVs. To confirm the composition of EVs, we performed recently developed correlative STORM and SEM imaging (Fig. 1E, Additional file 1: Fig. S7) [25, 26]. We performed SEM i maging after STORM imaging and EM sample preparation, similarly to a previously reported method [25]. Interestingly, most EVs (~82%) observed in the SEM images do not show the peptidoglycan layers, whereas only a small number of EVs (~18%) showed peptidogly-can layers (Fig. 1F). We also o Ca bserved Nile red-stained membrane vesicles located inside the peptidoglycan layer i n bacteria , which are not shown in the SEM images (Fig. 1E). As they appear to wait for the subsequent bud-ding process through the cell wall, we refer to them as EV precursors. We found that its population changed in the same way as the EV production rate under various stresses such as temperature, osmotic stress, and the bac-terial growth phase. For example, more membrane vesi-cles located inside the peptidoglycan layer were observed in the cultures incubated at 30℃, under low salt con-ditions, or in a division state, in a similar fashion to the released EVs (Additional file 1: Fig. S8). Since i t is diffi-cult to imagine other bacterial organelles in a spherical shape located between the peptidoglycan l ayer and the cytoplasmic membrane (i.e., IWZ: inner wall zone), the observed membranous particles inside the peptidogly-can layer appear to be EV precursors. Furthermore, some bacteria with EVs on their surface showed a lower labe-ling density of WGA or protein A, implying a degraded cell wall structure during the EV release process. A weak-ened cell wal l structure has been reported to be often observed in gram-positive bacteria during the division phase [27, 28]. Thus, we next quantified the EV produc-tion rate depending on the bacterial division phase. Inter-estingly, we found that bacteria i n the division phase with septum formation showed a higher rate of EV production (Fig. 1G). Collectively, EV biogenesis appears to involve the cell wall lysis process for bacteria to release budding EVs. Composition of EVs generated from gram-positive bacteria We successfully used specific l abeling methods for cell membranes and cell walls of gram-positive bacteria to perform multi-color STORM imaging for observing the cell membrane and cell wall simultaneously during the EV biogenesis process. Although several proteomic analyses of membrane vesicles from purified EV samples have been previously used to identify the composition of EVs, there i s a chance of contamination by cell frag-ments or debris, such as protein aggregates, using these methods [29]. However, this limitation can be overcome by multi-color STORM i maging of EV-producing gram-positive bacteria because this method can be used to observe EVs i n situ. This imaging method also allows us to observe the composition of individual EVs without contamination problems as opposed to previous ensem-ble measurements. Using mult i -color STORM imaging for various com-binations of proteins, we observed the nanostructures of the inner plasma membrane and outer peptidoglycan lay-ers in S. aureus, as shown i n Fig. 2A and Additional f ile 1:F i g. S9. Interestingly, most EVs only showed a membrane layer, whereas a few EVs showed a double l ayer of WGA (or protein A) and membrane, as shown in Fig. 2B,C. This is consistent with the population ratios observed from the correlative single-color STORM and SEM images shown in Fig. 1F. This is also consistent with the size het-erogeneity shown in Additional f ile 1: Fig. S6, implying the existence of various mechanisms for EV biogenesis.Interestingly, enterotoxin B exhibits different localization from WGA and protein A. Although we demonstrated that enterotoxin B is the cell wall-associated protein in S. aureus, i ts density did not decrease in the EV-produc-ing bacteria, which is different from WGA and protein A (Fig. 2D). This implies that enterotoxin B remains the outermost layer of bacteria during cell wall lysis and is then transferred to the released EVs as a virulence factor. Next, the correlative multi-color STORM and SEM imaging was performed to differentiate the EV precursors located inside the peptidoglycan layer in bacteria from the released EVs. The results showed that the EV precur-sors were located i nside the peptidoglycan layer in bacte-ria, different from the location of finalized EVs (Fig. 2E,Additional f ile 1: Fig.S10). These EV precursors are likely resulted f rom the membrane blebbing, as known for the OMV released from gram-negative bacteria. As expected,the EV precursors observed in the multi-color STORM images were not observed in the SEM images, most likely due to still being encapsulated by the outermost cell wall. These EV precursors located in the IWZ were also observed from the TEM images (Fig. 2F). These EV precursors resulted from the membrane blebbing appear to wait for the subsequent budding process through the cell wall. We also observed an explosive cell lysis event in bacteria, which is known to act as a mechanism for EV production in gram-negative bacteria [30]. Interestingly,a relatively large amount of membrane fragments were spread over a wide area, whereas the cell wall fragments were observed to scatter after the explosive cell lysis (Fig. 2G). As EVs consisting of the membrane were often observed within these cel l debris, the secreted membrane fragments appeared to form EVs rapidly, similar to the formation in gram-negative bacteria. EV formation after cell lysis was also observed i n the TEM images (Fig. 2H).Interestingly, enterotoxin B exhibited higher labeling rate for EVs produced by explosive cell lysis, in contrast to the protein A and WGA patterns (Fig. 2I ). This suggests that enterotoxin B can be transferred to EVs with membrane Fig.2 Mul ti -co l or STORM i m age s f or t he var i ous com p os i t i ons of EVs i n gr am-p osit i ve bacter i a. A Re p resentative mul t i-colo r STORM images of S. aureus wit h ou t E Vs (top) and with E Vs (bottom ). R ed: WGA, protein A, or entero t ox in B. Gree n : N ile red. B Tr ansve r se prof i les of locali z ations corresp o nding to regions boxed in whi te in (A). G r een bars: Local i zat i on frequency measu r ed f rom t h e STORM i m age of Ni l e red. Red ba r s:L ocal i zatio n freq u ency meas u red fr om the STORM i m a ge of WGA, protein A, or ente r ot o xin B. C Po p ul a tio n rat i o of EVs di s playi n g one color (N i le re d only) or two colors (N ile red and WGA/ protein A/ente r o t oxi n B) meas u red f r om t he EVs on the b a cteria l sur f ace (me a n ±SD;n =~30).D Compa r ison of average d loc a lization densit y of WGA, p ro t ein A, a n d enterotoxin B of EV-p rod u c in g S. aureus . E R e p resentative correlati v e multi-color STORM a n d S E M i mages o f S. aureus wit h EV prec u rsor s or f inalized EVs . F Re p rese n tat i ve T EM im a g e o f S . aureus wi t h E V precursors or f in ali zed EVs.G Represen t at i ve mu l t i -co l o r STORM i m ages of S . aureus wi t h EVs p r oduced after t he explos i ve cell lysis eve n t . Red: WGA, p r ote i n A, or entero t oxi n B.Green: Ni l e red . H Represe n tative T EM i m age o f S. a ureus with p rod u ced E Vs after the ex p losive cell l ysis event . I P opul a tion ratio of EVs displaying one color (N i le r ed only) or two co l ors (N i le r ed and WGA/ pro t ein A/e n terotoxin B) me a sured from the STORM imag e s of the rele a sed EVs after t h e explosi v e cell lysis event (n =~20). Wh i te a rr ows: obse r ved E Vs. Scale ba r s: 1 u m in A, E, and G and 500 n m in F a n d H fragments as a major virulence factor after the explosive cell lysis event. Collectively, these findings highlight the variety of EV compositions produced by different mecha-nisms, as observed i n the multi-color STORM images. EV biogenesis mechanisms for gram-positive bacteria Based on the observation and measurement of EVs in multi-color STORM and TEM images, EV biogenesis in gram-positive bacteria appeared to occur either through membrane blebbing or explosive cell lysis, similar to the occurrence in gram-negative bacteria (Fig. 3A). Membrane blebbing was observed in the STORM images of Nile red-stained EVs (Fig. 3B, Additional f ile 1:Fig. S11). Interestingly, a vacuole-l ike structure com-posed of a high-density l ipid was often observed in Nile red i mages immediately below the budding site inside the cytoplasmic membrane, most likely acting as a read-ily available membrane source (Fig. 2A,B). Such a vacuole generation has been reported to frequently occur dur-ing the bacterial cel l enlargement inside the cytoplasm of gram-positive bacteria [31]. Then, the blebs seemed to first remain between the cytoplasmic membrane and peptidoglycan l ayer as EV precursors after being pinched off from the plasma membrane, in contrast to previously suggested EV biogenesis models for gram-positive and gram-negative bacteria. In previous studies, the cytoplas-mic membrane has been described to extrude through the hole in the peptidoglycan l ayer for EV generation in gram-positive bacteria without the precursor state, based on the observation of membrane blebbing after lysin treatment [32]. In contrast, these extruding membrane bubbles were not observed through the thick peptidogly-can layer i n our STORM and TEM images. Instead, many membrane vesicles remained in the IWZ, which is the region between the cytoplasmic membrane and the pep-tidoglycan layer, after being pinched off from the cyto-plasmic membrane. Such membrane vesicles were not observed in the SEM images of correlative STORM and SEM i maging as shown in Fig. 1E because they were still encapsulated inside the peptidoglycan layer. This discrep-ancy between previously reported observations and the observations in this study is most likely due to the differ-ent cell wall conditions arising from the lysin treatment used in the previous study. Removal of the outer cell wall zone upon lysin treatment in the previous study allowed the membrane bleb to extrude easily through the pepti-doglycan layer. In contrast, the native bacteria without lysin treatment in the present study seemed to have a rel -atively thicker peptidoglycan layer as a barrier, prevent-ing membrane bleb from extruding before being pinched off from the membrane. The EV precursors located in the IWZ appeared to wait for the degradation of the pepti-doglycan layer. The IWZ is composed mostly of soluble low-density constituents, allowing vesicles to expand within it [33]. We found that most of the EV precursors were released after local cell wall lysis (mechanism 1),whereas a few of them were released by being encapsu-lated by the remaining peptidoglycan layer (mechanism 2) (Fig. 3B,C). Since the latter is occasionally observed (~11% f rom STORM images), this mechanism may have been difficult to observe in previous studies. Because these two mechanisms appear to i nvolve the cell wall lysis step, the cell wall contrast near the EV-releasing area was analyzed in the STORM and TEM images. As shown in Fig. 3D, local cell wall degradation was observed near the EV-locating area for mechanisms 1 and 2 in both the STORM and TEM images. Although cel l wall density was slightly higher at the budding site in mechanism 2, the surrounding cell wall appeared to degrade to aid in the release of EV from the cell wal l via this mechanism. EV biogenesis through explosive cell lysis has also been frequently observed in multi-color STORM images (mechanism 3). In relation to this mechanism, expanded IWZ was observed in the corresponding TEM images,most l ikely due to the increased osmotic pressure in this zone (Fig. 3B, Additional file 1: Fig. S12). The turgor pres-sure exerted from this zone pushes the cell wall, result-ing in low-curvature blebbing of the peptidoglycan layer.At this point, the turgor pressure exerted from i nside the membrane appeared to be larger than the osmotic pres-sure in the IWZ, resulting in the bending of the pepti-doglycan layer instead of the cytoplasmic membrane at the budding site. When we analyzed the density (con-trast) and curvature of the cell wall at this budding site,relatively higher contrast and a lower curvature of the cell wall were observed in mechanism 3 compared to mecha-nisms 1 and 2, implying that less cell wall lysis occurred in mechanism 3 by allowing the expansion of the IWZ (Fig. 3E). This expanded IWZ ult i mately ruptured due to cell wall damage and increased turgor pressure, as observed in the STORM and TEM images. During this explosive cell lysis, the formation of multiple EVs was observed in both the STORM and TEM images. EVs in this mechanism seemed to be composed of a membrane without the peptidoglycan layer as shown in Fig. 2I ,although cell wall fragments were also secreted during the cell lysis process. This suggests that the amount of cell wal l fragments released by explosive cel l lysis i s insuf-ficient for forming the peptidoglycan layer for EVs since the cell wall was already degraded prior to the explosive cell lysis event. Interestingly, we also found that the EVs produced after cell lysis process were hardly observed from SEM images because they were covered by the released cell debris during explosive cel l lysis (Additional file 1: Fig. S13). Although the EVs produced by mecha-nism 3 were not directly observed from the SEM images, Fig.3 Proposed EV biogenesis mec h anisms in gram-posit i ve bacter i a. A P r o posed models for EV b iogenes i s in gra m -posi t ive bacteria. B, C Re p rese n t a t i ve (B) mu lt i -col o r S T ORM a n d (C) T E M images of S. aureus wit h EVs f or each mec h anis m . Red : WGA. Gr e en: Nile red . Yellow arrow:expa n d e d I WZ. D Compariso n o f th e c e ll wall density for e a c h mech a n i sm obs er v e d fr om STORM images. Averaged loc a lizat i on n umber in t h e c e l l wall was m e a sured a s the cell wall density from STORM image s. E R elations h ip between the cont r as t and the curvature o f the cell wall mea s ured from T E M images.T he f i tt ing l in e obtained by the ex p o n entia l function s h ows an inverse r elatio n . F P opulation ratio of S. aureus p rod u ci n g E Vs by eac h mechanis m observed from multi-c ol or STORM and TEM i m a g es (m ean±SD;n =~1000 from S T ORM i mages , n =~80 from T EM image s ).G Co mp arison of t h e di a meter of EVs produce d by each m ec h a n ism o b served f ro m STORM and TEM im ages (m ean±SD;n=~30). W h ite arrows : o b serve d EVs . S ca le bars: 1 um in B and 200 nm in C the spherical membrane vesicles observed after explosive cell lysis in STORM i mages are highly likely to be rea l EVs as EVs produced after explosive cell lysis were frequently observed not only from gram-negative bacteria in previ-ous studies, but also from our TEM i mages. This suggests that our STORM imaging method can be a better tool for observing EVs produced by explosive cell lysis than SEM imaging. Among these, mechanisms 1 and 3 were found to be the major mechanisms for EV biogenesis in gram-positive bacteria (Fig.. 3F). Although mechanism2occurred rarely, the EVs produced by this mechanism were observed in both the STORM and TEM images. As expected, the EVs produced by mechanism 2 were l arger than those produced by mechanism 1 (Fig.3G). Interest-ingly, the EVs produced by mechanism 3 also exhibited a relatively larger size than those produced by mecha-nism 1. This could be due to the growth of EV precur-sors within the IWZ in mechanism 1 being limited by the width of the expanded IWZ. In contrast, the growth vol-ume for EV production is not l imited during the explo-sive cell l ysis i n mechanism 3, as the EVs are formed after secretion from the IWZ region. Therefore, we could con-firm that the size heterogeneity of EVs is resulted from various EV biogenesis mechanisms in gram-positive bacteria, as expected. Collectively, various EV biogenesis mechanisms in gram-positive bacteria could be investi-gated by using the multi-color STORM images. Discussion We used multi-color STORM and correlative super-res-olution microscopy to elucidate EV biogenesis in gram-positive bacteria by resolving the ultrastructure of EVs produced during their formation processes. This has not been previously investigated in-depth compared to the investigation of gram-negative bacteria. Although gram-negative bacteria have dif f erent cell wall structures, we observed similar EV generation mechanisms in gram-positive bacter i a, including membrane blebbing and explosive cell lysis. Membrane blebbing was frequently observed in S.aureus and S. epidermidis in the corresponding STORM images, which was not previously resolved i n diffrac t ion-limited optical i mages. This mechanism resembled outer membrane blebbing during the EV biogenesis observed in gram-negative bacteria. However, the different struc-tures of their outer layers affected the detai l ed process of EV production via membrane blebbing. For example, cell wall degradation is not a prerequisite in gram-negative bacteria because EVs are produced through outer mem-brane blebbing. Instead of cell wall degradation, EV pro-duction requires structural changes in the cell envelope,such as a decrease in cross-linking proteins between the outer membrane and peptidoglycan layer or the interca-lation of molecules in the membrane at specific regions of the cell envelope [29]. In contrast, i n this study, gram-positive bacteria were found to require a cell wall degra-dation process to release EV via the membrane blebbing mechanism due to the thickness of the peptidoglycan layer as the outermost layer. Degradation of the cell wall was observed before EV release by imaging WGA and protein A at the nanoscale level. As a result of the cell wall degradation experienced by the bacteria in the divi-sion phase, a higher rate of EV production was observed.Another dist i nct phenomenon during EV biogenesis in the membrane blebbing mechanism of gram-positive bacteria was the EV precursor located in the IWZ, which has not been previously observed in gram-negative bac-teria. The bacteria were expected to grow further in the IWZ because it is composed of soft materials, which allow EV precursors to expand within it . Once the cell wall was ready post-cell wall degradation, EV precur-sors appeared to be released either through the pores (mechanism 1) or via cell wall blebbing (mechanism 2),depending on the condition of the cell wall. During this process, we suspect that cell wall-modifying enzymes may degrade the cell wall, increasing the cell wall pore size, as demonstrated in previous studies [2]. Although the increased pore size in the cell wall would facilitate the EV release (mechanism 1), the EV precursors were occasiona l ly found to be released via cell wall blebbing (mechanism 2). After the degradation of the cell wall, the loosened peptidoglycan layer may be easily blebbed by the forces exerted by the EV precursors, resulting in the encapsulation of the EV precursors by the peptidoglycan layer during the process of EV release. Thus, double layers of EVs consisting of the cytoplasmic membrane and pep-tidoglycan layer were observed, which, to the best of our knowledge, has not been reported to date (mechanism 2).Although this mechanism (mechanism 2) rarely occurs,the EVs produced by this mechanism are expected to play a distinct role compared with those produced by other mechanisms because they have an additional pep-tidoglycan layer . For example, the peptidoglycan layer in EVs produced by mechanism 2 may prevent osmotic lysis of EVs, similar to its role as a physical barrier to bac-teria. Because EVs consist i ng only of a membrane layer would experience the net flow of free water into the EVs due to the concentrated proteins, molecules, polysaccha-rides, and other factors inside the EVs, they would easily explode by this osmotic pressure without a strong pepti-doglycan layer. Another possibility is that EVs transport essential cell wal l -associated components through the peptidoglycan layer. Mechanisms 1 and 2 may be regu-lated by the cell wall condition, most l ikely resulting from the cell wal l -modifying enzyme. EV formation through explosive cell lysis has also been frequently observed in gram-positive bacteria, similar to that in gram-negative bacteria. Before the explosion, an expanded IWZ was first observed, most l ikely due to the increased osmotic pressure through the degraded porous cell wall. The blowing region in the IWZ f inally exploded,perhaps in response to external stress, secreting various proteins, such as membrane fragments, cell wal l frag-ments, and virulence factors. During secretion, multiple EVs could be formed from membrane fragments with a relatively larger size than the EVs produced by mecha-nism 1, most likely due to the absence of external force from the environment. Although this process in gram-positive bacteria appears similar to the explosive cell lysis in gram-negative bacteria, the outer-inner membrane vesicles, a form of EVs produced by gram-negative bac-teria, were not observed i n the gram-positive bacteria in this study. This is most l ikely due to the single layer of the cytoplasmic membrane in gram-positive bacteria. Fur-thermore, EV produced through mechanism 3 contained enterotoxin B as a virulence factor. Conclusions Our findings highlight the diverse mechanisms for EV biogenesis in gram-positive bacteria, which have been overlooked in previous studies. Based on our nanoscale observations using various super-resolution microscopy techniques, we propose three major mechanisms of EV biogenesis through membrane blebbing (mechanisms 1and 2) and explosive cell lysis (mechanism 3), which are similar to the mechanisms observed in gram-negative bacteria, albeit with some notable differences. These techniques shed light on the molecular mechanisms of EV biogenesis by i maging other EV constituents, such as genes, virulence factors, and cellular metabolites. Fur-thermore, the l ive-cell super-resolution imaging of EV biogenesis in gram-positive bacter i a as a future work is useful for visualizing EV formation in gram-positive bac-teria in real time , which will be needed to confirm the models proposed i n this study. Overall, a better under-standing of the molecular mechanisms of EV production in gram-positive bacteria will facilitate the development of therapeutics and biomedicine, including vaccines. Methods Sample preparation for fluorescence imaging S. aureus (ATCC 12600) and S. epidermidis (ATCC 14790) were streaked from glycerol stocks onto tryp-tic soy agar (TSA) plates and grown overnight at 37℃.Then, a single colony was picked from a TSA plate and inoculated i n tryptic soy broth (TSB) medium in a shak-ing incubator at 37℃ and 200 rpm for 16 h. After inocu-lation, the fermented broth was centrifuged at 12,000 rpm for 2 min, and the supernatant was removed. The resulting pellet was resuspended in Dulbecco's phos-phate-buffered saline (DPBS) and fixed with 4% (v/v)paraformaldehyde (PFA; 15714; Electron Microscopy Sciences) i n DPBS for 15 min at room temperature (RT).The fixed cells were then washed with DPBS and resus-pended in freshly prepared 0.2% NaBH for 2 min at RT to reduce unreacted aldehyde groups. Finally, the sam-ples were washed again with DPBS before centrifuging and l abeling with fluorophores. The purified EVs were obtained from R&D Center of LG H&H. To purify EVs from S. aureus (or S. epidermidis), EVs were isolated from cultured S. aureus (or S. epidermidis). They were then purified by ultracentrifugation at 10,000g for 30 min and 150,000g for 2.5 h (Hitachi, Chiyoda-ku, Tokyo, Japan).After ultracentrifugation, EV-rich pellets were diluted in distilled water to a final volume of 100 mL. The resus-pended EV solution was further filtered with a 0.22 um bottle-top filter, and the filtered EV solution was stored at 4C. Purified EVs were confirmed by nanoparticle track-ing analysis (NTA; Zetaview, Part i cle metrix, Germany),which is commonly used for EV identification. For exam-ple, the average diameter of purified EVs from S. aureus with a concentration of 3.0×10°particles/mL was meas-ured as 164.4 nm using NTA, which is consistent with the reported range for EVs f rom S. aureus (145 ±15nm)[34]. Also, the averaged diameter of the purified EVs from S. epidermidis with a concentration of 2.8×10°particles/mL was measured as 206.8 nm from NTA, which is con-sistent with the reported range for the EVs from S. epi-dermidis (172 ±17 nm)[34]. For Nile red dye labeling, pelleted bacteria were first diluted in DPBS and attached to a poly-L-l ysine (PLL)-coated glass-bottom dish for 1 h at RT. After washing twice with DPBS, the cells were incubated in 10 nM Nile red membrane dye (415711000; Acros Organics) in DPBS for 30 min, followed by STORM imaging [35]. The Nile red-stained S. aureus prepared in bovine serum albumin (BSA)-treated coverslip also showed EVs similar to those in the sample prepared without BSA treatment, implying that the observed EVs does not result from the non-spe-cific binding (Additional f ile 1: Fig. S14). Alexa Fluor 647-conjugated WGA (WGA-AF647,W32466; Invitrogen) was used to visualize the cell wall.The centrifuged cells were incubated in WGA-AF647 for 60 min at RT, followed by a brief wash with DPBS. After removing the supernatant, the cells were diluted in DPBS and incubated in a PLL-coated glass-bottom dish for 1h . Then, the dish was briefly washed twice in DPBS and imaged in imaging buffer for STORM, which was pre-pared with 100 mM cysteamine (30070; Sigma-Aldrich),5% glucose (w/v), and oxygen-scavenging enzymes (0.5mg/mL glucose oxidase [G2133; Sigma-Aldrich] and 38 ug/mL catalase [C3515; Sigma-Aldrich] in DPBS at pH 8.5). For immunolabeling, the centrifuged cells were per-meabilized in 0.2% Triton X-100 at RT for 20 min. After permeabilization, the pellet was incubated in a blocking buffer (3% [w/v] bovine serum albumin (BSA) in DPBS)for 30 min. The blocked cells were stained with the pri-mary antibody in blocking buffer for 60 min at RT. Two types of S. aureus antibodies were used to detect enter-otoxin B and protein A: PA1-7246 (Invitrogen) and ab20920 (Abcam), respectively. After washing twice with DPBS, the samples were labeled with Alexa Fluor 647-conjugated secondary antibody (A31573; Invitrogen)for 60 min at RT and then post-f ixed with 2% PFA and 0.05% GA in DPBS for 10 min at RT. Finally, the bacte-rial cells were attached to a PLL-coated glass-bottom dish and i ncubated for 1 h, followed by a brief wash with DPBS. The samples were either stored in DPBS at 4℃ or suspended in the STORM imaging buffer i f they were to be immediatel y imaged. For multi-color imaging of the peptidoglycan layer and cytoplasmic membrane using WGA-AF647/anti-protein A/anti-enterotoxin B and Nile red, the samples were first prepared as described for the procedure of WGA-AF647label i ng or i mmunolabel i ng of protein A/enterotoxin B.Next, the cells were attached to the PLL-coated gridded coverslip (P35G-1.5-14-CGRD-D; Mattek) for 1 h for STORM imaging. After the STORM imaging of WGA/protein A/enterotoxin B, the samples were washed twice with DPBS, incubated in 10 nM Nile Red solution in DPBS for 30 min, and imaged using STORM. STORM imaging STORM imaging was performed using a custom-built inverted microscope (Ti2-U; Nikon) by adapting total internal reflection f luorescence illumination to reduce the background signal [36]. The sample was illumi-nated using an excitation laser with wavelengths of 561nm (100 mW, OBIS; Coherent) and 647 nm (120 mW,OBIS; Coherent) through a ×100 oil immersion objec-tive lens (1.49 NA; Olympus). Irradiation using a 405-nm (0.2-0.5 mW, OBIS; Coherent) laser was used for reactivation if needed. The fluorescence emission from the sample was filtered using a bandpass emission fil-ter (LF 408/488/561/635-B; Semrock) and imaged using an EMCCD camera (iXon Ultra 888; Andor). A total of 50,000 frames were usually acquired at a frame rate of 60-100 Hz. 3D images were obtained by introducing a cylindrical lens into the image-detection pathway for astigmatism. For mult i -color imaging of Nile red and WGA-AF647/enterotoxin B/protein A, the red channel of the sample was imaged first by i l lumination with a 647-nm laser, and then the green channel of the sample for the same area was imaged by exc i tation with a 561-nm laser. Before imaging the sample, beads in the same region of inter-est were i maged in 647 and 561 channels to map differ-ent color channels. Then, WGA in the samples was first imaged with an excitation l aser of 647 nm using a band-pass emission f i l ter (LF 408/488/561/635-B; Semrock) to image the cell wall. Nile red images were then obtained with an excitation laser of 561 nm using a long pass f ilter (BLP02-561R-25) and a dichroic mirror (Di03-R561-t1-25x36). The gridded cover glass was used to obtain the same sample area. The STORM images were reconstructed by fitting the point spread functions in each frame with a Gaussian function to determine their centroid positions. These collected centroids were drift-corrected and rendered using several parameters for the final STORM image. For multi-color i mages, the images from two color channels of the same sample area were correlated using custom-written MATLAB code [13]. EM imaging For SEM imaging, bacterial samples cultured in TSB were centrifuged at 12,000 rpm for 2 min, followed by resus-pension in DPBS. The samples were then pelleted and fixed in 2.5% glutaraldehyde (GA) in DPBS overnight at 4C. After washing, the fixed bacterial samples were spot-ted on silicon wafers. When the wafer was completely dried, the sample was dehydrated using a graded ethanol series (30%, 50%,70%,80%,90%, and 100% v/v) diluted in distilled water for 20 min twice in each step. The dehy-drated samples were dried overnight and coated with platinum prior to imaging. SEM images were obtained using an S-4800 field emission scanning electron micro-scope (Zeiss) at 15 keV. For correlative STORM and SEM imaging, samples were prepared for each fluorescence imaging step and then imaged using STORM. After STORM imaging, the samples were washed thrice with distilled water. The washed samples were prepared for SEM imaging, as described above. The cover glass attached to the dish was separated from the dish by removing the adhesive with ethanol. The cover glass was then coated with platinum before the SEM imaging. The same area in the sample shown in the STORM images was i dent i fied i n the SEM setup by f inding the position marked with a diamond pen on the glass-bottom dish. The correlative STORM and SEM images were overlaid based on the features visual-ized in each image. For TEM imaging, the bacterial sample grown in the TSB medium was centrifuged at 12,000 rpm for 2 min and then briefly washed with DPBS. After centrifuga-tion, pelleted samples were f ixed with 2.5% GA overnight at 4℃. After washing thrice with cacodylate buffer, the samples were post-f ixed with 1% osmium tetroxide in 0.1M cacodylate buffer for 60 min on ice. The samples were then washed twice with cacodylate buffer and dehydrated using a graded ethanol series. Fully dehydrated samples were i nfil t rated with Epon 812 resin using propylene oxide and embedded in 100% Epon 812 resin. Using an EM UC7 ultramicrotome (Leica, Austria), 60-nm thin ultrathin sections were obtained and collected on 100mesh copper grids. Final l y, the ultrathin sections were stained with uranyl acetate and lead citrate and imaged at 120 kV using the KBSI Bio-HVEM System (JEM-1400Plus; JEOL, Tokyo, Japan). Image quanti f ication Quant i fication of EVs in EM images was performed using the ImageJ software. The diameter of individual EVs was measured from SEM and TEM images by using the “Straight” tool in ImageJ. The size of each EV was considered to be the average of the longest and short-est measured diameters. First , for comparison of the cell wall density for each mechanism shown in Fig. 3D, each EV observed from the multi-color STORM images was classified into different mechanisms based on the cri-teria described in the next section. The cell wal l density was measured based on the relative distance from the center of each blebbing EV. The histogram generated from multiple EVs was fitted using one or multi-Gaussian functions for each mechanism to compare the cell wall density near the EV released site. For bacteria without EVs, the cell wall density was measured by counting the number of localized molecules along the cell wall f rom random positions. The histogram generated from multi-ple positions was then fitted with a multipeak curve. Next, for the graph of the contrast and curvature of the cell wall shown i n Fig. 3E, each EV observed from the TEM images was classified into different mechanisms based on the criteria described in the next section. The contrast and curvature of the cell wall were then meas-ured at the EV budding site from the TEM images.The curvature measurement was performed using the Kappa curvature analysis plugin in ImageJ. By defining the points of the EV budding site along the cell wall, the corresponding B-spline curve was constructed using a point distance minimization algorithm. The curvature of this fitted line is defined as the curvature of the cell wall. Next, the contrast was obtained by subtracting the averaged grayscale value of the background near the cell wall from the average grayscale value of the cell wall. The curvature and contrast of each EV were measured at the same position. The scatter plot of the contrast and curva-ture of the cel l wall for each EV biogenesis event shows the reverse relationship of the contrast and curvature of the EVs produced by mechanism 1 (relatively lower con-trast and a higher curvature) and mechanism 3 (relatively higher contrast and lower curvature). A single-molecule localization histogram was used to quantify EVs in the STORM images. The transverse prof i le of cell wall den-sity near the EV budding site was generated using a sin-gle-molecule localization histogram. The diameter of the EVs shown in the STORM images was measured from the full width at half maximum (FWHM) of the single-molecule localization histogram for each EV. To categorize the EV biogenesis mechanisms from STORM images, multi-color STORM images were used to categorize the cells into each mechanism. Cells that showed local cell wall lysis at the EV budding site were categorized as mechanism 1. If the released EV was sur-rounded by the remaining peptidoglycan layer (labeled with WGA, anti-protein A, or anti-enterotoxin B), i t was classified as mechanism 2. When the released EVs near bacteria were observed within the fragments of the cell membrane and cell wall derived f rom explosive cell lysis,they were classified as mechanism 3. The remaining cell membrane at the explosion site is relatively weaker, with low localization density for cells categorized as mecha-nism 3 compared to the cells categorized as mechanisms l and 2. To categorize the EV biogenesis mechanisms from SEM images, the samples were categorized i nto each mecha-nism depending on correlative i mages with STORM to determine whether the cel l wall or the cell membrane was labeled. If the EVs shown on the exterior of the SEM images were labeled only with the cell membrane in the STORM i mages, we categorized them as mechanism 1.In contrast, i f they were l abeled with both the cell mem-brane and cell wall i n the STORM i mages, we c l assified them as mechanism 2. When EVs were observed together with fragments of the cell membrane and cell wal l , and the low membrane density at the explosion site in both the SEM and STORM images, the EV was classified as mechanism 3. For TEM i mages, the samples were categorized j ust by TEM images; the cell membrane and cell wall were clearly distinguishable in the TEM images. Bacteria that had EV blebbing through the cell membrane with high curvature and did not have the peptidoglycan layer were categorized i nto mechanism 1. When the budding EV is encapsulated by the cell wall, it i s classi f ied as mechanism 2. If EVs were found with debris of the cel l membrane and cell wall resulting from explosive cell lysis, they were categorized into mechanism 3. Abbreviations LM: Lig ht mi cr osc o py; E M: E l ec t r o n mi cro s c op y; S E M: Sc a nn in g e l ec t r o n microscopy; T EM: Transmiss io n ele ct r o n m ic roscopy;WGA: W h eat ge r m ag glu -tin i n; IWZ: In ne r wa ll zone; T SA: Tryptic soy a g ar;T SB: T ryptic soy br o th; DPBS:Dul b ecco's pho spha te-bu ffe r ed s al ine; PF A: Par afor mal d ehy d e; GA : Gluta r alde-hyde; PL L : Poly-L-ly sin e . Supplementary Information The onl i ne ve rsi on c onta ins su ppl em e nt ar y m a te ri a l ava i la ble at ht tp s://d oi .org/10.1186/s 12915-022-01472-3. Additional file 1. C om bi ned PD F of S u ppl e mental fig u r es S1 -S14.Figure S1.The r esolution evalua t ion of STO RM i m a ging. Figure S2. Repre-s e nta t i ve mul ti -c o lor STORM image s of S . aur eus. Figure S3.Ob s er va ti on of EVs st ai ned wi t h v ar i ou s mem bra ne dyes. Figure S4. P u r if ied EVs fr o m S. aureus and S. epide r m i dis.Figure S5. Sup er-res o l u tion i m ages of EVs f r o m S . epi d ermi d i s .Figure S6. The d i am e ter dis tr ibutio n of E Vs . Figure S7.S T ORM and SEM imag es o f EVs s hown i n Fig. 1E . Figure S8. R e pre s ent a t i ve s u per -r e s olutio n images and product i on r ate of extracellular vesic l es (EVs)and E V p r ec u rsors from gra m -posit iv e bacteria u nde r di f fer e nt cond it ions.Figure S9. S T ORM i m a ges i n green and red channels of S . aureus in F i g . 1A Figure S10. STORM and S E M i mage s o f S . aureu s i n Fig . 2E . Figure S11.S T ORM ima ges in green and red channels of S. a ur eus wit h produced EVs af ter the expl o s iv e cel l ly sis eve nt fo r t he ove r l a y images show n in Fi g.2G.Figure S12. STORM ima g e s in g ree n an d red channe ls of S . a ureus with E V s for each me chanis m shown in F ig. 3B . Figure S13. Repres e nt a t i ve cor-relat i ve STO R M and SEM i m a g e s of S . au r eus wit h EVs pr oduced b y eac h mec han ism.Figure S14. Su p er -r e solution ima g es of S . aureus -secret i ng EVs prepared on cover sl ip s wi t h and w it hout BS A t rea t me nt. Additional file 2: Movie 1. 3D S T ORM image of Ni l e red-labeled S. aureus witho u t EVs. Additional file 3: Movie 2. 3D STORM image of Ni l e red-labeled 5. aureus with EVs . Acknowledgements The au thors wo uld li k e t o than k U i d o n J eong, H y u nbu m Par k , and H yung Jun L im for d is cus s i on. Authors'contributions D.J. part ici pated in al l experi m ent a l wor k ,analyzed d a t a, a nd c ont r i but ed t o bot h a rt w o r k de s ign a nd manusc ri pt wr i t i ng; M.J.K. pe rfor med the STORM imaging an d image quant i ficatio n; Y.P. a nd J .C . contri but ed t o wor k rel at ed t o the b acter i al c ultu re; H-S.K. perfor m ed t he TEM imaging ; D .K., N -G .K., and S .J .H.ini t i at ed the i dea o f the wor k ; S .H.Y. and B.K .H. cont r ibuted t o work r el a ted to the b acter i al sample prepar a t io n; D .J., M.J .K ., and D.K. wr o te, reviewed,a nd edited t he paper ; D.K. supervised, c oncei v ed t he wo r k, des i gned the r ese a rc h s t u d i e s, w r ot e original d ra f t, and p erfo r med the fi na l e diting of pap e r; all a u t hor s rev i ewed and a pproved t he paper . Funding Th is study was s u pport e d by the Fut ur e Cosmet i cs R esearc h S u pport Program thro u gh the L G H &H Future C o s me t i c s S u ppor t Fou n da ti on (L G FCS F ) f u nde d by LG H &H and the Ko r e a Ba s ic Science Ins t i tute u nde r t he R&D progr a m (Pr oj ect No. C230430) supe r v i sed by the Min i s t ry of Science and I CT. Availability of data and materials The da t a t h a t s u ppo rt s t he f i ndi n g s of t h is stu d y are avail abl e in the s upple m enta r y m a teri al o f this a rt icle. Declarations Ethics approval and consent to participate Not a ppli ca ble. Consent for publication Not a ppli ca ble. Competing interests The autho r s de cl a r e t he foll o wi n g co m p eting f inancial i nt e r est : D.K i m ,D.J eong ,MJ.Kim, N -G.K ang,S.J .Hw a ng, S .H.Y o un and B.K.Hwang have applied for a patent on the technology, as si gned to H anyang U ni v ersi t y and LG H&H (KR 10-2022-0141495). Author details Depa r tme nt o f C h emi s try, H anyang U n iv ersity, Seoul 04763,Repub-l i c of K o rea. E l ec t r o n Mic r osc o py R e search Ce nter, K o rea B a sic Sc i en c e Institute, C he ong j u 28119, Republ i c of Ko r ea.R&D Cente r, L G H&H Co., Ltd ,S eo ul 07795, R e pu blic o f Kore a. Rese a rch Instit ut e for C onverg e nce of B a s i c Sc ie nce, H anyang U niversity , Seoul 04763, Republ i c of Ko r ea.SI nstitute of Nano Sc i e nc e a nd Te c hnology , H an y a ng U n ive rsi t y, Se o u l 04763, R e pu blic of Kore a. Research Instit ut e f or N a tural Sc i e nc es , Hany a ng U niversi t y,S eou l 04763,R e pu blic of Kore a. Received: 16 June 2022 Accepted: 21 November 2022 Published online: 05 December 2022 References 1. De a t he r a ge BL,C o okson BT. Mem bra ne ve s ic l e release in b ac t er ia ,eu k aryotes,a nd a rchaea: a co n served y et unde r appre c i a ted aspect o f micro bi a l l i fe. Infect Immu n. 2012;80:1948-57. 2. Brown L , Wolf J M , P rados-Ros a le s R , C asad ev a l l A. T h rough t he wal l: ext rac ell u la r vesicle s in Gr a m-p os i t ive b acter ia , my c obacter ia and fu ng i .Nat Rev Microbiol. 2015;13:620-30 3 Bishop D, Work E . An extrac ell ular glycol i pid prod u c e d by Escherich ia coli g row n under l y s i ne-limi t ing condi t io ns . Bi o c h em J . 1965;96:567. 4 Knox K, Ve sk M , Wo r k E . R el a ti on be t wee n exc r eted li popo l y sa cc hari de comp l exes a nd su rfa ce st r uctures of a lysine-l im it ed c u lt ur e o f E scheri -chia co l i . J B ac ter iol Res. 1966;92:1206-17. 5. Toyofuk u M , Nom u ra N , E b e rl L . T ypes a nd or ig ins of b ac t eri a l membr a ne ve si c l es . N a t Rev Micr obi ol. 2019;17:13-24. 6 Man n ing AJ, Kueh n M J . Cont r ibutio n o f b ac t erial outer membran e vesi -cl es to i nnate bact e r i a l d e fense. B MC M i crobio l. 2011;11:1-15. 7 Biller S J , Sch u bot z F, Roggensac k S E, Thompson AW, Summons RE, Chishol m SW. B a cteri a l ves i cles in mari ne e c o s y s te m s. Sc i ence.2014;343:183-6. 8. Gujrati V, Kim S, Kim S, Min Jj, Choy HE, K i m SC , e t al. Bi o e ngineered bacteri al o u t er mem b rane vesicles as cell-s pec i fic d r u g-d el i very veh i c l es for c a ncer therapy. AC S Nano. 2014;8:1525-37. 9 Kapara ki s -L ias k os M, Ferrer o R L. Immu ne mod u lat i on b y b acter i al outer memb r an e vesicl e s. Na t R e v Immu no l. 2015;15:375-87. 10.. va n d er Pol L , Stor k M , van d e r L ey P. Outer mem bra ne vesicle s a s p la t-for m v ac cine t echnology. B io t ec h nol J . 2015;10:1689-706. 11.Toyofuk u M, Carc a mo -Oy a rce G,Ya mamoto T, Eise n stein F , H siao C, Ku r o -sawa M , e t al . P r opha g e-trigger e d membrane vesicle for ma t ion t h roug h pept id og l yca n d a m a g e in B ac i l lu s su b tilis. Nat Commu n. 2017;8:1-10. 12.Brown L , Ke ssl er A, C ab eza s -S a nc h e z P, Luq u e-Garci a JL,Cas adev a ll A. Ex t racellu l ar ves i c l es produced by the G ram -posit i ve bacter i um B a cillus su b tilis a r e d i srupted by t he li p opept i d e su r f a ctin. Mo l Micro bi ol .2014;93:183-98. 13.Chung J , Jeong D, Kim G, Go S, S ong J , Moon E , e t a l . Supe r -res olu t i on imag in g o f platele t-a c t ivatio n process a nd it s quantitative a na l ysis. Sci Rep.2021;11:1-18. 14.G o S, Jeong D ,C h ung J , K im G, S ong J , Moon E , e t al . S upe r -reso lu t i on imagi n g r e veal s c ytoske l e t on-de p ende nt or ganelle r ea rr a ngement wit h in platelets at i n t e r mediate stages of ma t u r at i on. Struc t u r e.2021;29:810-22. 15.Jeong D , K im D . Recen t deve l opments i n cor r el a tive su pe r -r esol ut ion f l u -orescence mic r o sco py a nd ele ct r on micr os copy. Mol Cell . 2022;45:41-50. 16.H e l l SW, Wichmann J. Breaking the d i ffract i on r eso lut ion limi t b y stimu -la t ed e missi on: s t imula t ed -e mission-de pl e t ion flu o r e sc ence microscopy.Opt Let t. 1994;19:780-2. 17. Bet z ig E, Patter s o n G H , Sougra t R, Lindwa s ser OW, Ole nyc h S, Boni fa c i no JS, et al . Imaging int r ac e ll u lar f l uorescent pr otei n s a t na no meter reso l u -t i on. Sc i enc e . 2006;313:1642-5. 18.Rust M J , B a tes M, Zhu a n g X. S ub-di ff rac t ion-limit ima g i n g by stochasti c opti ca l reconstruc t ion mic r os c opy (STORM). Nat Methods . 2006;3:793-6. 19.J eong D, K i m D. Su p er-re so luti o n f luo r escence mi crosc op y-ba s ed si ng l e-molecu l e spect r os co py. Bull K o r ean Chem Soc. 2022;43:316-27. 20.B u r ton E,Yaka nda wa la N ,LoVe t ri K, Madhyastha M. A micropl at e spec -trofluorometr i c ass a y for b ac t e r ial biofilms.J I nd M i c r obio l B io t ec h no l.2007;34:1-4. 21. K ehoe MA. Cell -wal l-asso ci a t ed proteins in Gram-pos i tive b ac t e r ia. In:New Compr e hensive B i ochemist r y: Els e vier; 1994. p. 217-61. 22. Merino N,T oledo-A r ana A , Ve r gara-Ir ig aray M, Va l leJ, Solano C , Calv o E,et al . P r ot e i n A-mediate d m u lt i cellu l ar behavior i n St a phyloc o ccus aureus.J Bacteriol R es. 2009;191:832-43 23.D a nie l s en EM, Ha nse n G H ,Karlsdotti r E . Stap h ylococcus au r e u s entero-t ox ins A- a n d B: binding t o t he enterocy t e br ush bo r der and u ptake b y p e rt u r b at ion of t he a pi cal endoc y t i c m e mbr ane t ra f fi c . H ist ochem Ce ll B iol . 2013;139:513-24. 24 Twete n RK, landolo JJ . T ra n spo r t a nd processing of staphylococc a l e nt e r o t oxin B . J B ac teriol R es. 1983;153:297-303. 25.K im D ,Deeri nc kT J,Sigal YM , B abc o ck HP, El l is man MH , Z huang X.Co r r e lat iv e stochast i c opt i cal r econstr uc tio n micr o scopy and e l ec t ron microscopy. PLo S One. 2015;10:e 0124581. 26.H ause r M, Wo j cik M, Kim D, Mahm o ud i M, L i W, X u K . Co r r e lative supe r -r esolutio n micr os copy: new d i men s i ons a n d new o pportuni ti es . Che m R ev. 2017;117:7428-56. 27.B u r n ham JC , Has h imot o T , Con t i S. U lt ras t ruct ur e a nd c e l l d i vision of a fac ult at i vely paras it ic strai n of B dell o vi br io b acteriovorus. J Bacte r iol Res .1970;101:997-1004. 28.Z ho u X, Halladi n DK, R o j as ER, Kos l over E F, L e e TK, H u ang KC, et al.Mechan i cal cr ac k pro p agat io n d r ives mill i sec on d daught e r c el l separ a -t ion in Staphy l ococcus a u reus. S c ie nc e. 2015;348:574-8. 29.Nag ak ubo T, N om u ra N , T o yo fuk u M. Cracking open b ac t erial m embr a ne vesi c les. F ront Mic r ob i ol. 2020;10:3026. 30.T ur n bull L , T o yofu k u M, Hynen A L , Ku r os a wa M, Pess i G, Pe t ty N K, et al.E xplos i ve cell lysi s as a me c hani s m for the bio g enesis of ba c teri al mem-bra n e ve s ic l e s and bi of i l m s . N a t Commu n. 2016;7:1-13. 31. T a ka ha shi S, M i zum a M, K ami S, N ish i d a H . Spec i es-dependent pr otoplas t e n l a rg e ment involves d i ffe r ent types o f vacuole generatio n in b ac t eria.Sci Rep . 2020;10:1-11. 32.Nel s on D , L o omi s L, F i s ch et t i VA. Preventio n a nd elim i nat i on of u pp er r espiratory co l on i zat i on of mice b y grou p A st r eptococci by using a b ac t e r iophage lyti c e nzyme. Proc N a tl Acad Sc i U S A. 2001;98:4107-12. 33.Mat i a s VR, Bever i d ge TJ. Nat i ve ce l l wal l org an izatio n shown by cryo-e l e c tr o n m ic ro sc opy c onf ir ms the exi s tence of a peripl as mic sp a c e i n Staphylococcu s aur e us. J B ac t eriol Res . 2006;188:1011-21 34.Z aborowska M, Vazirisani F , S hah FA, F i rdau s R, Om ar O, E kstrom K ,et al . Immu no modulatory e f fec ts exe r ted b y ex t racellu l ar ves i c l es f r om S taphyl oc occu s e pidermid i s and S t a phyloc o ccu s a ureus i s ol a ted f r om b one -anchored pro s theses. Biom a te r i a ls . 2021;278:121158. 35.Moon S, Yan R , K e n n y SJ, Shyu Y , Xiang L, L i W, e t al. Spect r ally r esolv e d,funct i onal su pe r -r esolutio n microscopy reveals nano scale com -p osit io nal h e t erogeneity i n liv e -ce l l m embr a nes . J Am Chem So c .2017;139:10944-7. 36.Chu n g J , Je ong U, Jeong D , G o S, K i m D . Dev e lopm e nt of a new approach f o r low-lase r -powe r su per-r esolu t io n fluorescence ima g i n g . A nal Chem .2022;94:618-27. Publisher's Note Spr i nger N a ture r e m ai ns neut r al wit h regard t o jurisdic t i o nal c l ai ms in p u b-lished maps and i ns t i tutio na l a f f il i at ions. Ready to submit your research? Choose BMC and benefit from: · fast , co n venient on l in e sub m ission · th o r o u gh peer review by experie n ce d researchers i n you r fi eld · r ap id publication on acceptance · s up p o rt for resear c h d a ta, inc lu din g large and comp le x d at a t ype s · gold Open Access w h ich fosters wider col l a b oration an d i ncreased citations · m aximum visibi l i ty f or yo u r r esea r ch : over 100M website views per yea r At BMC , research is always i n progress . Learn more biomedcentral .com/s u bmiss i ons BMC
确定
还剩12页未读,是否继续阅读?

产品配置单
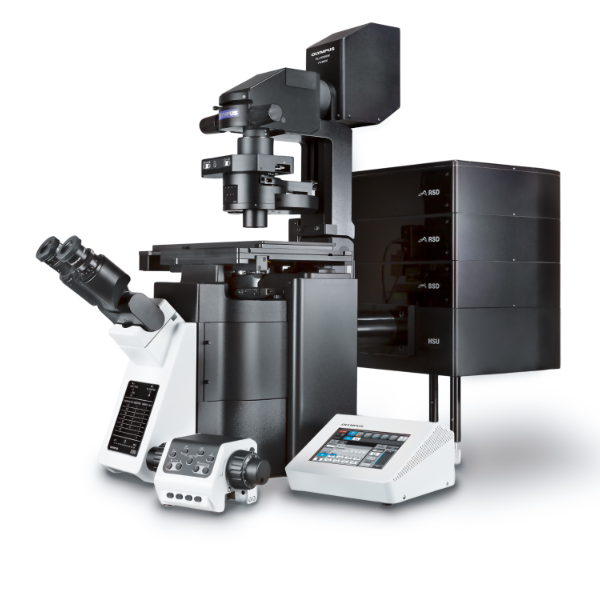
宁波力显智能科技有限公司为您提供《【应用实例】超分辨率显微镜在观察革兰氏阳性菌的细胞外囊泡生物中的应用》,该方案主要用于其他中超分辨率显微镜检测,参考标准--,《【应用实例】超分辨率显微镜在观察革兰氏阳性菌的细胞外囊泡生物中的应用》用到的仪器有力显智能科技INVIEW激光共聚焦超分辨STORM原理显微镜iSTORM
推荐专场
相关方案
更多