


生物刺激、生物增强和有机修正在土壤顽固性烃生物修复中的应用评价Evaluation of biostimulation,bioaugmentation, and organic amendments application on the bioremediation of recalcitrant hydrocarbons of soil
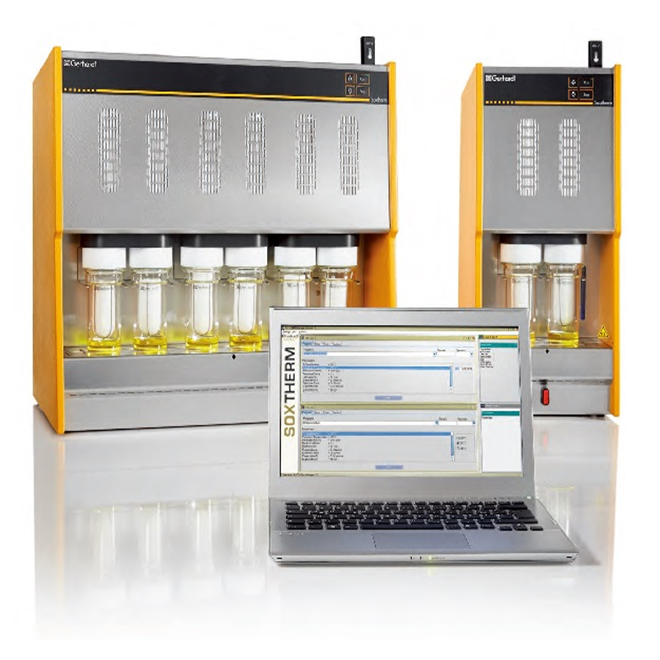
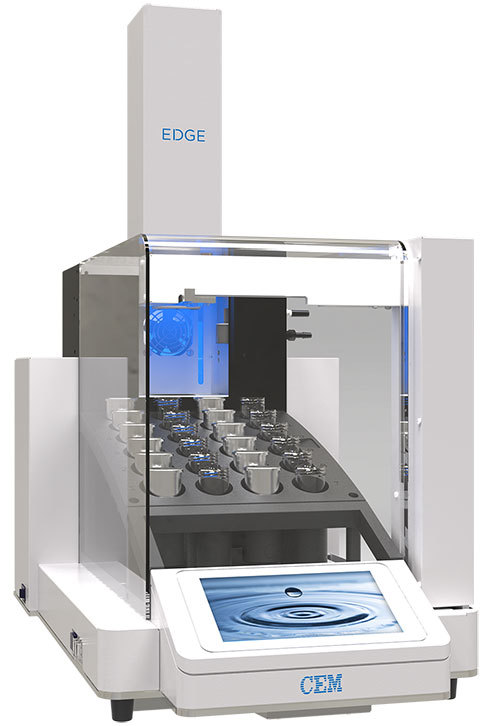
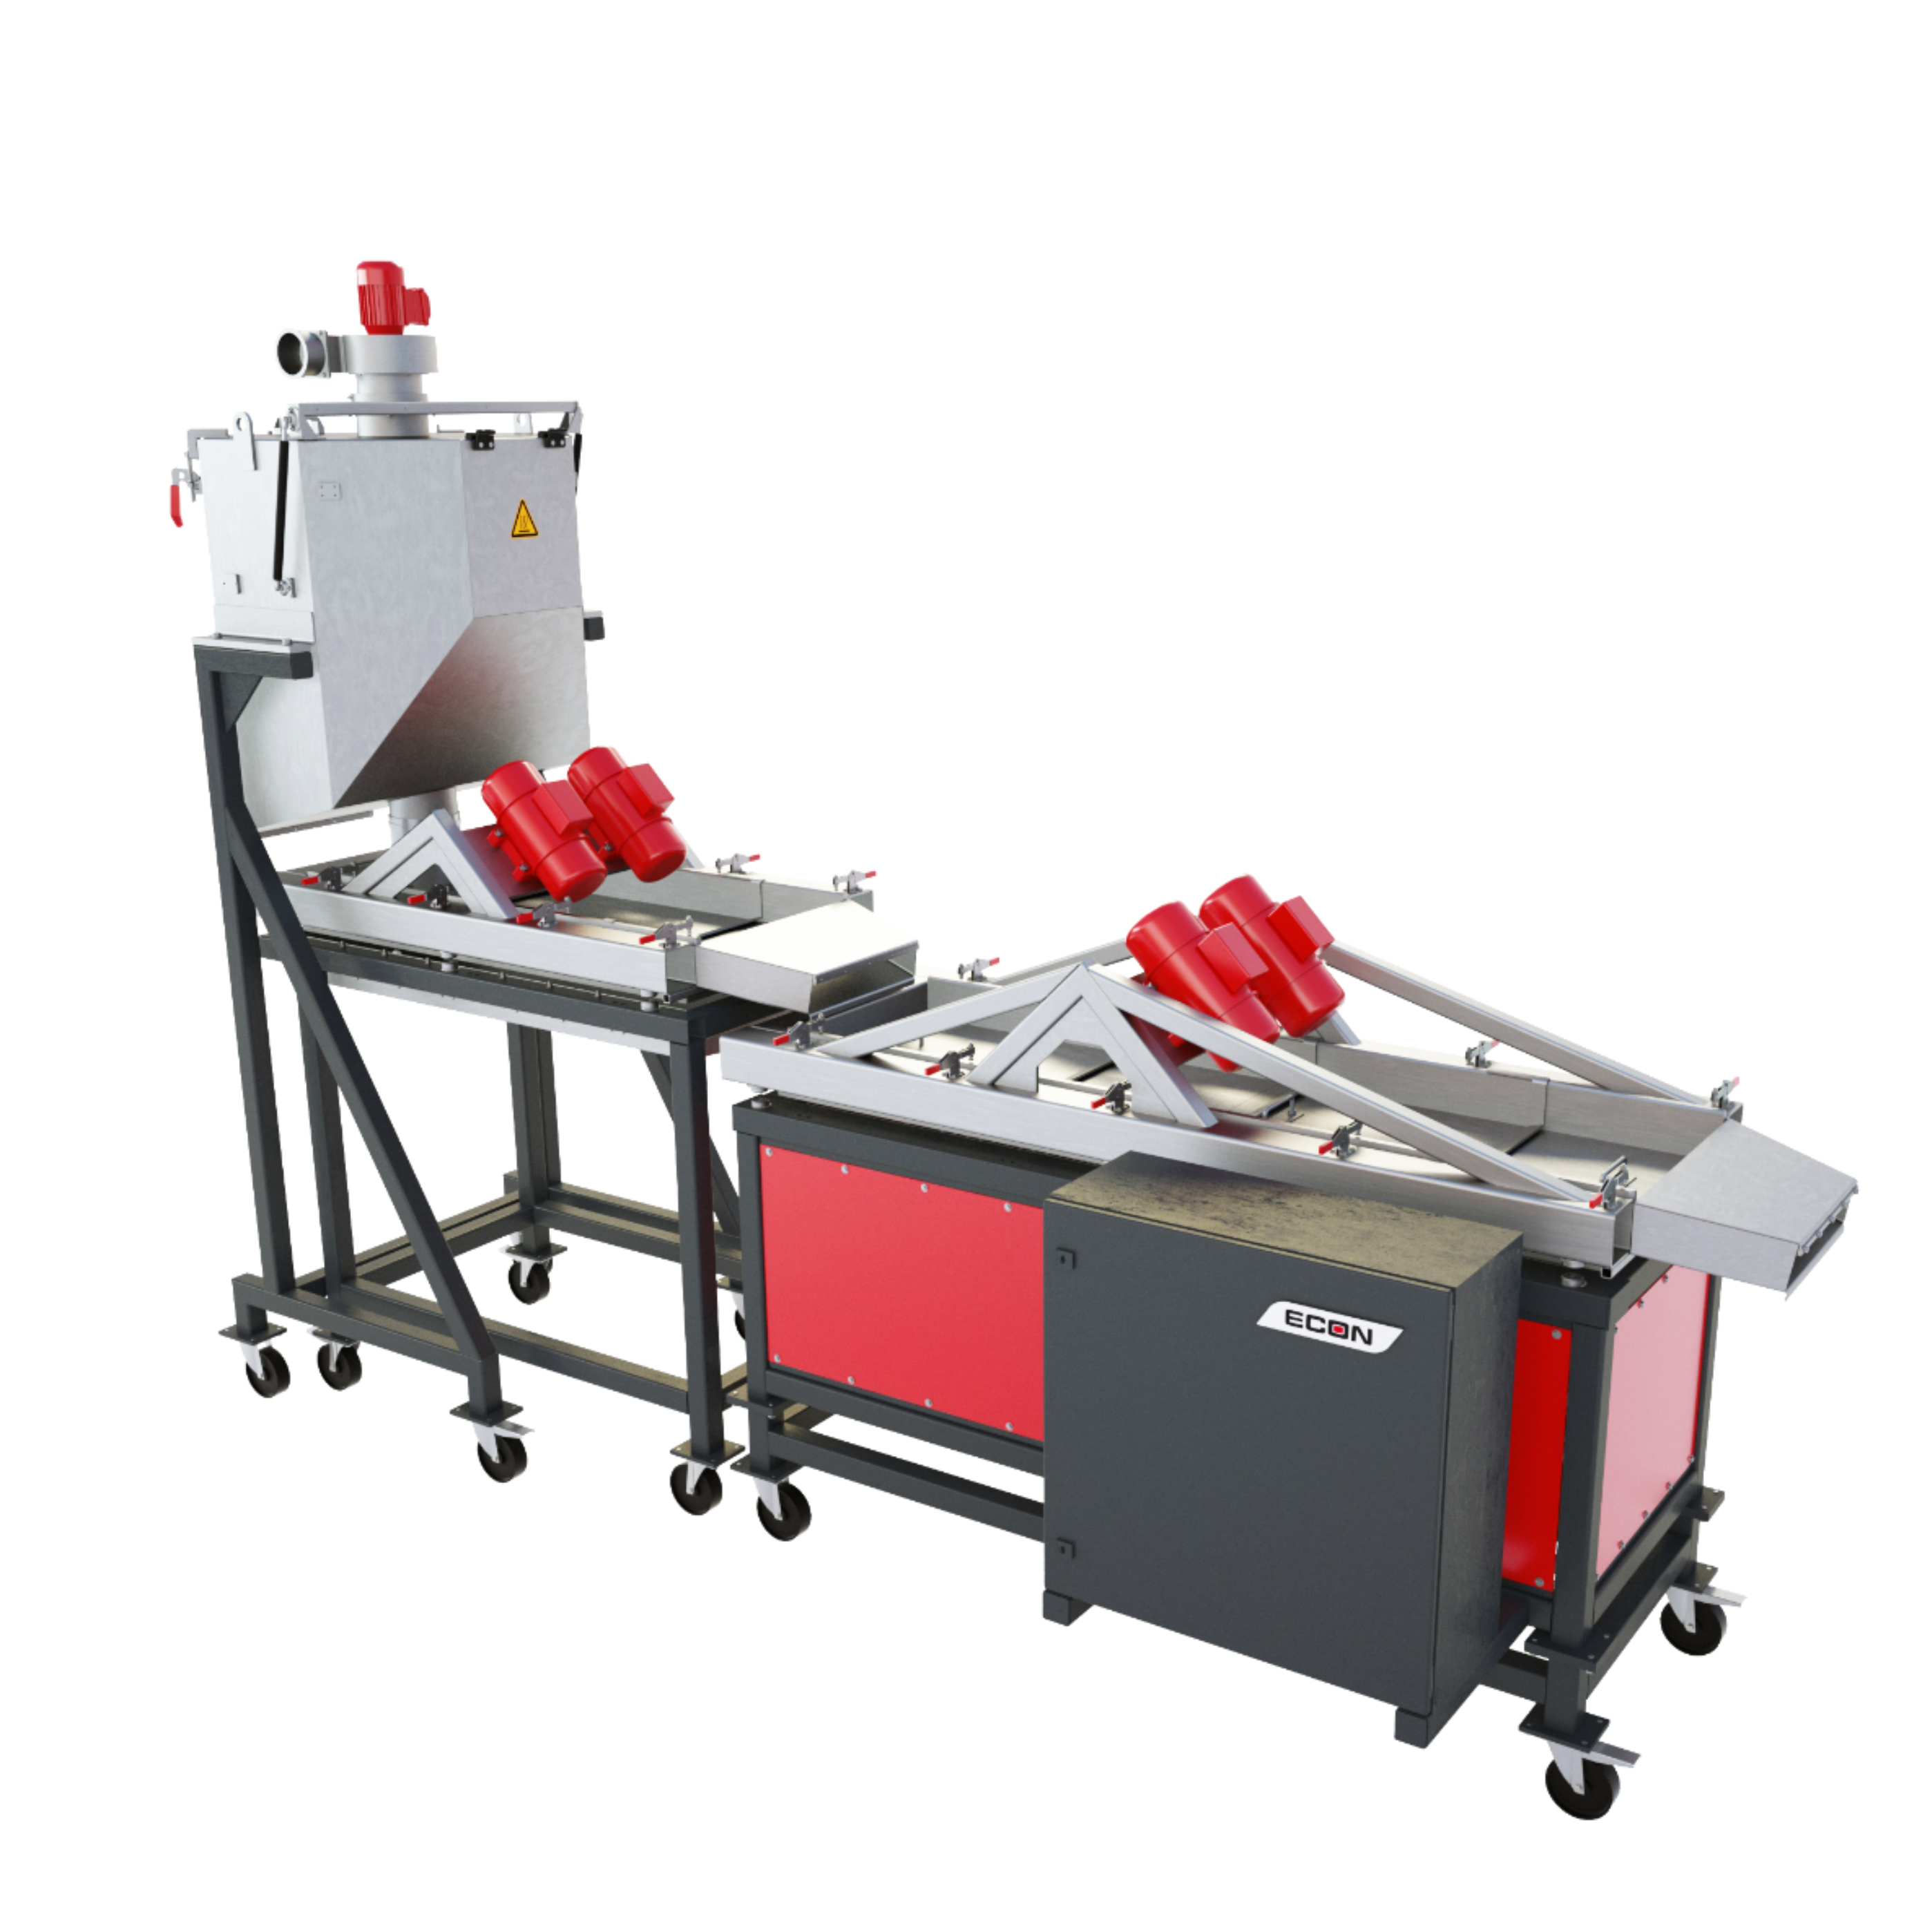
在格哈特公司的索克森Soxtherm全自动快速萃取系统中,使用3:1 DCM:甲醇,提取5g土壤样品。
In a Soxtherm system, using 3:1 DCM to methanol (MeOH), the soil samples (5 g) were extracted (Gerhardt analytical systems).
方案详情

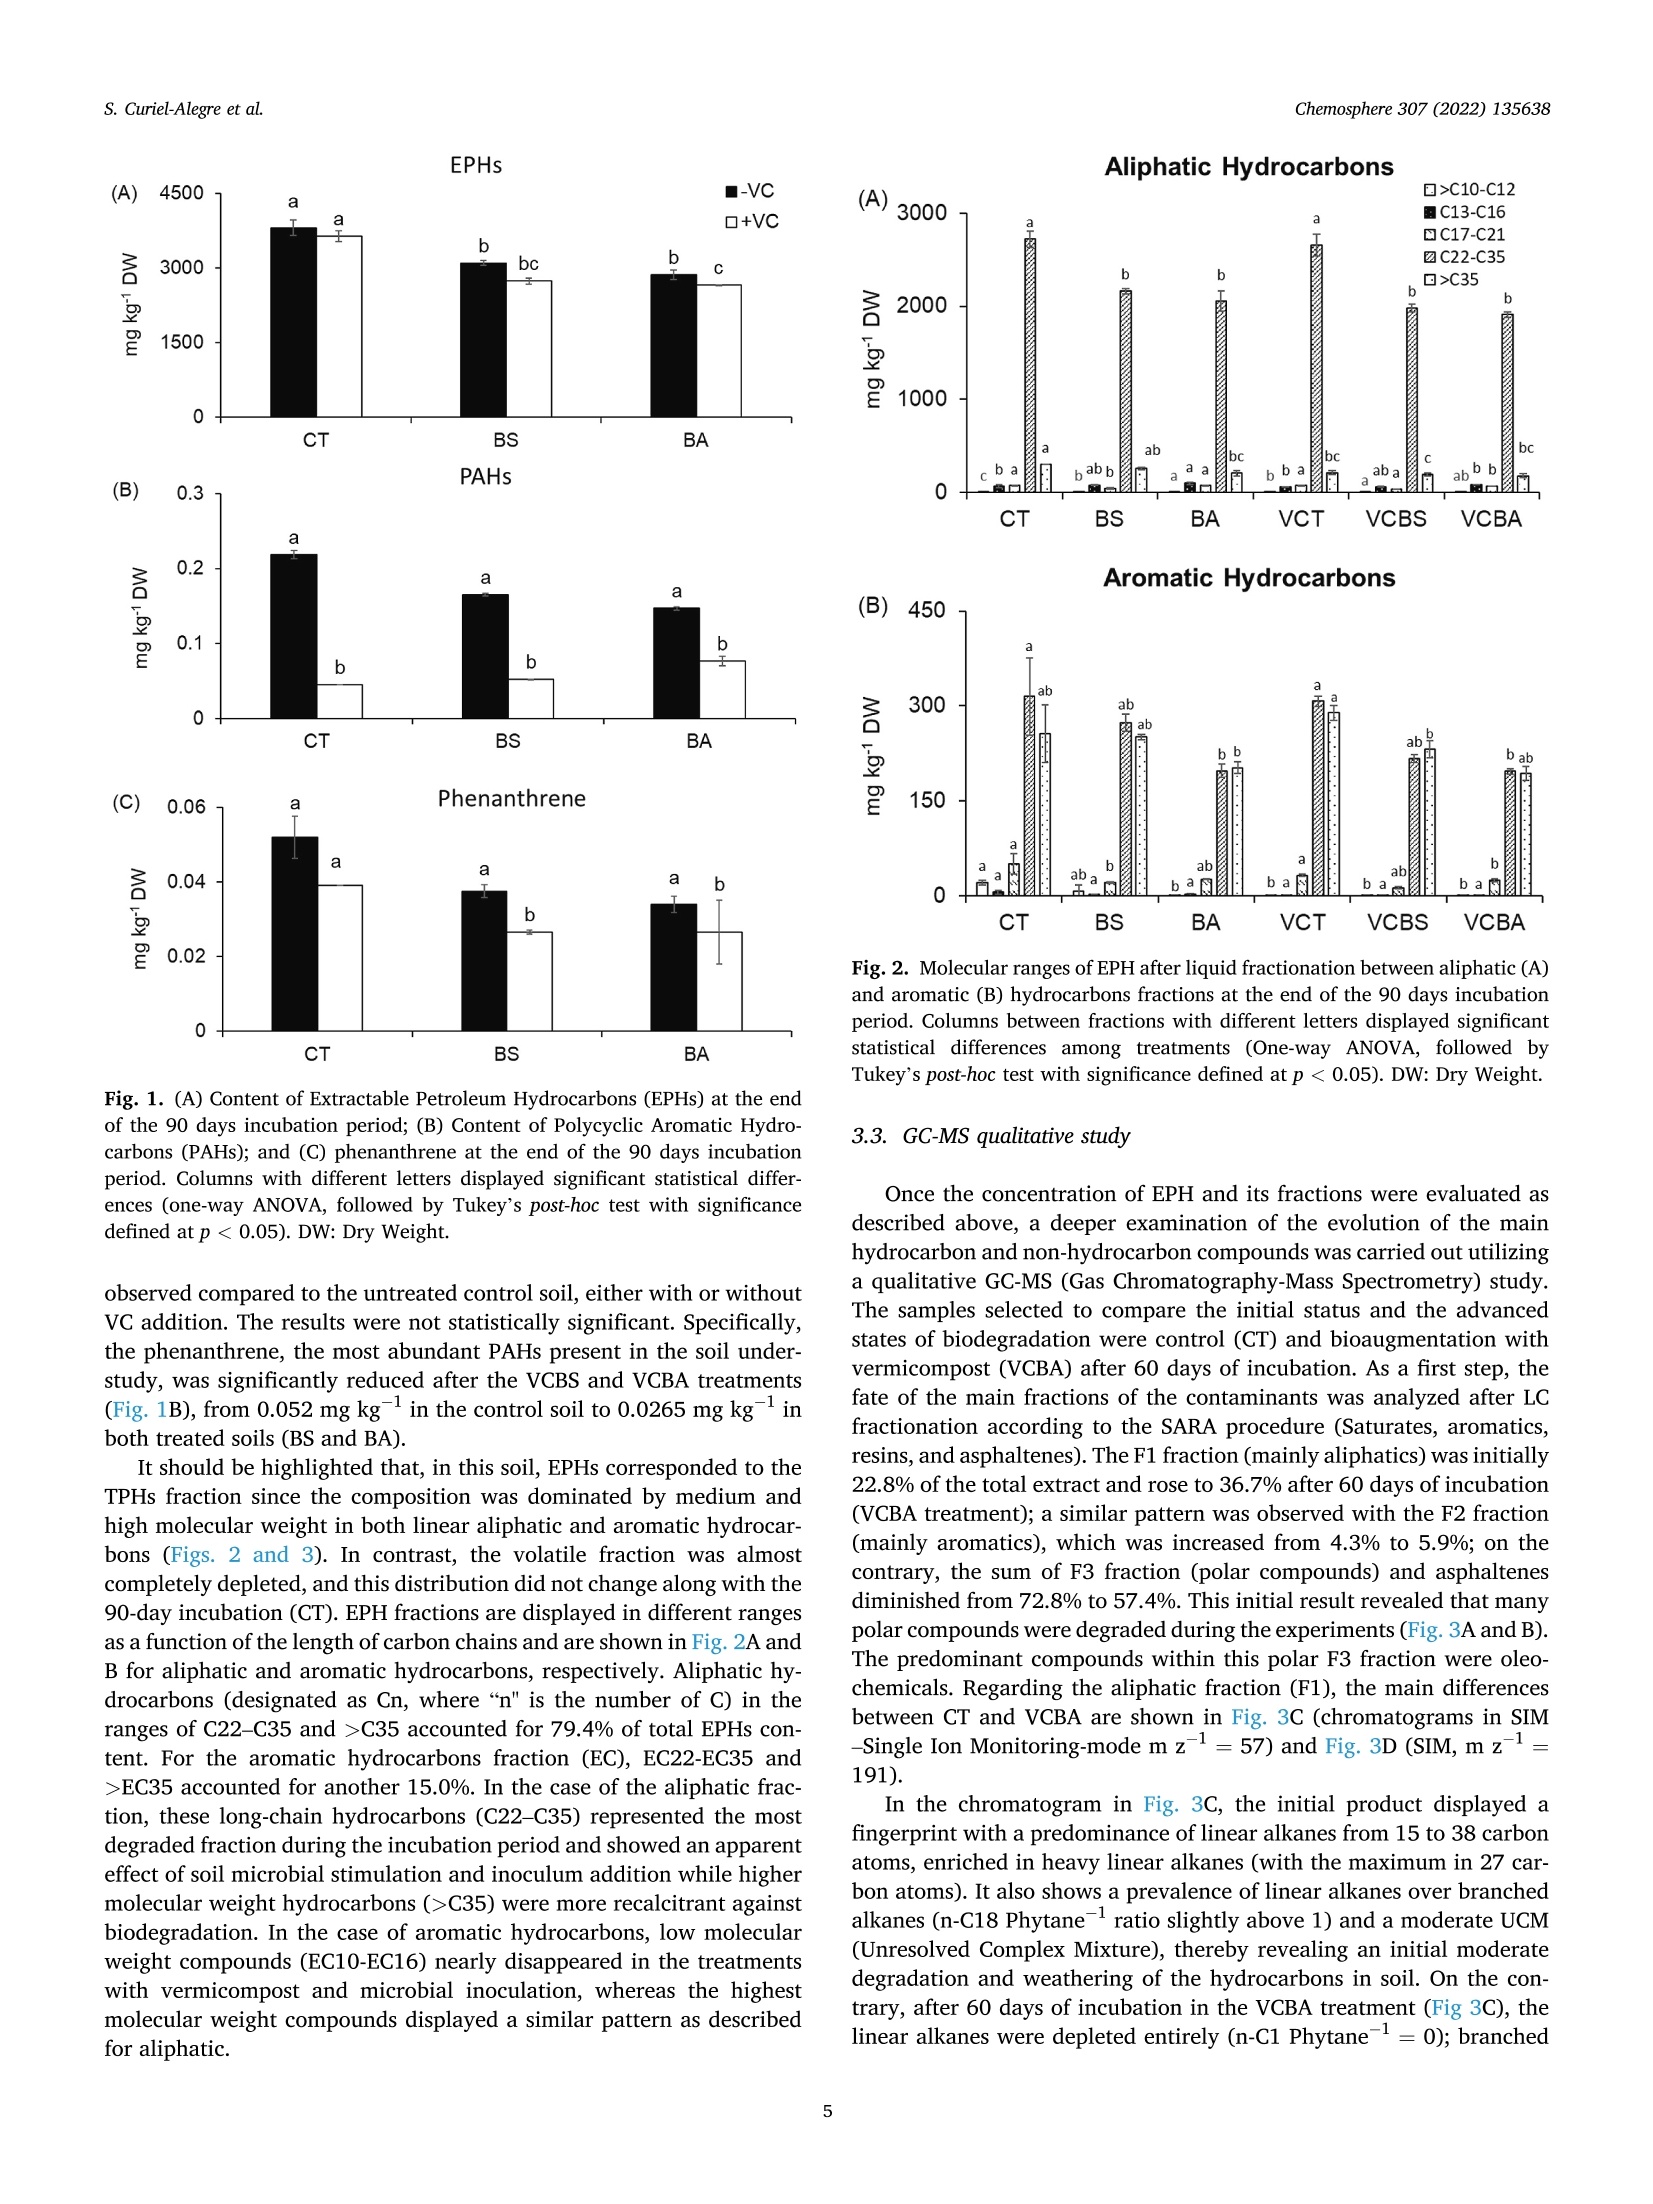
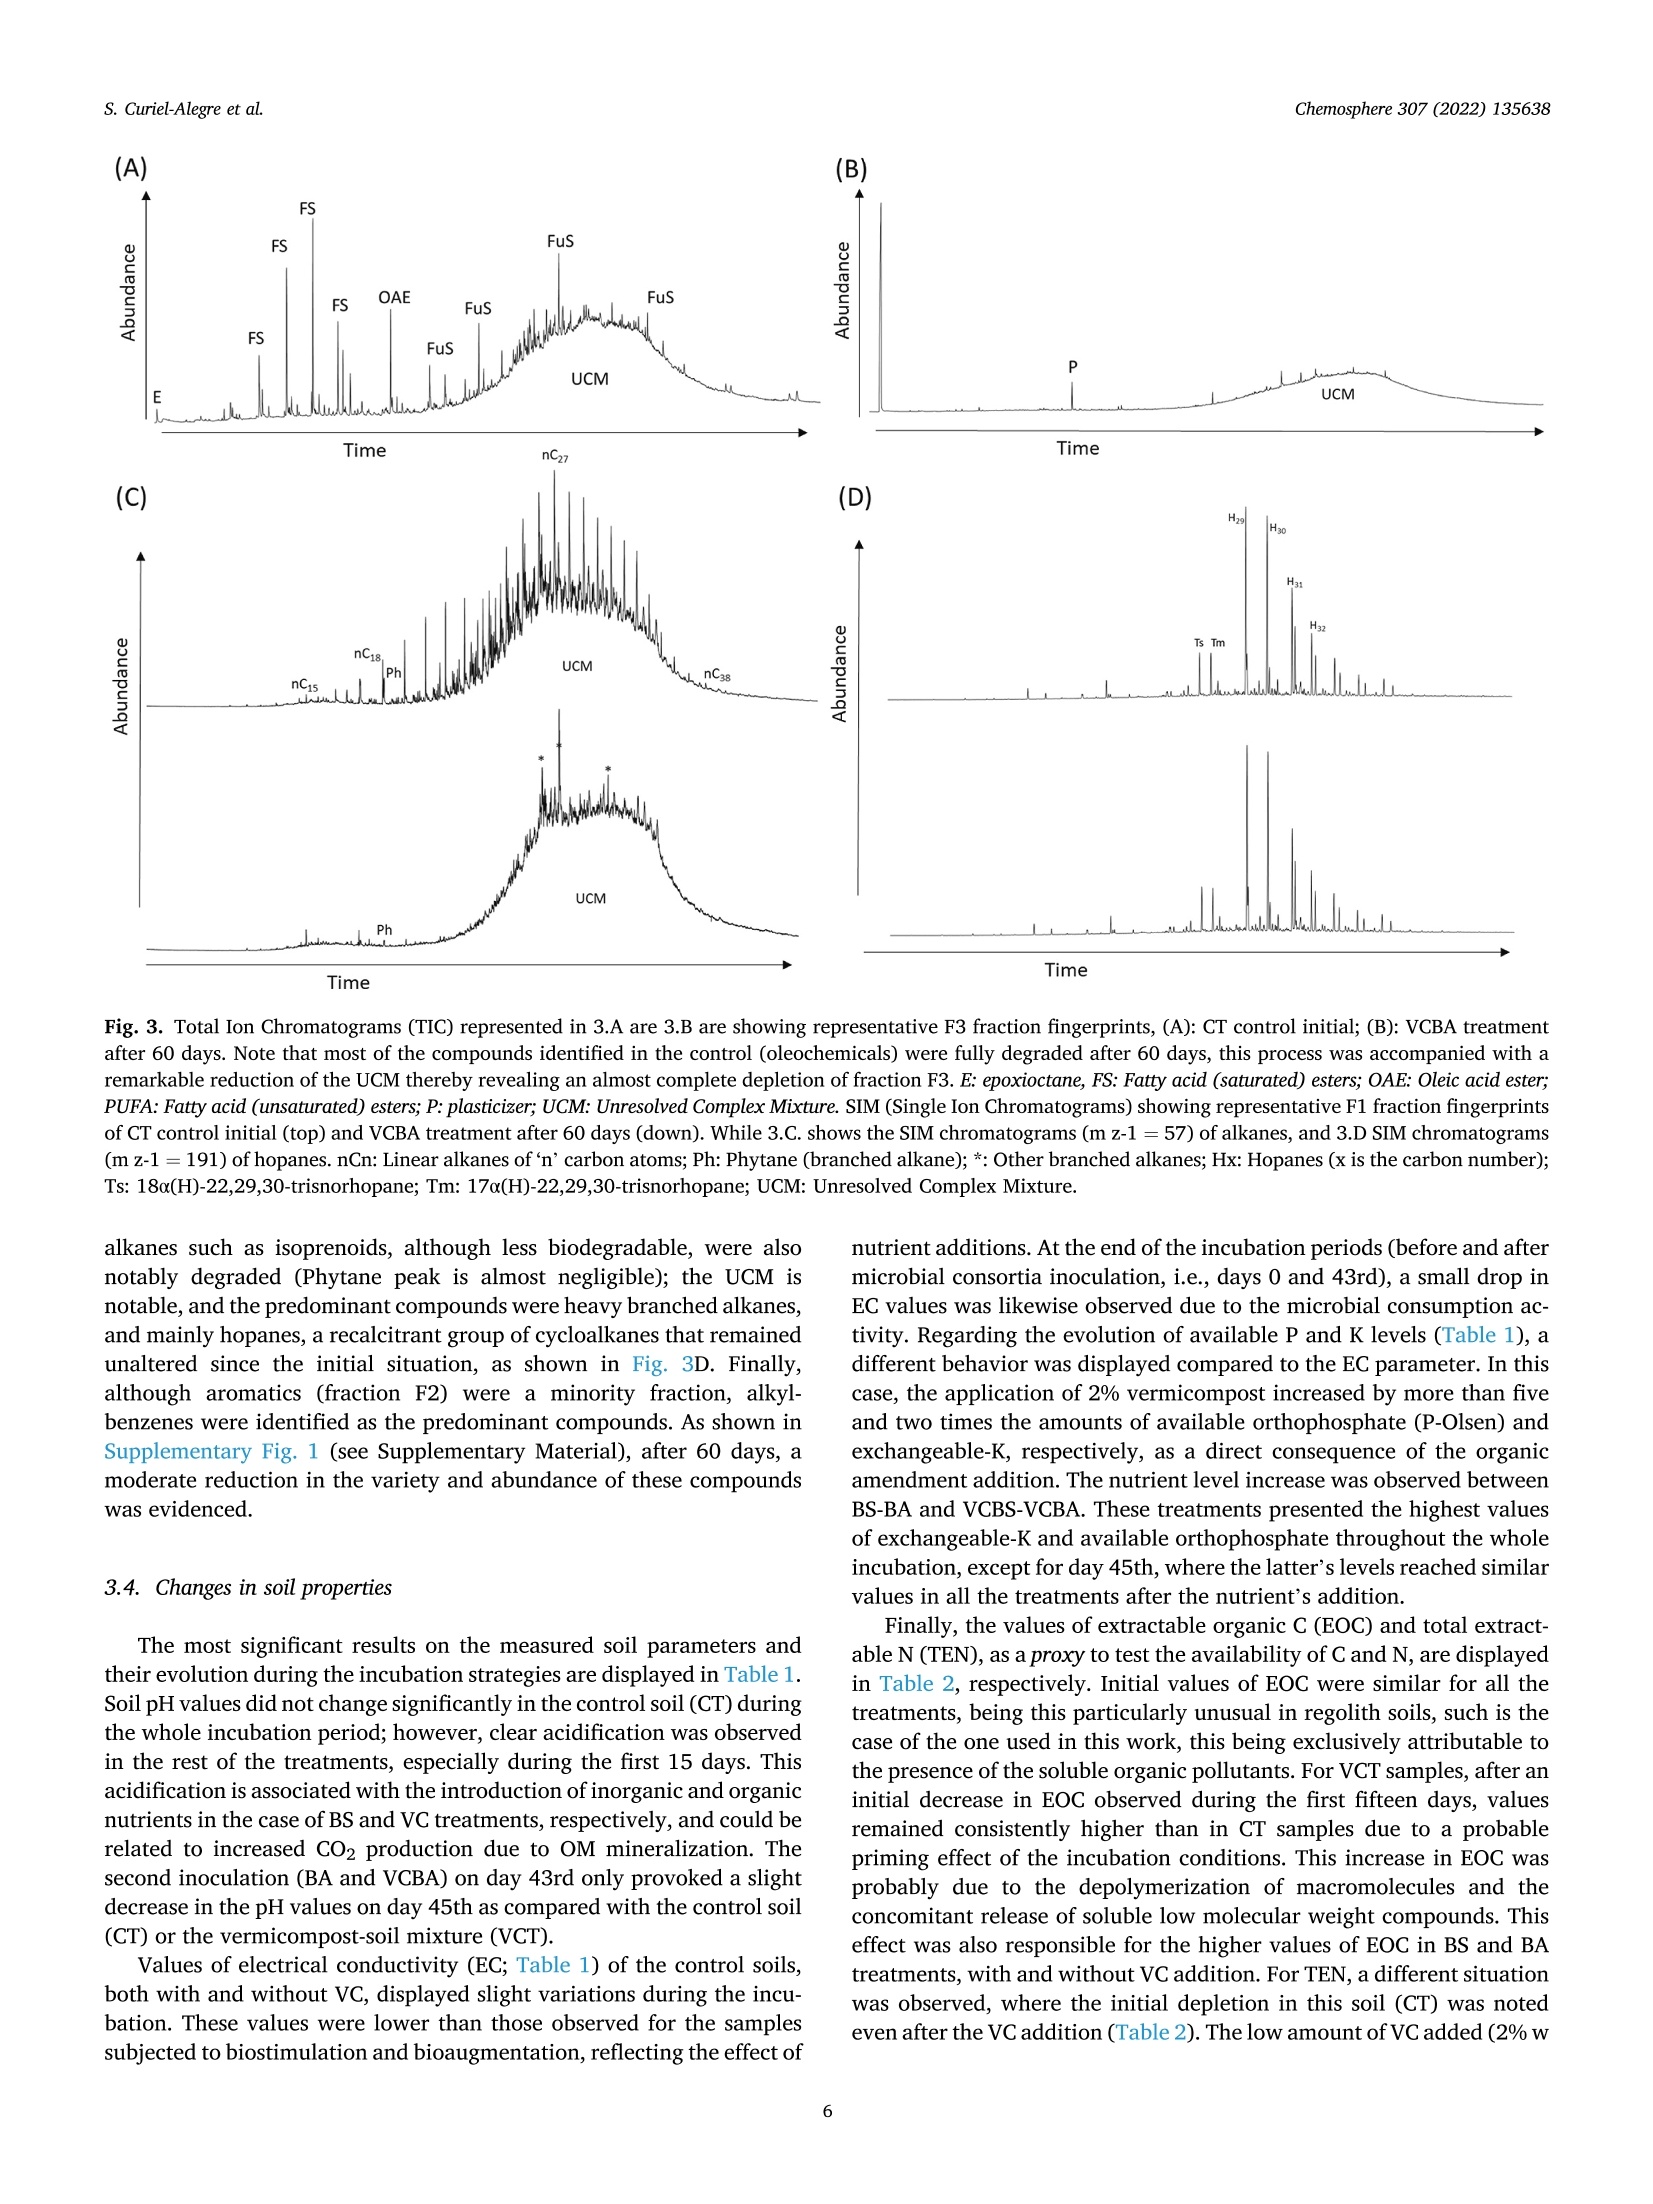
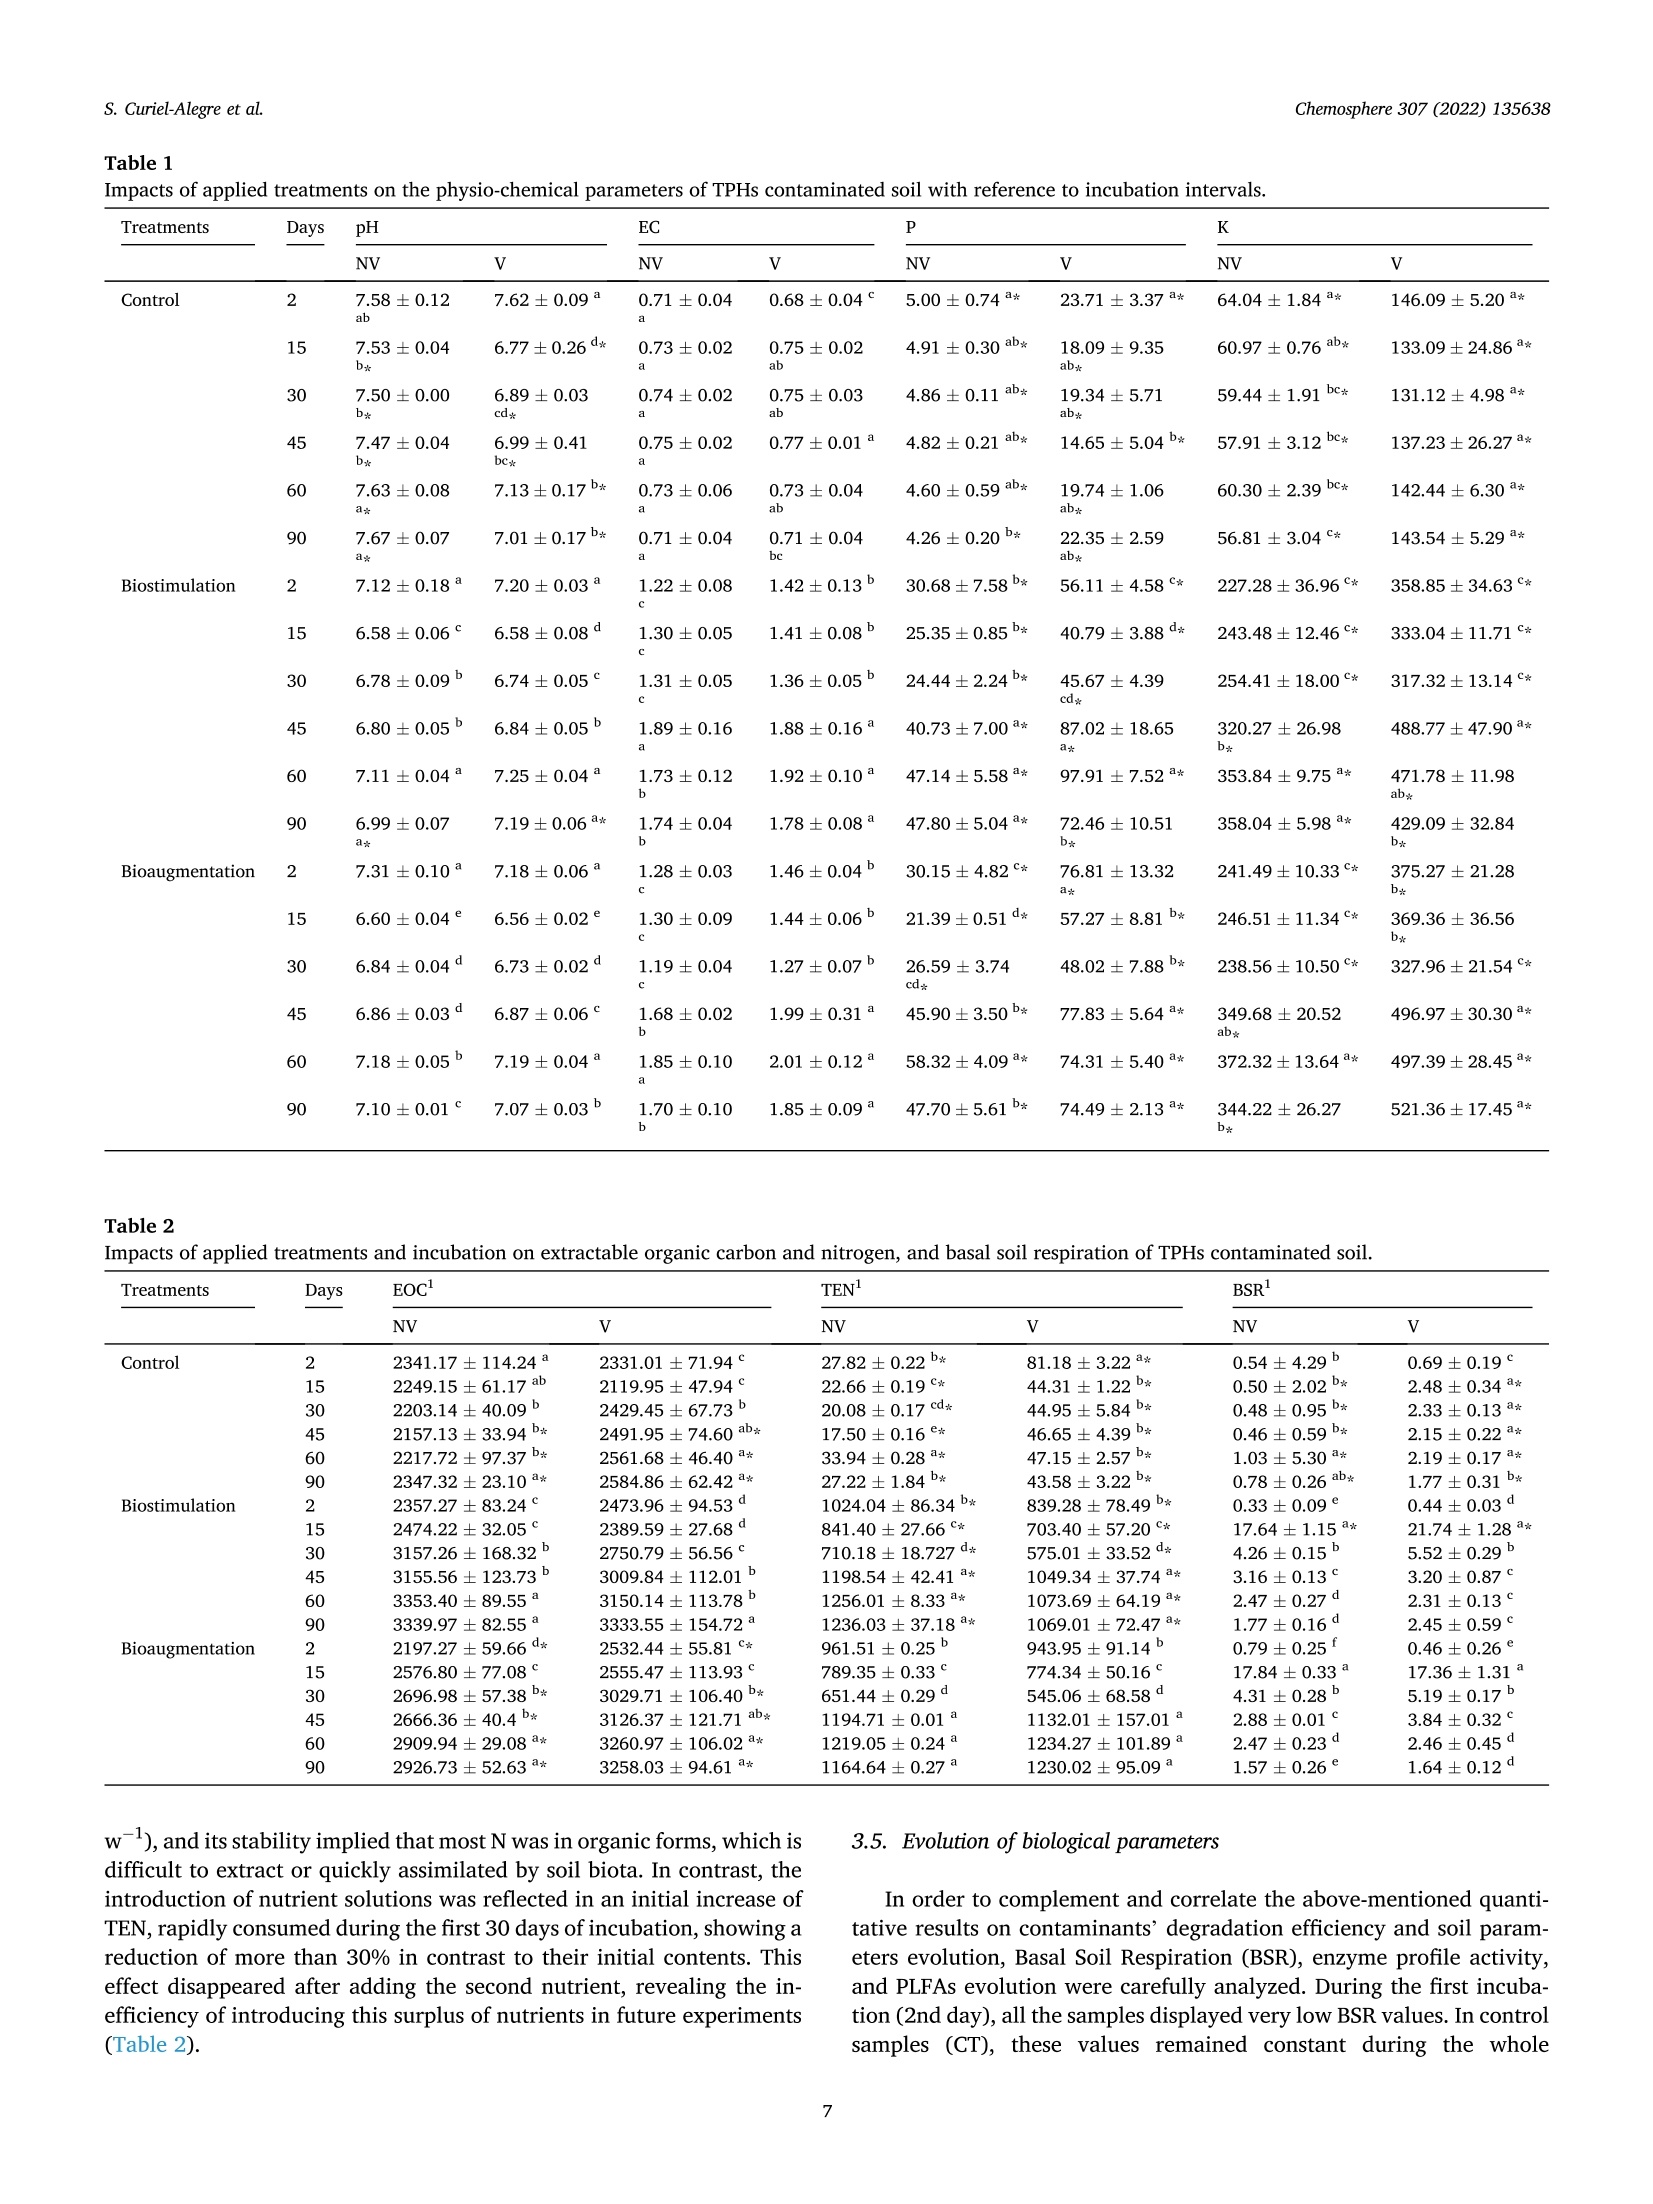
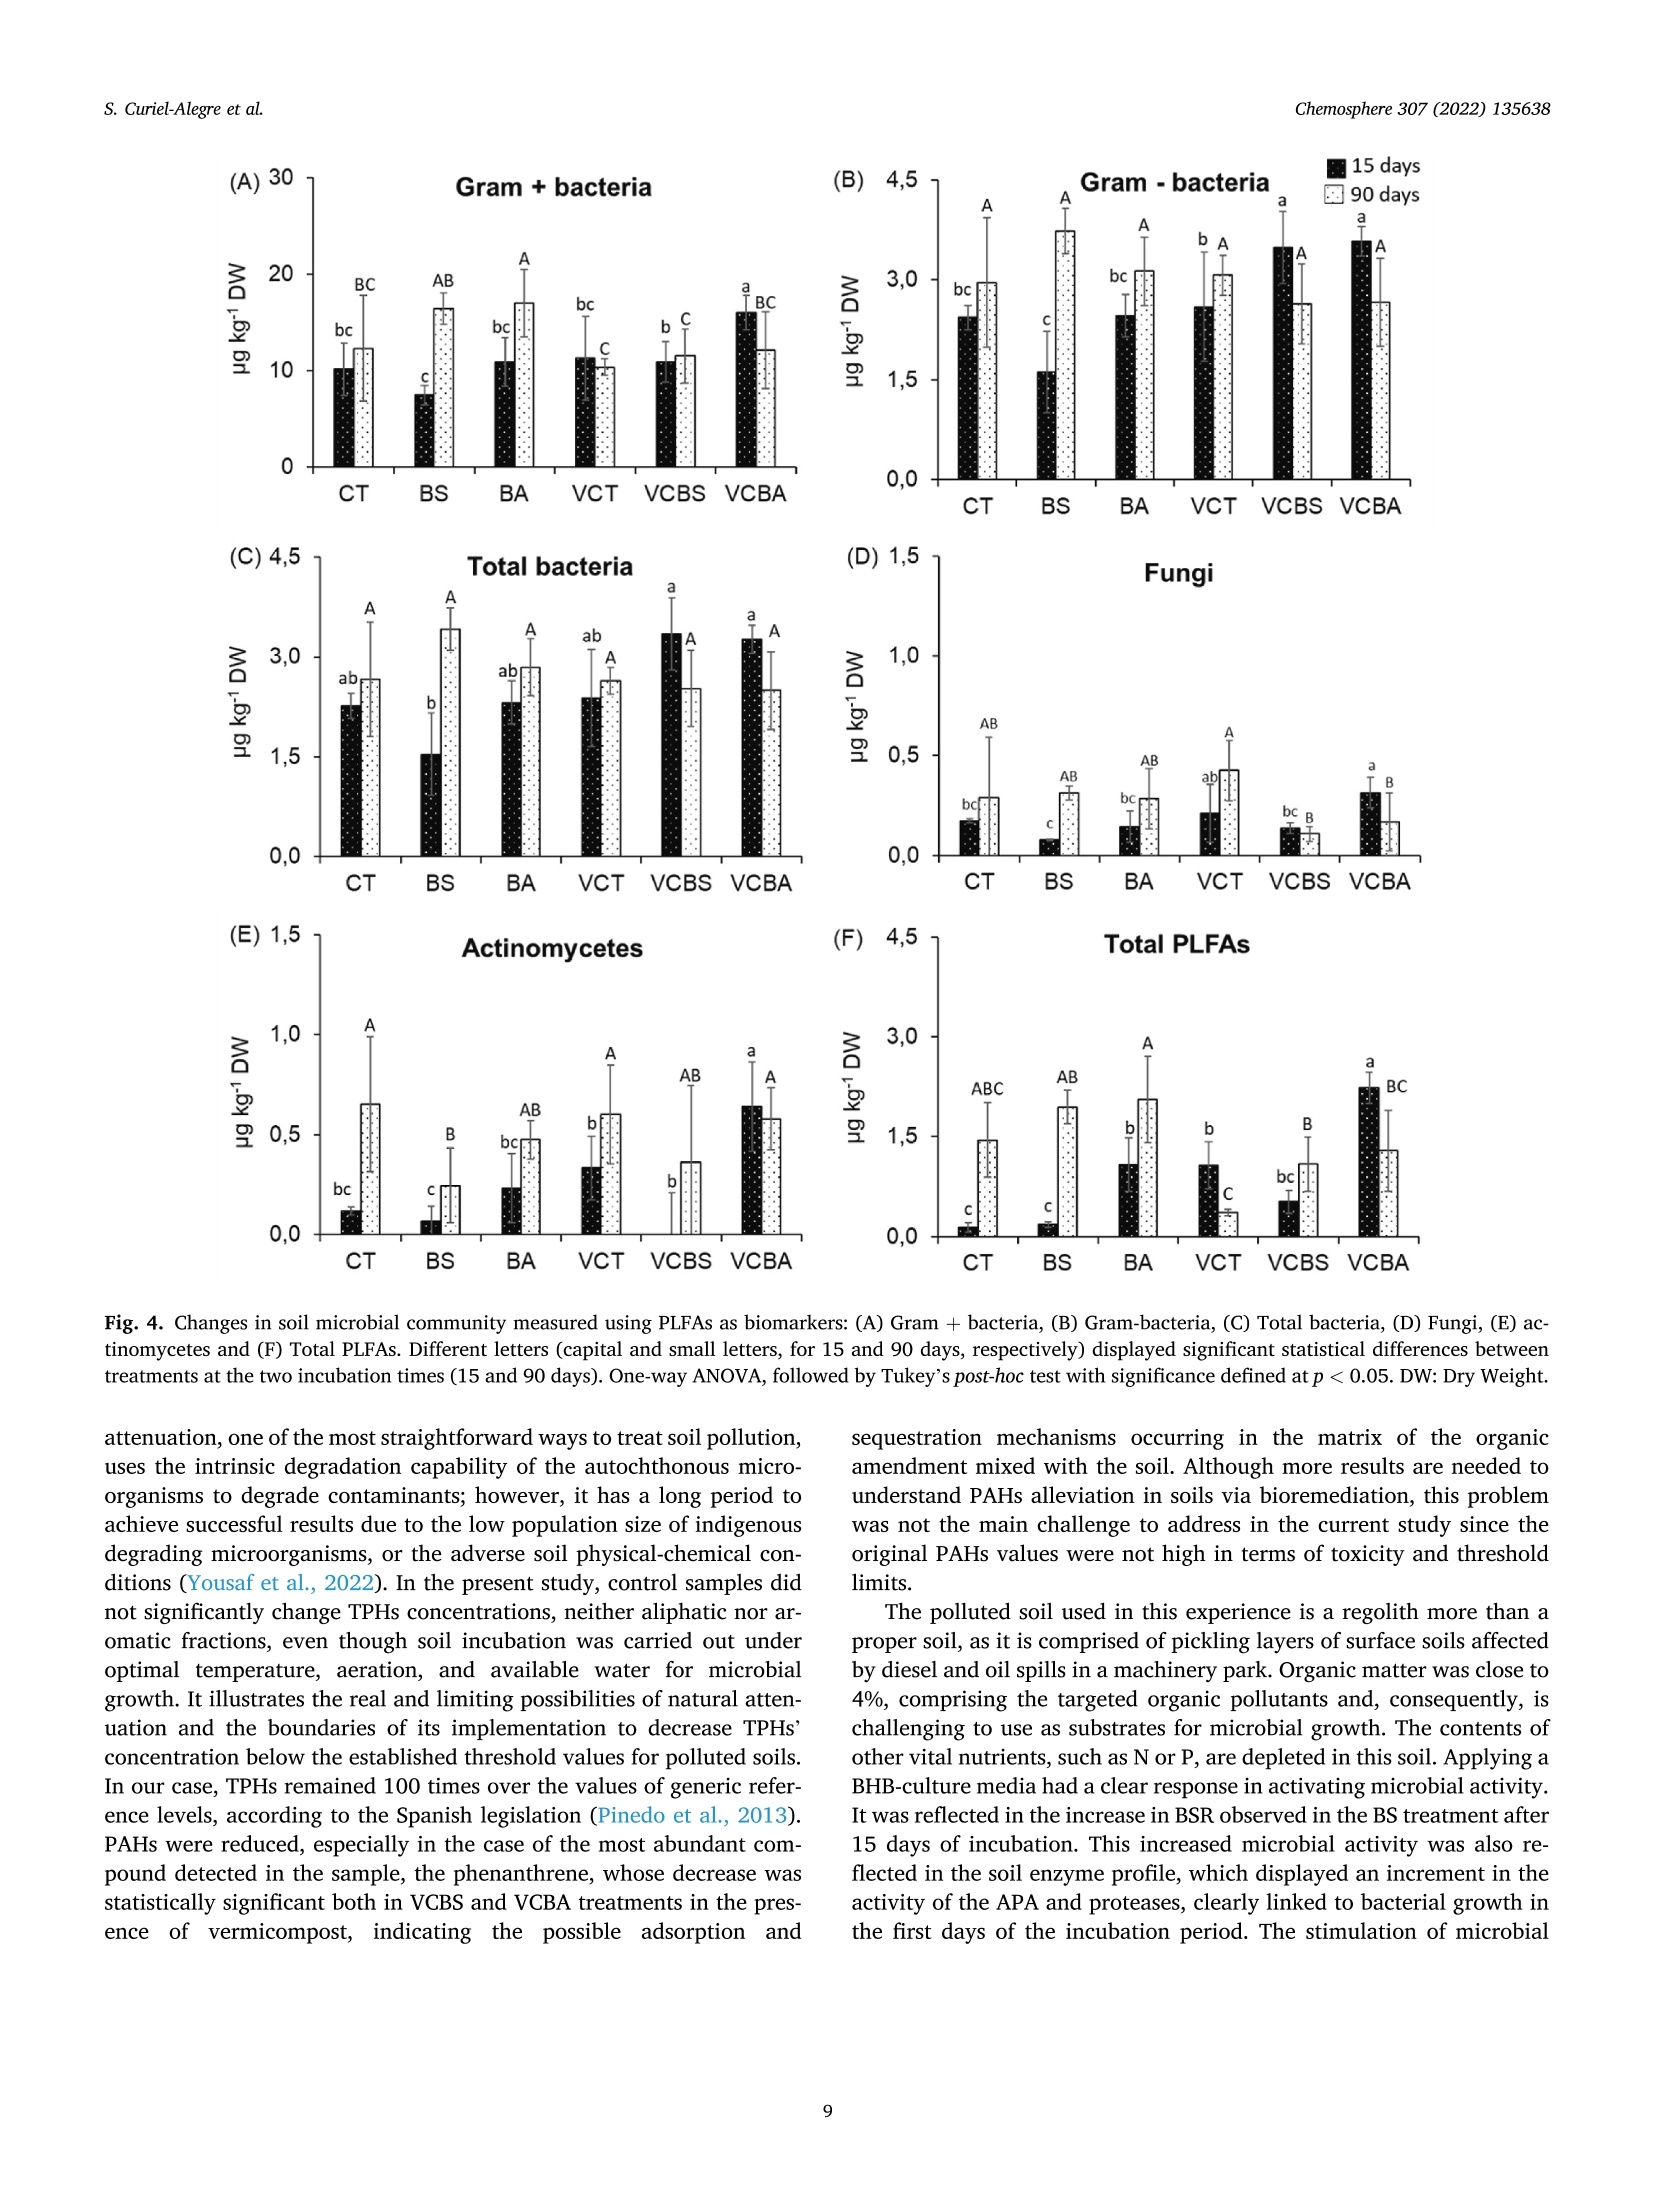
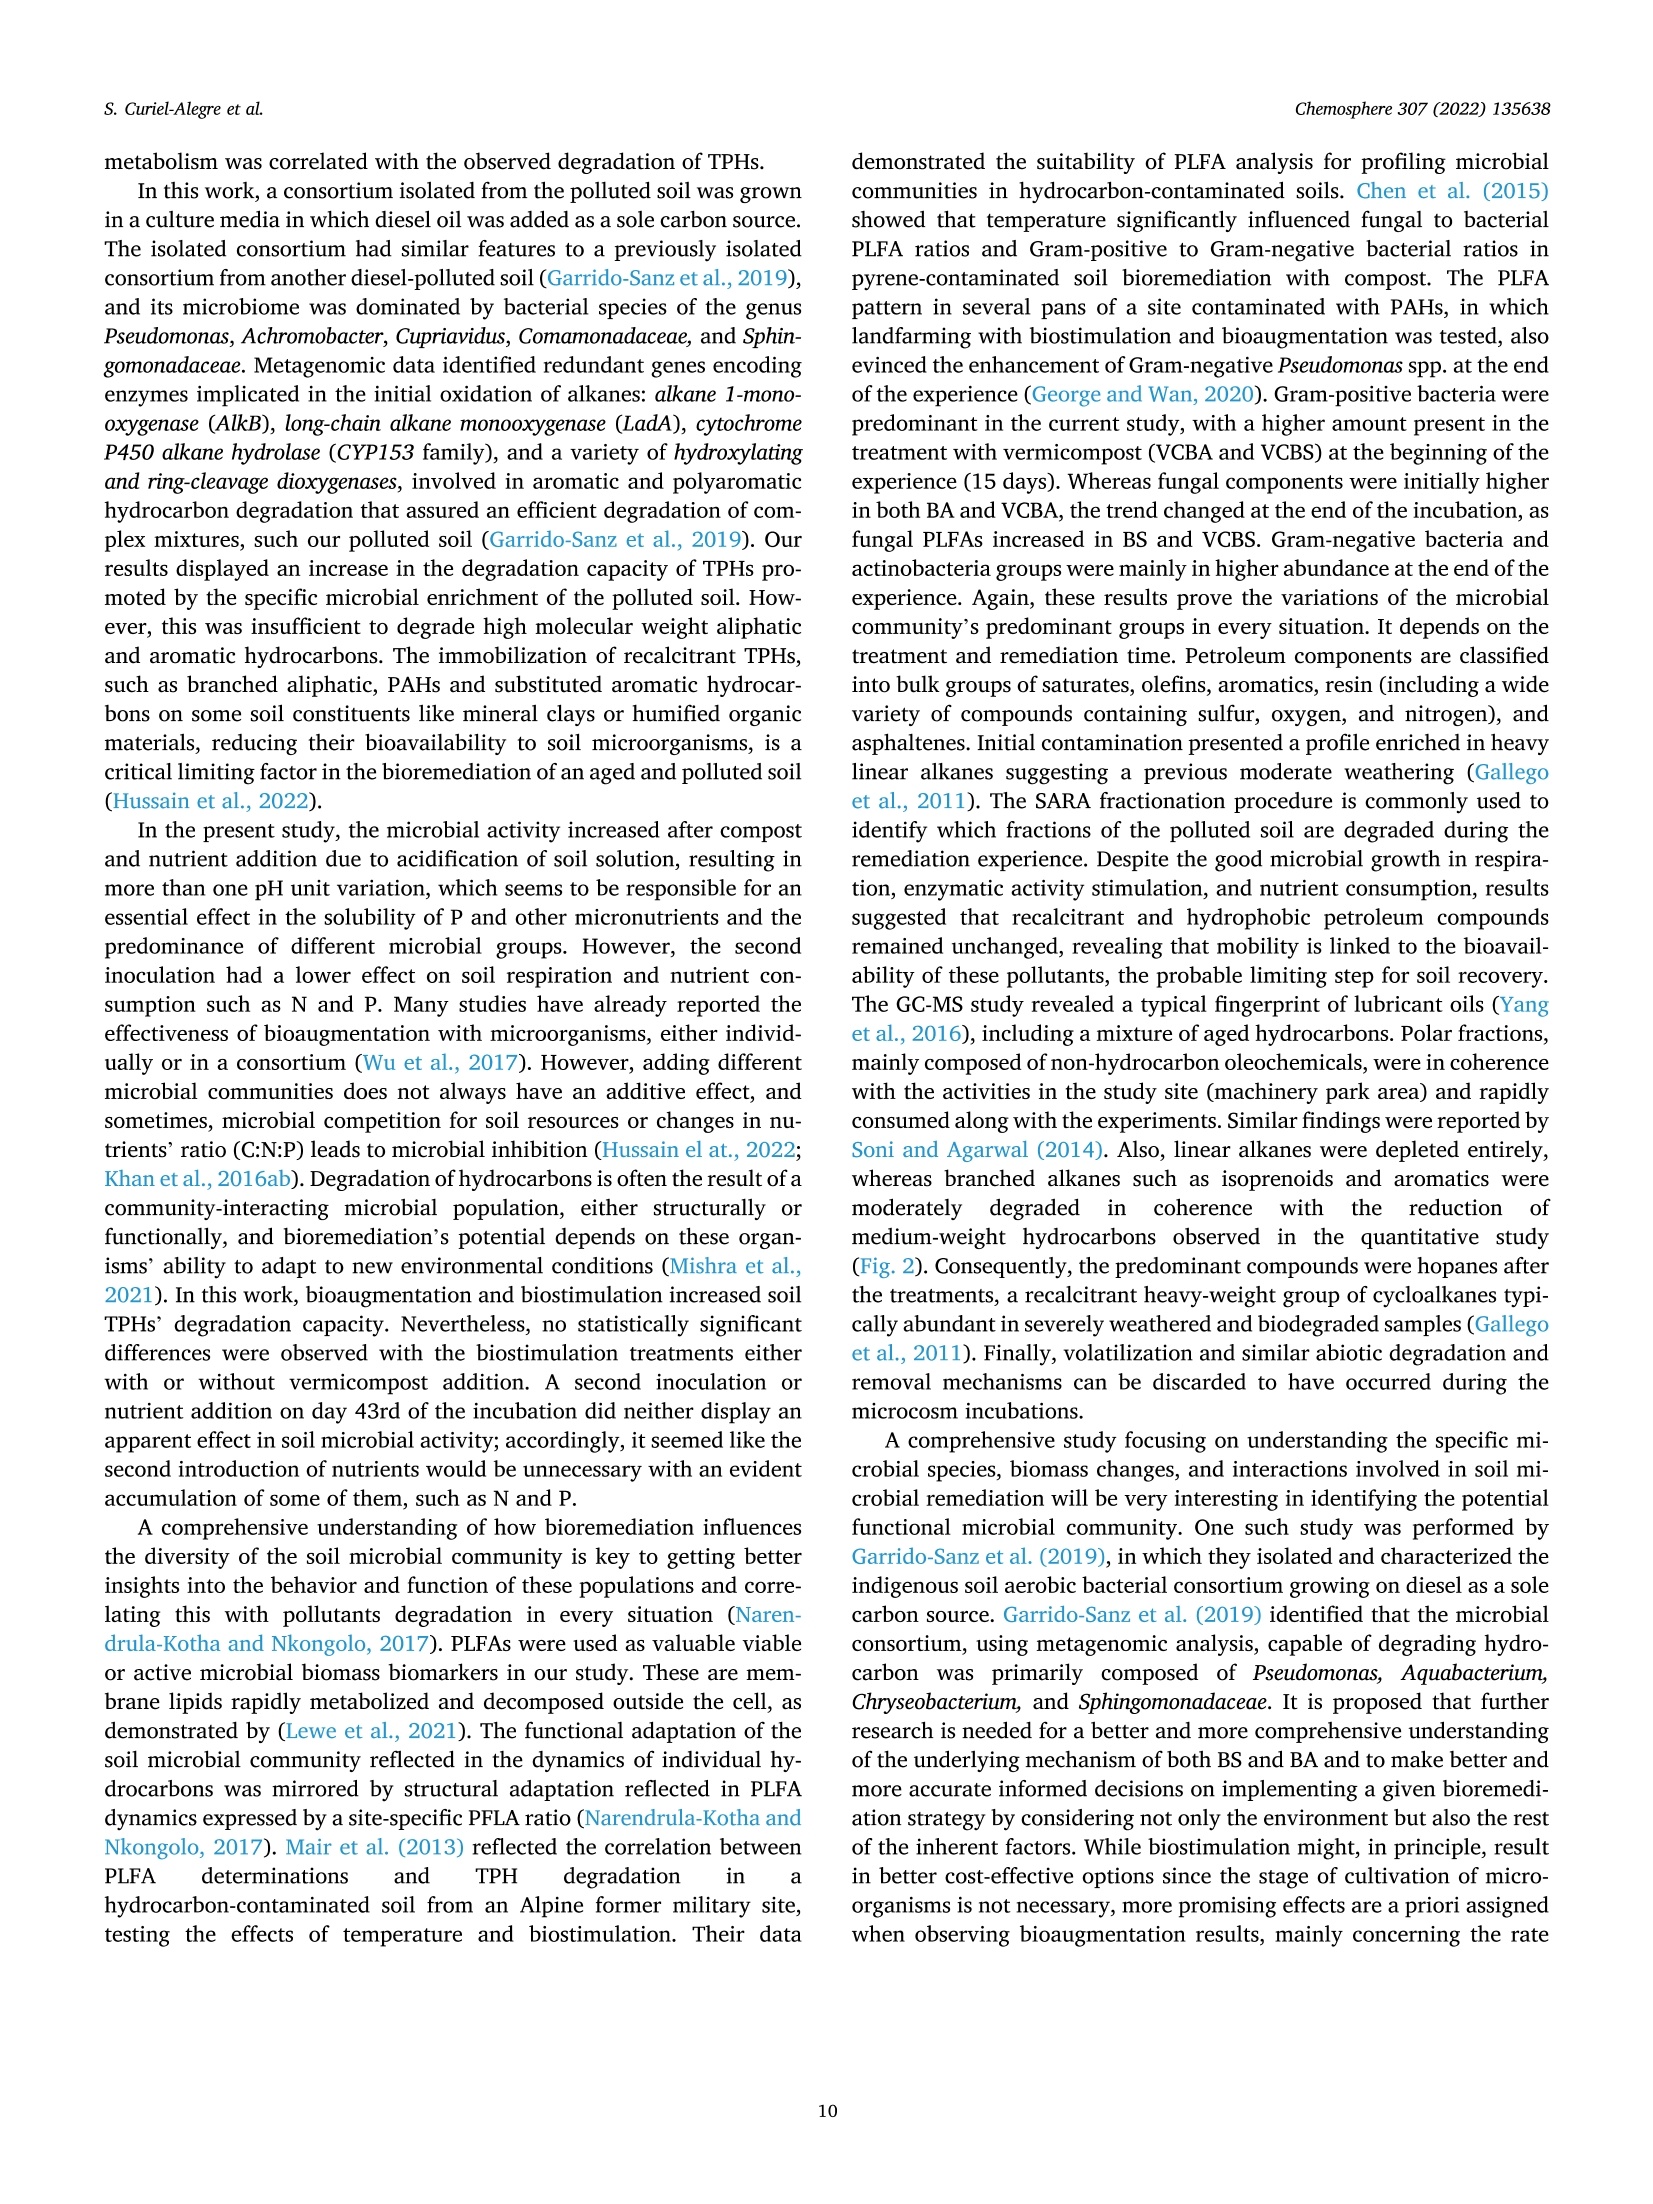
生物刺激、生物增强和有机修正在土壤顽固性烃生物修复中的应用评价Evaluation of biostimulation,bioaugmentation, and organic amendments application on the bioremediation of recalcitrant hydrocarbons of soil在格哈特公司的索克森Soxtherm全自动快速萃取系统中,使用3:1 DCM:甲醇,提取5g土壤样品。In a Soxtherm system, using 3:1 DCM to methanol (MeOH), the soil samples (5 g) were extracted (Gerhardt analytical systems).Chemosphere 307 (2022) 135638Contents lists available at ScienceDirect Chemosphere 307 (2022) 135638S. Curiel-Alegre et al. Chemosphere journal homepage: www.elsevier.com/locate/ch e mosphe r e 生物刺激、生物增强和有机修正在土壤顽固性烃生物修复中的应用评价 Evaluation of biostimulation, bioaugmentation, and organic amendments application on the bioremediation of recalcitrant hydrocarbons of soil Sandra Curiel-Alegre a ,b , Blanca Velasco-Arroyo @, Carlos Rumbo , Aqib Hassan Ali Khan ,Juan Antonio Tamayo-Ramos , Carlos Rad , Jose Luis R. Gallego , Rocio Barros , aInternational Research Center in Critical Raw Materials for Advanced Industrial Technologies (ICCRAM), University of Burgos, Centro de I +D +I. Plaza Misael Banuelos s/n. 09001, Burgos, Spain Research Group in Composting (UBUCOMP), University of Burgos, Faculty of Sciences, Plaza Misael Banuelos s/n, 09001, Burgos, Spain C Environmental Biogeochemistry & Raw Materials Group and INDUROT, Campus de Mieres, University of Oviedo, C/ Gonzalo Gutierrez Quirós s/n, 33600, Mieres, Spain HIGHLIGHTS ·Bioaugmentation with h vermicompost improves hydrocarbon degradation by up to 34.4%. ·Bioremediation effectively removes the non-recalcitrant hydrocarbons in soil. ·Biodegradable compounds, like aro-mat i cs and branched alkanes, are less depleted. ·High molecular weight hydrocarbons are recalcitrant to soil microbial activity. ARTICLEINFO Handling Editor: X. Cao Keywords: Biostimulation Bioaugmentation Phospholipid fatty acids Total petroleum hydrocarbons polluted soils Soi l enzymes Received 6 May 2022; Received in revised form 1 July 2022; Accepted 4 July 2022 Available online 8 July 2022 0045-6535/C 2022 The Authors. Published by Elsevier Ltd. This is an open access ar t icle under the CC BY-NC license (http://creativecommons.o r g/li censes/by -nc/4.0/). Hydrocarbons (PAHs) were less abundant in this soil, results also decreased, especially for the most abundant,the phenanthrene. Despite improving the degradation rates, results revealed that recalcitrant and hydrophobic pe-troleum compounds remained unchanged, indicating that mobility, l inked to bioavailability, probably represents the l imiting step for further soi l recovery. Modern economies are characterized by a strong dependence on fossil fuels (S ima et al., 2019). However, increasing the frequency of accidental oil spi l ls and the release of petroleum derivatives cause sig-nificant environmental impacts and pose substantial hazards to human health (H ussain et a l., 2022; Kh a n e t a l., 2019). Despite numerous studies focused on decontamination strategies, it remains crucial to gain new, innovative, and sustainable techniques to reduce, degrade, and remove diverse pollutants in soils, sediments, and water bodies. Con-ventional technologies for cleaning-up contaminated soils (excavation,landfil l ing, and soil washing) and waters (treatment wi t h activated carbon or ion exchange resins) are generally energy-intensive, expen-10n sive, time-consuming, and waste-producing (You s af et al., 2022). These technologies are not efficient for treating moderate to low-level polluted sites, which stil l pose human health and environmental risk. Bioreme-diation for oil-contaminated soils and sediments is a cost-effective and sustainable clean-up technology (H ussai n e t a l ., 2018). These include landfarming, bio-pi l ing, phytoremediation, biostimulation and bio-augmentation (Mai r et a l .,, 2013). Biostimulation (BS) and bio-augmentation (BA) have unveiled good results based on improving hydrocarbons biodegradation. The difference between these two methods is that, in the case of bioaugmentation, the basis is the inocu-lation of exogenous degrading microorganisms into the soil (Wu et a l.,2017). At the same t ime, biostimulation consist s of the promotion of the degradation capacity of the autochthonous microbial communities by the addi t ion of nutrients’opt i mized formulas, carrier materials, and amendments to stimulate the metabolic functions of the microorganisms that can use the contaminants present in the soils as “feeding”sources (Kh an e t a l ., 2017). Applying soil amendments with organic residues raises the soi l ’s organic matter (OM), a crucial property intimately linked to soil fertility (Iq b al et a l., 2020). The OM helps stimulate microbial activities,mineralize resistant materials, and eliminate xenobiot i c compounds by promoting biotic and abiotic processes that rely on biodegradation and adsorption mechanisms (Mushtaq e t a l., 2020). Composting polluted soils and organic wastes or adding compost to the soil is a commonly used soil bioremediation economic method (Che n et a l ., 2015). The aerobic bio-decomposition of organic waste reduces biowaste volume by 40-50% and provides a product that acts as a soil conditioner or bio-fertilizer along with polluted soi l remediation (I q b a l et a l ., 2020; W u et al ., 2017). Vermicomposts (product of the decomposi t ion process using various species of worms) have significantly larger nutrients than composts and result in higher microbial population size and activity (D as and De k a , 2021). The hydrocarbon remediation process i s highly dependent on the pollutant load. An increased pollutant load can delay the profits of remediation using microorganisms (Hus sai n et a l ., 2022).Apar t f rom this, the hydrocarbon-i mpacted soil remediation process is highly dependent on aeration, nutrients content, organic matter, CN ratio and the presence of the hydrocarbon-degrading microbial popu-lation (Y o us a f et al ., 2022). Even if all these factors are maintained to opt i mal , the biggest chal l enge to treatment is associated wi t h aged or weathered hydrocarbon-contaminated soi l s. The aging of hydrocarbon in the soil makes the treatment process much more complex, leading to the heterogeneous spatial distribution of the pollutants, soi l structure deterioration, nutrient imbalance, and hydrophobicity. The increased hydrophobicity leads to high sorption of recalcitrant PAHs fractions between soil pores. It causes soil aging, makes the hydrocarbon less bio-accessible, and reduces the soil moisture and water retention capacity (Huss ain e t a l ., 2018). Despite all these known issues, much of the focus in the previously published research work has remained on the spiked contaminated soils that lack the aging hydrocarbon effect, while the aged hydrocarbon contaminated soi l has always remained a grey area in research and re-quires due attention. Hence the objective of the current study has been to encounter new bioremediation solutions to optimize the treatment of soils contaminated with total petroleum hydrocarbons (TPHs), including polycyclic aromatic hydrocarbons (PAHs), i n the presence o f potential l y toxic metals and metalloids. Accordingly, specifically designed bio-stimulation and bioaugmentation strategies have been tested and compared to quantify the efficacy of the hydrocarbon remediation strategy. The targeted soil matrix has been challenging since i t harbors a contamination history showing around recalcitrant long-chain hydro-carbons (C21-30), exhibiting a low bioavailability after a long natural attenuat i on lasting for years. 2. Materials and methods 2.1. Chemicals and reagents For chromatographic separation quality aliphatic hydrocarbons:Alkanes-Mix 12, 100 ug mL -in toluene (C7Hg), C8-C40 (pair no. of C,17 HC) and polyaromatic hydrocarbons: PAHs-Mix 9, in cyclohexane (100 pg mL-) were supplied by LGC standards (details i n supplemen-tary material). The certified reference CRM-357 and CRM-359 for TPH-sandy loam and TPH-clay was used, respectively (Sigma-Aldrich).Isolute Sorbent EPH (25 mL 5 g -) extraction cartridges for sample extraction and elution were used (Biotage) in the SPE-24G column processor (JT Baker). Extraction solvents, GC grade acetone (C3H6O),dichloromethane (DCM), interna l standard nonadecanoic acid (C19:0),and hexane (hx), and reagents for phospholipid fatty acids (PLFAs)determination, the analytical grade for chromatography; bacterial acid methyl ester (BAME) mix and Supelco 37 component fatty acid methyl esters (FAME) mix (CRM47885), were provided by Sigma Aldrich. 2.2. Nutrient solutions and inoculum preparation Modified BHB (Bushnell Haas Broth) solutions were prepared,e i ther for biostimulation or bioaugmentation (BHB-2) or for the treatments with VC (BHB-3), in which the amount of N supplemented by the VC was subtracted from the nutrient solution, considering a mineralization co-ef f icient of 30% (K ha n et a l ., 2016a ). BHB-2 was prepared by mixing individual solutions to reach the f ollowing added amounts (g kg- dry soil): CaCl2 0.0061; KH2PO4 0.3058; K2HPO4 0.3058; MgSO4 0.0612;NH4NO3 3.5425; FeCl3 0.0153. the FeCl3 was added separately to avoid precipitation. BHB-3 had the same sal i ne composi t ion, except NH4NO33.0454 (g kg-dry soil basis). The consortium used as inoculant was isolated from the same soil used i n this study by seria l enrichment cultures, using diesel (10 g/L) as the sole carbon and energy source (Garrid o -S a nz e t a l ., 2019). Thear(consor t ium harbors around 50 OTUs and is composed by Enterobacteri-aceae (33,56%), followed by Pseudomonadaceae (26,61%) Burkholder-iaceae (24,35%), Moraxellaceae (3,64%), Xantomonadaceae (4,40%),Rhizobiaceae (2,42%), Sphingomonadaceae (1,87%) and Rhodanobacter-iaceae (1,00%). All other fami l ies are below 1%. An aliquot of this consor t ium from glycerol stock was inoculated in a 20 mL minimal medium with gas oi l (1% v:v) as a carbon source and incubated in a rotary shaker at 150 rpm at 28°C overnight. After this incubation, the culture was centrifuged and resuspended in 20 mL of minimal medium.To prepare the pre-inoculum, 2 mL of this culture were inoculated in 200 mL of minimal medium with gas oil and cultured for 2 days in the mentioned conditions. This pre-inoculum was used to inoculate six Erlenmeyer flasks containing 2 L of minima l medium with gas oil , which was incubated for 4 days in the same conditions (20 mL o f pre-inoculum per flask). Cultures were then centrifuged at 3,800 g and 8°C for 30 min.Supernatants were discarded, and pellets were resuspended in a minimal medium, divided into 2 equa l halves, and centrifuged again to remove the remnants of the culture medium with gasoil used for consortium growth. Finally, one of the obtained pellets was resuspended in 200 mL of BHB-2, while the other was resuspended into 200 mL of BHB-3. Both samples were transferred to a 250 mL volumetric flask. Aliquots of these suspensions were collected for CFU (Colony Forming Unit ) count i ng and inoculum preparation. 2.3. Soil properties and characterization The soi l under study corresponds to a machinery park area i n Noblejas (Toledo, Spain),contaminated with different hydrocarbons,minera l oils, and heavy metals. Air-dried soil samples were s i eved at 2mm and characterized in their physicochemical properties according to standard methods. Soil pH (H20,1:5, w:v) was determined using 5 g of soil sample and 25 mL deionized water after 30 of agitation at 60 RPMs using a pH meter (GLP21, Crison). After pH determination, the soil suspension was centrifuged for 20 min at 2,000 g, fi l tered , and the electrical conductivity (EC) was measured using a conductivity meter (GLP31, Crison). Soil organic carbon and nitrogen were measured using 0.5 M K2SO4(1:8, w:v) as extractant. These extracts were centrifuged at 60 RPMs for 45 min and filtered. Then the extracts were subjected to organic C and total N analysis via a TOC-V CSN autoanalyzer (Shimadzu). Soluble ammonium and nitrate were also determined in these extracts on an autoanalyzer using the indophenol blue method and Griess reaction after reducing nitrate in a copperized-cd column, respectively (San++Skalar, Breda). Basal soil respiration (BSR) was articulated as mg CO2-C kg-dry soil h-1. For this activity, f rozen soil samples (20 g) were attemperated for 72 h at 22±0.5°C and placed in 1-Liter jars with hermetic sealing caps. The jar was provided with a beaker, acting as a gas trap, containing 4 mL of 0.5 M NaOH. After 24 h of incubation, 2 mL of 0.5 M BaCl2 were added, which led to the barium carbonate-adsorbed CO2 precipitation.Using 0.1 M HCl through an automatic titrator (718 Stat Titrino, Met-rohm), the remaining NaOH was quantified. 2.4. Experimental setup and microcosms preparation The study was conducted at a laboratory scale in microcosms con-ditions for 90 days. Six treatments have been tested, including natural attenuation as a control, biostimulation with an improved nutrient for-mula,biostimulation with vermicompost (VC), and the same treatments with bioaugmentation. In the case of the bioaugmentation treatments,the microbial consortia inoculated corresponded to the native microbial population previously isolated from the soil site under research , which has been characterized and cultured as part of the tasks developed wi t hin the framework of the European GREENER project. In the pres-ence and absence of VC, six different incubation treatments were pre-pared using biostimulation and bioaugmentation strategies. These included control soil (abbreviated as CT), biostimulation of soil (added wi t h BHB-2, abbreviated as BS), bioaugmentation of soi l (inoculated with consortium suspended in BHB-2, abbreviated as BA), vermicompost amended control soil (abbreviated as VCT), VC aided BS of soil (VC +BHB-3, abbreviated as VCBS), and VC aided BA of soil (VC + consortium suspended in BHB-3, abbreviated as VCBA). The CT was a control of natural attenuation effects over the bioremediation soil. Prior to the initiation of the experiments, the polluted soil was sieved to 2 mm and watered to reach 40% of soi l water holding capacity (SWHC); to high-light , on day 43rd, when the second consortia inoculation was carried out, the SWHC was increased to 50%, using this volume of water to introduce the inoculum and nutrient solutions. Each treatment was prepared by mixing soil, amendments, and solutions using a concrete mixer and immediately distributed by weighing 200 g of dried soi l i nto 1 L hermetic containers. A f inal concentration of 10 CFUkg-soi l was applied for the respective BA treatments. The same procedure was repeated for the second inoculation (on the 43rd day), but the final suspension was made in 100 mL of nutrient solutions. Samplings were taken 2, 15, 30, 45, 60, and 90 days of treatment. Four experimental replicates for each sampling point and treatment were maintained. The incubation was conducted in a chamber under controlled temperature conditions (22 ±0.5°C). Individual microcosms were opened and mixed weekly (twice) to control the moisture and soi l aeration. At the end of each sampl i ng point, soil samples were divided to perform different types of analysis: 70 g was dried in an oven at 30 °C for 48 h,and the remaining fraction was frozen at -20 °C for subsequent exper-iments. Control samples of day 0 for each treatment were also i ncluded. 2.5. EPH quantification, LC fractionation and GC-MS qualitative study Extractable petroleum hydrocarbons (EPH) were extracted from 1 g soi l samples (dried at 30 °C) and 20 mL of mixture C3H6O: hx (hexane)(1:1, v:v) in a microwave extraction oven (Ethos X, Milestone, Sorisole,Italy) at 150 °C for 20 min. The cold mixture was subjected to centri-fugation for 30 min at 2,500 g. The resulting supernatant was f iltered (though 0.22 um fil ter) and evaporated to a volume of 1 mL in a rotary evaporator (SAVANT SPD111V, Thermo). Before sample loading, the extraction cartridges were condi t ioned with 30 mL hx, preventing the drying of cartridges. After loading the sample at ambient pressure,elution was performed using 12 and 20 mL of hx and DCM (dichloro-methane). The two fractions produced were evaporated above 1 mL and injected into a Varian 3900 gas chromatography (GC) instrument pro-vided with a flame ionization detector (FID) device and a Varian CP8907capillary column (25 m, 0.25 mm i nner diameter, with the f ilm thickness of 0.25 mm). Spitless injection mode was performed with 250 °C of injection temperature and 3 uL of injection volume. The oven operating conditions were: initial temperature 80 °C, raising to 200°C at 7°C min-, then reaching 300 ℃ at 11 °C min, which was maintained for 17 min. Helium was the carrier gas (74 kPa). The FID operated at 325℃and 20 Hz. The detected aliphatic and aromatic fractions were defined based on carbon or equivalent ranges. Equivalent carbon numbers denote an assigned value to a petroleum mixture f raction, empirically derived from the fraction normalized boi l ing point compared to the boiling point of n-alkanes or the n-alkanes retention t i me in a boil i ng point GC column. Hydrocarbon extraction was performed with 90-day samples for al l tested treatments. column LC. Using hx and DCM as eluents, maltenes and asphaltenes were segregated using 0.45 um f ilters. Maltenes were further fraction-ated into three fractions using LC columns, f i lled with silica gel and alumina. Aliphatic hydrocarbons (Fraction 1) through hx, aromatic hydrocarbons (fraction 2) with DCM: hx (7:3, v:v), while polar com-pounds (fraction 3) using DCM: MeOH (1:1, v:v), were eluted. LC fractions were analyzed with GC-MS (QP-2010 Plus, Shimadzu).Helium as carrier gas at 1 mL min - was used in the capillary column (DB-5 ms). The specification of the capi l lary column was 60 m x0.25mm i.d. ×0.25 um film (Agilent Technologies), packed with phenyl and dimethylpolysiloxane at 5:95%, respectively. The initial temperature of the oven was maintained at 50 °C for 2 min. Later the temperature was ramped at 2.5℃ min-up to 310C and maintained for 45 min. The GC-MS worked in electron ionization (EI) mode at 70 eV, with autotuning calibrations performed using perfluorotr i butylamine. The full-scan mode was used to obtain the chromatograms, with mass range for acquisition ranging from 45 to 500 m z-. NIST 2014 Mass Spectral Library (NIST 2014/EPA/NIH) was used to identify the compounds. 2.6. Soil enzyme activities Enzyme activities were measured using fluorogenic MUF or AMC-substrates in 96-microtiter plates (Marx et a l ., 2001). The studied ac-tivities included acid phosphatases (EC 3.1.3.2 -AcPA), alkaline phos-phatase (EC 3.1.3.3 - AlkPA), a-glucosidases (EC 3.2.1.20 - aGA),p-glucosidases (EC 3.2.1.21 -bGA), N-acetyl-p-glucosaminidase (EC OSI SaI 3.2.1.30 bNAG), p-xylosidase (EC 3.2.2.27 bXyl ),leucine-aminopeptidase (EC 3.4.11.1 - LeuAMP) and sulfatase (EC 3.1.6.1 AS). These activities were analyzed using amino-4-methylcoumarin (AMC) and 4-methylumbelliferone (MUF)derivatives as substrates. A frozen sample (1 g oven-dry) was suspended in 20 mL of deionized water in steril i zed conditions. For homogenous suspension, soil samples (ice cold) were subjected to pulsed sonication (40 W) for 2 min. Aliquots of 50 uL were used for analysis with eight analytical repl i cates. 50 uL Modified universal buffer (MUB) at 500 uM was used to analyze each enzymatic activity. Specifically, MUB for AcPH and bGA has a pH of 5, for t he activities of aGA, AS,bNAG, and bXy l pH was maintained at 6, while pH 9 and 10 were kept for AlkPA and LeuAMP, respectively. Plates were sealed to prevent evaporation and kept at 30 °C for 180 min under agitation at 150 RPMs. Tris buffer (50uL) at pH 12 was added to stop the reaction and immediately analyzed using a fluorometric plate-reader (GENios, TECAN) with 360 and 450nm excitation and emission filters. Fluorescence was converted into an amount of MUB or AMC according to calibration standards (0-1,500pmol) prepared on each plate to consider the degree of fluorescence quenching through soil particles and OM. 2.7. Determination of phospholipid fatty acids B lig h an d Dy e r (1959) proposed method to extract the PLFAs, was used. Chloroform (CHCl3) was used to redissolution l ipid fractions, and the fractions were later added to silica columns. Fractions of neutral lipid and glycol i pid were eliminated using CHCl3 and C3H60 (respec-tively), and phospholipids were eluted using MeOH and dried with the help of rotary evaporation. The sample was redissolved with C7Hg and added with an internal standard (C19:0, Sigma-Aldrich). Alkaline methanolysis was performed to make fatty acid methyl esters (FAMEs)derivates. The FAMEs were extracted using 2 mL hx twice, followed by drying and redissolution n-octane (100 uL). Agilent 6890 N GC system was used for FAMEs quant i fication. The system provided FID detection with a Supelco Omegawax 320 fused si l ica column (30 m in length), film 0.25 um, ID 0.32. The operation temperature program of the system was as follows 140-170Cat 2C min -, maintained for 30 min, followed by 170-260 ℃ at 5 ℃ min -, maintained for 20 min. Commercial stan-dards, BacMix and FAMEmix (Sigma Aldrich), were used for the FAME peaks identification, as proposed by P al oj a rv i (2006). The individual FAMEs abundance was expressed in nmol g-l of dry soil. Fatty acids i15:0, a15:0, i16:0, 10 Me16:0, i17:0, Me18:0 (PLFA Gram+) were used for the representation of Gram-pos it ive bacteria,while c16:1w9c, cy17:0, and cy19:0 (PLFA Gram-) for Gram-negative bacteria. The sum of both represents total bacterial PLFAs (PLFA Bac-teria ). Fungal PLFA was considered the sum of c18:2a6,9t and c18:206,9c (PLFA Fungi), and the sum of 10Me16:0 and 10Me18:0 was considered for Actinobacteria. The sum of all fatty acids quantified total PLFA to represent total microbial biomass. 2.8. Statistical analysis The mean and the standard error of at least three independent experimental replicates were calculated for all variables. Normality and homogeneity of var i ances assumptions were assessed with Kolmogorov-Smirnov and Levene tests, respectively, using treatment as the f i xed factor, and the data were analyzed with ANOVA (ANalysis Of VAriance)wi t h a significance of p ≤0.05. Then, the treatments were compared with the Tukey's or Dunnett 's (only for PAHs) posthoc tests. All statis-tica l analysis was performed on a statistical package for socia l sciences (v22.0 for Windows). 3. Results 3.1. Soil and organic amendment characterization Soil collected from the machinery park area in Noblejas was sandy-loam texture (11.8 clay, 29.8 sil t , and 58.3 sand, percent respec-tively), with bulk density 1.51 g cm, highest water retention capacity (HWRC) 25.33%, pH (1:5) 7.1, electrical conductivity (EC 1:5) 0.839 dS m-, loss on ignition (LOI) 3.85%, oxidizable organic carbon 2.59%,total N 0.02%, nutrients (mg kg-): NH4-N 2.99; NO3-N 0.14; PO4-P 0.10, lime content 35.08%, trace elements (mg kg): As 77.3; Cd 7.8; Cr 14.9; Cu 8.5; Ni 9.9; Pb 339.2; Zn 680.5, and total petroleum hydro-carbons (TPHs): 4051.0 mg kg. As an organic amendment, vermicompost (VC) from agro-industrial wastes (ROPULPAT, Spain) was used at a rate of 2% (w:w). Physico-chemical VC properties were as follows: pH(1:5) 7.0, EC (1:5) 3.157 dS m-, total organic carbon (TOC) 33.3%, and total nitrogen (TN) 2.9%.VC has been included as an organic amendment since i t, i n principle,leads to better hydrocarbons'adsorption, fi l tering, and degradation. 3.2. Biodegradation of TPHs EPHs Fig. 1. (A) Content of Extractable Petroleum Hydrocarbons (EPHs) at the end of the 90 days incubation period; (B) Content of Polycyclic Aromatic Hydro-carbons (PAHs); and (C) phenanthrene at the end of the 90 days incubation period. Columns with different letters displayed signi f icant statistical differ-ences (one-way ANOVA, fol l owed by Tukey’s post -hoc test wi t h significance def i ned at p <0.05). DW: Dry Weight. observed compared to the untreated control soil, either with or without VC addition. The results were not statist i cally significant. Specifically,the phenanthrene, the most abundant PAHs present in the soil under-study, was signi f icantly reduced after the VCBS and VCBA treatments (Fi g. 1B), f rom 0.052 mg kg - in t he control soil to 0.0265 mg kg-in both treated soils (BS and BA). It should be highlighted that, in this soil , EPHs corresponded to the TPHs fraction since the composi t ion was dominated by medium and high molecular weight i n both l inear al i phatic and aromatic hydrocar-bons (F i gs. 2 an d 3). In contrast, the volatile fraction was almost completely depleted, and this distr i bution did not change along with the 90-day incubation (CT). EPH f ractions are displayed i n different ranges as a function of the length o f carbon chains and are shown in Fi g. 2A and B for aliphatic and aromatic hydrocarbons, respectively. Aliphatic hy-drocarbons (designated as Cn, where “n" is the number of C) in the ranges of C22-C35 and>C35 accounted for 79.4% of total EPHs con-tent. For the aromatic hydrocarbons fraction (EC), EC22-EC35 and >EC35 accounted for another 15.0%. In the case of the aliphatic frac-tion, these long-chain hydrocarbons (C22-C35) represented the most degraded fraction during the i ncubation period and showed an apparent effect of soil microbial stimulation and inoculum addition while higher molecular weight hydrocarbons (>C35) were more recalci t rant against biodegradation . In the case of aromatic hydrocarbons, low molecular weight compounds (EC10-EC16) nearly disappeared in the treatments with vermicompost and microbial inoculation, whereas the highest molecular weight compounds displayed a similar pattern as described for aliphatic. Fig. 2. Molecular ranges of EPH after liquid fractionation between al i phatic (A)and aromatic (B) hydrocarbons fractions at the end of the 90 days incubation period. Columns between fractions with di f ferent letters displayed significant statistical differences among treatments (One-way ANOVA, followed by Tukey's post -hoc test with significance defined at p <0.05). DW: Dry Weight. 3.3. GC-MS qualitative study In the chromatogram in Fi g. 3C, the initial product displayed a fingerprint with a predominance of li near alkanes from 15 to 38 carbon atoms, enriched in heavy l i near alkanes (with the maximum in 27 car-bon atoms). It also shows a prevalence of linear alkanes over branched alkanes (n-C18 Phytane -ratio slightly above 1) and a moderate UCM (Unresolved Complex Mixture), thereby revealing an i nitial moderate degradation and weathering of the hydrocarbons i n soil. On the con-trary, after 60 days of incubation in the VCBA treatment (Fi g 3C), the linear alkanes were depleted entirely (n-C1 Phytane -=0); branched Time Fig. 3. Tota l Ion Chromatograms (TIC) represented in 3.A are 3.B are showing representative F3 fraction fingerpr i nts, (A): C T control initial; (B): VCBA treatment after 60 days. Note tha t most of the compounds identified in the control (oleochemicals) were fully degraded after 60 days, this process was accompanied with a remarkable reduction of the UCM thereby revealing an almost complete depletion of fraction F3. E: epoxioctane, FS: Fatty acid (saturated) esters; OAE: Oleic acid ester;PUFA: Fatty acid (unsaturated) esters; P: plasticizer; UCM: Unresolved Complex Mixture. SIM (Single Ion Chromatograms) showing representative F1 fraction f ingerprints of CT control initia l (top) and VCBA treatment after 60 days (down). While 3.C. shows the SIM chromatograms (m z-1 =57) of alkanes, and 3.D SIM chromatograms (m z-1=191) of hopanes. nCn: Linear alkanes of n'carbon atoms; Ph: Phytane (branched alkane); *: Other branched alkanes; Hx: Hopanes (x is the carbon number);Ts: 18x(H)-22,29,30-trisnorhopane; Tm: 17o(H)-22,29,30-trisnorhopane; UCM: Unresolved Complex Mixture. 3.4. Changes in soil properties The most signi f icant results on the measured soil parameters and their evolution during the incubation strategies are displayed i n Ta ble 1.Soil pH values did not change significantly i n the control soil (CT) during the whole incubation period; however, clear acidification was observed in the rest of the treatments, especially during the first 15 days. This acidification i s associated with the introduction of inorganic and organic nutrients in the case of BS and VC treatments, respectively, and could be related to increased CO2 production due to OM mineralization. The second inoculation (BA and VCBA) on day 43rd only provoked a slight decrease in the pH values on day 45th as compared with the control soil (CT) or the vermicompost-soil mixture (VCT). Values of electrical conductivity (EC; Tabl e 1) of the control soils,both with and without VC, displayed slight variations during the incu-bation. These values were lower than those observed for the samples subjected to biostimulation and bioaugmentation, reflecting the effect of nutrient additions. At the end of the incubation periods (before and after microbial consortia inoculation, i.e., days 0 and 43rd), a small drop in EC values was l ikewise observed due to the microbia l consumption ac-tivity. Regarding the evolution of available P and K levels (T ab le 1), a different behavior was displayed compared to the EC parameter. In this case, the application of 2% vermicompost increased by more than five and two times the amounts of available orthophosphate (P-Olsen) and exchangeable-K, respectively, as a direct consequence of the organic amendment addition. The nutrient level increase was observed between BS-BA and VCBS-VCBA. These treatments presented the highest values of exchangeable-K and available orthophosphate throughout the whole incubation, except for day 45th, where the latter’s levels reached similar values in al l the treatments after the nutrient's addition. Finally, the values of extractable organic C (EOC) and tota l extract -able N (TEN), as a proxy to test the availability of C and N, are displayed in Tabl e 2, respectively. Initial values of EOC were similar for all the treatment s , being this particularly unusual i n regolith soi l s, such is the case of the one used in this work, this being exclusively attributable to the presence of the soluble organic pollutants. For VCT samples, after an initial decrease in EOC observed during the first f ifteen days, values remained consistently higher than in CT samples due to a probable priming effect of the incubation condi t ions. This increase in EOC was probably due to the depolymerization of macromolecules and the concomitant release of soluble low molecular weight compounds. This ef f ect was also responsible for the higher values of EOC in BS and BA treatments, with and without VC addition. For TEN, a different situation was observed, where the initial depletion in this soi l (CT) was noted even after the VC addition (T ab le 2). The low amount of VC added (2% w Table 1Impacts of applied treatments on the physio-chemical parameters of TPHs contaminated soil with reference to incubation intervals. Treatments Control Days pH EC P K NV V NV V NV V NV V 2 7.58±0.12 7.62±0.09° 0.71±0.04 0.68±0.04 5.00±0.74a★ 23.71±3.37* 64.04±1.84a* 146.09±5.20a★ ab a 15 7.53±0.04 6.77±0.26* 0.73±0.02 0.75±0.02 4.91±0.30ab* 18.09±9.35 60.97±0.76ab* 133.09±24.86* bw a ab abw 30 7.50±0.00 6.89±0.03 0.74±0.02 0.75±0.03 4.86±0.11ab* 19.34±5.71 59.44±1.91 bc* 131.12±4.98* bw cd* a ab ab六 45 7.47±0.04 6.99±0.41 0.75±0.02 0.77±0.01a 4.82±0.21abw 14.65±5.04bw 57.91±3.12 bcw 137.23±26.27* b★ bc★ a 60 7.63±0.08 7.13±0.17b* 0.73±0.06 0.73±0.04 4.60±0.59ab* 19.74±1.06 60.30±2.39bc* 142.44±6.30* a ab abw 90 7.67±0.07 7.01±0.17bw 0.71±0.04 0.71±0.04 4.26±0.20b* 22.35±2.59 56.81±3.04** 143.54±5.29a* aw a bc ab+ Biostimulation 2 7.12±0.18° 7.20±0.03 1.22±0.08 1.42±0.13 b 30.68±7.58b* 56.11±4.58* 227.28±36.96* 358.85±34.63* C 15 6.58±0.06° 6.58±0.08“ 1.30±0.05 C 1.41±0.08 25.35±0.85b* 40.79±3.88d* 243.48±12.46* 333.04±11.71* 30 6.78±0.09 6.74±0.05 1.31±0.05 1.36±0.05 24.44±2.24b* 45.67±4.39 cd☆ 254.41±18.00* 317.32±13.14* 45 6.80±0.05 6.84±0.05b 1.89±0.16 1.88±0.16° a 40.73±7.00a★ 87.02±18.65 320.27±26.98 488.77±47.90a* a a* b* 60 7.11±0.04 7.25±0.04 1.73±0.12 1.92±0.10° a 47.14±5.58a* 97.91±7.52a* 353.84±9.75* 471.78±11.98 b abw 90 6.99±0.07 7.19±0.06a* 1.74±0.04 1.78±0.08 47.80±5.04* 72.46±10.51 358.04±5.98* 429.09±32.84 aw b bw bw Bioaugmentation 2 7.31±0.10 7.18±0.06 1.28±0.03 1.46±0.04” 30.15±4.82C★ 76.81±13.32 241.49±10.33C* 375.27±21.28 C a古 b士 15 6.60±0.04° 6.56±0.02 1.30±0.09C 1.44±0.06 21.39±0.51d* 57.27±8.81b* 246.51±11.34* 369.36±36.56b六 30 6.84±0.04‘ 6.73±0.02“ 1.19±0.04C 1.27±0.07 26.59±3.74cd* 48.02±7.88* 238.56±10.50* 327.96±21.54* 45 6.86±0.03d 6.87±0.06° 1.68±0.02b 1.99±0.31° 45.90±3.50bw 77.83±5.64a* 349.68±20.52ab+ 496.97±30.30a* 60 7.18±0.05 7.19±0.04 1.85±0.10 2.01±0.12 58.32±4.09a* 古 74.31±5.40a* 古 372.32±13.64* 497.39±28.45* a 90 7.10±0.01° 7.07±0.03” 1.70±0.10 b 1.85±0.09a 47.70±5.61b* 74.49±2.13a* 344.22±26.27 b六 521.36±17.45* Table 2 Impacts of applied t reatments and i ncubation on extractable organic carbon and ni t rogen , and basal soil respiration of TPHs contaminated soil. Treatments Days EOC TEN BSR Control NV V NV V NV V 2 2341.17±114.24 2331.01±71.94 27.82±0.22b* 81.18±3.22* 0.54±4.29D 0.69±0.19° 15 2249.15±61.17 ab 2119.95±47.94 22.66±0.19* 44.31±1.22b* 0.50±2.02b* 2.48±0.34* 30 2203.14±40.09” 2429.45±67.73 20.08±0.17cd* 44.95±5.84D* 0.48±0.95* 2.33±0.13a* 45 2157.13±33.94b* 2491.95±74.60ab* 17.50±0.16e* 46.65±4.39b* 0.46±0.59b* 2.15±0.22a★ 60 2217.72±97.37b* 2561.68±46.40a* 33.94±0.28* 47.15±2.57b* 1.03±5.30a* 2.19±0.17a* 90 2347.32±23.10aw 2584.86±62.42a* 27.22±1.84bw 43.58±3.22bw 0.78±0.26abw 1.77±0.31bw Biostimulation 2 2357.27±83.24 2473.96±94.53 1024.04±86.34b* 839.28±78.49b* 0.33±0.09 0.44±0.03° 15 2474.22±32.05 2389.59±27.68 841.40±27.66* 703.40±57.20* 17.64±1.15* 21.74±1.28* 30 3157.26±168.32 2750.79±56.56 710.18±18.727d* 575.01±33.52d* 4.26±0.15” 5.52±0.29 45 3155.56±123.73 3009.84±112.01” 1198.54±42.41a* 1049.34±37.74★ 3.16±0.13 3.20±0.87° 60 3353.40±89.55 3150.14±113.78 1256.01±8.33* 1073.69±64.19a* 2.47±0.27“ 2.31±0.13° 90 3339.97±82.55 3333.55±154.72 1236.03±37.18* 1069.01±72.47* 1.77±0.16 2.45±0.59 Bioaugmentation 2 2197.27±59.66d* 2532.44±55.81C* 961.51±0.25 943.95±91.14 0.79±0.25 0.46±0.26° 15 2576.80±77.08 2555.47±113.93 789.35±0.33 774.34±50.16 17.84±0.33° 17.36±1.31 30 2696.98±57.38b* 3029.71±106.40 D* 651.44±0.29 545.06±68.58 4.31±0.28 5.19±0.17 45 2666.36±40.4bw 3126.37±121.71 abw 1194.71±0.01 1132.01±157.01 2.88±0.01 3.84±0.32 60 2909.94±29.08* 3260.97±106.02★ 1219.05±0.24 1234.27±101.89 2.47±0.23° 2.46±0.45° 90 2926.73±52.63* 3258.03±94.61* 1164.64±0.27 1230.02±95.09 1.57±0.26° 1.64±0.12 3.5. Evolution of biological parameters In order to complement and correlate the above-mentioned quant i -tative results on contaminants’ degradation efficiency and soil param-eters evolution, Basal Soil Respiration (BSR), enzyme profi l e activity,and PLFAs evolution were carefully analyzed. During the f i rst incuba-tion (2nd day), all the samples displayed very low BSR values. In control samples (CT), these values remained constant during the whole incubation period, exhibiting a small increase only on day 45th, asso-ciated with the increase in soil humidity applied to reach 50% of the HWRC (T ab le 2). In contrast, the rest of the treatments evinced a sub-stantial increase in BSR on day 15th, where VCBS samples displayed the highest values (nearly 50 times higher than the initial value), being growth lower for VCT (5 t i mes higher than the initial value). The assimilation of the nutrients and the degradation of the most labile organic fractions, probably including low molecular weight aliphatic and aromatic hydrocarbons, could be associated with the increased values encountered for this parameter. On the other hand , despite the substantial increment in nutr i ents, such as the associated release of available N, P, and K, the second inoculation or nutrient addition was only responsible for a l imited rise in BSR. The absence o f labile organic fractions to support the microbial activity of a microbial consortium specialized in diesel degradation, as in the current study, could explain the observed l ack of microbial growth. The evolution of soil microbia l activity i s complemented by assessing the evolution of the enzymatic activity profile for the samples at four di f ferent times: 2, 15, 45, and 90 days. The resul t s are presented in T ab l e 3. After 2 days of incubation, the soil enzyme profile for the control soil reflected the lowest microbia l activity in the polluted soi l .This profile did not significatively vary with the addition of the micro-bia l consortium, but more signi f icant changes were observed for BS and the samples with VC. In these samples, al l activi ti es were increased,mainly phosphatases (alkPA but also AcPA), chitinases (bNAG ), and proteases (LeuAMP), which supposed an increase in their catabol i c ca-pacities. This feature was maintained on day 15th, where a general i n-crease in all the enzyme profiles was observed, and i t definitively changed on day 45th, after the second inoculation. At this time, a marked increase of bNAG and, to a lesser extent, in bGA (mainly for BA,BS, and VCBA samples) was observed. This enzyme prof i le was also observed at 90 days of incubation, except for AlkPA and bNAG activities,which showed a lower trend. This substantial increase of bNAG, one of the enzymes involved in the f inal process of chitin degradation, could be associated with the initial and severe fungal development observed during the first 15 incubation days and considering that the mycelia were mixed with the soil during the periodic soi l aerations of micro-cosms (T a bl e 3). 4. Discussion Traditionally, three bioremediation strategies for TPHs pol l ution have been used: natural attenuation, biost i mulation, and bio-augmentation (K h an e t a l.,, 2016b; H u s sa in e t a l ., 2022). Natural Enzymatic profile of TPHs containment soil with different applied treatments and incubation durations. Treatments Days Control Biostimulation Bioaugmentation NV V NV V NV V Acid phosphatase 0 13.56±0.28 71.76±1.49* 23.02±0.48* 72.13±1.49★ 20.49±0.42* 85.52±3.54* 10.53±2.04ab, 90.24±17.95a* 22.2±4.31aw 66.83±18.17 aw 43.04±10.65a 83.02±23.04a, 7.49±3.98 69.65±10.2★ 17.62±1.62* 67.06±28.5a* 27.51±16.47abw 48.07±14.18bw 11.23±5.32ab: 72.6±43.46★ 25.44±11.04* 62.67±30.47 13.3±4.87* 55.06±22.97b* a-glucosidase 1.43±0.03* 17.82±0.37 2.36±0.05° 14.99±0.31 3.15±0.07 11.50±0.48D: 5.05±2.05 bcw 108.12±15.87aw 39.77±1.72 106.21±19.84Da 89.43±21.06Dw 170.55±46.85 8.66±4.09b* 60.45±13.65b* 152.49±23.76 203.96±48.55* 132.05±38.19 188.9±72.62a★ 16.87±6.17 47.2±10.72bw 143.29±82.21 146.94±41.37b 126.13±16.61出 196.65±24.64 β-glucosidase 0.87±0.03bw 3.91±0.08* 2.59±0.46* 4.57±0.09a* 2.78±0.06°a 2.42±0.10° 0.89±0.03bw 4.22±0.64 2.65±0.47° 3.57±0.79* 1.92±0.86* 5.14±2.91a 1.77±0.05 6.64±2.06b: 2.56±0.47 4.93±1.98 1.61±0.51a 3.38±1.58 1.39±0.69abw 10.64±1.51a* 2.49±1.113* 4.68±1.88a* 1.79±0.214 4.18±1.27 β-xylosidase 0.43±0.01a* 5.89±0.12 1.19±0.02c* 7.98±0.17bw 4.23±0.09 4.51±0.19° 巧0巧0巧0巧0 1.05±0.66 12.64±1.09a★ 9.11±2.06b六 20.95±5.45* 11.08±2.34an 26.14±6.21a★ 1.67±1.31a* 10.34±3.12abw 13.25±1.36aw 20.49±3.29* 11.02±2.16* 19.73±7.14ab= 9.28±1.68bw 9.62±4.4ab 12.36±2.75 8.90±2.83 12.55±2.68c N-acetyl-p-glucosaminidase 13.38±8.42b* 26.36±0.55bw 2.59±0.05b# 19.48±0.40n* 5.60±0.12** 15.47±0.64 161.91±11.38a* 51.24±20.98b 44.18±22.87 159.36±30.54b# 137.43±76.32 23.9±16.83b* 127.66±33.69* 466.27±190.45 ** 307.25±137.39 621.91±112.39* 293.44±71.72 Sulfatase 90.1±37.01 aw 138.71±35.07* 1.54±0.27* 316.96±116.45* 537.67±94.66* 419.85±53.38* 0.65±0.03b* 3.71±0.08* 1.59±0.27 4.71±0.10a* 2.66±0.06 2.91±0.12° 1.33±0.06 3.93±0.55 1.60±0.65 3.12±0.63* 1.32±0.24bw 2.48±1.17 巧0巧0巧如 0.26±0.19 3.44±1.42** 1.61±0.92 4.36±1.70* 1.02±0.17bw 3.56±1.13 Alkaline phosphatase 8.99±0.19b* 179.2±3.71b+ 31.32±0.65bn 42.44±0.88b 12.18±0.25b= 66.80±2.77 92.90±70.6* 489.12±109.78★ 93.02±45.41abw 164.42±62.07★ 248.44±74.54 64.82±20.74 372.87±144.3* 178.24±103.45° 153.78±35.42° 76.41±15.14ab* 161.93±54.41 ab, Leucine aminopeptidase 7.48±0.15* 15.44±0.32b# 31.29±0.65* 13.34±3.28* 6.96±0.14* 246.5±78.89 7.35±0.43 34.68±4.65* 17.54±6.84bw 25.35±6.88* 30.16±7.27 0巧 7.23±0.86 38.70±15.2** 17.60±2.86 19.22±6.86 21.24±6.94 30.69±16.47 7.82±4.18 26.81±6.96abs 15.83±4.76 16.83±6.77 22.38±5.57 21.38±11.44° Fig. 4. Changes i n soi l microbial community measured using PLFAs as biomarkers: (A) Gram + bacteria, (B) Gram-bacteria, (C) Total bacteria, (D) Fungi, (E) ac-t i nomycetes and (F) Total PLFAs. Different letters (capital and small letters, for 15 and 90 days, respectively) displayed significant statistical differences between treatments at the two i ncubation times (15 and 90 days). One-way ANOVA, followed by Tukey's post-hoc test with significance defined at p <0.05. DW: Dry Weight. sequestration mechanisms occurring in the matrix of the organic amendment mixed with the soil. Although more results are needed to understand PAHs alleviation in soils via bioremediation, this problem was not the main challenge to address in the current study s i nce the original PAHs values were not high in terms of toxicity and threshold limits. The pol l uted soil used in this experience is a regolith more than a proper soil, as it is comprised of pickling layers of surface soils affected by diesel and oil spills in a machinery park. Organic matter was close to 4%, compris i ng the targeted organic pol l utants and , consequent l y, is challenging to use as substrates for microbial growth. The contents of other vi t al nutrients, such as N or P, are depleted in this soi l. Applying a BHB-culture media had a clear response in activating microbial activity.I t was reflected in the increase in BSR observed in the BS treatment after 15 days of incubation. This increased microbial activity was also re-flected in the soil enzyme profile, which displayed an increment in the activity of the APA and proteases, clearly linked to bacterial growth i n the f i rst days of the incubation period. The stimulation of microbial metabolism was correlated with the observed degradation of TPHs. In this work, a consort i um isolated f rom the pol l uted soi l was grown in a culture media in which diesel oil was added as a sole carbon source.The isolated consortium had similar features to a previously isolated consor t ium from another diesel-polluted soil (G a rr i d o -S anz e t a l., 2019),and its microbiome was dominated by bacterial species of the genus Pseudomonas, Achromobacter, Cupriavidus, Comamonadaceae, and Sphin-gomonadaceae. Metagenomic data identified redundant genes encoding enzymes i mplicated in the ini t ial oxidation of alkanes: alkane 1-mono-oxygenase (AlkB), long-chain alkane monooxygenase (LadA), cytochrome P450 alkane hydrolase (CYP153 family), and a variety of hydroxylating and ring-cleavage dioxygenases, involved in aromatic and polyaromatic hydrocarbon degradation that assured an efficient degradation of com-0111plex mixtures, such our polluted soil (G a r rido -S a n z et a l ., 2019). Our results displayed an increase in the degradation capacity of TPHs pro-moted by the specific microbial enrichment of the polluted soil . How-ever, this was insufficient to degrade high molecular weight aliphatic and aromatic hydrocarbons. The i mmobilization of recalcitrant TPHs,such as branched aliphatic, PAHs and substituted aromatic hydrocar-bons on some soil constituents like mineral clays or humi f ied organic materials, reducing their bioavailability to soil microorganisms, is a critical limiting factor in the bioremediation of an aged and polluted soil (Hu s sain et a l., 2022). In the present study, the microbial activity increased after compost and nutrient addition due to acidification of soil solution, resulting in more than one pH unit variation, which seems to be responsible for an essent i al effect in the solubility of P and other micronutrients and the predominance of di f ferent microbial groups. However, the second inoculation had a lower effect on soil respiration and nutrient con-sumption such as N and P. Many studies have already reported the effectiveness of bioaugmentation with microorganisms, either individ-ually or in a consortium (W u et al ., 2017). However, adding different microbial communities does not always have an additive effect, and sometimes, microbial competition for soil resources or changes in nu-trients'ratio (C:N:P) leads to microbial inhibition (Hu s s a i n e l a t ., 2022;Kha n e t a l ., 2016a b ). Degradation of hydrocarbons is often the result of a community-interacting microbial population, either structurally or functionally, and bioremediation’s potential depends on these organ-isms'ability to adapt to new environmental conditions (Mi sh ra e t a l .,2021). In this work, bioaugmentation and biostimulation increased soil TPHs’degradation capacity. Nevertheless, no statistically significant differences were observed with the biostimulation treatments either with or without vermicompost addition. A second inoculation or nutrient addition on day 43rd of the incubation did neither display an apparent effect i n soil microbial activity; accordingly, it seemed like the second introduction of nutrients would be unnecessary with an evident accumulation of some of them, such as N and P. A comprehensive understanding of how bioremediation influences the diversity of the soil microbial community is key to gett i ng better insights i nto the behavior and f unction of t hese populations and corre-lating this with pollutants degradation in every situation (N a ren -d r ul a -K o t ha an d Nko n g olo , 2017). PLFAs were used as valuable viable or active microbial biomass biomarkers in our study. These are mem-brane lipids rapidly metabolized and decomposed outside the cell, as demonstrated by (L e we et a l., 2021). The functional adaptation of the soi l microbial community reflected in the dynamics of individua l hy-drocarbons was mirrored by structural adaptation reflected in PLFA dynamics expressed by a site-specific PFLA ratio (N a r e n d r ula -K o th a and N k o ng o l o, 2017). Ma ir e t a l. (2013) reflected the correlation between PLFA determinations and TPH degradation in a hydrocarbon-contaminated soil from an Alpine former military site,testing the effects of temperature and biostimulation. Their data demonstrated the suitability of PLFA analysis for profiling microbial communi t ies in hydrocarbon-contaminated soils. C h e n et a l . (2015)showed that temperature significantly i nfluenced fungal to bacterial PLFA ratios and Gram-positive to Gram-negative bacterial ratios in pyrene-contaminated soil bioremediation with compost. The PLFA pattern in several pans of a site contaminated with PAHs, in which landfarming with biost i mulation and bioaugmentation was tested, also evinced the enhancement of Gram-negative Pseudomonas spp. at the end of the experience (G e or g e a n d Wa n,2020). Gram-positive bacteria were predominant in the current study, with a higher amount present in the treatment with vermicompost (VCBA and VCBS) at the beginning of the experience (15 days). Whereas fungal components were i ni t ially higher in both BA and VCBA, the trend changed at the end of the incubation,as fungal PLFAs increased in BS and VCBS. Gram-negative bacteria and actinobacteria groups were mainly in higher abundance at the end of the experience. Again, these results prove the variations of the microbial community's predominant groups in every situation. It depends on the treatment and remediation ti me. Petroleum components are classified into bulk groups of saturates, olefins, aromatics, resin (including a wide variety of compounds containing sulfur, oxygen, and nitrogen), and asphaltenes. Initial contamination presented a prof i le enriched i n heavy l i near alkanes suggesting a previous moderate weathering (G a lle g o e t a l., 2011). The SARA fractionation procedure is commonly used to ident i fy which fractions of the polluted soil are degraded during the remediation experience. Despite the good microbial growth in respira-tion, enzymatic activity stimulation, and nutrient consumption, results suggested that recalcitrant and hydrophobic petroleum compounds remained unchanged, revealing that mobility is linked to the bioavail-ability of these pollutants, the probable limit i ng step for soil recovery.The GC-MS study revealed a typical fingerprint of lubricant oils (Y a ng et al ., 2016), including a mixture of aged hydrocarbons. Polar f ractions,mainly composed of non-hydrocarbon oleochemicals, were in coherence wi t h the activi t ies in the study site (machinery park area) and rapidly consumed along with the experiments. Similar f indings were reported by S oni and Agarwa l (2014). Also, linear alkanes were depleted entirely,whereas branched alkanes such as isoprenoids and aromatics were moderatelydegraded in n coherence with the reduction of medium-weight hydrocarbons observed in the quant i tative study (F i g. 2). Consequently, the predominant compounds were hopanes after the t reatments, a recalcitrant heavy-weight group of cycloalkanes typi-cally abundant in severely weathered and biodegraded samples (Galleg o e t al., 2011). Final l y, volat i lization and similar abiotic degradation and removal mechanisms can be discarded to have occurred during the microcosm incubations. A comprehensive study focusing on understanding the specific mi-crobial species, biomass changes, and i nteractions i nvolved in soil mi-crobial remediation will be very interesting in identifying the potential functional microbial community. One such study was performed by G a r rid o -S a nz et a l . (2019), i n which t hey isolated and characterized the i ndigenous soil aerobic bacteria l consort i um growing on diesel as a sole carbon source. G a r r ido -S an z et al . (2019) identi f ied that the microbial consor t ium, using metagenomic analysis, capable of degrading hydro-carbon was primarily composed of Pseudomonas, Aquabacterium,Chryseobacterium, and Sphingomonadaceae. It is proposed that further research is needed for a better and more comprehensive understanding of the underlying mechanism of both BS and BA and to make better and more accurate informed decisions on implementing a given bioremedi -ation strategy by considering not only the environment but also the rest of the inherent factors. While biostimulation might, in principle, result in better cost-effective options since the stage of cultivation of micro-organisms is not necessary, more promising effect s are a priori assigned when observing bioaugmentation results, mainly concerning the rate 5. Conclusions In general l ines, i t can be stated that both strategies have had sig-nificant improvements, as observed in the biodegradation rates. After long-term in situ natural attenuations, the main biodegradable contam-inant fractions were depleted. From that i nitia l situation, the treatments applied were able to eliminate the remaining bioavailable compounds (l inears, alkanes, and polars) and deplete fewer biodegradable com-pounds (aromatics and branched alkanes), whereas recalcitrant and heavy hydrocarbon fami l ies (hopanes) remained intact. Al t hough there have been remarkable differences between and among the bio-stimulation and bioaugmentation treatments, most of them are not sufficiently significant to discriminate and select one over the other, for instance, in the case of upscaling the strategy (like for bio-pile). Sig nificant differences were observed in the microcosms treatments with the added vermicompost amendment, which can be a cost-effective technique to increase hydrocarbons’biodegradation when applied to large-scale bio-pile treatments. Similarly, using other co-application techniques also potentially speed up the hydrocarbon remediation process. These methods included the biofortification using microalgal biomass, amendments with soi l conditioners, and other remediation methods (biosnorkeling, bioelectrokinesis, and mycoremediation). It wi ll be interesting to study the evolution of microbial communities to design a functiona l hydrocarbon-degrading microbial pollution. Lastly,it will be i mportant to quantify the level of soil toxicity followed by any remediation techniques adopted. CRediT author statement S. Curiel-Alegre: Methodology, Soil and lab analysis, initial draft preparation; B. Velasco-Arroyo: soil and lab analysis, i nitial draft prep-aration; C. Rumbo: microbial analysis; J.A. Tamayo-Ramos, A.H.A.Khan, C. Rad, and R. Barros: Conceptualization, text revision, and su-pervision. JL R. Gallego: GC-MS analysis and interpretation. Funding sources This work is funded by the GREENER project of the European Union’s Horizon 2020 research and innovation program (Grant Agree-ment No. 826312). S. Curiel pre-doctoral contract was funded by Junta de Castilla y Leon (ORDEN EDU/1508/2020, de 15 de diciembre). Declaration of competing interest The authors declare that they have no known competing financial interests or persona l relationships that could have appeared to influence the work reported in this paper. Data availability Data wil l be made available on request. Acknowledgments Authors are grateful to Maria Tome and Andrea Martínez for their technical help in soil determinations and Azucena Martin for their lab assistance in TPHs determination. Authors are also thankful to Prof.Rafae l Rivilla from Departamento de Biologia, Facultad de Ciencias,Universidad Autonoma de Madrid, Madrid, Spain, for providing the isolated hydrocarbon-degrading bacteria l consortium. Appendix A. Supplementary data Supplementary data to this article can be found online at ht t ps ://doi.org /10.1016/j .ch e mo s phere.2022.135638. References Bligh, E.G., Dyer , W.J., 1959. A r apid method of total l ipid extraction and purification.Can. J . Biochem. Physiol . 37, 911-917. htt ps://d o i.org/10.1139/o 59-099. Chen , M., Xu , P., Zeng, G., Yang, C., Huang, D., Zhang, J., 2015. Bioremediation of soils contaminated with polycyclic aromatic hydrocarbons, petroleum, pesticides,chlorophenols and heavy metals by compost i ng: applications, microbes and future research needs. Biotechnol . Adv. 33, 745-755. ht t ps://do i .org/10.1016/j.b i o t ec h ad v.2015.05.003. Das, D., Deka, H., 2021. Vermicompos t ing of harvested waste biomass of potato crop employing Eisenia fetida: changes in nutrient profile and assessment of the maturity of the end products. Environ. Sci. Pollut . Res. 28, 35717-35727. h t tp s ://doi.or g /10.1007/s11356-021-13214-Z . Gallego, J.L.R., Sierra, C., Permanyer, A., Pelaez, A.I., Menendez-Vega, D., Sánchez, J.,2011. Full -scale remediation of a jet fuel -contaminated soil : assessment of biodegradation, volatilisation, and bioavailability. Water, air. Soi l Pollut. 217,197-211. htt ps://doi .org/10.1007/S11270-010-0579-6. Garrido -Sanz, D., Redondo-Nieto, M., Guirado, M., Jimenez, O.P., Millan, R., Martin, M.,Riv i lla, R., 2019. Metagenomic i ns i ght s into the bacteria l functions of a diesel-degrading consortium for the rhizoremediation of diesel-polluted soil. Genes 10,456. h t t ps://d o i .org/10.3390/GENES10060456. George, S.E., Wan, Y., 2020. Advances i n characteriz i ng microbial community change and resistance upon exposure to lead contamination: i mplications for ecologica l risk a 102ssessment . Crit. Rev. Environ. Sci . Technol.50, 2223-2270. h t tps://d o i .or g /10.1080/10643389.2019.1698260. Hussain, F., Hussain, I., Khan, A.H.A., Muhammad, Y.S., Iqbal, M., Soja, G.,Reichenauer, T.G., Yousaf, S., 2018. Combined application of biochar, compost, and bacterial consortia with I t alian r yegrass enhanced phytoremediation of petroleum hydrocarbon contaminated soil. Environ. Exp. Bot. 153, 80-88. h tt p s ://doi.org /10.1016/j .e n vex p bo t .2018.05.012. Hussain, F., Khan, A.H.A., Hussain, I ., Farooqi, A., Muhammad, Y.S., Iqbal , M., Arslan,Yousa a f t ,, S., 2022. Soil conditioners improve rhizodegradation of aged petroleum hydrocarbons and enhance the growth of Lolium multiflorum. Environ. Sci. Pollut.Res. 29, 9097-9109. h t tp s://d o i .o r g/10.1007/s 11356-021-16149-7. Iqbal , A., Mushtaq, M.U., Khan, A.H.A., Nawaz, I ., Yousaf, S., Iqbal , M., 2020. Influence of Pseudomonas japonica and organic amendment s on the growth and metal tolerance of Celosia argentea L. Environ. Sci. Pollut. Res . 27, 24671-24685. h t tp s://d oi.o r g/10.1007/s11356-019-06181-z . Khan, A.H.A., Anees, M., Arshad, M., Muhammad, Y.S., Iqbal, M., Yousaf , S., 2016b.Effects of illuminance and nutrients on bacterial photo-physiology of hydrocarbon degradation. Sci. Total Environ. 557,705-711.htt ps://d oi.o r g /10.1016/j .sc i to t env.2016.03.068. Khan, A.H.A., Ayaz, M., Arshad, M., Yousaf, S., Khan, M.A., Anees, M., S ultan, A.,Nawaz, I ., Iqbal, M., 2019. Biogeochemical cycle, occurrence and biological treatments of polycycl i c aromatic hydrocarbons (PAHs). Iran. J. Sci. Technol. Trans.Sc i. 43, 1393-1410. h t t ps://do i .or g/10.1007/s40995-017-0393-8. Khan, A.H.A., Tanveer, S., Alia, S., Anees , M., Sultan, A., Iqbal, M., Yousaf, S., 2017. Role of nutr i ents in bacterial biosurfactant production and effec t of biosurfactant production on petroleum hydrocarbon biodegradation. Ecol. Eng. 104, 158-164.h t tps://doi .org /10.1016/j .e co l e n g.2017.04.023. Khan, A.H.A., Tanveer, S., Anees, M., Muhammad, Y.S., Iqbal , M., Yousaf, S.,2016a.Role of nutrients and i lluminance in predicting the fate of fungal mediated petroleum hydrocarbon degradation and biomass production. J. Environ. Manag. 176, 54-60.http s ://d o i .or g /10.1016/j .j env m an .2016.03.040. Lewe, N., Hermans, S., Lear , G ., Kel l y, L .T., Thomson-Laing, G., Weisbrod, B., Wood, S.A.,Keyze r s, R.A., Deslippe, J .R., 2021. Phospholipid fatty ac i d (PLFA) analysis as a tool to es t imate absolute abundances from composi t ional 16S rRNA bacterial metabarcoding data. J . Microbiol. Method s 188, 106271. h t t ps://d o i .org /10.1016/j .mim et .2021.106271. Mai r , J., Schinner, F., Margesin, R., 2013. A feasibi l ity study on the bioremediation of hydrocarbon-contaminated soil from an Alpine former military site: effects of temperature and biostimulation. Cold Reg. Sci . Technol . 96, 122-128. htt ps ://doi.o r g/10.1016/j .co l d r egions .2013.07.006. Marx, M.C., Wood, M., Jarvis, S.C., 2001. A microplate f luorimetric assay for t he study of enzyme diversity in soils. Soil Biol. Biochem. 33, 1633-1640. h t t ps ://d o i .o r g /10.1016/S0038-0717(01)00079-7. Mehlich, A., 1984. Mehlich 3 soi l tes t extractant : a modification of Mehlich 2 extractant.Commun. Soi l Sci. Plant Anal. 15,1409-1416. h t t p s ://doi .o rg/10.1080/00103628409367568. Mishra , S., Lin , Z., Pang, S., Zhang, W., Bhatt , P., Chen, S., 2021. Recent advanced technologies for the characterization of xenobiotic-degrading microorganisms and microbial communities. Front. Bioeng. Biotechnol. 9, 632059 https://doi .org /10.3389/fb io e .2021.632059. Mushtaq, M.U ., Iqbal, A., Nawaz, I ., Mirza, C.R ., Yousa f , S., Farooq , G ., Ali, M.A.,Khan, A.H.A., Iqbal , M., 2020. Enhanced uptake of Cd, Cr , and Cu in Catharanthus roseus (L.) G. Don by Bac i llus cereus: appl i cation of moss and compost to reduce metal availability. Environ . Sci. Pollut. Res. 27, 39807-39818. htt p s://doi.o r g/10.1007/s11356-020-08839-5. Narendrula-Kotha, R., Nkongolo, K.K., 2017. Bacteria l and fungal community structure and diversity in a mining region under long-term meta l exposure revealed by metagenomics sequencing. Ecol. Genet. Genom. 2, 13-24. h t tp s ://doi .o r g /10.1016/j .egg.2016.11.001. P al o jarv i , A., 2006. P h osp h olipi d fatty a c i d (PL F A) a n a l yses. I n: Bl o em, J ., Hop k ins, D.W., B e ned ett i, A . (Eds.), M icr o bi o l ogic a l M e thod s for Asse s s i ng So i l Qu a lity . CAB I I n te r n at i o n al , Wal l i n g ford , U K , p p . 204-211. Pinedo, J., Ibanez , R., Lijzen, J .P.A., I r abien, A., 2013. Assessment of soil pollution based on total petroleum hydrocarbons and individual oil substances. J. Environ. Manag.130, 72-79. ht tp s ://doi .o r g /10.1016/J .JE N V MAN .2013.08.048. Sima, N .A.K., Ebadi , A., Reiahisamani, N., Rasekh , B., 2019. Bio-based remediation of petroleum-contaminated saline soils: challenges, the current state -of-the-art and prospects. J . Environ. Manag. 250, 109476 h t tp s://doi.org /10.1016/j .ienvman .2019.109476. Soni, S., Agarwa l , M., 2014. Lubricants from renewable energy sources - a review. Green Chem. Lett . Rev. 7, 359-382. ht tps://d o i .or g/10.1080/1OS://7518253.2014.959565. Wu, M., Li, W., Dick, W.A., Ye , X., Chen, K., Kost, D., Chen, L., 2017. Bioremediation of hydrocarbon degradation in a petroleum-contaminated soil and microbial population and activity determination. Chemosphere 169,124-130.h t t p s ://d o i .o r g/10.1016/J.C HEM O S P HERE.2016.11.059. Yang, C., Yang, Z., Zhang, G., Hollebone, B., Landriault, M., Wang, Z., Lambert, P.,Brown, C.E., 2016. Characterization and differentiation of chemica l f i ngerprints of v i rgin and used l ubr i cat i ng oil s for identi f ication of contamination or adulteration sources. Fuel 163, 271-281. h t t ps://d o i .o r g/10.1016/J .FUE L .2015.09.070. Yousaf , U ., Khan, A.H.A., Farooqi, A., Muhammad,Y.S., Barros, R., Tamayo-Ramos, J.A.,Iqbal, M. Yousaf , S., 2022. Interactive effect of biochar and compos t with Poaceae and Fabaceae plants on remediation of total petroleum hydrocarbons in crude oil contaminated soi l . Chemosphere 286, 131782. h t t ps ://d o i .or g /10.1016/j .c h emosp he re.2021.131782.
确定
还剩10页未读,是否继续阅读?

产品配置单


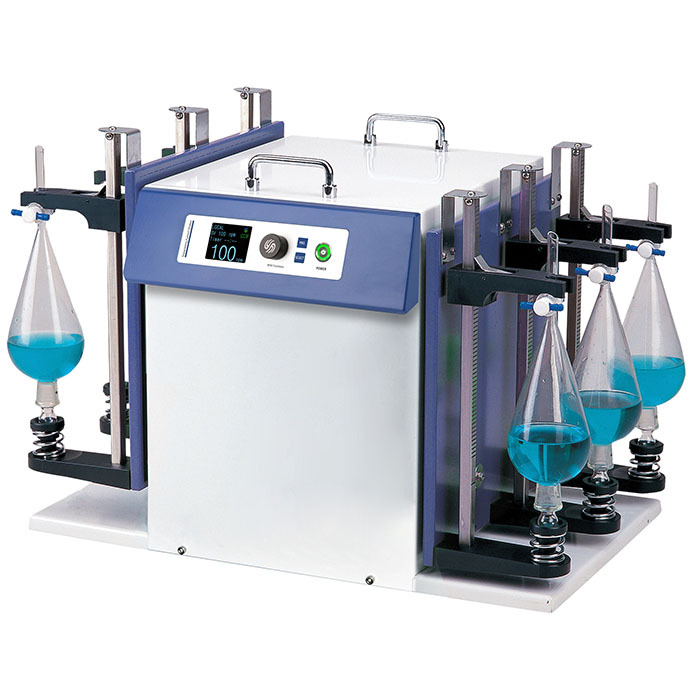
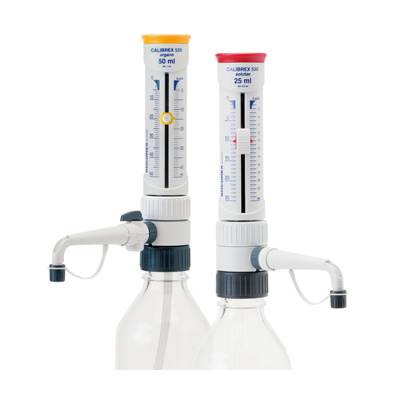
中国格哈特为您提供《机械工业园区土壤中总石油烃(TPHs)含量的检测》,该方案主要用于土壤中有机污染物检测,参考标准《HJ 1021-2019土壤和沉积物石油烃(C10-C40)的测定气相色谱法》,《机械工业园区土壤中总石油烃(TPHs)含量的检测》用到的仪器有格哈特全自动快速溶剂萃取仪Sox416、格哈特快速干燥仪STL56、格哈特强力高重现振荡器LS500/RO500、德国加液器MM、棕色避光防紫外线萃取杯、玻璃滤筒、滤纸筒

相关方案
更多
该厂商其他方案
更多