


方案详情
文
环境取证技术和多元统计揭示了多个污染源Multiple pollution sources unravelled by environmental forensics techniques and multivariate statistics
方案详情

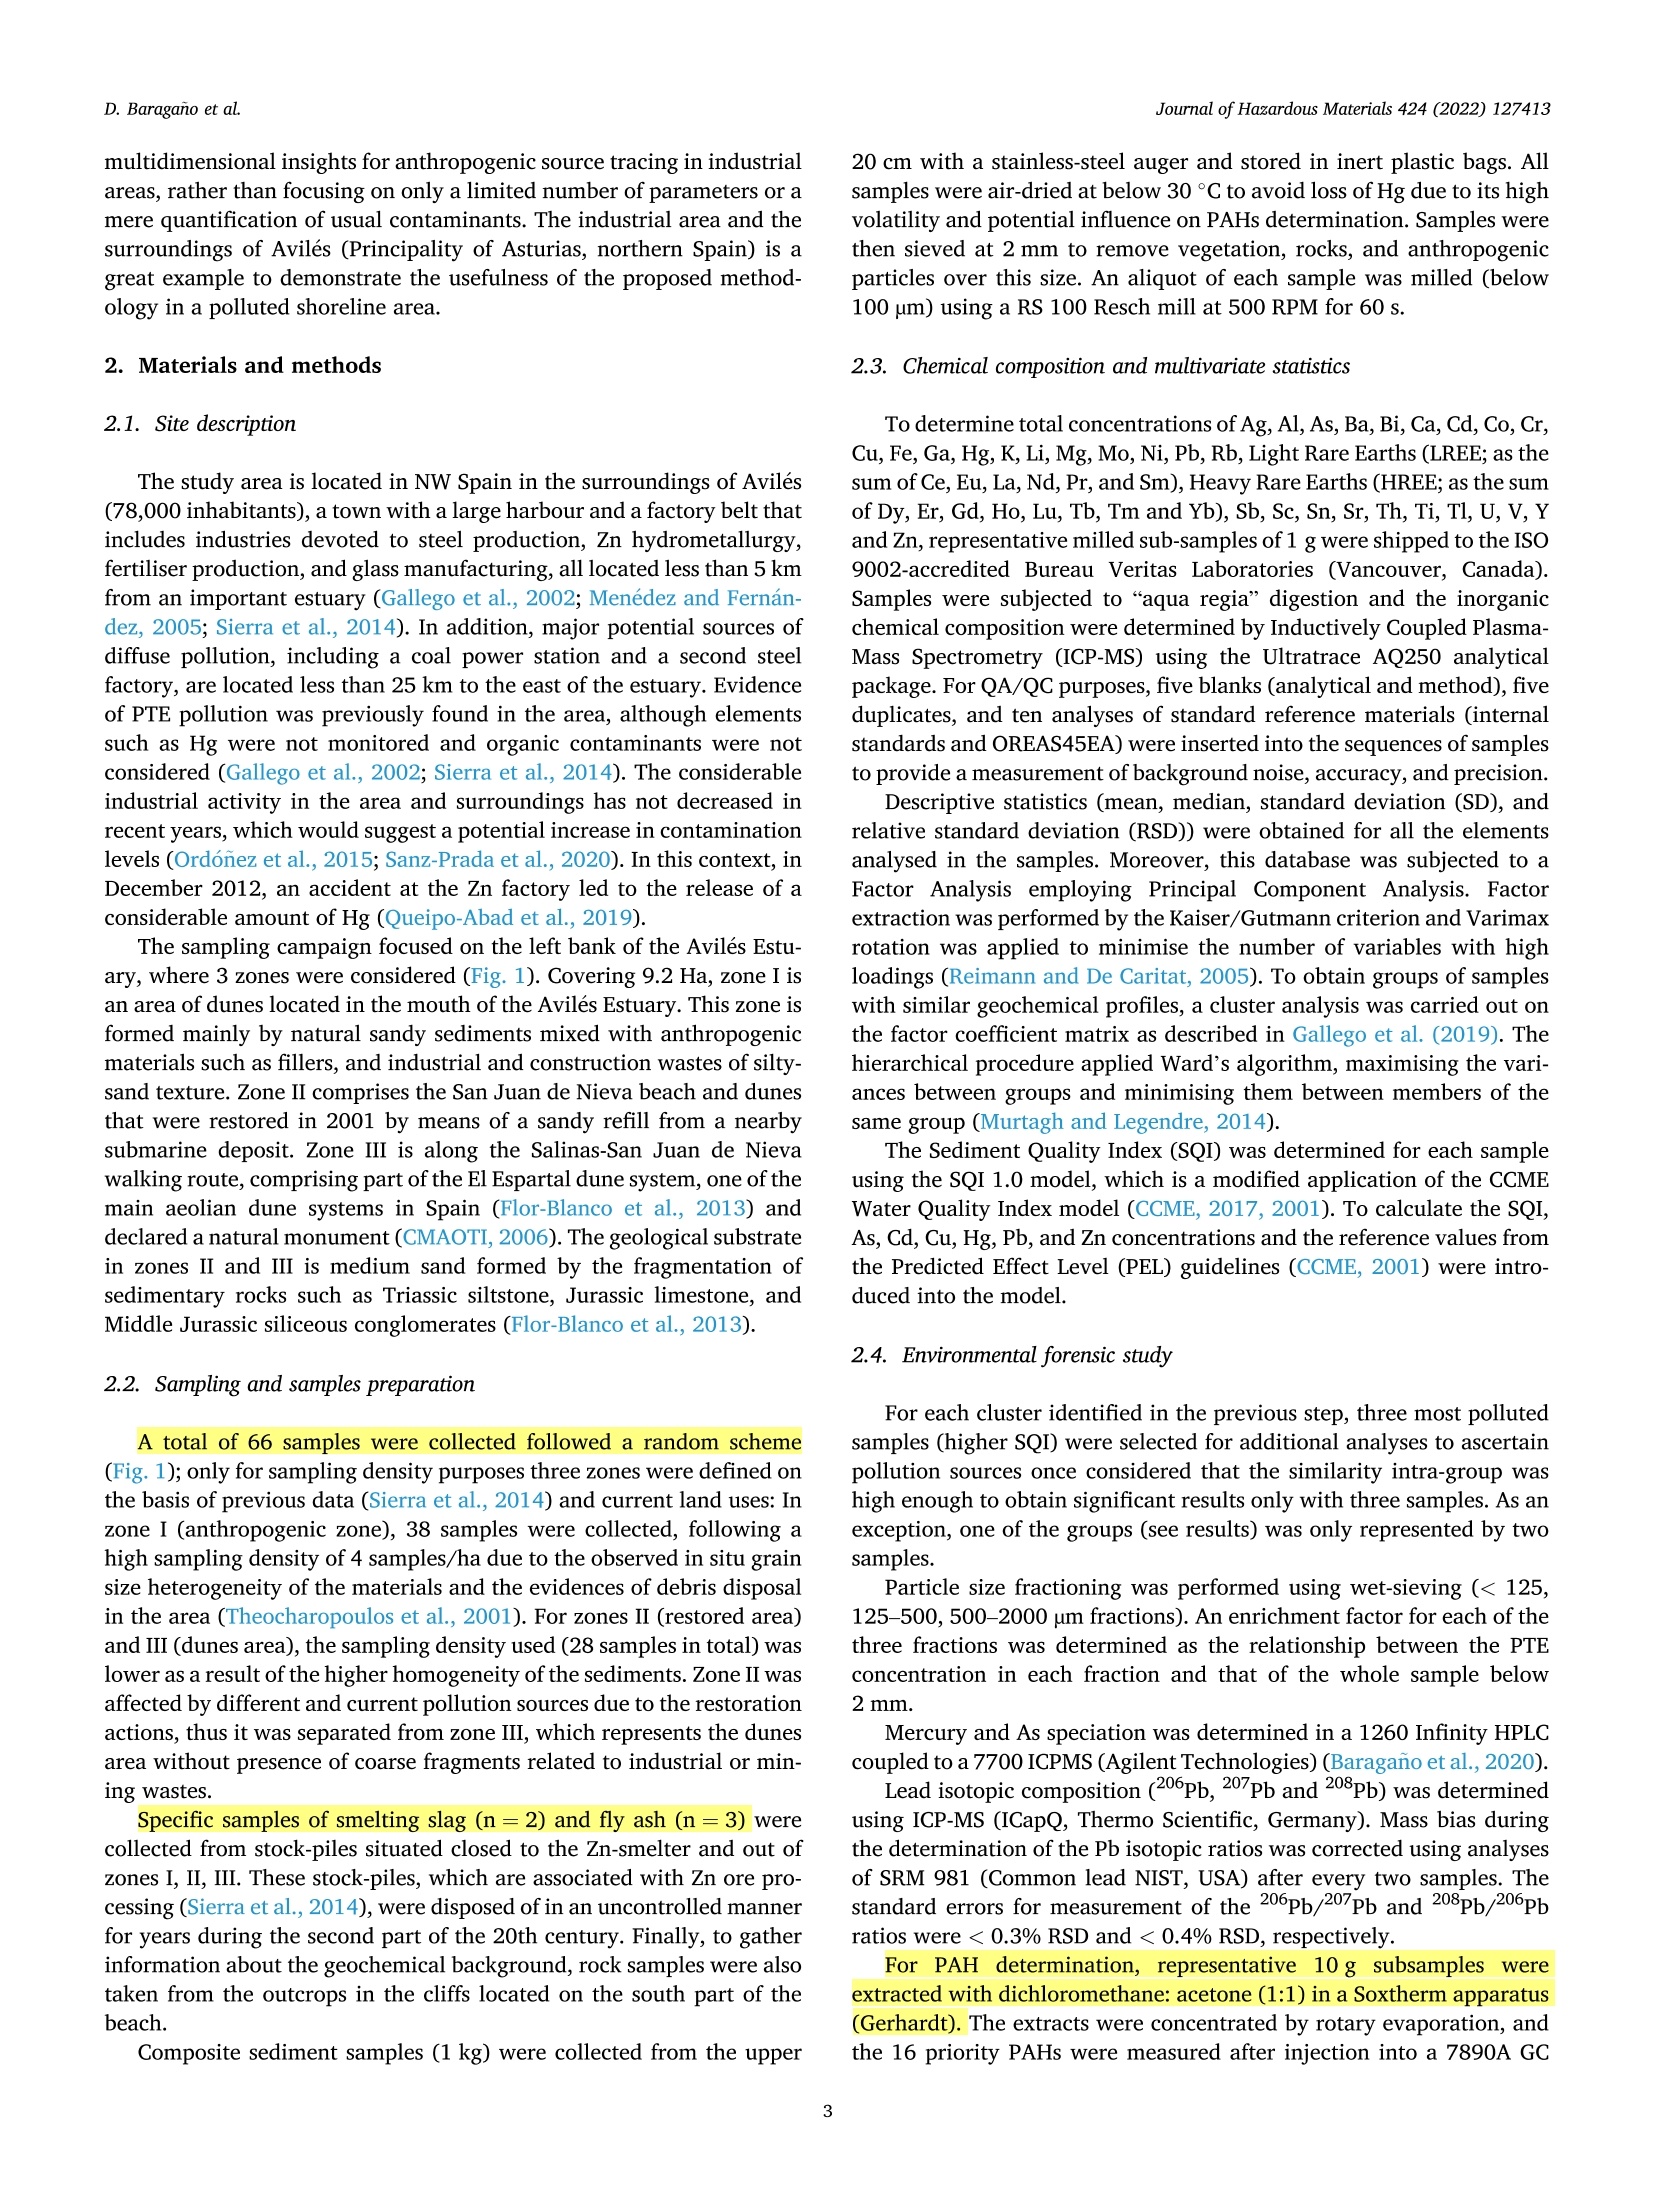
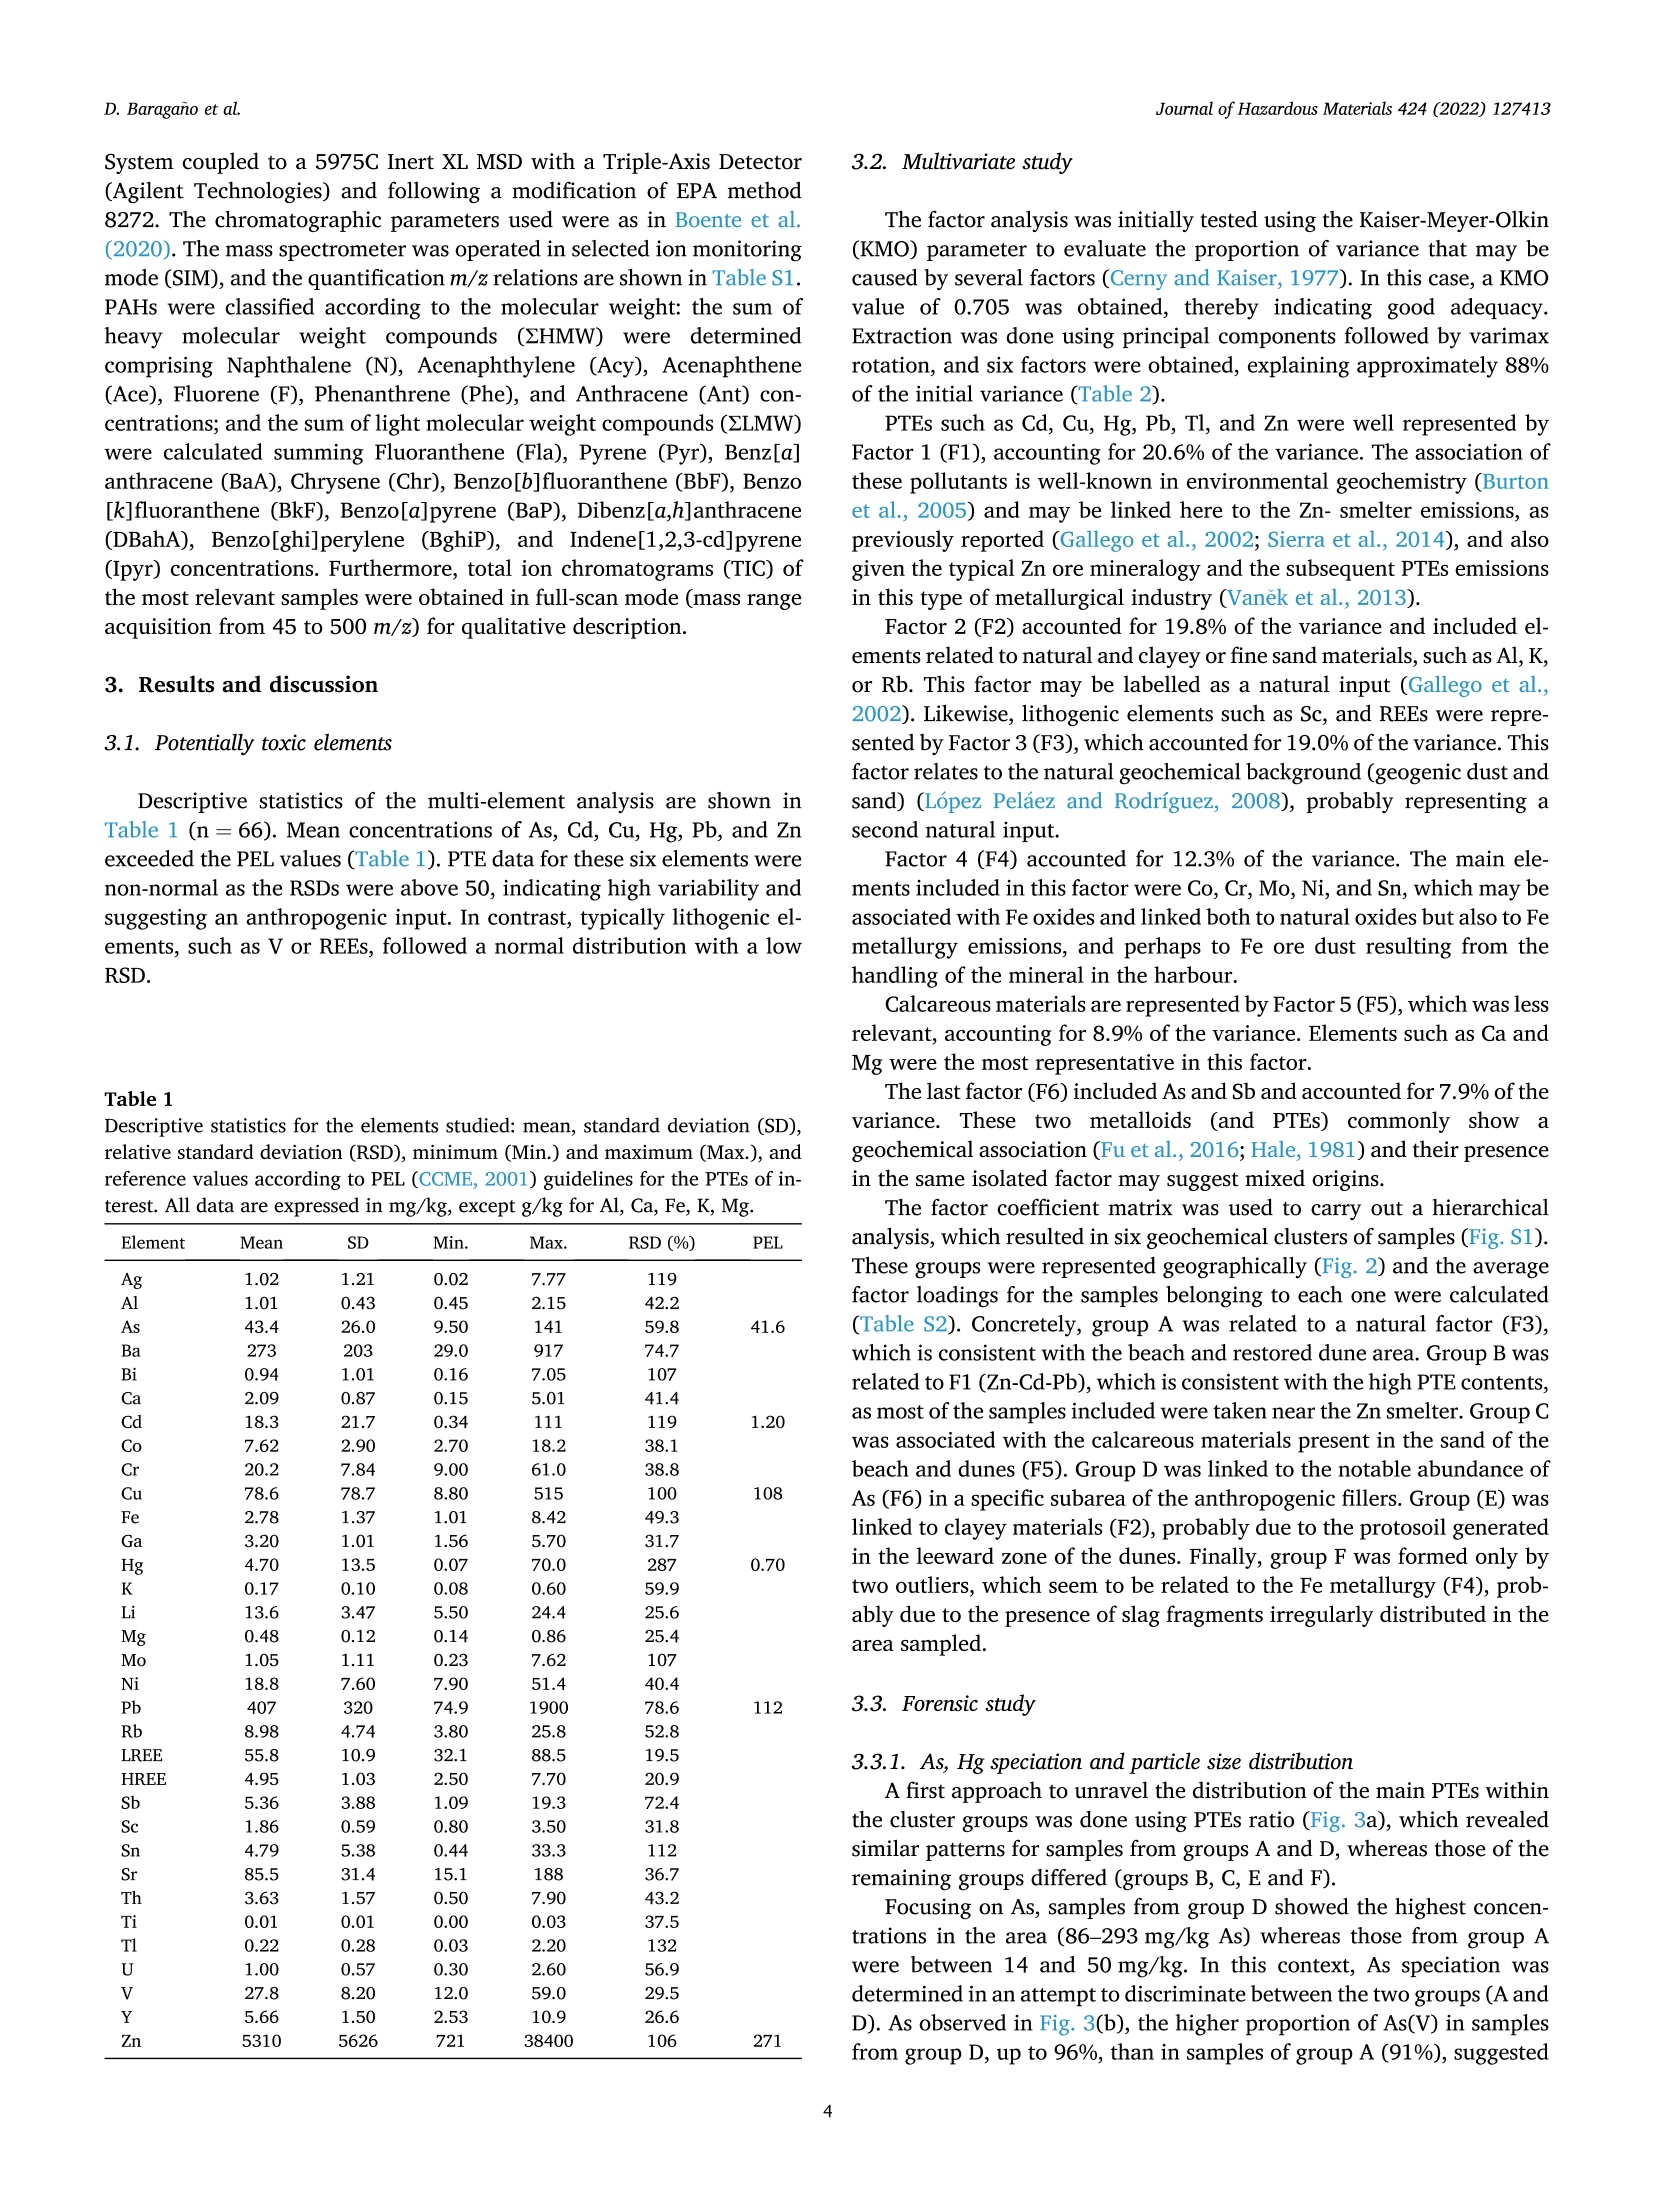
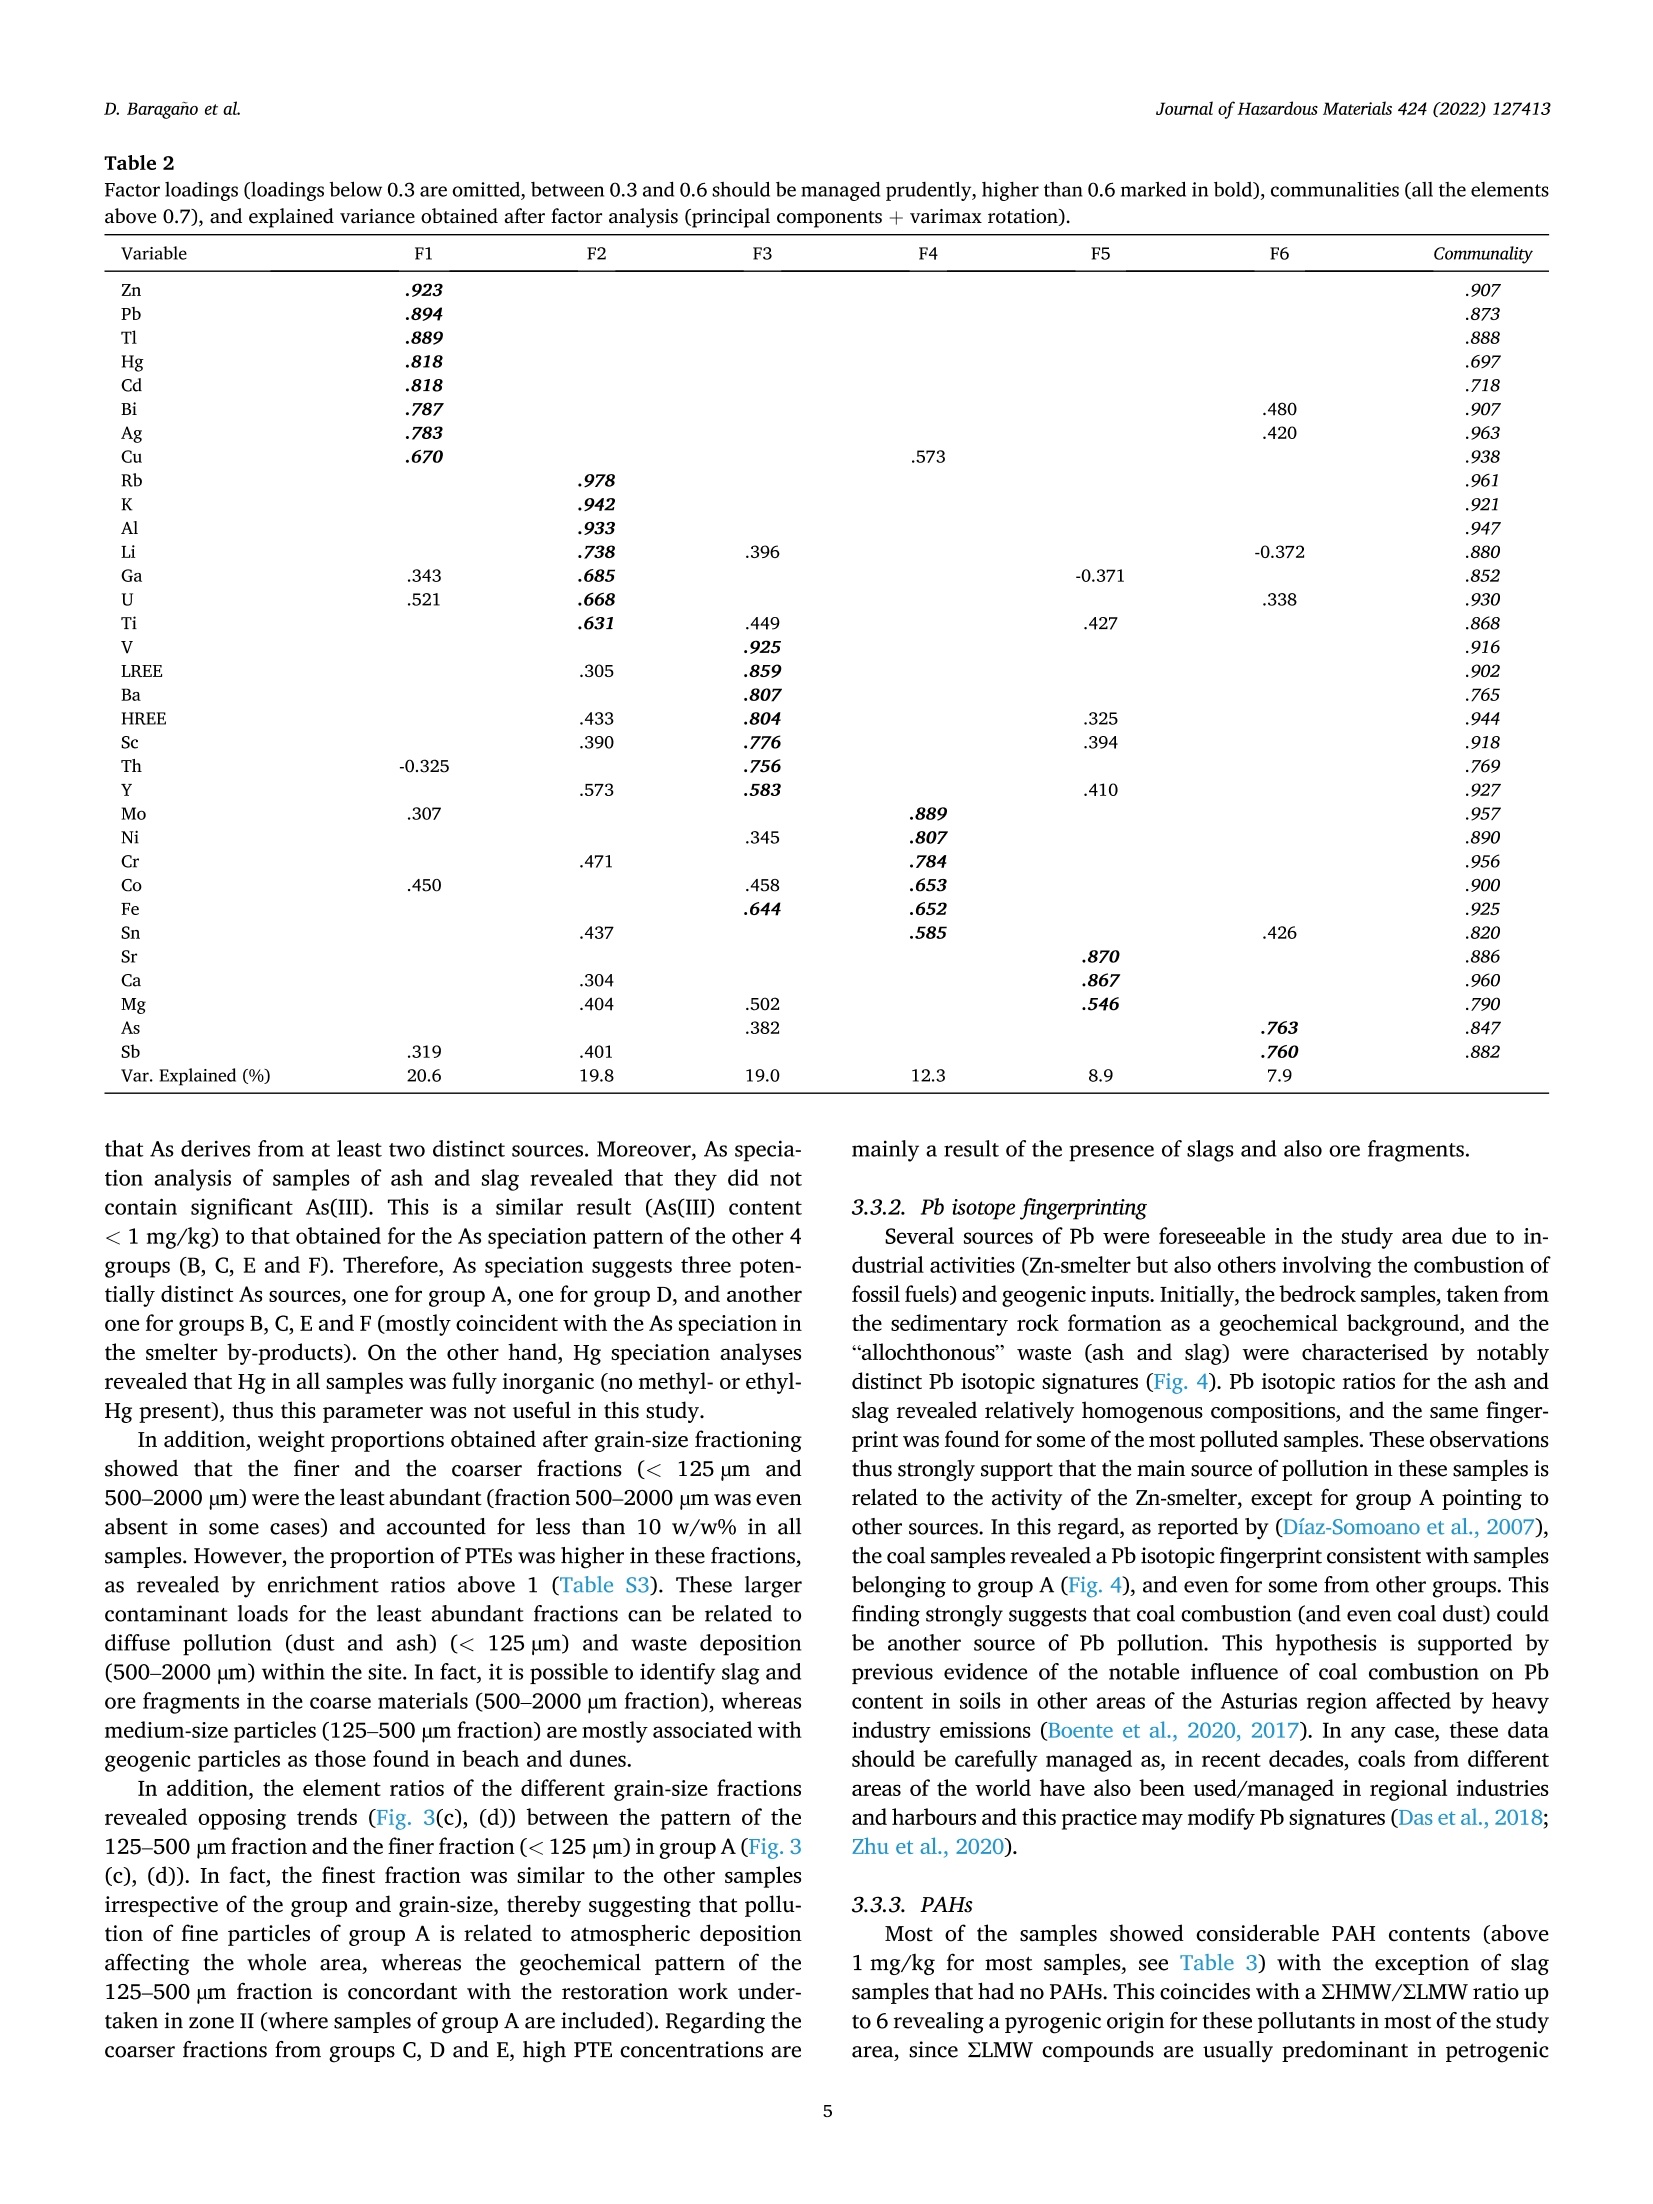
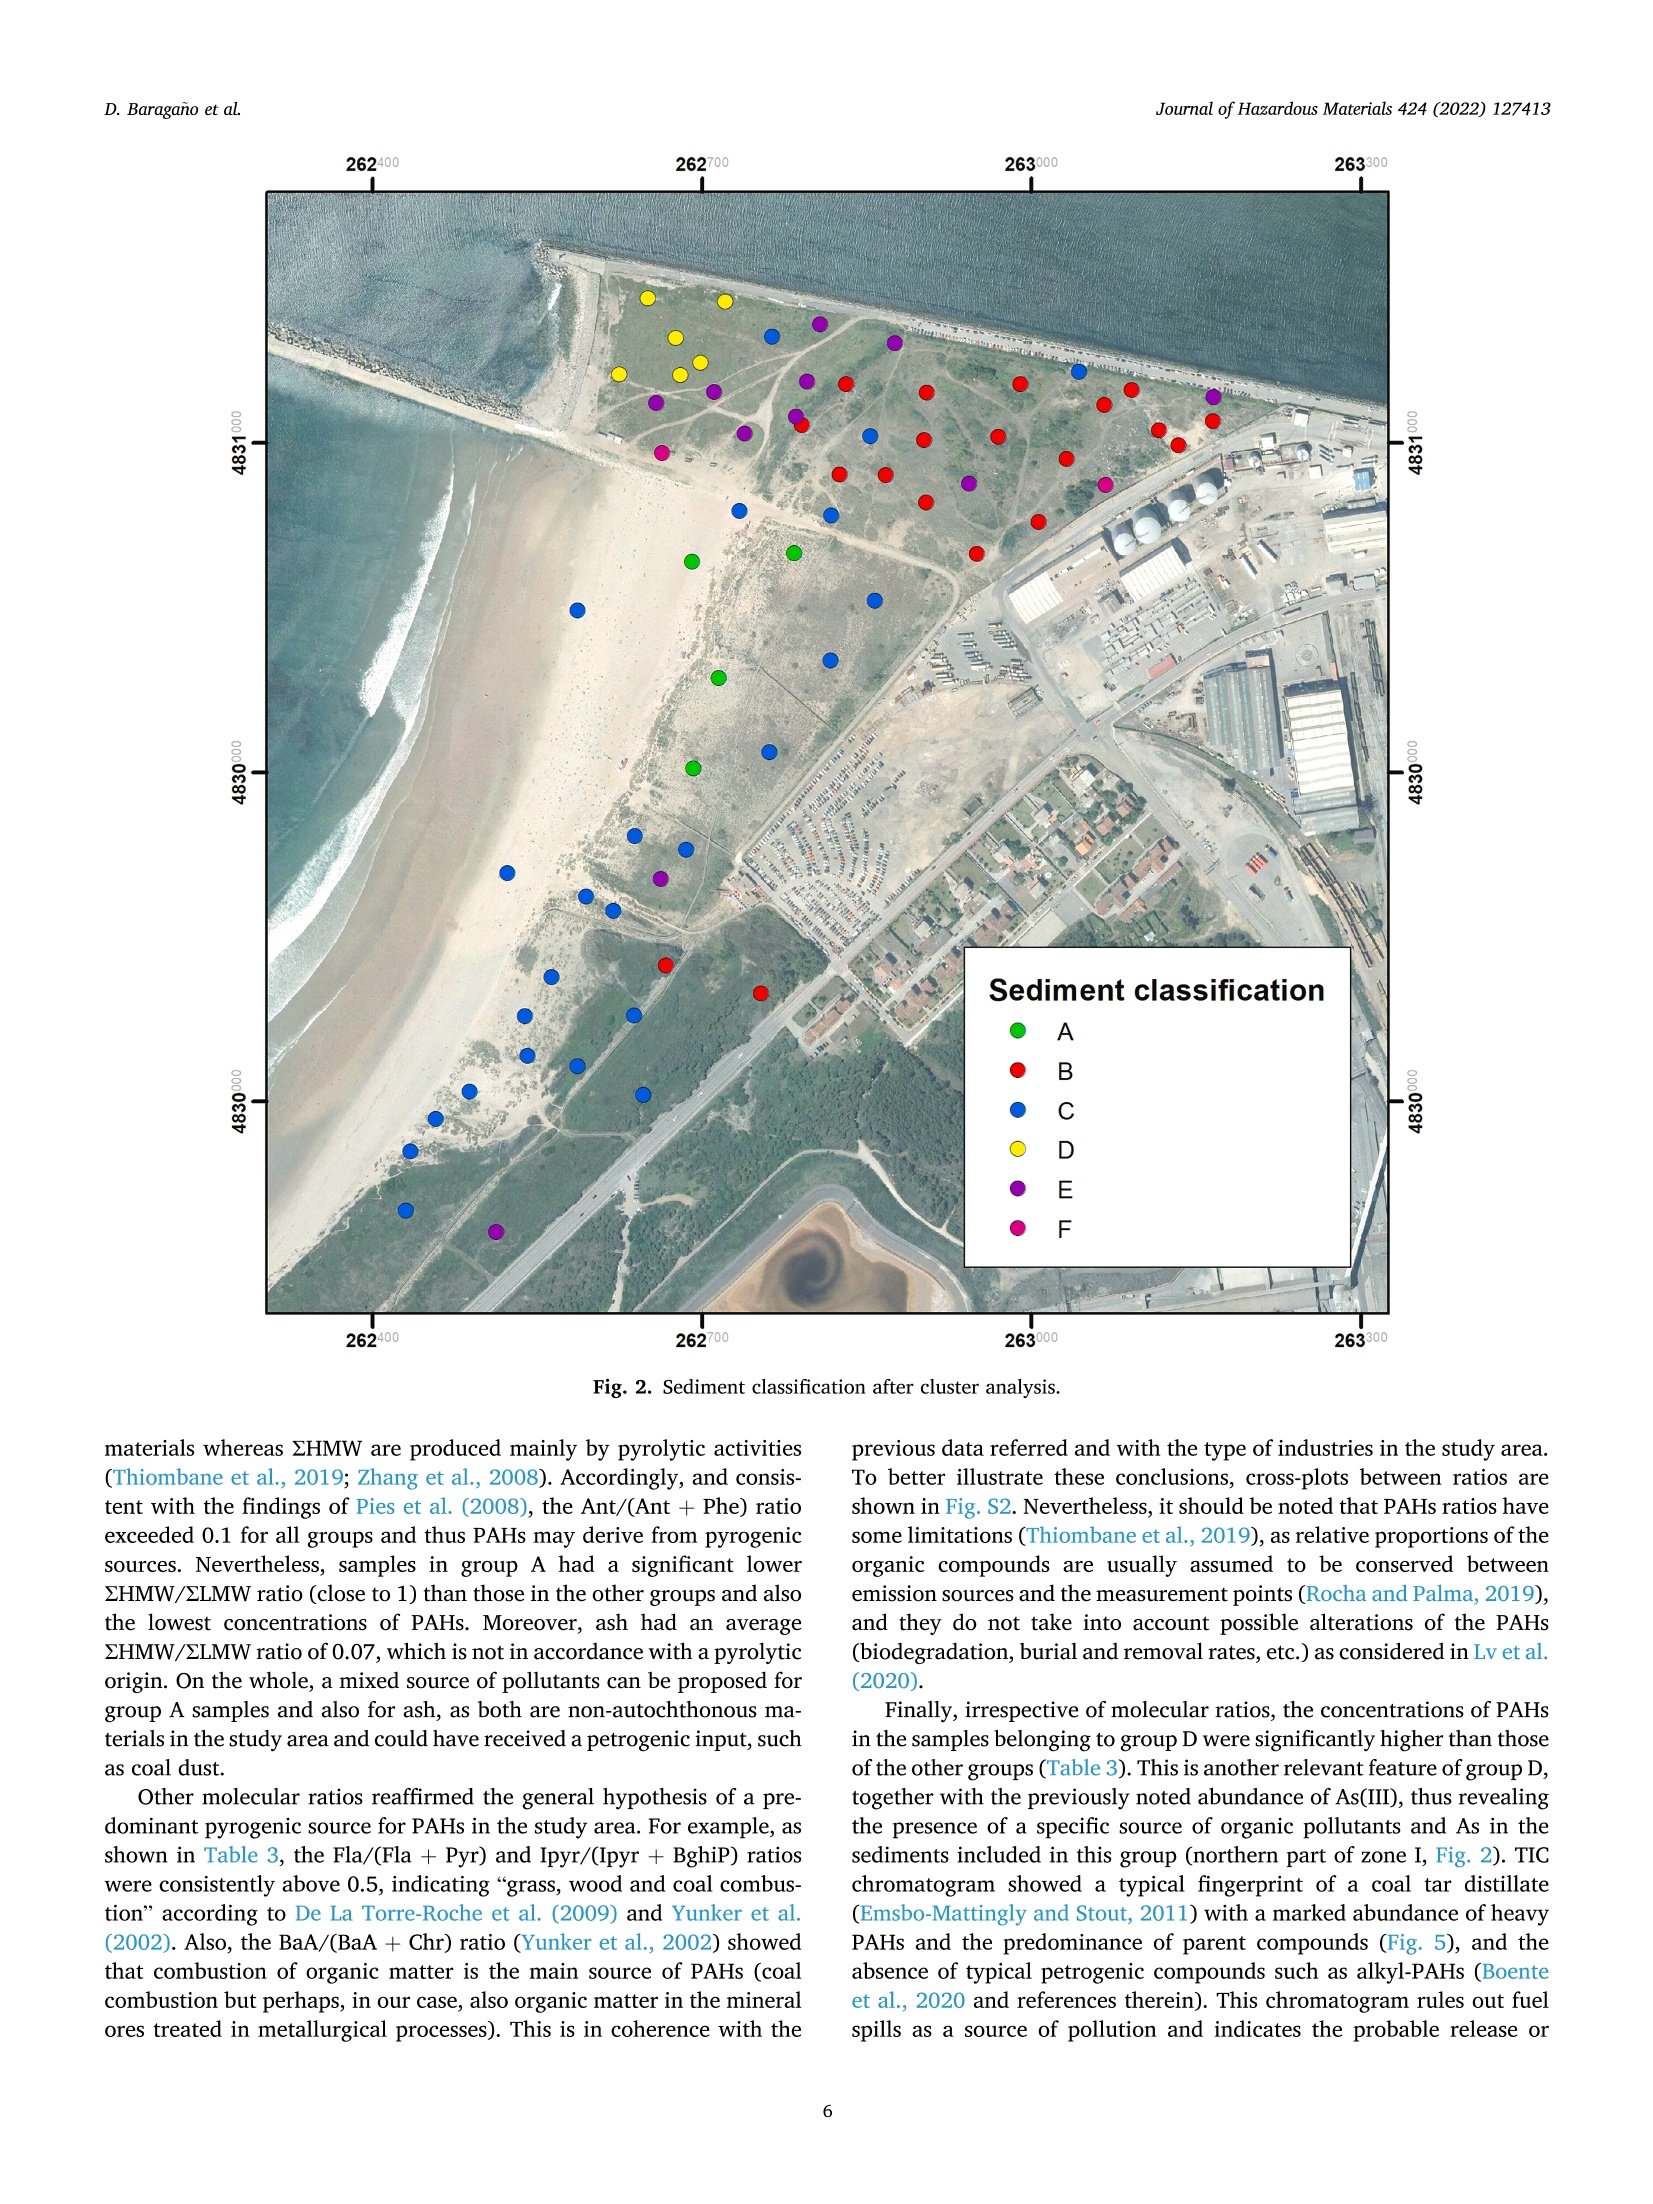
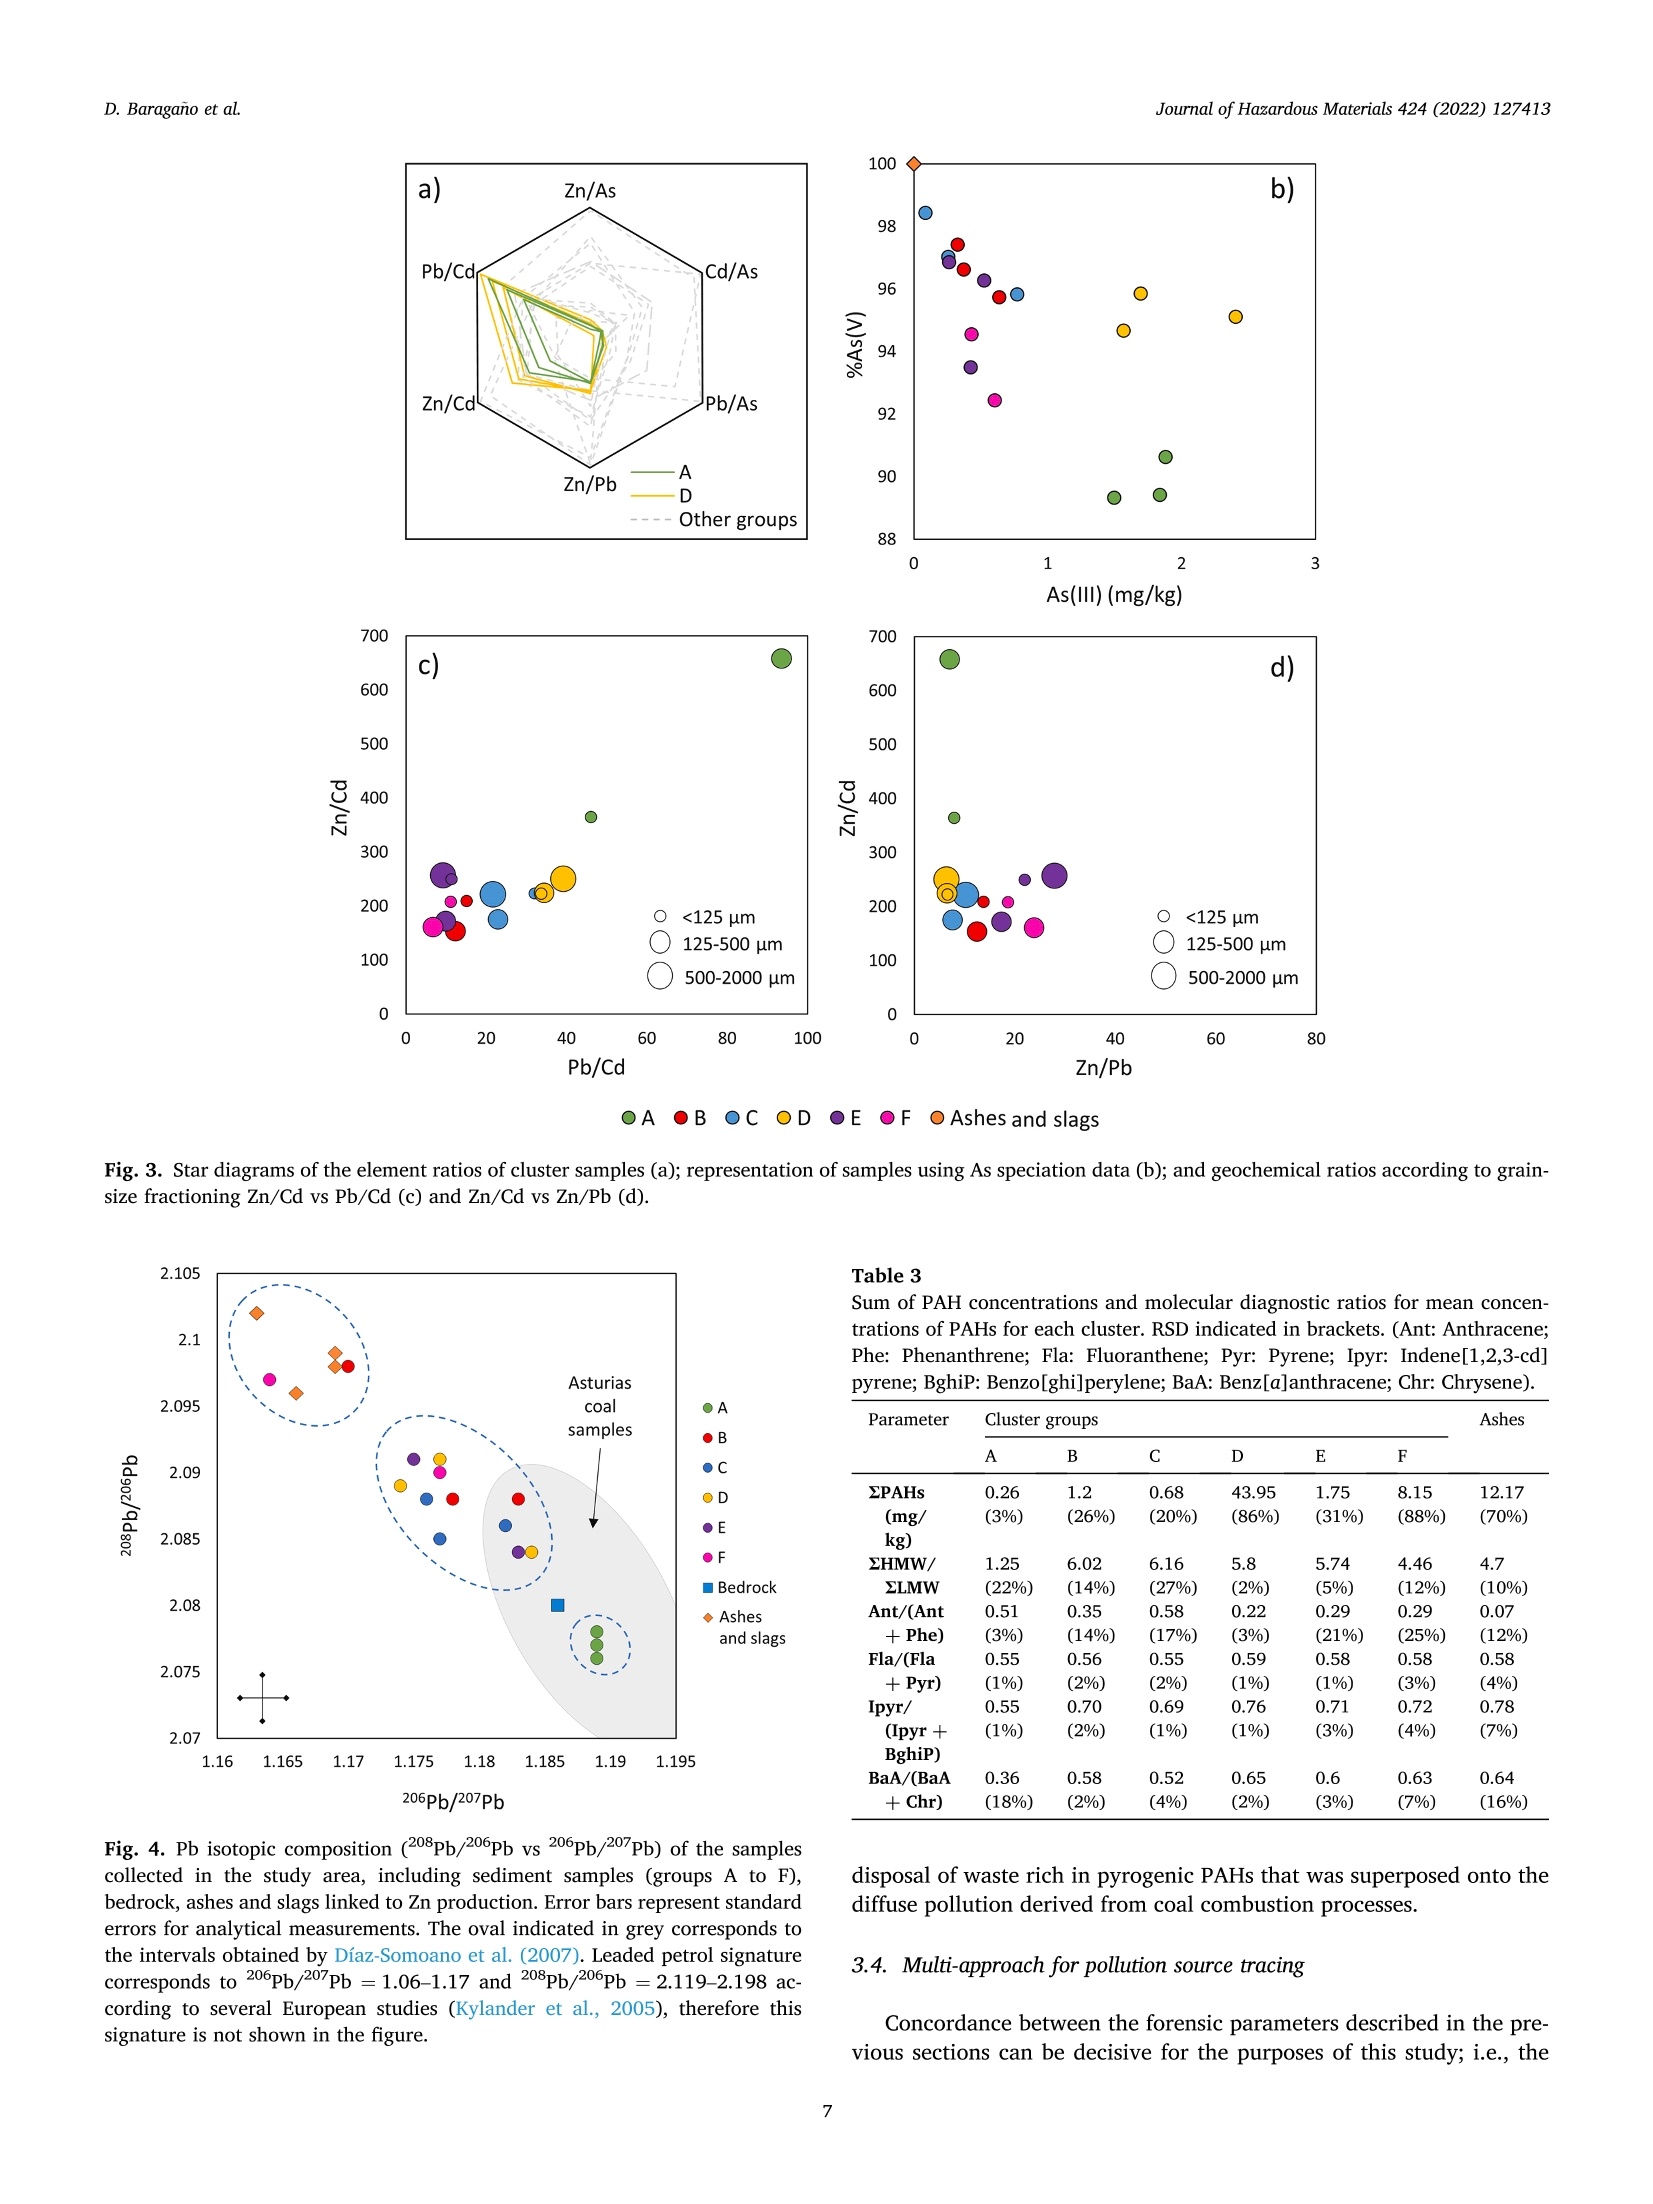
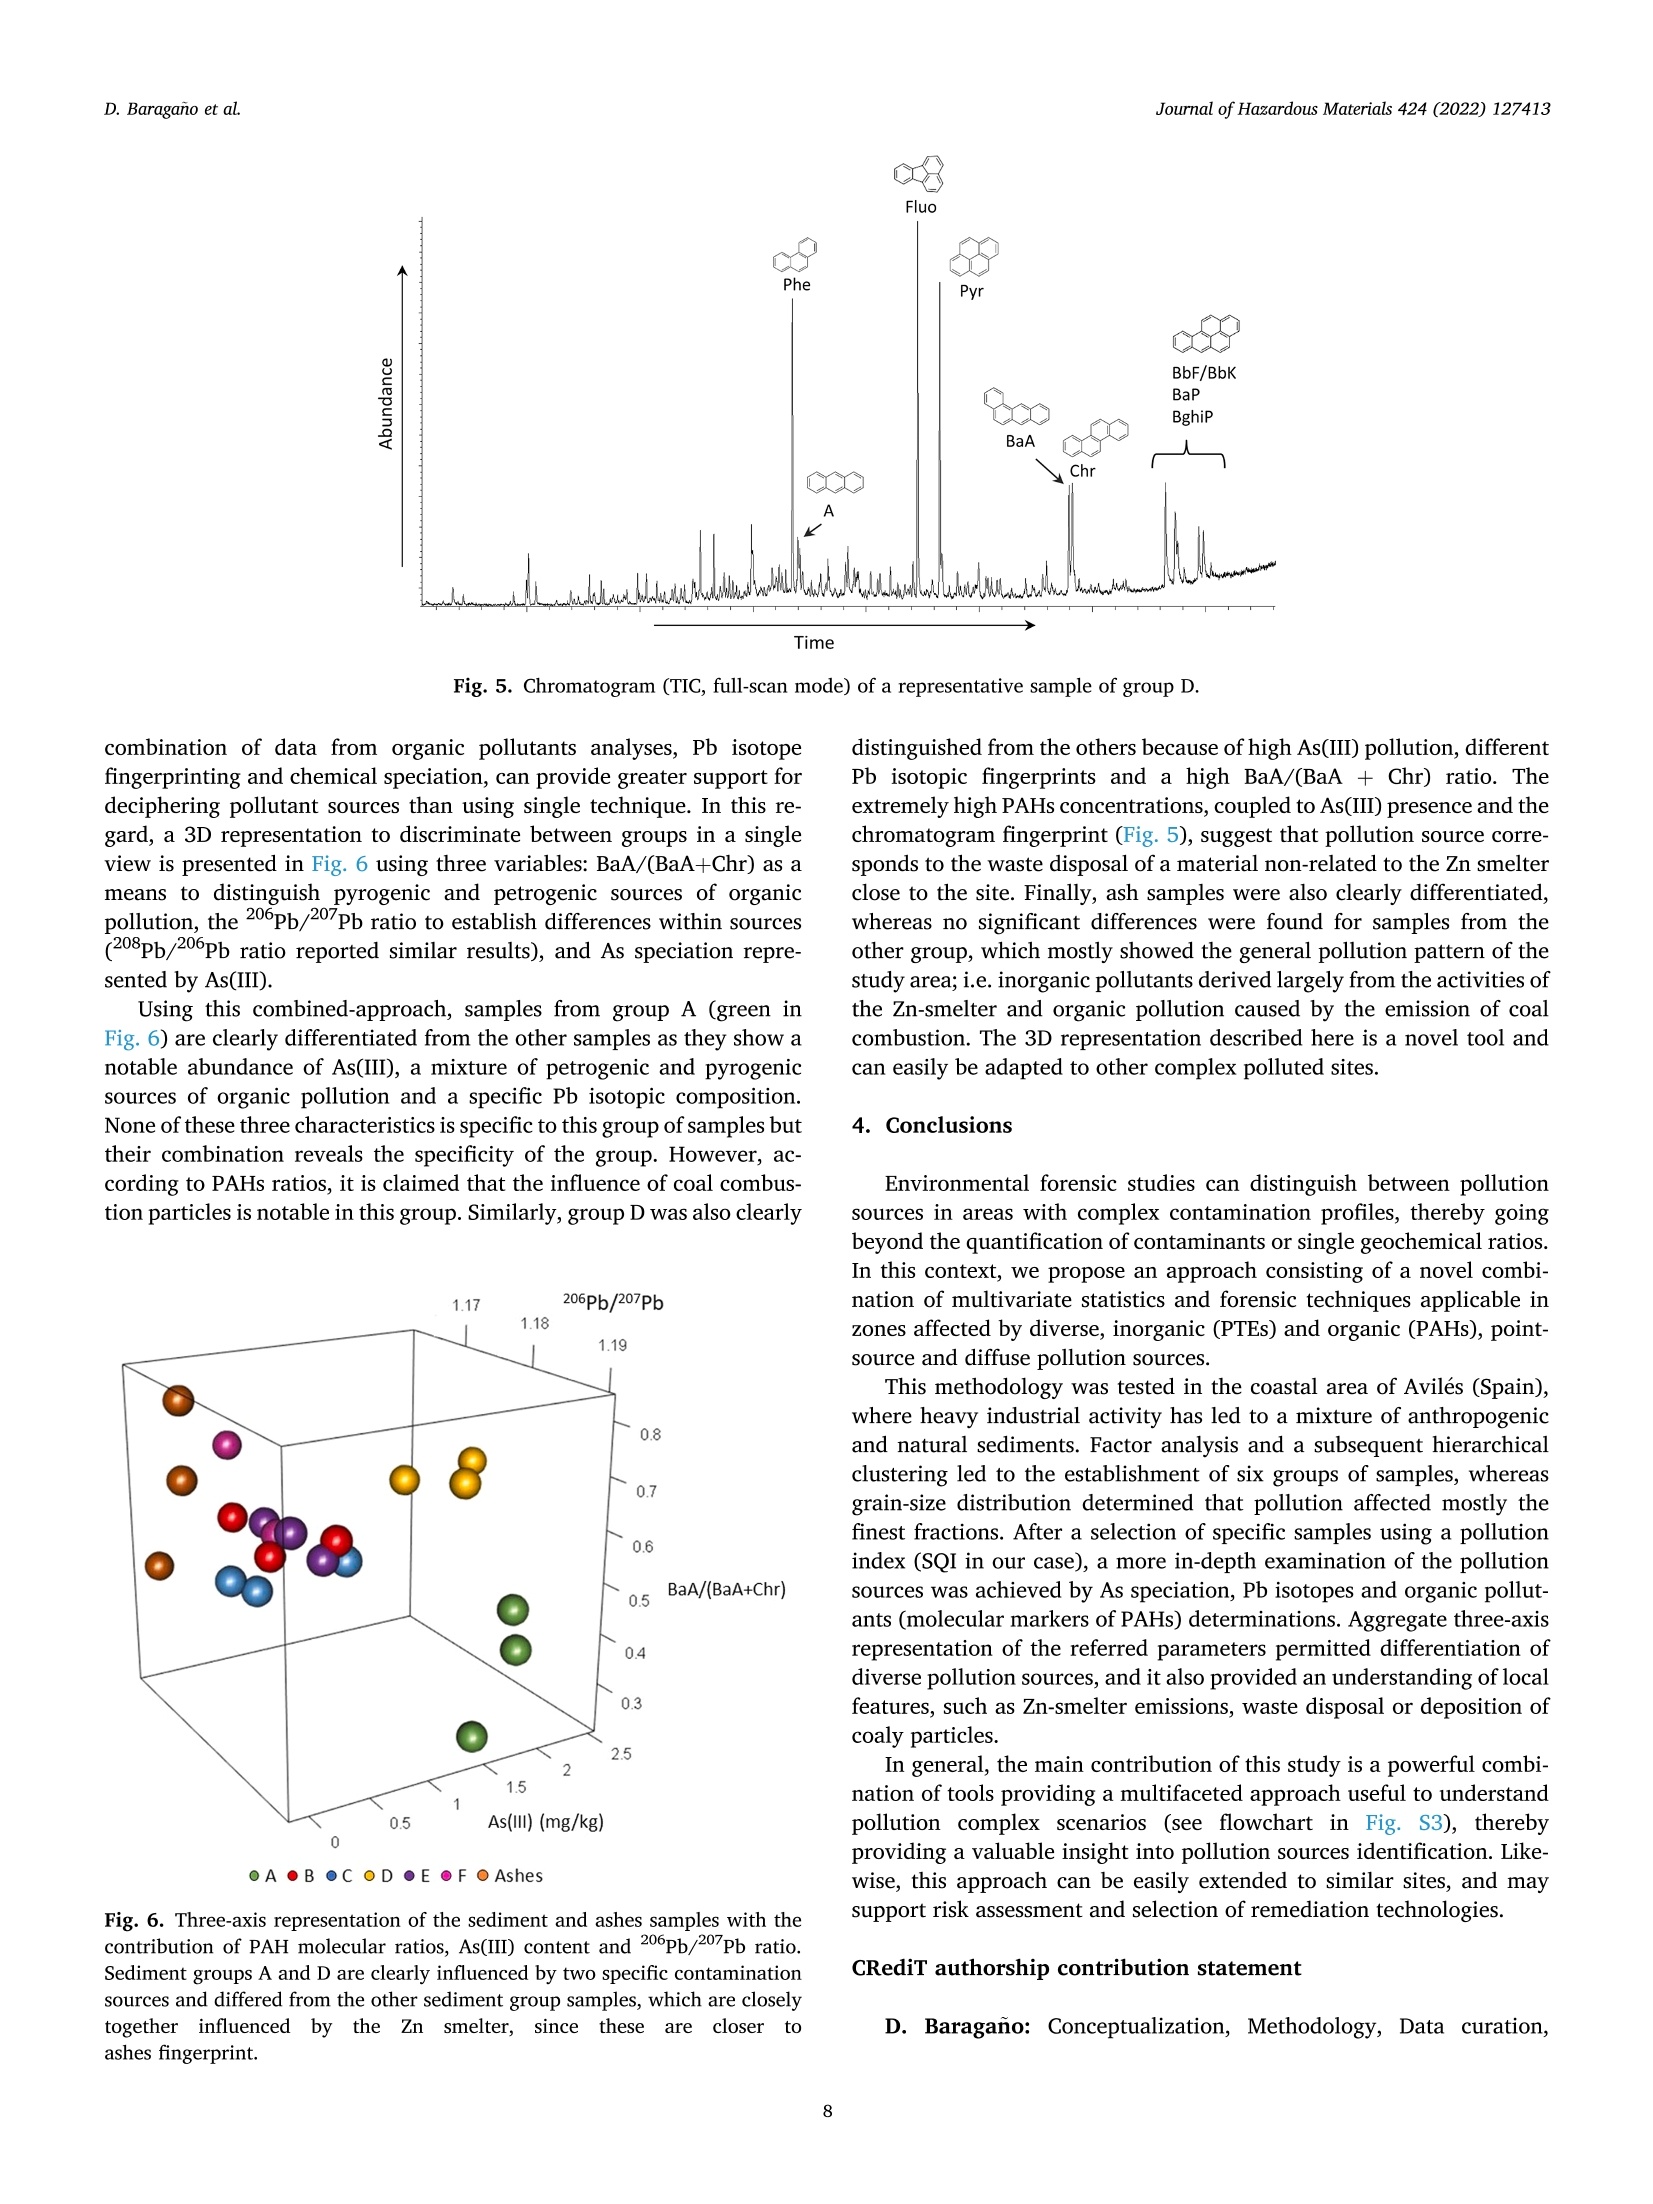
环境取证技术和多元统计揭示了多个污染源Multiple pollution sources unravelled by environmental forensics techniques and multivariate statisticsJournal of Hazardous Materials 424 (2022) 127413 D. Baragano et al.Journal of Hazardous Materials 424 (2022) 127413 Contents lists available at Sc i enceDirect Journal of Hazardous Materials journal homepage: www.elsevier .com/locate/jhazmat 环境取证技术和多元统计揭示了多个污染源 Research Paper Multiple pollution sources unravelled by environmental forensics techniques and multivariate statistics D. Baragano a ,, G. Ratie, C. Sierra , V. Chrastny , M. Komárek ", J.R. Gallego a INDUROT and Environmental Biogeochemistry & Raw Materials Group, Campus de Mieres, University of Oviedo, 33600 Mieres, Spain DDepartment of Environmental Geosciences, Faculty of Environmental Sciences, Czech University of L i fe Sciences, Kamyckd 129, 16500 Prague, Czech Republic Escuela Superior de Ingenieros de Minas y Energia, Campus de Vegazana, University of Leon, 24071 Leon, Spain ARTICLEINFO ABSTRACT Editor: Dr. C. LingXin Keywords:Toxic elements Arsenic speciation Lead isotopes Polycyclic aromat i c hydrocarbons Pollution sources Industrial sites affected by anthropogenic contamination, both past and present-day, commonly have intricate pollutant patterns, and source discrimination can be thus highly challenging. To this goal , this paper presents a novel approach combining multivariate statistics and environmental forensic techniques. The ef f iciency of this methodology was exempli f ied i n a severely pol l uted estuarine area (Aviles, Spain), where factor analysis and clustering were performed to ident i fy sub-areas with dist i nct geochemical behaviour. Once six clusters were defined and a pol l ut i on index applied, forensic tools revealed that the As speciation, Pb isotopes, and PAHs molecular ratios were useful to categorise the cluster groups on the basis of distinct pollution sources: Zn-smelting, coaly particles and waste disposal. Overall, this methodology offers valuable insight into pollution sources identification, which can be extended to comparable scenarios of complexly polluted environmental compartments. The information gathered using t his approach is also important for the planning of risk assess-ment procedures and potential remediation strategies. 1. Introduction The presence of multiple sources of contamination in extensive in-dustrial areas makes it very difficult to trace the origin of contaminants.Multifaceted pollution is especially relevant in coastal areas given the importance of the ecosystems affected and the complex fate of con-taminants in environmental compartments. Shorelines are sites of great ecological value and economic importance (An buselvan a nd Sridharan ,2018; J ha e t al ., 2019; M oss i n ge r e t a l , 2013) impacted by global warming consequences (N azarn i a e t a l ., 2020), and frequently altered by anthropogenic factors such as industrial activity, waste disposal,navigation, agricultural, and municipal uses (K ennis h , 2002, 2017).The interaction of heavy industry with coastal environments leads to the release and accumulation of contaminants, among these, Potentially Toxic Elements (PTEs) and Polycyclic Aromatic Hydrocarbons (PAHs)are frequent. PTEs (e.g., As, Cd, Cu, Cr, Hg, Pb, Zn) can be toxic even at low concentrations, mainly depending on their speciation, and are commonly monitored in mining and industry activities (Liu e t al., 2020;W u e t a l ., 2018), including metallurgical facil i ties, oil combustion,power plants, and chemical manufacturing (A wa s t h i e t al., 2017; Kow als k a e t a l .,2018). PTEs accumulation in the environmental com-partments can damage wildlife habitats by biomagni f ication, and can affect human health by direct exposure, e.g., dust inhalation, ingestion of contaminated water or soil/sediment, and accumulation in the food chain (Li et a l ., 2020; Qin g e t a l ., 2015; Z han g et a l ., 2014). Several technologies have been developed for removing or immobilising PTEs,in order to reduce environmental risks (B a r a gan o et a l., 2021; H i l l e r et a l ., 2021; K a y a n, 2019; Ka ya n and Ka ya n , 2021). E-mail address: d i ego b cot o @u n iovi .e s (D. Baragano). h t tps://doi.or g/10.1016/j .j h azm at .2021.127413 Received 30 June 2021; Received in rev i sed form 20 September 2021; Accepted 30 September 2021 Available online 2 October 2021 0304-3894/C 2021 TheAuthor(s). et a l ., 2020). To overcome this i ssue, environmental forensics proposes analytical approaches combined with a detailed knowledge of the study area and its industrial history (Bo n ett i and Qu ar i n o, 2014; Hag ma n n et a l ., 2019; Sa ng wa n e t a l ., 2020; Tha v amani et a l., 2011). Therefore,forensics studies encompass the search for compounds, elements, iso-topic signatures, and /or molecular-markers to ident i fy dist i nctive fea-tures of contamination (F er na nd e z et a l ., 2020; G al le go e t a l., 2016;Ke l epertzi s et a l., 2020; K omar e k e t al., 2008; L e e e t a l., 2020), given that the differentiation of pollution sources is relevant from the perspective of environmental and public health. These approaches can also be supported by the application of multivariate statistical methods to differentiate between polluted and unpolluted areas, and also to ident i fy correlations between contaminants, revealing common anthropogenic sources (G al l ego e t al., 2019; R e id y e t al., 2013; Sierr a e t a l .,2014). Within this context, the goa l of this research is to propose a novel integration of environmental forensic techniques and multivariate sta-tistics, i n order to disentangle the complexity of pollution sources that could be overlooked by means of other commonly used methodological approaches. This can be also useful to obtain additional data relevant to subsequent steps in the site remediation process (risk assessment, se-lection of remedial technologies, etc.). We thus focus on providing new 262400 262700 Fig. 1. Study area and samples along the three defined zones. Main industria l areas are i ndicated. Note also that feeding material (Fe-ores and Zn-ores) and coal are frequently stockpiled in the harbour. Other nearby industries (not included in the map) are located in an area l ess than 3 km to the south-east of the study area. multidimensional insights for anthropogenic source tracing in industrial areas , rather than focusing on only a limited number of parameters or a mere quantification of usual contaminants. The industria l area and the surroundings of Aviles (Principality of Asturias, northern Spain) is a great example to demonstrate the usefulness of the proposed method-ology in a polluted shoreline area. 2. Materials and methods 2.1. Site description The sampling campaign focused on the left bank of the Aviles Estu-ary, where 3 zones were considered (F i g . 1). Covering 9.2 Ha, zone I is an area of dunes located in the mouth of the Aviles Estuary. This zone is formed mainly by natural sandy sediments mixed with anthropogenic materials such as fillers, and industria l and construction wastes of silty-sand texture. Zone II comprises the San Juan de Nieva beach and dunes that were restored in 2001 by means of a sandy refil l from a nearby submarine deposit. Zone II is along the Salinas-San Juan de Nieva walking route, comprising part of the El Espartal dune system, one of the main aeolian dune systems in Spain (Fl o r-B l an co e t al., 2013) and declared a natura l monument (C M AOTI , 2006). The geologica l substrate in zones II and III is medium sand formed by the fragmentation of sedimentary rocks such as Triassic siltstone, Jurassic limestone, and Middle Jurassic si l iceous conglomerates (Fl o r -Bl a n co et a l ., 2013). 2.2. Sampling and samples preparation A total of 66 samples were collected followed a random scheme (F ig.1); only for sampling density purposes three zones were defined on the basis of previous data (Si e r ra e t al., 2014) and current land uses: In zone I (anthropogenic zone), 38 samples were collected, following a high sampling density of 4 samples/ha due to the observed in situ grain size heterogeneity of the materials and the evidences of debr i s disposal in the area (T he oc h a r opou lo s e t a l., 2001). For zones II (restored area)and III (dunes area), the sampling density used (28 samples in total ) was lower as a resul t of the higher homogeneity of the sediments. Zone I I was affected by different and current pollution sources due to the restoration actions, thus it was separated from zone III, which represents the dunes area without presence of coarse fragments related to industrial or min-ing wastes. Specific samples of smelting slag (n =2) and fly ash (n =3) were collected from stock-piles situated closed to the Zn-smelter and out of zones I, II, III. These stock-piles, which are associated with Zn ore pro-cessing (Si e rr a e t al., 2014), were disposed of in an uncontrolled manner for years during the second part of the 20th century. Finally, to gather information about the geochemical background , rock samples were also taken from the outcrops in the cli f fs located on the south part of the beach. Composite sediment samples (1 kg) were collected from the upper 20 cm with a stainless-steel auger and stored in inert plastic bags. All samples were air-dried at below 30 °C to avoid loss of Hg due to i ts high volat il ity and potent i al influence on PAHs determination . Samples were then sieved at 2 mm to remove vegetation, rocks, and anthropogenic particles over this size. An aliquot of each sample was mi l led (below 100 um) using a RS 100 Resch mil l at 500 RPM for 60 s. 2.3. Chemical composition and multivariate statistics To determine tota l concentrations of Ag, Al , As, Ba, Bi, ca, Cd, Co, Cr,Cu, Fe, Ga, Hg, K , Li , Mg, Mo, Ni, Pb, Rb, Light Rare Earths (LREE; as the sum of Ce, Eu, La, Nd, Pr, and Sm), Heavy Rare Earths (HREE; as the sum of Dy, Er, Gd, Ho, Lu, Tb, Tm and Yb), Sb, Sc, Sn, Sr, Th, Ti, Tl, U,V,Y and Zn, representative mi l led sub-samples of 1 g were shipped to the ISO 9002-accredited Bureau Veritas Laboratories (Vancouver, Canada ).Samples were subjected to “aqua regia”digestion and the inorganic chemical composition were determined by Inductively Coupled Plasma-Mass Spectrometry (ICP-MS) us i ng the Ultratrace AQ250 analytical package. For QA/QC purposes, five blanks (analytical and method), five duplicates, and ten analyses of standard reference materials (internal standards and OREAS45EA) were inserted into the sequences of samples to provide a measurement of background noise, accuracy, and precision. Descriptive statist i cs (mean, median, standard deviation (SD), and relative standard deviation (RSD)) were obtained for all the elements analysed i n the samples. Moreover, this database was subjected to a Factor Analysis employing Principal Component Analysis. Factor extraction was performed by the Kaiser/Gutmann criterion and Varimax rotation was applied to minimise the number of variables with high loadings (R e i ma n n an d De Car i t a t , 2005). To obtain groups of samples wi t h similar geochemical profiles, a cluster analysis was carried out on the factor coefficient matrix as described in Gall e g o e t al. (2019). The hierarchical procedure applied Ward’s algorithm, maximising the vari-ances between groups and minimising them between members of the same group (Murt ag h a n d Legend r e , 2014). The Sediment Quality Index (SQI) was determined for each sample using the SQI 1.0 model, which is a modified application of the CCME Water Quality Index model (C C M E , 2017, 2001). To calculate the SQI,As, Cd, Cu, Hg, Pb, and Zn concentrations and the reference values from the Predicted Effect Level (PEL) guidel i nes (C C M E , 2001) were intro-duced into the model . 2.4. Environmental forensic study For each cluster ident i fied in the previous step, three most polluted samples (higher SQI) were selected for additional analyses to ascertain pollution sources once considered that the similarity intra-group was high enough to obtain significant results only with three samples. As an exception, one of the groups (see results) was only represented by two samples. Particle s i ze fractioning was performed using wet-sieving (<125,125-500,500-2000 um f ractions). An enrichment factor for each of the three fractions was determined as the relationship between the PTE concentration in each fraction and that of the whole sample below 2mm. Mercury and As speciation was determined in a 1260 Infinity HPLC coupled to a 7700 ICPMS (Agilent Technologies) (Bar ag a n o et a l ., 2020). Lead isotopic composition (206Pb, 207Pb and 208Pb) was determined using ICP-MS (ICapQ, Thermo Scientific, Germany). Mass bias during the determination of the Pb isotopic ratios was corrected using analyses of SRM 981 (Common lead NIST, USA) after every two samples. The standard errors for measurement of the 206pb/207Pb and 208pb/206Pb ratios were < 0.3% RSD and <0.4% RSD, respectively. For PAH determination, representative 10 g subsamples were extracted with dichloromethane: acetone (1:1) in a Soxtherm apparatus (Gerhardt). The extracts were concentrated by rotary evaporation, and the 16 priority PAHs were measured after injection into a 7890A GC System coupled to a 5975C Inert XL MSD with a Triple-Axis Detector (Agilent Technologies) and following a modification of EPA method 8272. The chromatographic parameters used were as in B oen t e e t al.(2020). The mass spectrometer was operated in selected ion monitoring mode (SIM), and the quantification m/z relations are shown in T ab le S 1.PAHs were classified according to the molecular weight: the sum of heavy molecular weight compounds (ZHMW)) were determined comprising Naphthalene (N), Acenaphthylene (Acy), Acenaphthene (Ace), Fluorene (F), Phenanthrene (Phe), and Anthracene (Ant) con-centrations; and the sum of light molecular weight compounds (ZLMW)were calculated summing Fluoranthene (Fla), Pyrene (Pyr), Benz[a]anthracene (BaA), Chrysene (Chr), Benzo[b]fluoranthene (BbF), Benzo [k]f luoranthene (BkF), Benzo[a]p aJp yrene (BaP), Dibenz[a,h]anthracene (DBahA), Benzo[ghi]perylene (BghiP), and Indene[1,2,3-cd]pyrene (Ipyr ) concentrations. Furthermore, total ion chromatograms (TIC) of the most relevant samples were obtained in full -scan mode (mass range acquis it ion from 45 to 500 m/z) for qualitative description. 3. Results and discussion 3.1. Potentially toxic elements Descriptive statistics of the mult i -element analysis are shown in T ab le 1 (n=66). Mean concentrations of As, Cd, Cu, Hg, Pb, and Zn exceeded the PEL values (Ta bl e 1). PTE data for these six elements were non-normal as the RSDs were above 50, indicating high variability and suggesting an anthropogenic input. In contrast, typically lithogenic el -ements, such as V or REEs, followed a normal distribution with a low RSD. Table 1 Descriptive statistics for the elements studied: mean, standard deviation (SD),relative standard deviation (RSD), minimum (Min.) and maximum (Max.), and reference values according to PEL (C CM E, 2001) guidelines for the PTEs of i n-terest. All data are expressed in mg/kg, except g/kg for Al, Ca, Fe, K, Mg. Element Mean SD Min. Max. RSD (%) PEL Ag 1.02 1.21 0.02 7.77 119 A1 1.01 0.43 0.45 2.15 42.2 As 43.4 26.0 9.50 141 59.8 41.6 Ba 273 203 29.0 917 74.7 Bi 0.94 1.01 0.16 7.05 107 Ca 2.09 0.87 0.15 5.01 41.4 Cd 18.3 21.7 0.34 111 119 1.20 Co 7.62 2.90 2.70 18.2 38.1 Cr 20.2 7.84 9.00 61.0 38.8 Cu 78.6 78.7 8.80 515 100 108 Fe 2.78 1.37 1.01 8.42 49.3 Ga 3.20 1.01 1.56 5.70 31.7 Hg 4.70 13.5 0.07 70.0 287 0.70 K 0.17 0.10 0.08 0.60 59.9 Li 13.6 3.47 5.50 24.4 25.6 Mg 0.48 0.12 0.14 0.86 25.4 Mo 1.05 1.11 0.23 7.62 107 Ni 18.8 7.60 7.90 51.4 40.4 Pb 407 320 74.9 1900 78.6 112 Rb 8.98 4.74 3.80 25.8 52.8 LREE 55.8 10.9 32.1 88.5 19.5 HREE 4.95 1.03 2.50 7.70 20.9 Sb 5.36 3.88 1.09 19.3 72.4 Sc 1.86 0.59 0.80 3.50 31.8 Sn 4.79 5.38 0.44 33.3 112 Sr 85.5 31.4 15.1 188 36.7 Th 3.63 1.57 0.50 7.90 43.2 Ti 0.01 0.01 0.00 0.03 37.5 T1 0.22 0.28 0.03 2.20 132 U 1.00 0.57 0.30 2.60 56.9 V 27.8 8.20 12.0 59.0 29.5 Y 5.66 1.50 2.53 10.9 26.6 Zn 5310 5626 721 38400 106 271 The factor analysis was initially tested using the Kaiser-Meyer-Olkin (KMO) parameter to evaluate the proportion of variance that may be caused by several factors (C er n y a nd Kaise r , 1977). In this case, a KMO value of 0.705 was obtained, thereby indicat i ng good adequacy.Extraction was done using pr i ncipa l components followed by varimax rotation, and six factors were obtained, explaining approximately 88%of the initial variance (Ta bl e 2). PTEs such as Cd, Cu, Hg, Pb, Tl, and Zn were well represented by Factor 1 (F1), accounting for 20.6% of the variance. The association of these pol l utants is well-known in environmental geochemistry (B ur t on e t a l ., 2005) and may be linked here to the Zn- smelter emissions, as previously reported (G all e go et a l., 2002; S ie rra e t al., 2014), and also given the typical Zn ore mineralogy and the subsequent PTEs emissions in this type of metallurgical industry (Van ěk e t al., 2013). Factor 2 (F2) accounted for 19.8% of the variance and included el-ements related to natural and clayey or fine sand materials, such as Al, K,or Rb. This factor may be labelled as a natural input (Galle go et al.,2002). Likewise , lithogenic elements such as Sc, and REEs were repre-sented by Factor 3 (F3), which accounted for 19.0% of the variance. This factor relates to the natural geochemical background (geogenic dust and sand) (López Pe láe z a nd R o dr igu e z , 2008), probably representing a second natural input. Factor 4 (F4) accounted for 12.3% of the variance. The main ele-ments included in this factor were Co, Cr, Mo, Ni, and Sn, which may be associated with Fe oxides and linked both to natural oxides but also to Fe metallurgy emissions, and perhaps to Fe ore dust resulting from the handling of the mineral in the harbour. Calcareous materials are represented by Factor 5 (F5), which was less relevant , accounting for 8.9% of the variance. Elements such as Ca and Mg were the most representative in this factor. The last factor (F6) included As and Sb and accounted for 7.9% of the variance. These two metalloids (and PTEs)) commonly show a geochemical association (F u e t a l ., 2016; H ale, 1981) and their presence in the same isolated factor may suggest mixed origins. The factor coefficient matrix was used to carry out a hierarchical analysis, which resulted in six geochemical clusters of samples (Fig . S 1).These groups were represented geographically (F ig.2) and the average factor loadings for the samples belonging to each one were calculated (Tabl e S2). Concretely, group A was related to a natural factor (F3),which is consistent with the beach and restored dune area. Group B was related to F1 (Zn-Cd-Pb), which is consistent with the high PTE contents,as most of the samples included were taken near the Zn smelter. Group C was associated with the calcareous materials present in the sand of the beach and dunes (F5). Group D was linked to the notable abundance of As (F6) in a specific subarea of the anthropogenic fillers . Group (E) was l i nked to clayey materials (F2), probably due to the protosoil generated in the leeward zone of the dunes. Finally, group F was formed only by two outliers, which seem to be related to the Fe metallurgy (F4), prob-ably due to the presence of slag fragments irregularly distributed in the area sampled. 3.3. Forensic study 3.3.1. As, Hg speciation and particle size distribution A first approach to unravel the distribution of the main PTEs within the cluster groups was done using PTEs ratio (F i g . 3a ), which revealed similar patterns for samples from groups A and D, whereas those of the remaining groups differed (groups B, C, E and F). Focusing on As, samples from group D showed the highest concen-trations in the area (86-293 mg/kg As) whereas those from group A were between 14 and 50 mg/kg. In this context, As speciation was determined in an attempt to discriminate between the two groups (A and D). As observed in F ig . 3(b), the higher proportion of As(V) in samples from group D, up to 96%, than i n samples of group A (91%), suggested Table 2 Factor loadings (loadings below 0.3 are omitted, between 0.3 and 0.6 should be managed prudent l y, higher than 0.6 marked in bold), communalities (all the elements above 0.7), and explained variance obtained after factor analysis (principal components + varimax rotation). Variable F1 F2 F3 F4 F5 F6 Communality Zn .923 .907 Pb .894 .873 T1 .889 .888 Hg .818 .697 Cd .818 .718 Bi .787 .480 .907 Ag .783 .420 .963 Cu .670 .573 .938 Rb .978 .961 K .942 .921 Al .933 .947 Li .738 .396 -0.372 .880 Ga .343 .685 -0.371 .852 U .521 .668 .338 .930 Ti .631 .449 .427 .868 V .925 .916 LREE .305 .859 .902 Ba .807 .765 HREE .433 .804 .325 .944 Sc .390 .776 .394 .918 Th -0.325 .756 .769 Y .573 .583 .410 .927 Mo .307 .889 .957 Ni .345 .807 .890 Cr .471 .784 .956 Co .450 .458 .653 .900 Fe .644 .652 .925 Sn .437 585 .426 .820 Sr .870 .886 Ca .304 .867 .960 Mg .404 .502 .546 .790 As .382 .763 .847 Sb .319 .401 .760 .882 Var. Explained (%) 20.6 19.8 19.0 12.3 8.9 7.9 that As derives from at least two distinct sources. Moreover, As specia-tion analysis of samples of ash and slag revealed that they did not contain significant As(III). This is a similar result (As(III) content <1 mg/kg) to that obtained for the As speciation pattern of the other 4groups (B, C, E and F). Therefore, As speciation suggests three poten-tially dist i nct As sources, one for group A, one for group D, and another one for groups B, C, E and F (mostly coincident with the As speciation in the smelter by-products). On the other hand, Hg speciation analyses revealed that Hg in all samples was fully inorganic (no methyl-or ethyl-Hg present ), thus this parameter was not useful i n this study. In addition, weight proportions obtained after grain-size fractioning showed that the finer and the coarser fractions (< 125 um and 500-2000 um) were the least abundant (fraction 500-2000 um was even absent in some cases) and accounted for less than 10 w/w% in all samples. However, the proportion of PTEs was higher in these fractions,as revealed by enrichment ratios above 1 (T a bl e S3). These larger contaminant loads for the least abundant fractions can be related to diffuse pollution (dust and ash) (< 125 um) and waste deposition (500-2000 um) within the site. In fact, i t is possible to identify slag and ore fragments in the coarse materials (500-2000 um fraction), whereas medium-size particles (125-500 um fraction) are mostly associated with geogenic particles as those found in beach and dunes. In addition, the element ratios of the different grain-size fractions revealed opposing trends (F ig. 3(c), (d)) between the pattern of the 125-500 um fraction and the finer fraction (< 125 um) i n group A (F ig. 3(c), (d)). In fact, the finest fraction was similar to the other samples irrespective of the group and grain-size, thereby suggesting that pollu-tion of fine particles of group A is related to atmospheric deposition affecting the whole area, whereas the geochemical pattern of the 125-500 um fraction is concordant with the restoration work under-taken i n zone II (where samples of group A are i ncluded). Regarding the coarser fractions from groups C, D and E, high PTE concentrations are mainly a result of the presence of slags and also ore fragments. 3.3.2. Pb isotope fingerprinting Several sources of Pb were foreseeable in the study area due to in-dustrial activities (Zn-smelter but also others involving the combustion of fossil fuels) and geogenic i nputs. Init i al l y, t he bedrock samples , taken from the sedimentary rock formation as a geochemical background, and the “allochthonous” waste (ash and slag) were characterised by notably distinct Pb isotopic signatures (F i g . 4). Pb isotopic ratios for the ash and slag revealed relatively homogenous compositions, and the same f i nger-print was found for some of the most polluted samples. These observations thus strongly support that the main source of pollution in these samples is related to the activity of the Zn-smelter, except for group A pointing to other sources. In this regard, as reported by (Di az-So mo ano e t al ., 2007),the coa l samples revealed a Pb isotopic fingerprint consistent with samples belonging to group A (F ig . 4), and even for some from other groups. This f i nding strongly suggests that coa l combustion (and even coal dust ) could be another source of Pb pollution. This hypothesis is supported by previous evidence of the notable influence of coal combustion on Pb content in soils in other areas of the Asturias region affected by heavy industry emissions (B oente e t al ., 2020,2017). In any case, these data should be carefully managed as, i n recent decades, coals f rom different areas of the world have also been used /managed in regional industries and harbours and this practice may modify Pb signatures (D as e t al., 2018;Zhu e t a l ., 2020). 3.3.3. PAHs Most of the samples showed considerable PAH contents (above 1 mg/kg for most samples, see T a b l e 3) with the exception of slag samples that had no PAHs. This coincides with a ZHMW/ZLMW ratio up to 6 revealing a pyrogenic origin for these pollutants in most of the study area, since ZLMW compounds are usually predominant in petrogenic 262400 262700 263000 263300 Fig. 2. Sediment classification after cluster analysis. materials whereas ZHMW are produced mainly by pyrolytic activities (Thiomba n e et al., 2019; Z h an g et al., 2008).Accordingly, and consis-tent with the findings of P ies e t al. (2008), the Ant/(Ant +Phe) ratio exceeded 0.1 for all groups and t hus PAHs may derive from pyrogenic sources. Nevertheless, samples in group A had a significant lower ZHMW/ZLMW ratio (close to 1) t han those in the other groups and also the lowest concentrations of PAHs. Moreover, ash had an average ZHMW/ZLMW ratio of 0.07, which is not in accordance with a pyrolytic origin. On the whole, a mixed source of pollutants can be proposed for group A samples and also for ash, as both are non-autochthonous ma-terials in the study area and could have received a petrogenic i nput, such as coal dust. Other molecular ratios reaff i rmed the general hypothesis of a pre-dominant pyrogenic source for PAHs in the study area . For example, as shown in Tab l e 3, the Fla/(Fla + Pyr) and Ipyr/(Ipyr + BghiP) ratios were consistently above 0.5, indicating “grass, wood and coa l combus-tion”according to D e La T o rr e-Roch e e t a l. (2009) and Yun ker et a l .(2002). Also, the BaA/(BaA + Chr) ratio (Y unker e t al ., 2002) showed that combustion of organic matter is the main source of PAHs (coal combustion but perhaps , in our case, also organic matter i n the mineral ores treated in metallurgical processes). This is in coherence with the previous data referred and with the type of industries in the study area.To better i l lustrate these conclusions, cross-plots between ratios are shown in Fi g . S2. Nevertheless, it should be noted that PAHs ratios have some limitations (T hi o mb a ne et a l ., 2019), as relative proportions of the organic compounds are usually assumed to be conserved between emission sources and the measurement points (R o cha and Palm a, 2019),and they do not take into account possible alterations of the PAHs (biodegradation, buria l and removal rates, etc.) as considered in L v e t a l .(2020). Finally, irrespective of molecular ratios, the concentrations of PAHs in the samples belonging to group D were significantly higher than those of t he other groups (Ta b l e 3). This i s another relevant feature of group D,together with the previously noted abundance of As(III), thus revealing the presence of a specific source of organic pol l utants and As in the sediments included i n this group (northern part of zone I, F i g . 2). TIC chromatogram showed a typical fingerprint of a coal tar dist il late (Em s bo -M a tt i n g ly a nd St o ut , 2011) with a marked abundance of heavy PAHs and the predominance of parent compounds (Fi g. 5), and the absence of typical petrogenic compounds such as alkyl-PAHs (Bo e n t e et a l., 2020 and references therein). This chromatogram rules out fuel spills as a source of pollution and indicates the probable release or 100 D/uz ■ Bedrock and slags Fig. 4. Pb i sotopic composition (208pb/206pb vs 206Pb/207Pb) of the samples collected i n the study area, i ncluding sediment samples (groups A to F),bedrock, ashes and slags l i nked to Zn production. Error bars represent standard errors for analytical measurements. The oval indicated in grey corresponds to the intervals obtained by D i az-So mo a n o e t a l . (2007). Leaded petrol signature corresponds to 206pb/207Pb =1.06-1.17 and 208Pb/206pb =2.119-2.198 ac-cording to several European studies (K ylander e t a l., 2005), therefore this signature is not shown in the f igure. Table 3 Sum of PAH concentrations and molecular diagnostic ratios for mean concen-trations of PAHs for each cluster. RSD indicated in brackets. (Ant: Anthracene;Phe: Phenanthrene; Fla: Fluoranthene; Pyr: Pyrene; Ipyr: Indene[1,2,3-cd]pyrene; BghiP: Benzo[ghi ]perylene; BaA: Benz[a]anthracene; Chr : Chrysene). Ashes Parameter Cluster groups A B C D E F 2PAHs 0.26 1.2 0.68 43.95 1.75 8.15 12.17 (mg/ (3%) (26%) (20%) (86%) (31%) (88%) (70%) kg) 2HMW/ 1.25 6.02 6.16 5.8 5.74 4.46 4.7 2LMW (22%) (14%) (27%) (2%) (5%) (12%) (10%) Ant/(Ant 0.51 0.35 0.58 0.22 0.29 0.29 0.07 +Phe) (3%) (14%) (17%) (3%) (21%) (25%) (12%) Fla/(Fla 0.55 0.56 0.55 0.59 0.58 0.58 0.58 +Pyr) (1%) (2%) (2%) (1%) (1%) (3%) (4%) Ipyr/ 0.55 0.70 0.69 0.76 0.71 0.72 0.78 (Ipyr + (1%) (2%) (1%) (1%) (3%) (4%) (7%) BghiP) BaA/(BaA 0.36 0.58 0.52 0.65 0.6 0.63 0.64 + Chr) (18%) (2%) (4%) (2%) (3%) (7%) (16%) disposal of waste rich in pyrogenic PAHs that was superposed onto the diffuse pollution derived from coal combustion processes. 3.4. Multi-approach for pollution source tracing Concordance between the forensic parameters described in the pre-vious sections can be decisive for the purposes of this study; i.e., the Time Fig. 5. Chromatogram (TIC, full-scan mode) of a representative sample of group D. combination of data from organic pollutants analyses, Pb isotope fingerprinting and chemical speciation, can provide greater support for deciphering pol l utant sources than using single technique. In this re-gard, a 3D representation to discriminate between groups i n a s i ngle view is presented in F ig. 6 using three variables: BaA/(BaA +Chr) as a means to distinguish pyrogenic and petrogenic sources of organic pollution, the 206pb/207Pb ratio to establish di ff erences within sources (208Pb/206Pb ratio reported similar results), and As speciation repre-sented by As(III). Using this combined-approach, samples from group A (green in Fi g.6) are clearly different i ated from the other samples as they show a notable abundance of As(III), a mixture of petrogenic and pyrogenic sources of organic pollution and a specific Pb isotopic composition.None of these three characteristics i s speci f ic to this group of samples but their combination reveals the specificity of the group. However, ac-cording to PAHs ratios, it is claimed that the influence of coal combus-tion particles is notable in this group. Simi l arly, group D was also clearly 口 A ●B O C O D O E O FF O O Ashes Fig. 6. Three-axis representation of the sediment and ashes samples with the contribution of PAH molecular ratios, As(I I I ) content and 206pb/207Pb ratio.Sediment groups A and D are clearly influenced by two speci f ic contamination sources and di f fered from the other sediment group samples, which are closely together influenced by y the e Zn smelter, since these are closertc ashes fingerprint. distinguished from the others because of high As(III) pollution, different Pb isotopic fingerprints and a high BaA/(BaA + Chr) ratio. The extremely high PAHs concentrations, coupled to As(III) presence and the chromatogram fingerprint (F ig. 5), suggest that pol l ution source corre-sponds to the waste disposal of a material non-related to the Zn smelter close to the site. Finally, ash samples were also clearly differentiated,whereas no significant differences were found for samples from the other group, which mostly showed the general pol l ution pattern of the study area; i.e. inorganic pollutants derived largely from the activities of the Zn-smelter and organic pollution caused by the emission of coal combustion. The 3D representation described here is a novel tool and can easily be adapted to other complex polluted sites. 4. Conclusions Environmental forensic studies can distinguish between pollution sources in areas with complex contamination profiles, thereby going beyond the quantification of contaminants or single geochemical ratios.In this context, we propose an approach consisting of a novel combi-nation of multivariate statistics and forensic techniques applicable in zones affected by diverse, inorganic (PTEs) and organic (PAHs), point-source and diffuse pollution sources. This methodology was tested in the coastal area of Aviles (Spain),where heavy industrial activity has led to a mixture of anthropogenic and natural sediments. Factor analysis and a subsequent hierarchical clustering led to the establishment of six groups of samples, whereas grain-size distribution determined that pollution affected mostly the finest fractions. After a selection of speci f ic samples using a pollution index (SQI in our case), a more i n-depth examination of the pollution sources was achieved by As speciation, Pb isotopes and organic pollut-ants (molecular markers of PAHs ) determinations. Aggregate three-axis representation of the referred parameters permi t ted differentiation of diverse pollution sources, and it also prov i ded an understanding of local features, such as Zn-smelter emissions, waste disposal or deposition of coaly particles. In general , the main contribution of this study is a powerful combi-nation of tools providing a mult i faceted approach useful to understand pollution complex scenarios (see f lowchart in F ig . S3), thereby providing a valuable insight into pol l ution sources identification. Like-wise, this approach can be easily extended to similar sites, and may support risk assessment and selection of remediation technologies. CRediT authorship contribution statement D. Baragano: Conceptualization, Methodology, Data curation, Formal analysis, Writing- original draft . G. Ratie: Methodology, Data curation, Formal analysis, Writing - review & edit i ng. C. Sierra:Conceptualization, Writ i ng - review & edit i ng. V. Chrastny: Formal analysis, Writing- review & editing. M. Komarek: Supervision, Re-sources, Writing - review & editing. J.R. Gallego: Conceptualization,Supervision, Resources, Wri t ing - review & editing. Declaration of Competing Interest The authors declare that they have no known competing financial interests or personal relationships that could have appeared to influence the work reported in this paper. Acknowledgements This work was par t ially funded by the Czech Science Foundation (project No. 19-15405S) and by the project NANOCAREM (AEI/Spain,FEDER/EU, MCI-20-PID2019-106939GB-I00). Diego Baragano obtained a grant f rom the“Ayudas complementarias para beneficiarios de ayudas (FPU): Estancias Breves y Traslados Temporales” program, n'. EST19/00030, financed by the “Ministerio de Educacion y Formacion Profe-sional " of Spain. We would l i ke to thank the Environmental Assay Unit of the Scientific and Technical Services of the University of Oviedo for i ts technical support. The authors thank 6 anonymous reviewers for improving the quality of the paper. Appendix A. Supplementary material Supplementary data associated with this article can be found in the online version at d o i:10.1016/j.jh az m a t.2021.127413. References Anbuselvan, N., D, Senthil Nathan, Sridharan, M., 2018. Heavy meta l assessment in surface sediment s off Coromandel Coast of India: implication on marine pollution.Mar. Pol l ut. Bul l . ht tp s://doi .org /10.1016/j .ma rpol b u l .2018.04.074. Awasthi, M.K., Liao, R., Al i , A., Mahar, A., Guo, D., L i, R., Xining, S., Awasthi, M.K.,Wang, Q., Zhang, Z., 2017. Spatial distribution and risk assessment of heavy metals in soi l near a Pb/Zn smelter in Feng County, China . Ecotoxicol. Environ. Saf. h t tp s://d o i .org/10.1016/j .ecoenv.2017.01.044. Baragano, D., Alonso, J., Gallego, J.R., Lobo, M.C., Gil -Diaz, M., 2020. Zero valent iron and goethite nanopartic l es as new promising remediation techniques for As-pol l uted soils. Chemosphere 238, 124624.h t t ps://d oi.o r g/10.1016/j .chemosph e re .2019.124624. Baragano, D., Gallego, J.L.R., Maria Menendez-Aguado, J., Marina, M.A., Sierra, C.,2021. As sorption onto Fe-based nanopart i cles and r ecovery from soils by means of wet high intensity magnet i c separation. Chem. Eng. J . 408,127325 ht tps ://doi .o rg/10.1016/j.c e j .2020.127325. Boente, C., Matanzas, N., Garcia-Gonzalez, N., Rodriguez-Valdes, E., Gallego, J.R., 2017.Trace elements of concern affecting urban agriculture in industrialized areas: a mul t ivariate approach . Chemosphere 183, 546-556. htt ps://d o i .o r g/10.1016/j .chemosp h ere.2017.05.129. Boente, C., Baragano, D., Gal l ego, J.R., 2020. Benzo[a]pyrene sourc i ng and abundance i n a coa l region i n transi t ion reveals historical pollution, rendering soi l screening l evels impractical . Env i ron. Pol l ut . 266, 115341 h t tps ://do i .or g /10.1016/j .envpo l.2020.115341. Bonetti, J.,Quarino, L., 2014. Comparative forensic soil analysis of new jersey state parks using a combination of simple techniques wi t h mul t ivariate stat i st i cs . J. Forensic Sci.59, 627-636. h t t ps ://d o i .org /10.1111/1556-4029.12375. Burton, E.D., Phi l lips, I .R., Hawker, D.W., 2005. Geochemica l par t i t ioning of copper,lead, and zinc in benthic , estuarine sediment prof i les. J. Env i ron. Qual. 34,263-273.h t t ps ://d o i.org /10.2134/je q 2005.0263. CCME, 2017. Canadian Water Quality Guidelines for the Protection of Aquatic Life:CCME Water Quality Index, User's Manual - 2017 Upd a te, Canadian Water Quality Guidelines for the Protection of Aquatic Life. CCME, 2001. Canadian Water Qual i ty Guidelines for the Protec t ion of Aquatic Life:CCME Water Quali t y Index 1.0, Canadian Water Qual i ty Guidel i nes for the Protection of Aquatic Life. Cerny, B.A., Kaiser, H.F ., 1977. A study of a measure of sampling adequacy for factor-analytic correlation matrices. Multivar. Behav. Res. 12, 43-47. ht tp s://d o i .org /10.1207/s15327906m br12013. CMAOTI , 2006. Decreto 81/2006, de 29de junio, de la Consejeria de medio ambiente,ordenacion de l territorio einfraestructuras. Boletín Oficial del Principado de Asturias del 21 de julio de2006. Das, A., Patel, S.S., Kumar, R., Krishna , K.V.S.S., Dutta, S., Saha , M.C., Sengupta, S.,Guha, D., 2018. Geochemical sources of metal contamination in a coa l mining area in Chhattisgarh, India using lead isotopic ratios . Chemosphere 197, 152-164.h t tps://do i.org/10.1016/j .ch emos p here.2018.01.016. De La Torre-Roche, R.J ., Lee, W.Y., Campos-Diaz, S.I., 2009. Soil-borne polycyclic aromatic hydrocarbons in El Paso, Texas: analysis of a potential problem in the United States/Mexico border region. J. Hazard. Mater. 163, 946-958. h t t ps://d o i .o r g /10.1016/j .jha z mat.2008.07.089. Diaz-Somoano, M., Suarez-Ruiz, I ., Alonso, J.I .G., Rui z Encinar, J., Lopez-Anton, M.A.,Mar t inez-Tarazona, M.R., 2007. Lead isotope ratios in Spanish coals of di f ferent characteristics and origin. Int. J . Coal Geol. 71, 28-36. htt ps://do i .o r g/10.1016/j .coal.2006.05.006. Emsbo-Mattingly, S.D., Stout, S.A., 2011. Semivolatile hydrocarbon residues of coal and coa l tar. Coal and Pea t Fires: A Global Perspective. h t t ps://do i .o r g/10.1016/B 978-0-444-52858-2.00011-6. Fernandez, B., Lara, L.M., Menendez-Aguado, J.M., Ayala, J ., Garcia -Gonzalez, N.,Salgado, L., Colina, A., Gallego, J.L.R., 2020. A multi-faceted, environmental forensic characterization of a paradigmatic brownfield polluted by hazardous waste containing Hg, As, PAHs and dioxins. Sci. Total Environ. 726, 138546 htt ps://d o i.o r g /10.1016/j.sci t oten v .2020.138546. Flor-Blanco, G., Flor , G., Pando, L., 2013. Evolution of the Salinas-El Espartal and Xago beach/dune systems in north-western Spain over recent decades: evidence for responses to natural processes and anthropogenic interventions. Geo-Mar. Lett . 33,143-157.htt p s://doi .org /10.1007/s00367-012-0301-3. Fu, Z., Wu, F ., Mo, C., Deng, Q., Meng, W., Giesy, J.P., 2016. Comparison of arsenic and antimony biogeochemical behavior in water, soil and tail i ngs from Xikuangshan,China. Sci. Tota l Environ. 539, 97-104. h t tps ://doi .or g /10.1016/j . s ci to t env.2015.08.146. Gallego, J.L.R., Ordonez , A., Loredo, J., 2002. Investigation of trace element sources from an industrialized area (Aviles, northern Spain) using mul t ivariate statistical methods. Environ. Int. 27, 589-596. h t tps ://do i.o r g /10.1016/S 0160-4120(01)00115-5. Gal l ego, J.L.R., Ortiz, J .E ., Sánchez-Palenc i a, Y., Baragano, D., Borrego, A.G., Torres, T.,2019. A multivariate examination of the timing and accumulation of potential l y toxi c elements at Las Conchas bog (NW Spain). Env i ron. Pol l ut . 254, 113048 h t t ps://d oi .o r g/10.1016/j .envp ol .2019.113048. Gallego, J.R., Rodriguez-Valdes, E., Esquinas, N., Fernandez-Brana, A ., A fif, E., 2016.Insights into a 20-ha multi -contaminated brownfield megasite : an environmental forensics approach. Sci. Total Environ. 563-564,683-692.h t tp s://doi .o r g/10.1016/i .sci tot env.2015.09.153. Gao, B., Wang, X.M., Zhao, X.Y., Ding, X., Fu, X.X., Zhang, Y.L., He, Q.F., Zhang, Z.,Liu, T.Y., Huang, Z.Z., Chen, L.G., Peng, Y., Guo, H., 2015. Source apportionment of atmospher ic PAHs and t heir toxicity using PMF: impact of gas/particle part i tioning.Atmos. Environ. 103, 114-120. h t tps ://d o i .or g /10.1016/j .a t m os e n v.2014.12.006. Hagmann, D.F., Kruge, M.A., Cheung, M., Mastalerz, M., Gallego, J.L.R., Singh, J.P., Krumins, J .A., Li , X.N., Goodey, N.M., 2019. Environmental forensic characterization of former rail yard soils located adjacent to the Statue of Liberty in the New Y Y o O rk/New Jersey harbor. Sc i. Tota l Environ. 690, 1019-1034. h t tp s://d o i .org/10.1016/j .s c i t oten v .2019.06.495. Hale, M., 1981. Pathfinder applications o f arsenic, antimony and bismuth in geochemical exploration. J. Geochem. Explor. 15, 307-323. ht tp s://doi.o r g /10.1016/0375-6742(81)90071-6. Hiller , E., Jurkovic, L., Farago, T., Vitkova, M., Toth, R., Komarek, M., 2021.Contaminated soils of different natural pH and industrial origin : the role of (nano)iron- and manganese-based amendments i n As, Sb, Pb, and Zn leachability . Environ.Pollut . 285, 117268 htt ps://d o i .o r g/10.1016/j.e n vpol.2021.117268. Jha, D.K., Ratnam, K., Rajaguru, S., Dharani, G., Devi, M.P., Kirubagaran, R., 2019.Evaluation of trace metals i n seawater, sediments, and bivalves of Ne l lore, southeast coast of India, by using multivariate and ecologica l tool. Mar. Pollut. Bul l . 146,1-10.h t t ps ://doi .o r g /10.1016/j .marpo l b u l .2019.05.044. Kayan, A., 2019. Inorganic-organic hybrid materials and their adsorbent properties. Adv.Compos. Hybrid Mater. 2, 34OS.-45.h t tps://doi.org/10.1007/s 42114-018-0073-y . ¥O1. Kayan, G.O., Kayan, A., 2021. Composite of natural polymers and their adsorbent properties on the dyes and heavy metal ions. J. Polym. Environ. 29, 3477-3496.h t tps ://do i.org/10.1007/s10924-021-02154-X . Kelepertzis, E., Argyraki, A., Chrastny, V., Botsou, F ., Skordas, K., Komarek, M.,Fouskas, A., 2020. Metal(loid) and isotopic tracing of Pb in soils, road and house dusts f rom the industria l area of Volos (centra l Greece). Sci . Total Environ. 725,138300 h t t p s ://do i .o rg/10.1016/j .sci t ote nv .2020.138300. Kennish, M.J., 2002. Env i ronmental threats and environmental future of estuaries.Environ. Conserv . 29, 78-107. htt ps ://d o i .or g/10.1017/S0376892902000061. Kennish, M.J., 2017. Estuaries: Anthropogenic Impacts . Springer, Cham, pp. 1-9.h t t ps ://d oi .o rg /10.1007/978-3-319-48657-4_140-2. Komarek, M., Ettler, V., Chrastny, V., Mihaljevic, M., 2008. Lead isotopes in environmental sciences: a review. Environ. Int . 34, 562-577. h t t p s://doi.or g /10.1016/j .envin t .2007.10.005. Kowalska , J.B., Mazurek, R., Gasiorek, M., Zaleski, T., 2018. Pollution indices as useful tools for the comprehensive evaluation of t he degree of soil contamination-a review.Environ. Geochem. Health 40, 2395-2420. h t tps ://do i.org/10.1007/s 10653-018-0106-Z . Kruge, M.A., Lara-Gonzalo, A., Gallego, J.L.R., 2020. Environmenta l forensics of complexly contaminated sites: a complimentary fingerprinting approach. Environ.Pollut. 263, 114645 htt ps://d o i .o r g/10.1016/j.e n vp ol .2020.114645. Kylander, M.E., Weiss, D.J., Mart i nez Cortizas, A., Spiro, B., Garcia-Sanchez, R., Coles, B.J., 2005. Refining the pre-indust r ial atmospher i c Pb isotope evolution curve i n Europe using an 8000 year old peat core from NW Spain. Earth Planet . Sci. Lett . 240,467-485. h t t p s://d o i .or g /10.1016/j .eps l .2005.09.024. Lee, P.K., Kang, M.J., Jeong, Y.J., Kwon, Y.K., Yu, S., 2020. Lead isotopes combined with geochemical and mineralogical analyses for source ident i f i cation of arsenic in agricultural soils surrounding a zinc smelter. J. Hazard . Mater. 382, 121044 h t tp s://doi.or g /10.1016/j .j hazmat .2019.121044. L i, X ., Zhang, J., Gong, Y., Liu, Q., Yang, S., Ma , J., Zhao, L ., Hou, H., 2020. Status of coppe r accumulation i n agricultural soils across China (1985-2016). Chemosphere.h t tps://d o i .or g/10.1016/j .c hem osp h ere.2019.125516. Liu, J ., Wei, X., Zhou , Y., Tsang,D.C.W., Bao, Z., Yin, M., Lippold, H., Yuan, W., Wang, J.,Feng, Y., Chen, D., 2020. Thal l ium contamination, health risk assessment and source apportionment i n common vegetables. Sci. Total Environ. h t tps ://d o i.o r g /10.1016/i.sci t oten v .2019.135547. Lopez Pelaez, J., Rodriguez, G. Flor, 2008. Evolucion ambiental del estuario de Aviles (1833-2006).Trab. Geol. 119-135. htt ps ://do i .org /10.17811/t dg.28.2008. Lv, M., Luan, X., L i ao, C., Wang, D., Liu, D., Zhang, G., Jiang, G., Chen, L., 2020. Human impacts on polycyclic aromatic hydrocarbon distribution i n Chinese intert i da l zones.Nat . Sustain. 3, 878-884. ht tps://d o i .o r g/10.1038/s41893-020-0565-y . Menedez, M., Fernandez, B., 2005. Indus t rial park remediation in aviles. Miner. Energy Raw Mater. Rep. h t t p s://do i .org/10.1080/14041040510042301. Mossinger, J ., White, M., Goymer, P., 2013. Coastal regions. Nature 504, 35. ht tp s://d o i .org /10.1038/504035a . Murtagh, F., Legendre, P., 2014. Ward’s hierarchical agglomerative clustering method:which algori t hms i mplement ward’s criterion? J. Class if . 31, 274-295. h t tp s://d oi.or g /10.1007/s00357-014-9161-Z . Nazarnia, H., Nazarnia, M., Sarmas t i , H., Wi l ls, W.O., 2020. A systematic review of civil and environmental infrastructures for coastal adaptation to sea level rise. Civ. Eng. J.6, 1375-1399. h t t ps://d o i .o r g/10.28991/ce j -2020-03091555. Ordonez, A., Alvarez, R., De Miguel, E., Char l esworth, S., 2015. Spat i al and temporal variations of trace element distribution in soils and street dust of an industrial town in NW Spain: 15 years of study . Sci. Tota l Environ. 524-525, 93-103. htt ps ://doi.org/10.1016/j .sci t otenv .2015.04.024. Pies, C., Hoffmann, B., Petrowsky, J., Yang, Y., Ternes, T.A., Hofmann, T ., 2008.Characterization and source identification of polycyclic aromatic hydrocarbons (PAHs) i n r i ver bank soils. Chemosphere 72, 1594-1601. htt ps://do i.o r g /10.1016/j .ch em osp h ere.2008.04.021. Prahl, F.G., Carpenter, R., 1983. Polycyclic aromatic hydrocarbon (PAH)-phase associat i ons i n Washington coasta l sediment. Geochim. Cosmochim. Acta 47,1013-1023. h t tp s://do i .org/10.1016/0016-7037(83)90231-4. Pratt , B., Riesen, R., Johnston, C.G., 2012. PLFA analyses of microbial communi t ies associated with PAH-contaminated riverbank sediment . Microb. Ecol. 64, 680-691.h t tps://d o i.or g /10.1007/s00248-012-0060-8. Qing, X., Yutong, Z., Shenggao , L., 2015. Assessment of heavy metal pollution and human heal t h risk in urban soils of steel i ndustrial city (Anshan), Liaoning,Northeast China. Ecotoxicol. Env i ron. Saf. 120, 377-385. h t t ps://d oi .o r g/10.1016/j .ec o env.2015.06.019. Queipo-Abad, S., Gonzalez, P.R., Mar ti nez-Mor i llo, E., Dav i s, W.C., Garcia Alonso, J.I.,2019. Concentration of mercury species i n hair, blood and urine of i ndividuals occupational l y exposed to gaseous elemental mercury in Asturias (Spain) and its comparison with individuals from a control group formed by close relatives. Sci.Total Environ. 672, 314-323. h t t p s://doi.org/10.1016/j.sci t ot e n v .2019.03.367. Ramzi, A., Habeeb Rahman, K., Gireeshkumar, T.R., Balachandran, K.K., Jacob, C.,Chandramohanakumar, N., 2017. Dynamics of polycyc l ic aromatic hydrocarbons (PAHs) in surface sediments of Cochin estuary, India. Mar. Pollut . Bull. 114,1081-1087. h t tp s://d o i .o r g /10.1016/j.ma rpo lbu l .2016.10.015. Reidy, L., Bu, K., Godfrey, M., Cizdziel, J.V.,2013. Elemental fingerprinting of soils using ICP -MS and multivariate statistics: a study for and by forensic chemistry majors.Forensic Sci. Int. 233, 37-44. h t t ps ://do i .o r g /10.1016/j .f ors ci i n t.2013.08.019. Reimann, C., De Caritat, P., 2005. Distinguishing between natural and anthropogenic sources for elements in the environment : regional geochemical surveys versus enrichment factors. Sci. Tota l Environ. 337, 91-107. h t tps ://doi.or g /10.1016/j .sc i to t env.2004.06.011. Rocha, A.C., Palma, C., 2019. Source identification of polycyc l ic aromatic hydrocarbons i n soil sediments: application of different methods . Sci. Total Environ. 652,1077-1089. h t t ps://d oi .or g/10.1016/j .sc i to t env.2018.10.014. Sangwan, P., Nain, T., Singal, K., Hooda, N., Sharma , N., 2020. Soil as a tool of revelation in forensic science: a review. Anal . Methods 12, 5150-5159. h t t ps://doi.or g /10.1039/d0a y01634a . Sanz-Prada, L., Garcia -Ordiales , E., Roqueni, N., Grande Gi l , J.A., Loredo, J., 2020.Geochemica l distribution of selected heavy metals i n the Asturian coastline sediments (North of Spain). Mar. Pollut. Bull. 156, 111263 h t tp s://d oi .o r g/10.1016/j.m arp o l bu l.2020.111263. Sierra, C., Boado, C., Saavedra, A., Ordonez, C., Gallego, J.R., 2014. Origin, patterns and anthropogenic accumulation of potent i ally toxic elements (PTEs) in surface sediments of the Aviles estuary (Asturias, northern Spain). Mar. Pollut . Bul l . 86,530-538. h t t p s ://doi .org /10.1016/j.m a rpol b u l.2014.06.052. Thavamani, P., Megharaj, M., Krishnamurti , G.S.R., McFarland, R., Naidu, R., 2011.F i nger printing of mixed contaminants f rom former manufactured gas plant (MGP)site soils: implications to bioremediation. Environ. Int. 37,184-189.h t tp s://d oi .o r g/10.1016/j .envi nt .2010.08.017. Theocharopoulos, S.P., Wagner, G., Sprengart, J., Mohr, M.E., Desaules, A., Muntau, H.,Christou, M., Quevauviller, P., 2001. European soil sampling guidelines for soil pol l ution studies. Sci . Tota l Environ. 264,51-62. h t tps ://d o i.org/10.1016/S0048-9697(00)00611-2. Thiombane, M., Albanese, S., Di Bonito, M., Lima, A., Zuzolo, D., Rolandi, R., Qi, S., De Vivo, B., 2019. Source patterns and contamination level of polycyc l ic aromatic hydrocarbons (PAHs) in urban and rural areas of Southern Italian soils. Environ. Geochem. Health 41, 507-528. ht tp s://doi .org /10.1007/s10653-018-0147-3. Vanek, A., Chrastny, V., Komarek, M., Penizek, V., Teper, L., Cabala, J., Drabek, O.,2013. Geochemical position of thallium in soils from a smelter-impacted area.J. Geochem. Explor. 124, 176-182. htt ps ://doi.or g /10.1016/j .g e x plo.2012.09.002. Wu, W., Wu , P., Yang, F., Ling Sun, D., Zhang, D.X., Zhou, Y.K., 2018. Assessment of heavy metal pollution and human health risks in urban soils around an electronics manufacturing facility. Sci. Total Environ. ht tps://d o i .or g /10.1016/j.scito t env .2018.02.183. Yunker, M.B., Macdonald, R.W., Vingarzan, R., Mitchel l, R.H., Goyette, D., Sylvestre, S.,2002. PAHs in the Fraser River basin: a critical appraisal of PAH ratios as indicators of PAH source and composition. Org. Geochem. 33, 489-515. h t tps ://d o i .o r g/10.1016/S0146-6380(02)00002-5. Zhang, C., Gang Yu, Z ., Ming Zeng, G., Jiang, M., Zhu Yang, Z., Cui, F., Ying Zhu, M.,Qing Shen, L., Hu, L., 2014. Effects of sediment geochemica l properties on heavy metal bioavailabi li ty. Environ. Int . 73, 270-281. h t tps://d o i .or g /10.1016/j .envin t .2014.08.010. Zhang, W., Zhang, S., Wan, C., Yue, D., Ye, Y., Wang, X., 2008. Source diagnostics of polycyclic aromatic hydrocarbons in urban road runoff, dust, rain and canopy throughfal l. Environ. Pol l ut. 153, 594-601. ht tps ://d o i.o rg /10.1016/j .env p o l.2007.09.004. Zhang, Y., Lin, Y., Cai, J., Liu, Y., Hong, L., Qin, M., Zhao, Y., Ma, J., Wang, X., Zhu, T .,Qiu, X., Zheng, M., 2016. Atmospheric PAHs in North China: spatial distribution and sources. Sci. Total Env i ron. h t tp s://d oi .o r g/10.1016/j .sci t o t en v .2016.05.104. Zhu, Y., Yang, L., Yuan, Q., Yan, C., Dong, C., Meng, C., Sui , X., Yao, L., Yang, F., Lu, Y.,Wang, W., 2014. Airborne part i culate polycyclic aromat i c hydrocarbon (PAH)pol l u tion i n a background site in the North China Plain: concentration, size distribution, toxicity and sources . Sci. Tota l Environ. htt ps://d o i .o r g/10.1016/j .sc i to t env.2013.07.030. Zhu, Z., Li, Z., Wang, S., Bi , X., 2020. Magnetic mineral constraint on lead isotope variations of coa l fly ash and i t s i mplications for source discr i mination. Sci. Total Environ. 713, 136320 ht tps://d o i .or g/10.1016/j .s c i to ten v .2019.136320.
确定
还剩8页未读,是否继续阅读?

产品配置单


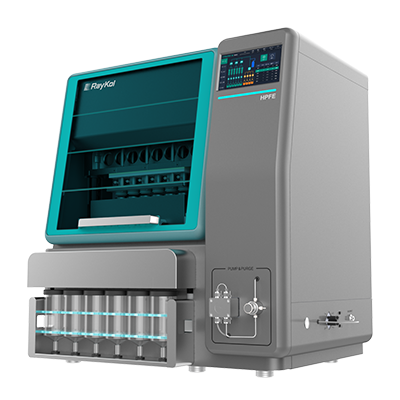
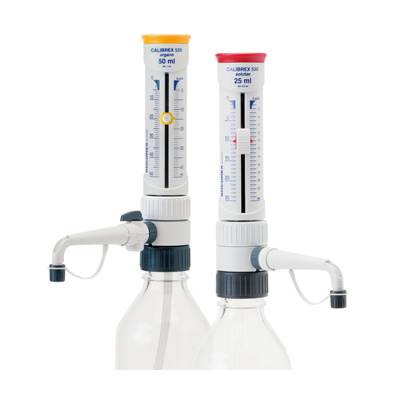
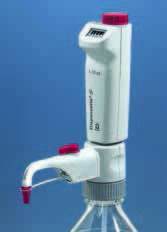
中国格哈特为您提供《熔渣和飞灰中多环芳烃(PAHs)含量的检测》,该方案主要用于固体废物中有机污染物检测,参考标准《HJ 950-2018 固体废物 多环芳烃的测定 气相色谱-质谱法》,《熔渣和飞灰中多环芳烃(PAHs)含量的检测》用到的仪器有格哈特全自动快速溶剂萃取仪Sox416、德国加液器MM、滤纸筒
推荐专场
快速溶剂萃取设备/快速溶剂萃取仪
更多
相关方案
更多
该厂商其他方案
更多