


方案详情
文
我们分析了来自多个产地的石榴石样品,发现不同产地的石榴石具有明显差异。为什么来自巴基斯坦的样品在近红外中的吸收比其他样品低?为什么来自巴西的样品是深红色,而另外两颗看起来更像琥珀色?是什么导致了三者的拉曼光谱有些许不同?为此,我们测量了石榴石的拉曼光谱,并利用LIBS分析不同石榴石之间的原子结构差异。
方案详情

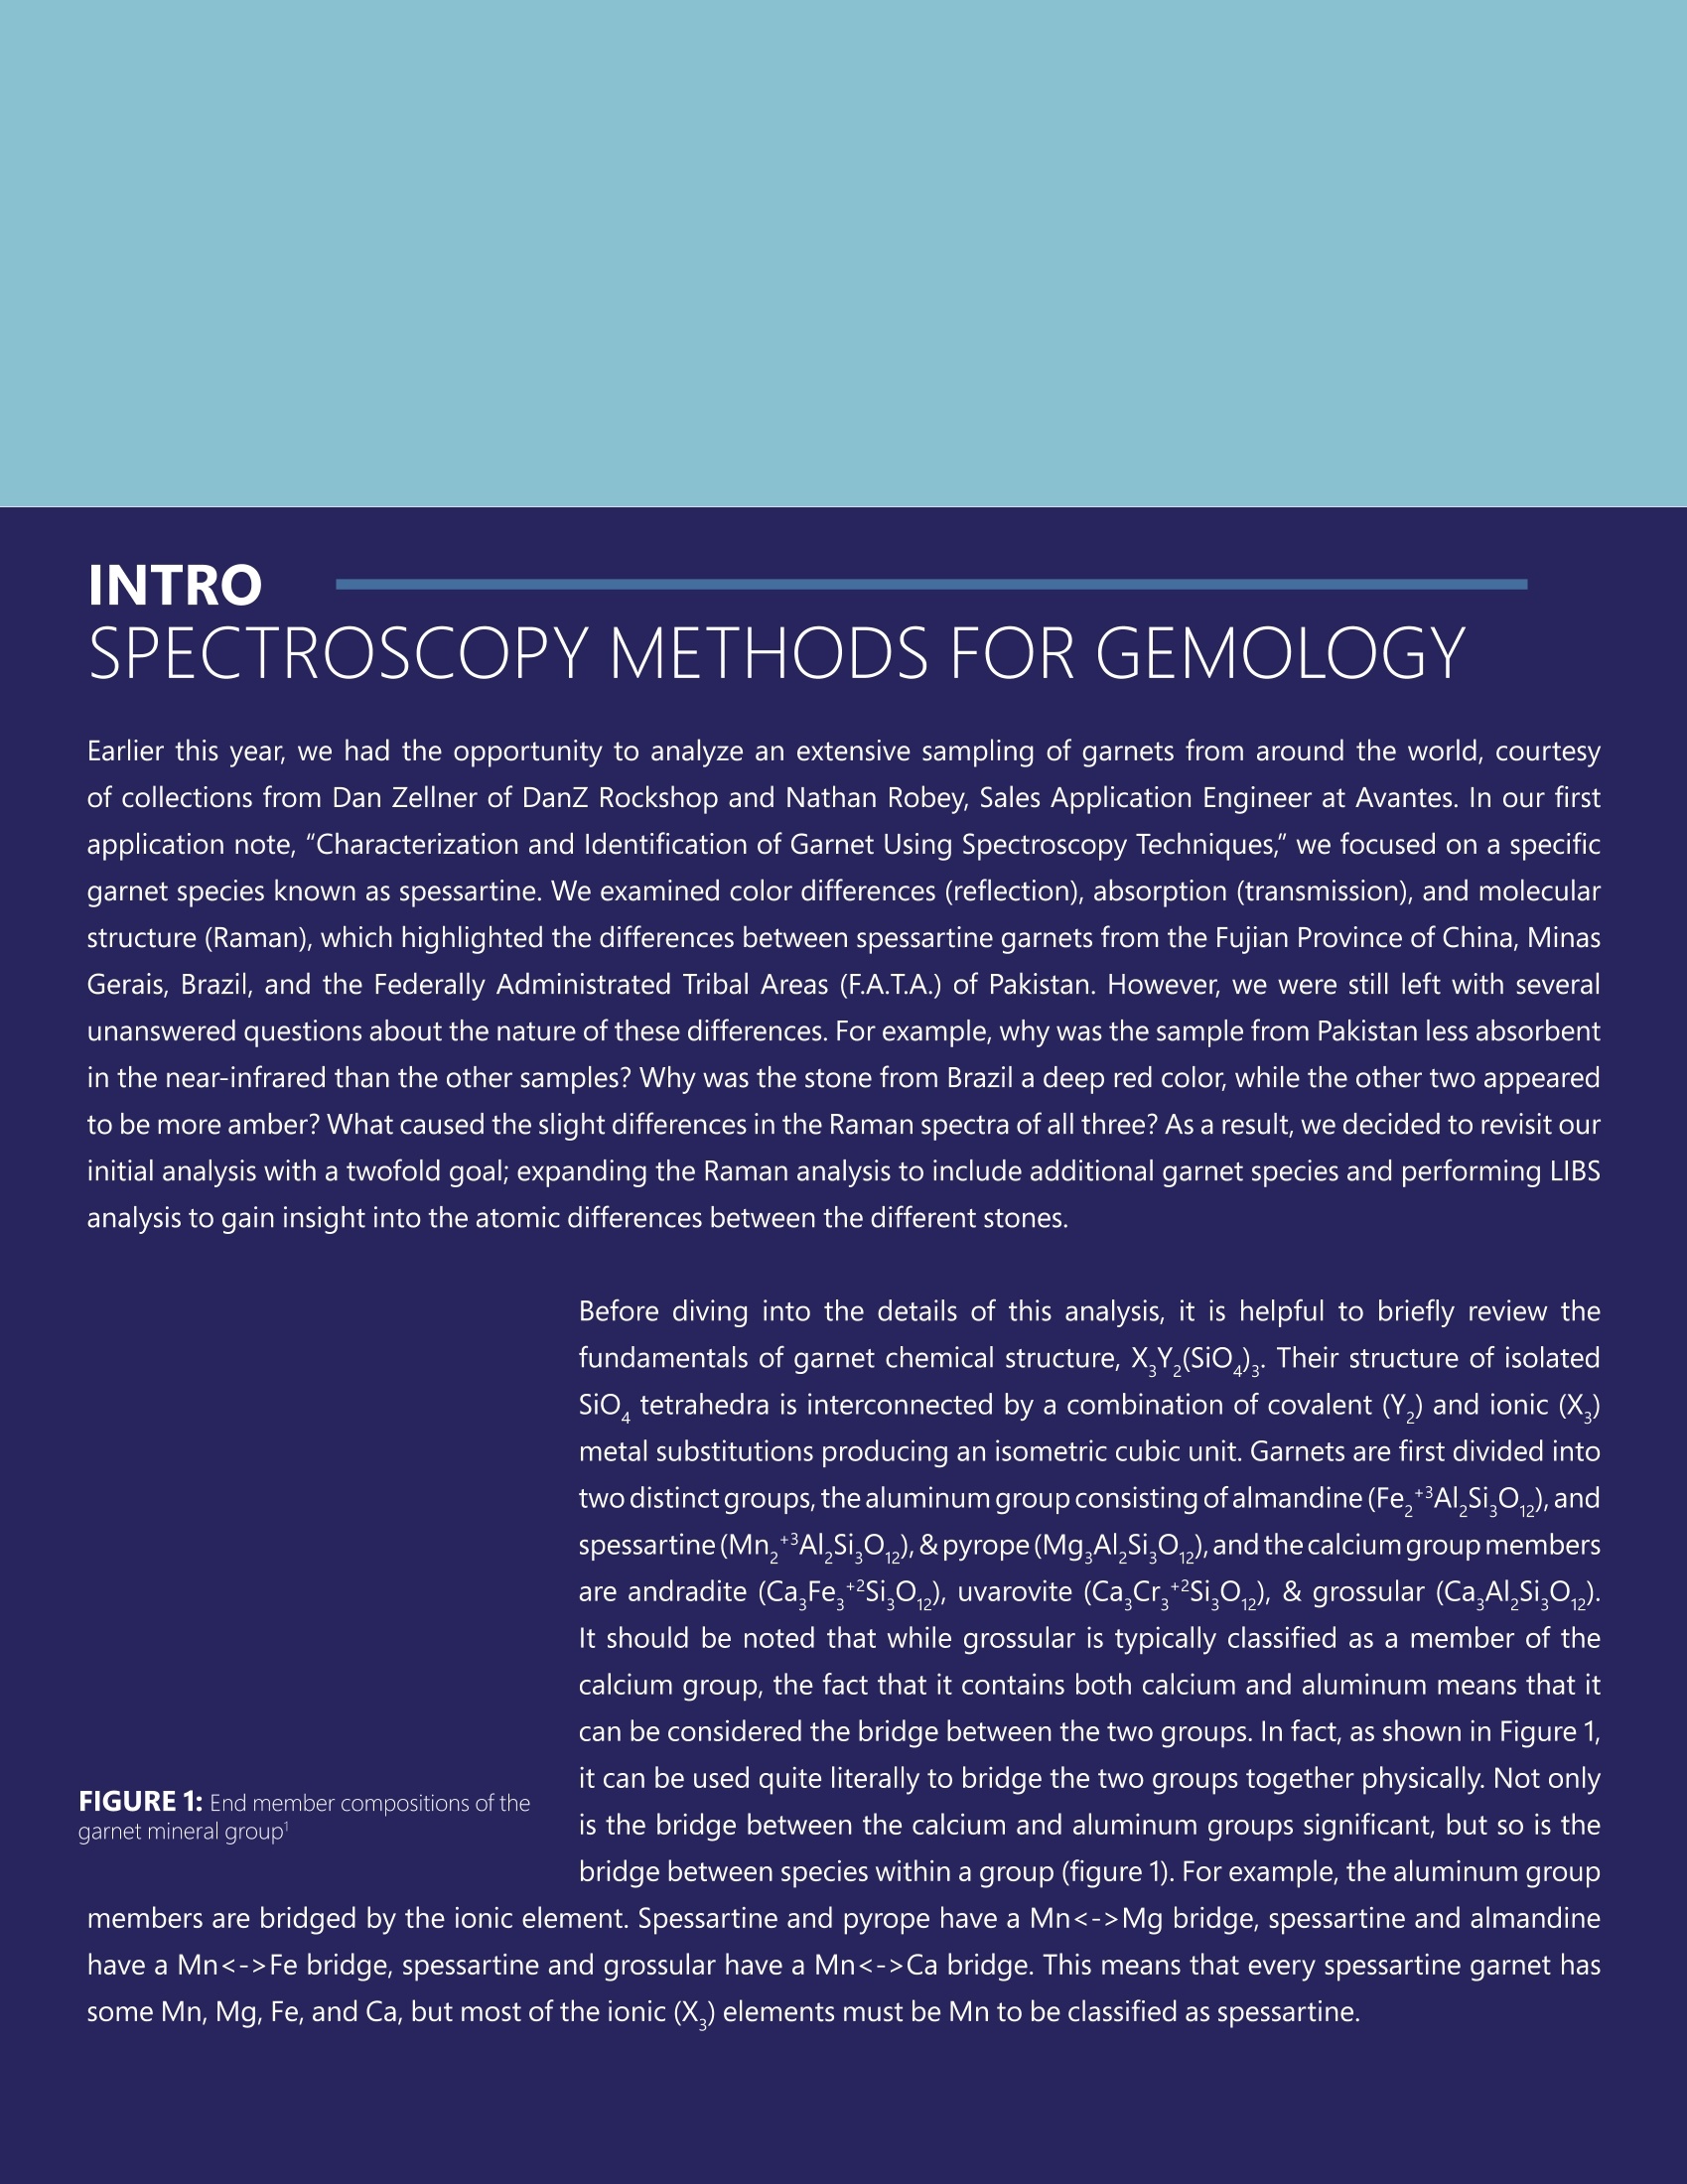
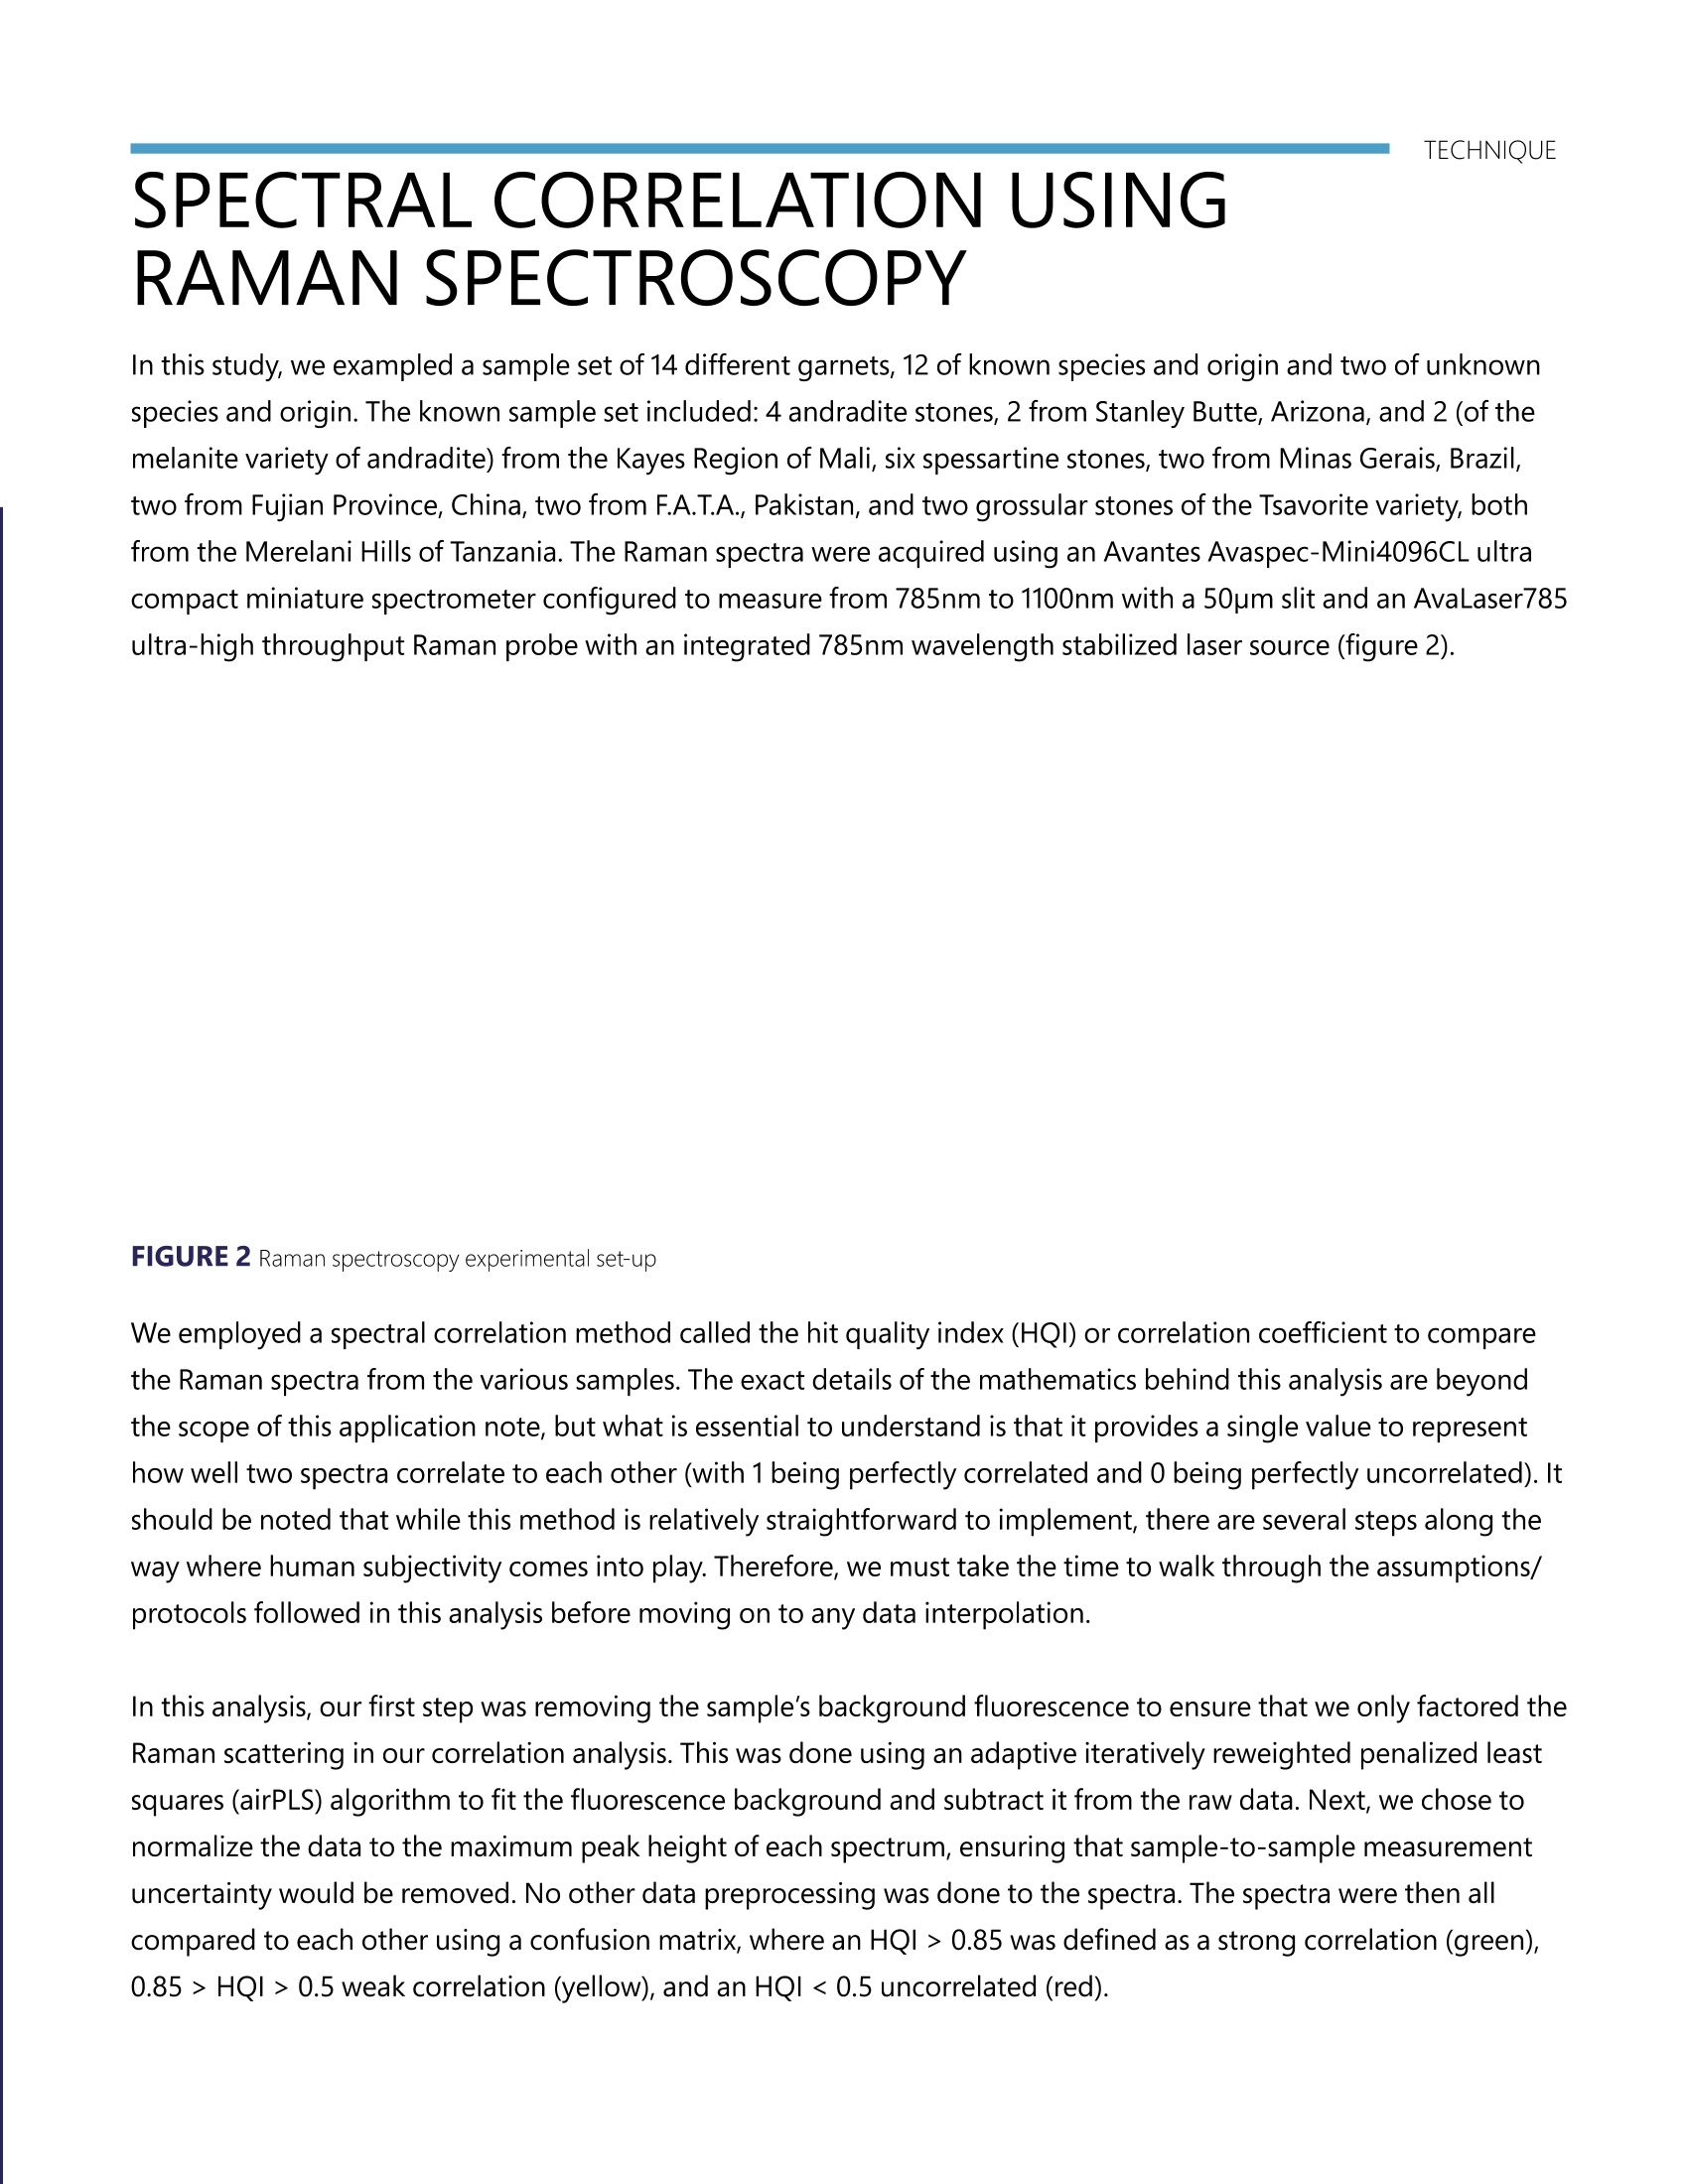
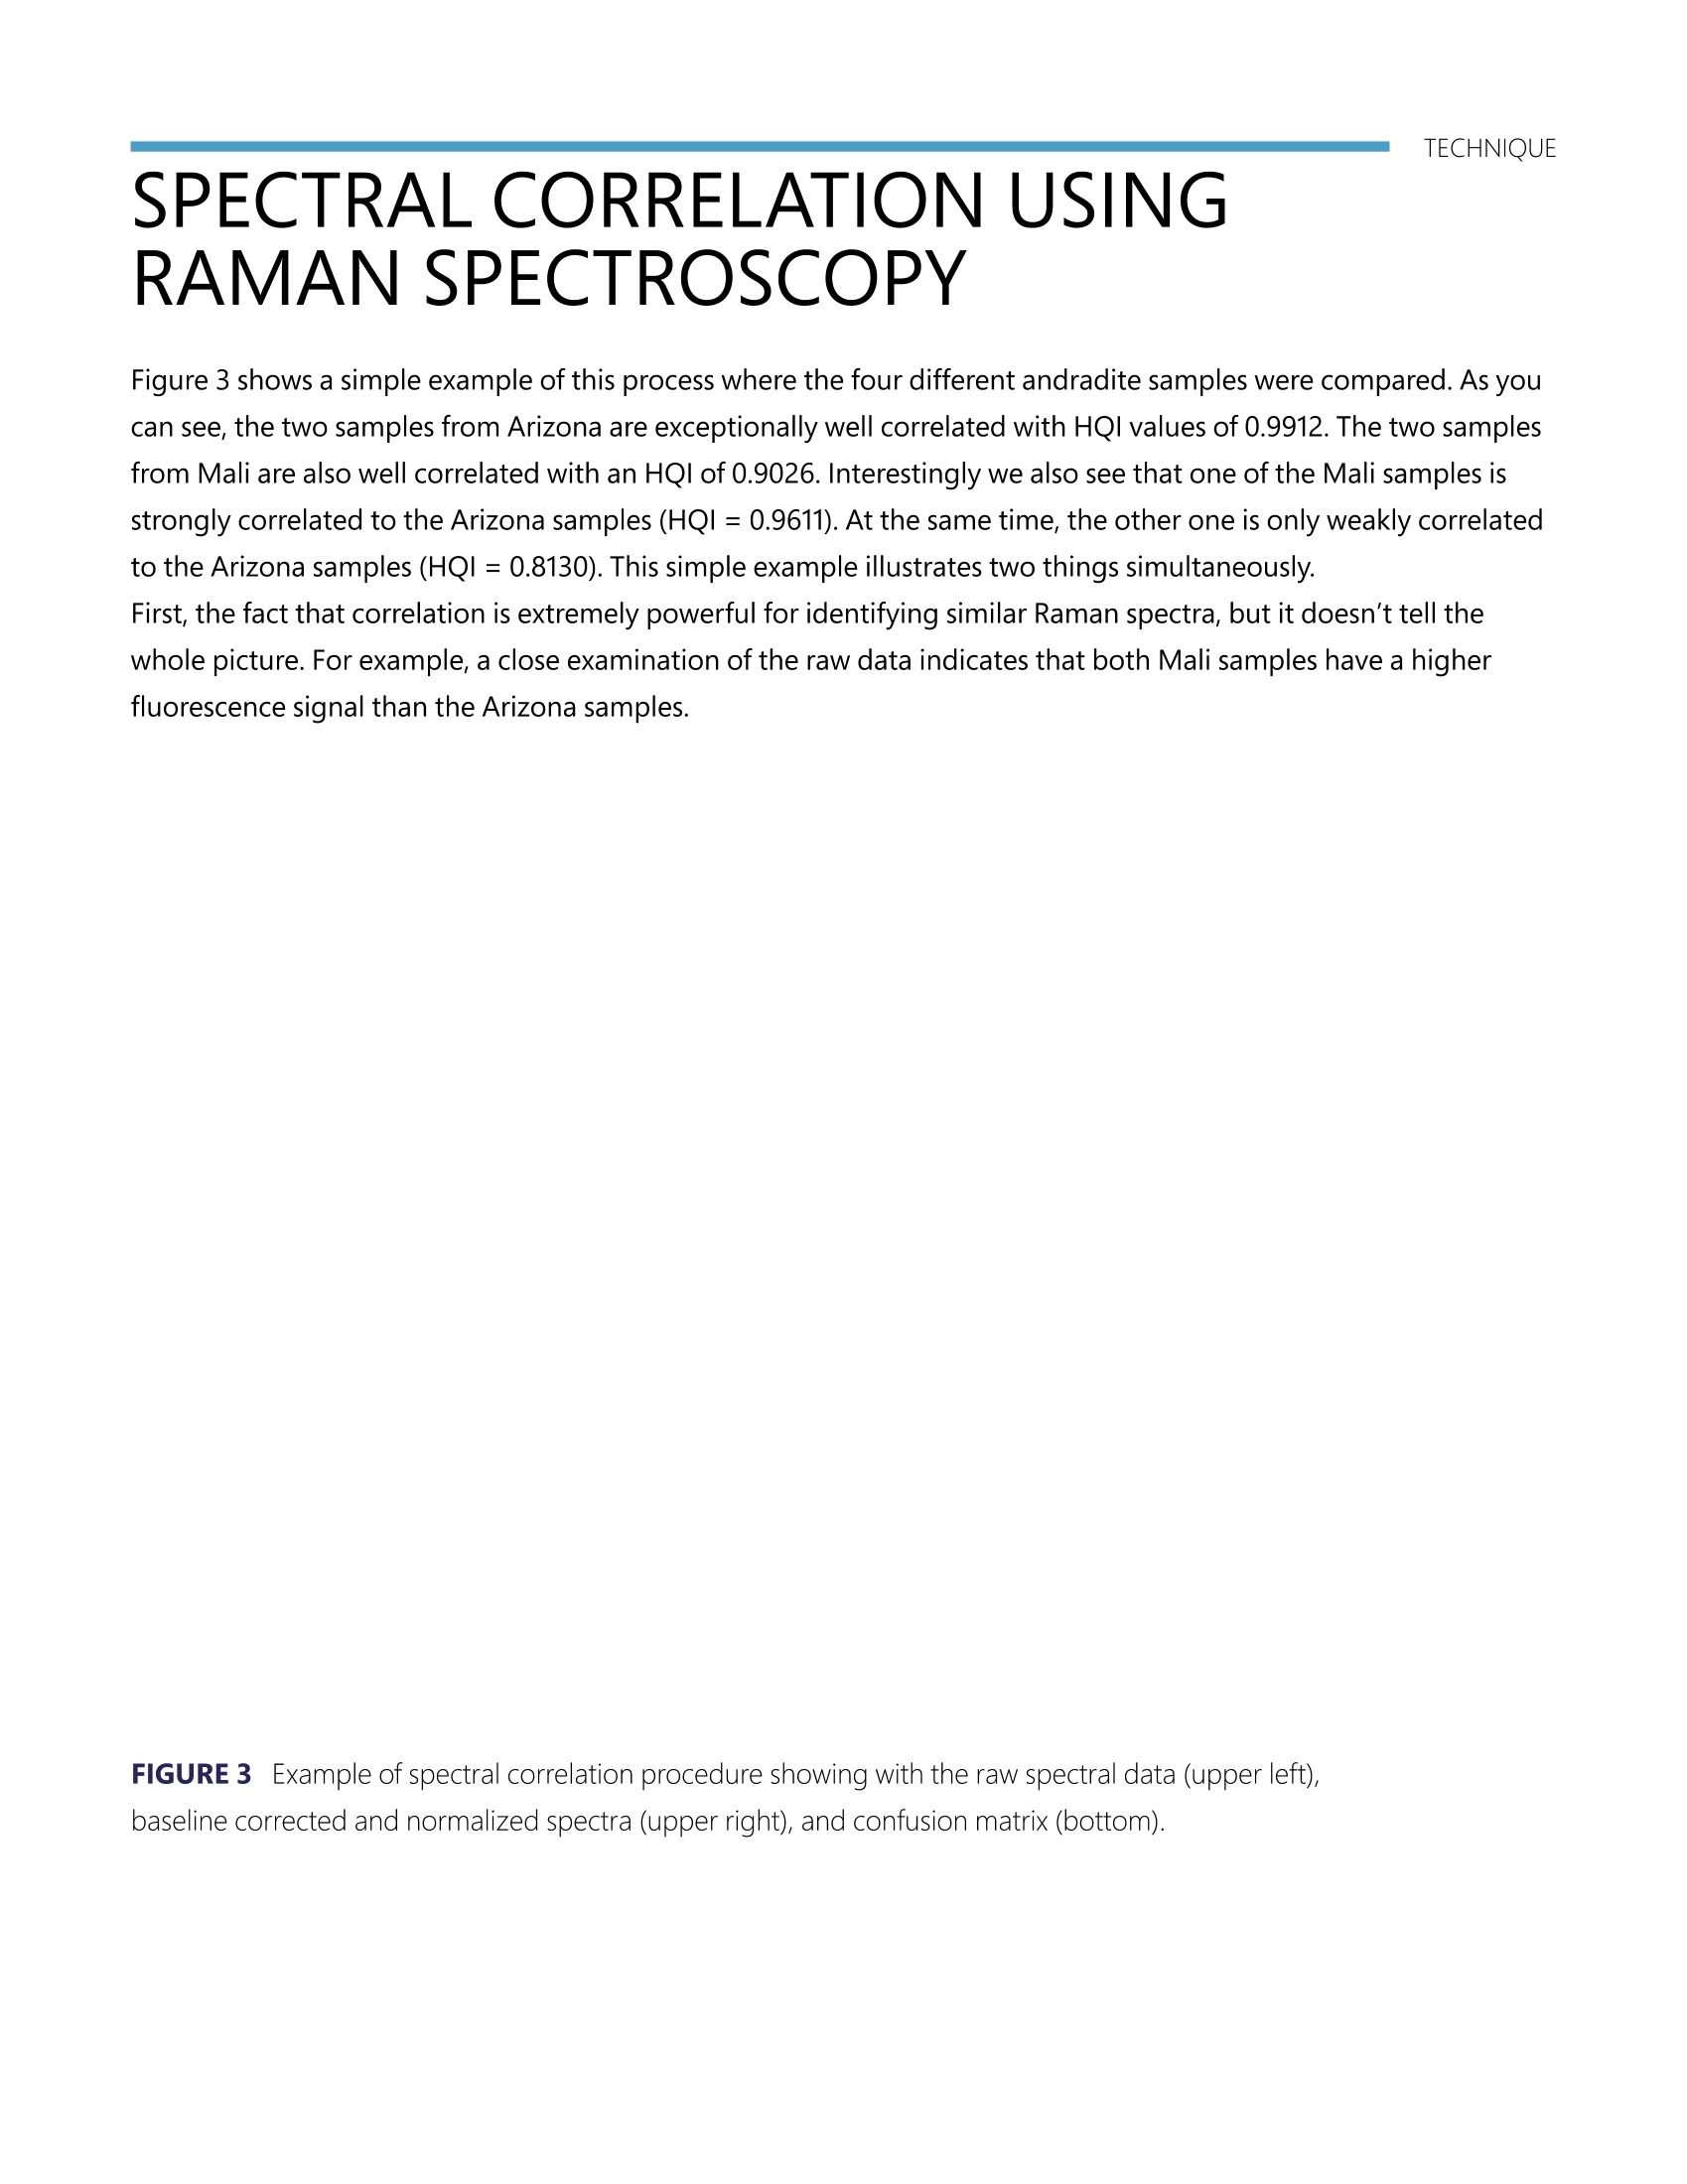
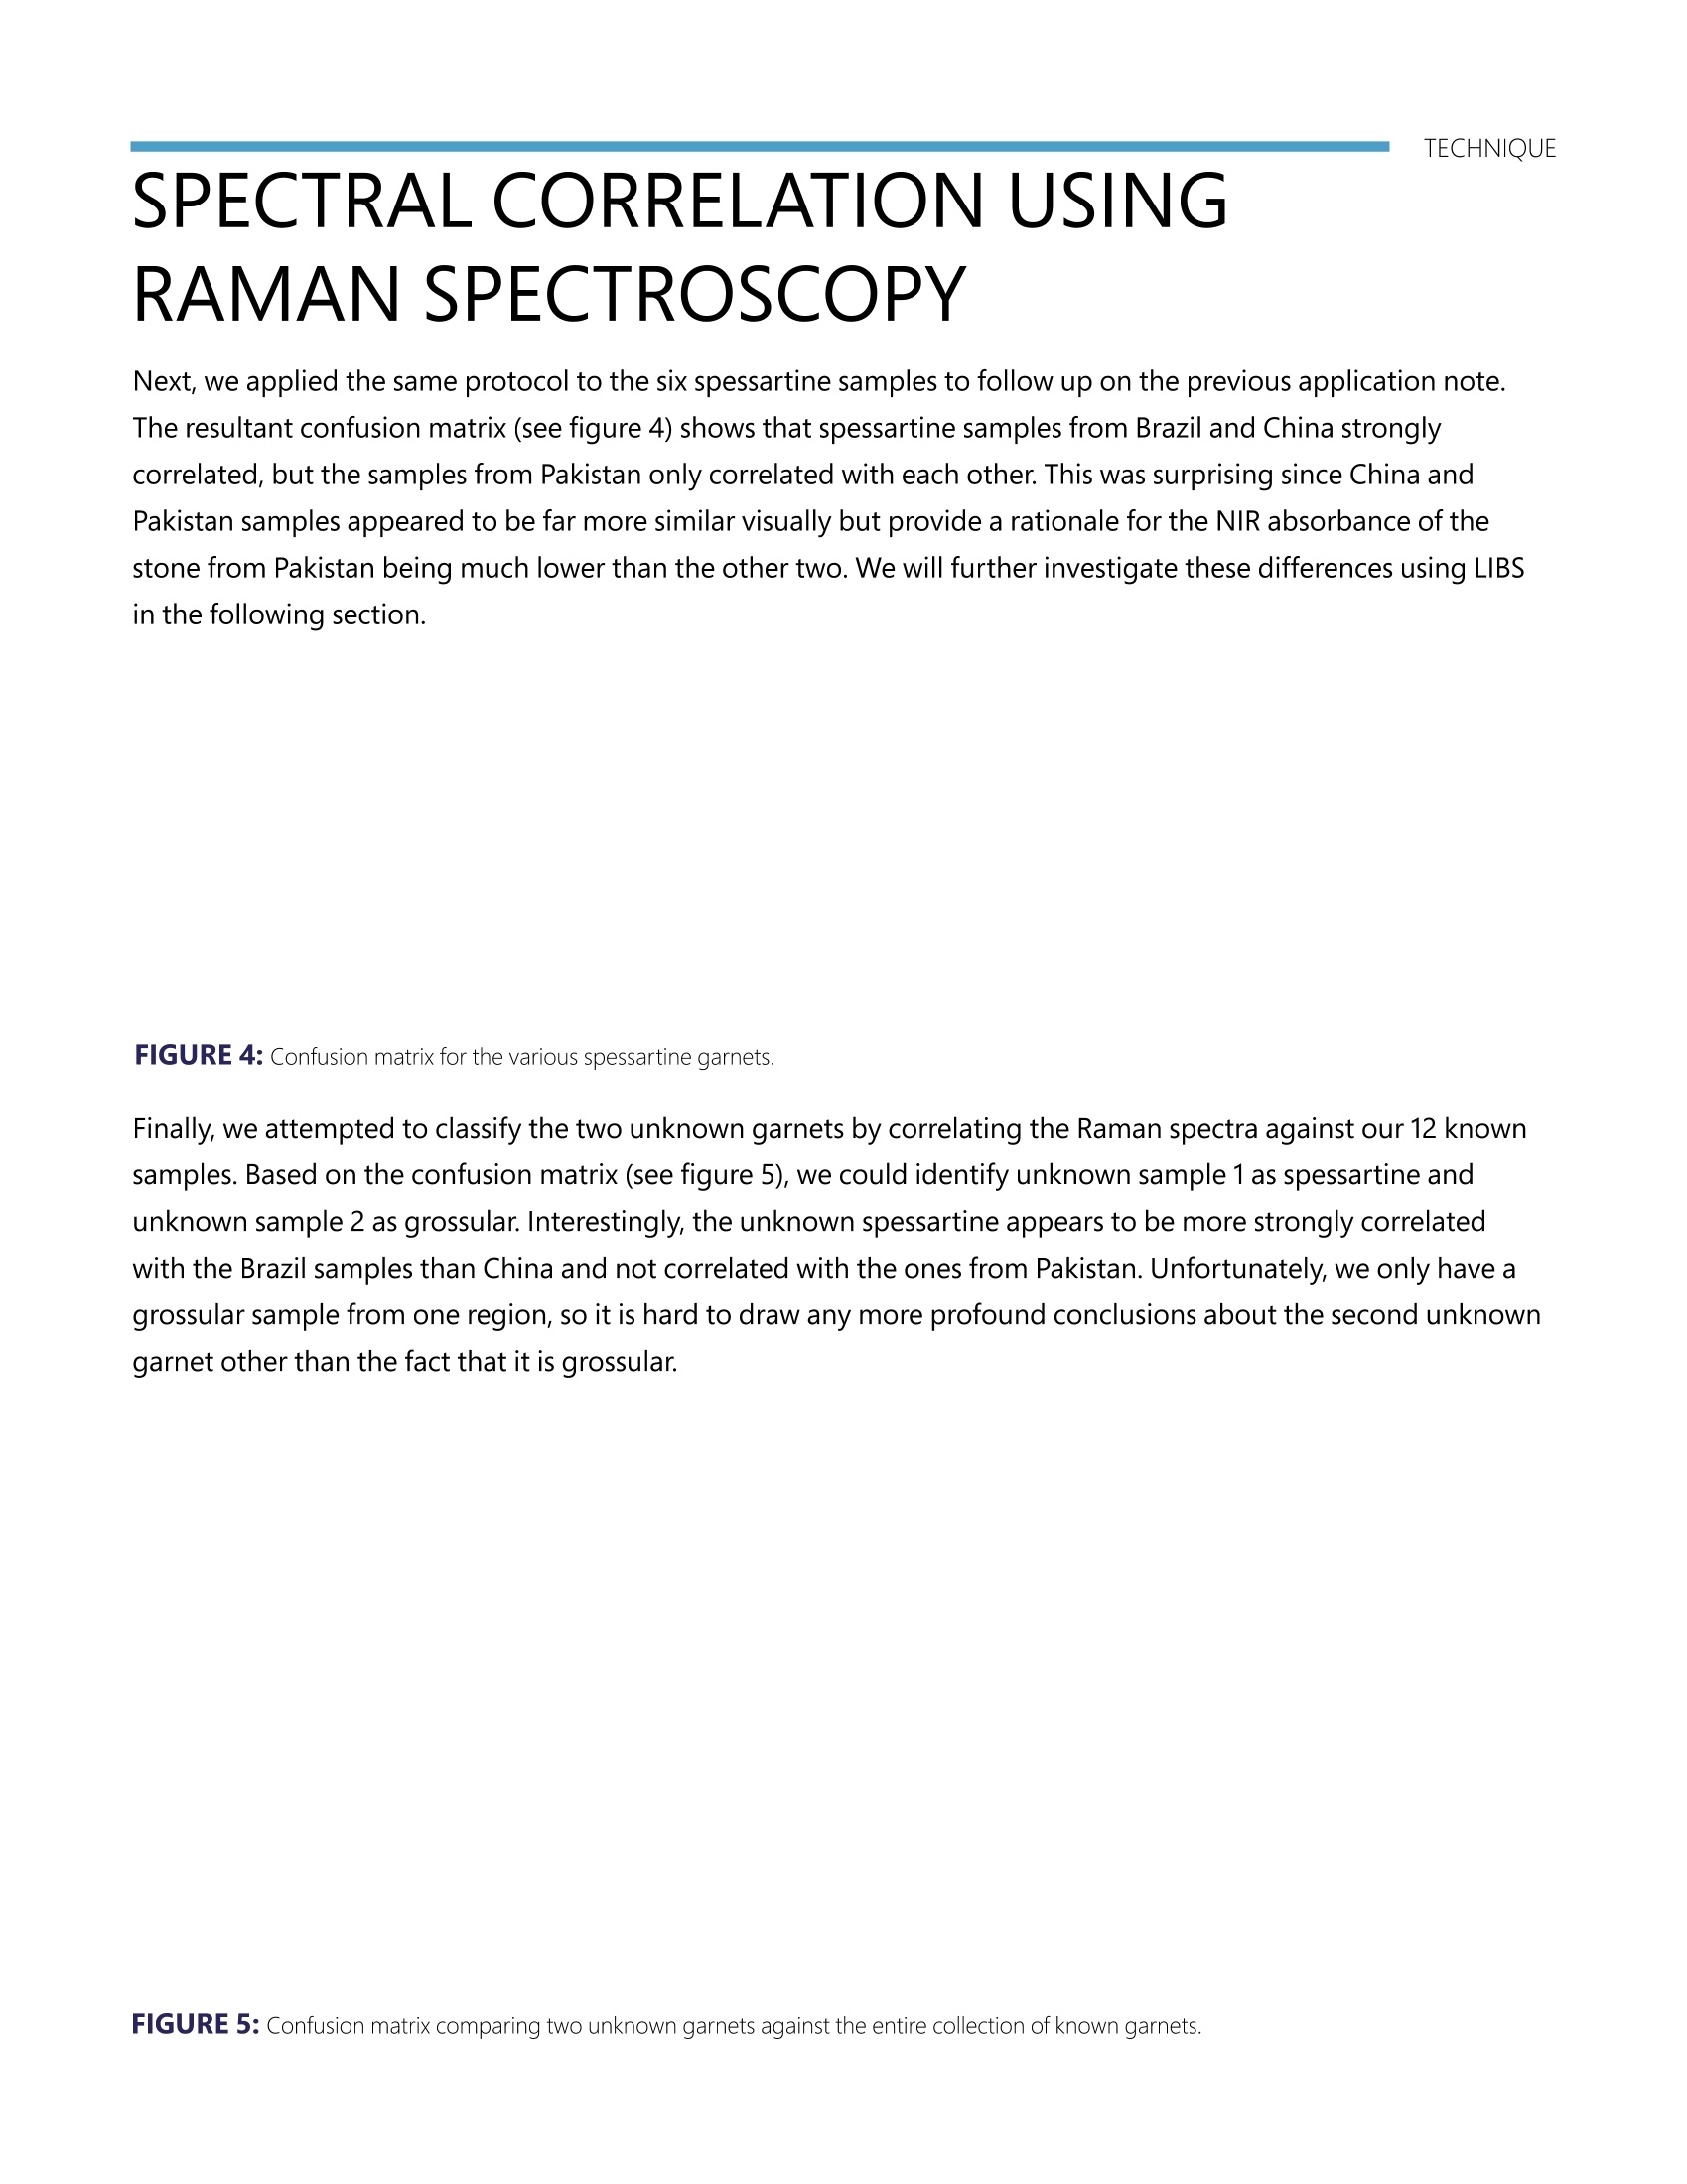
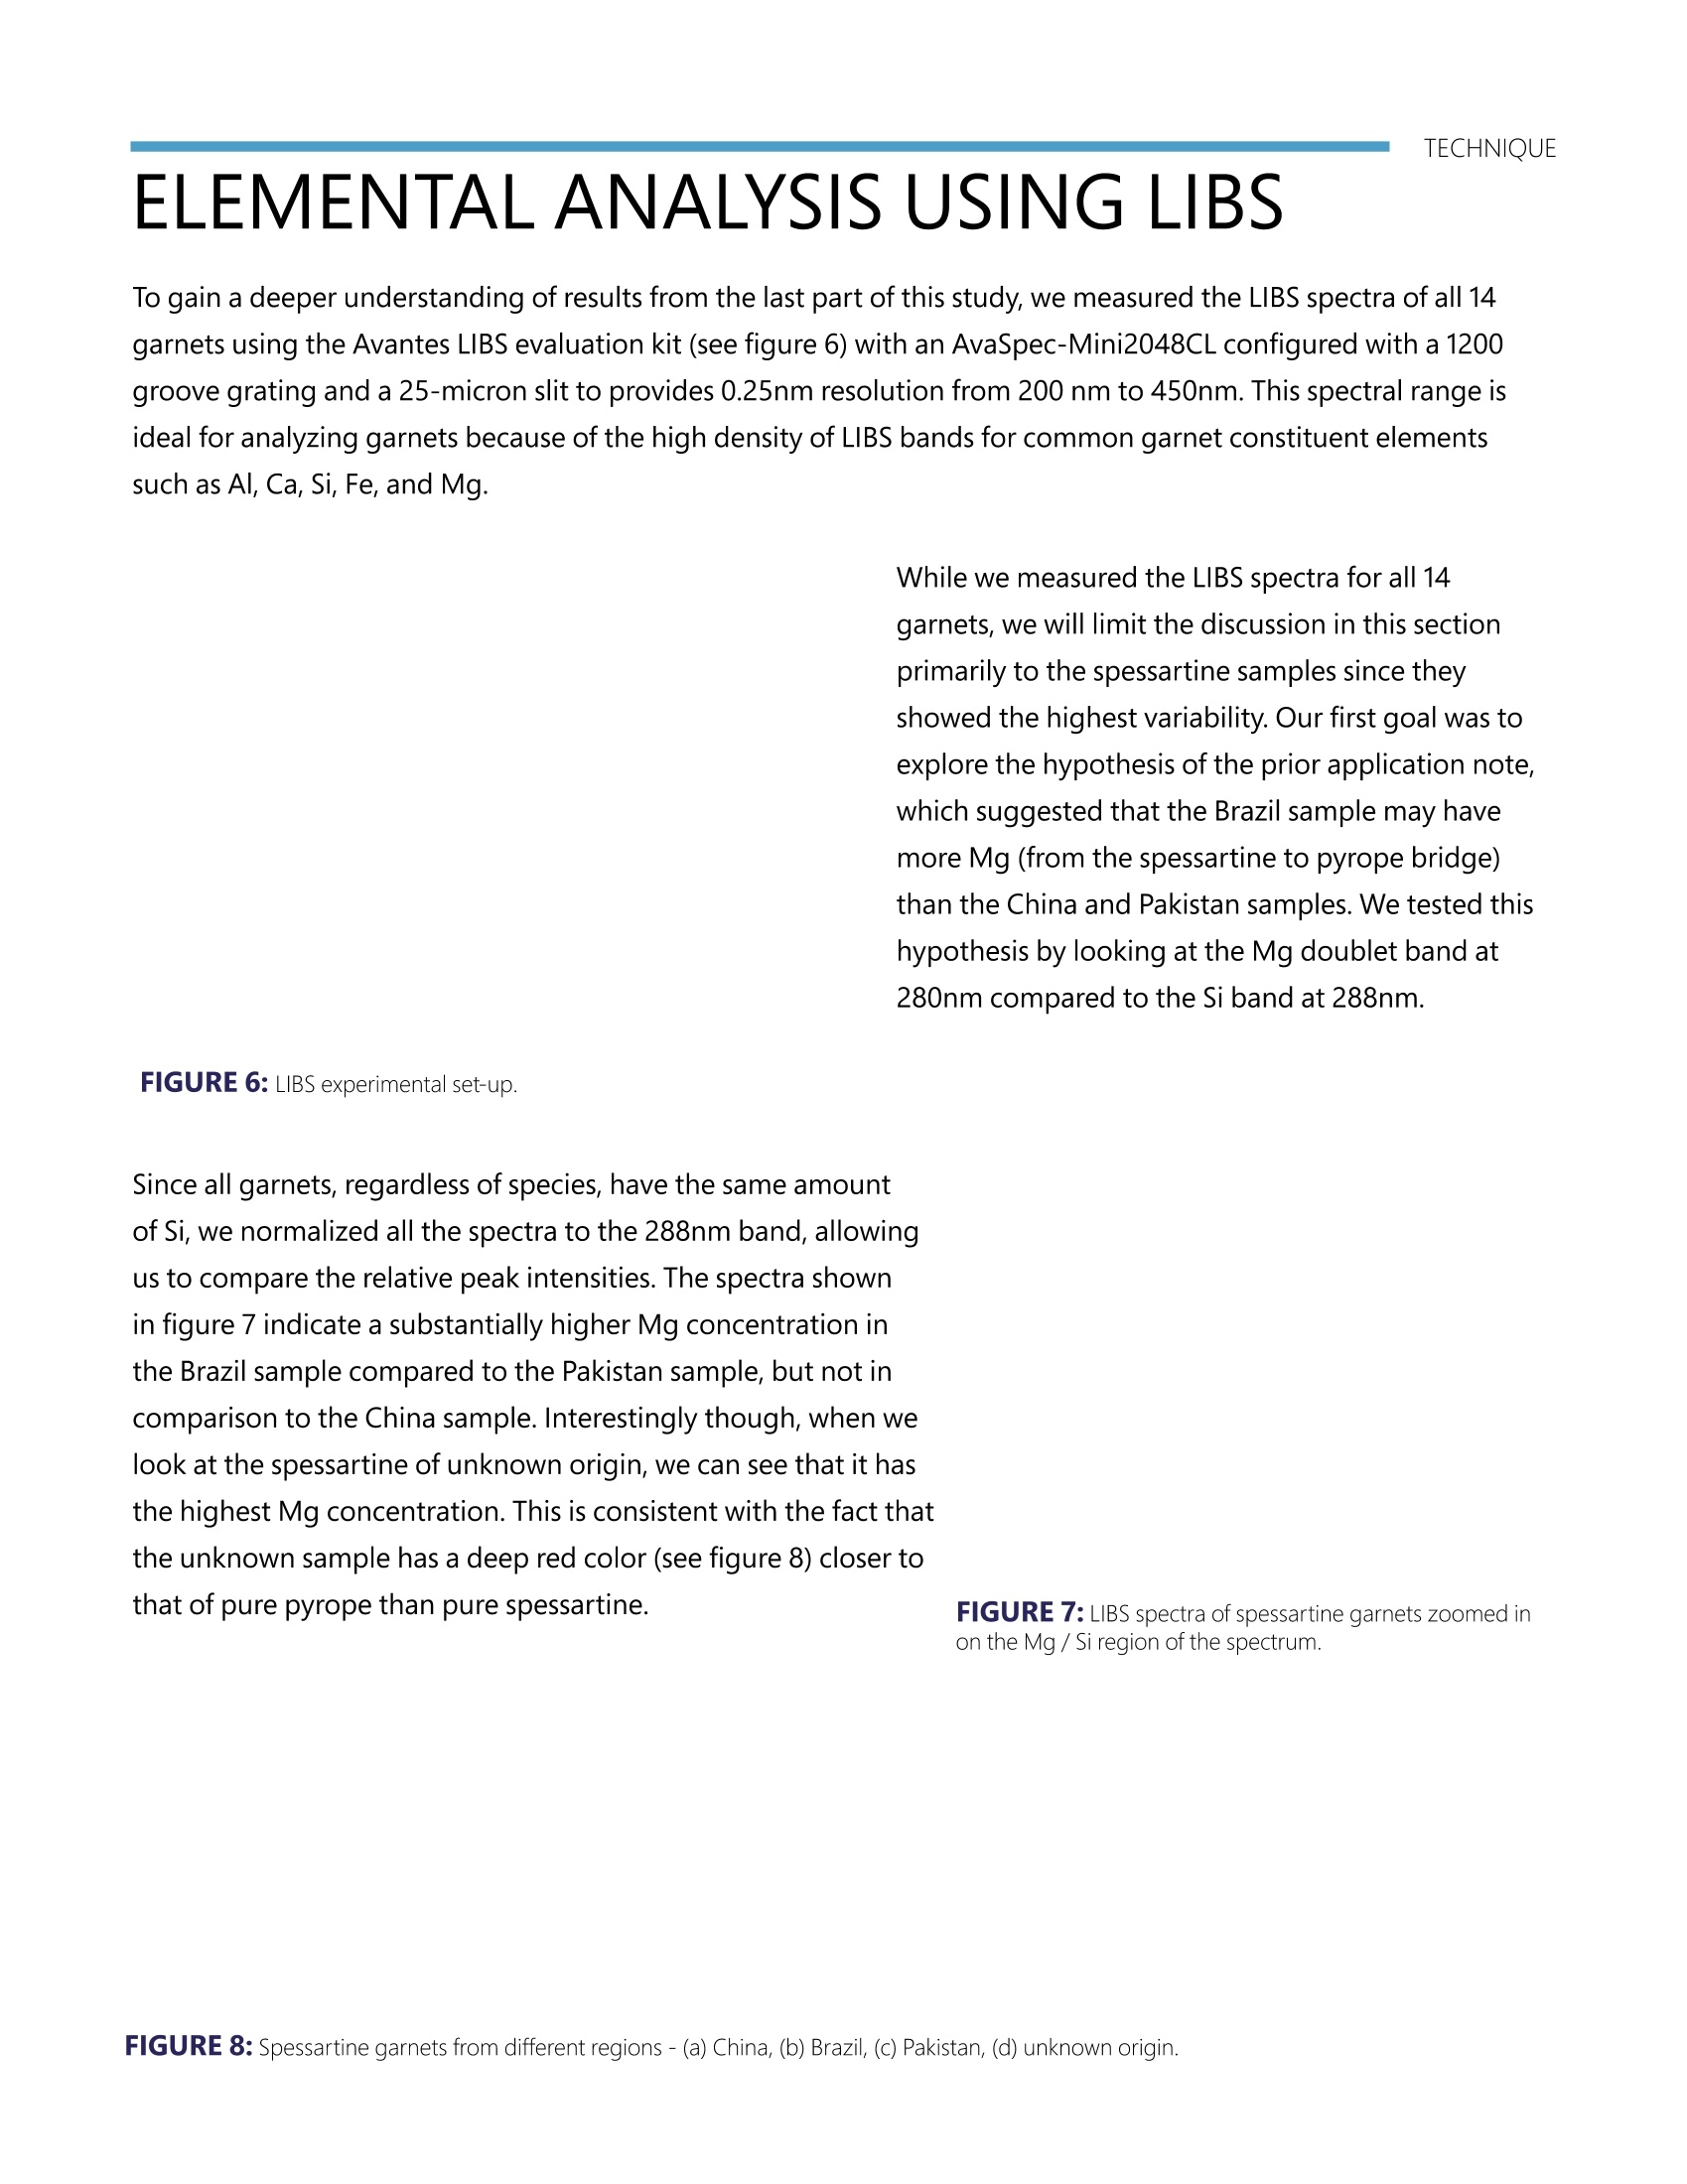
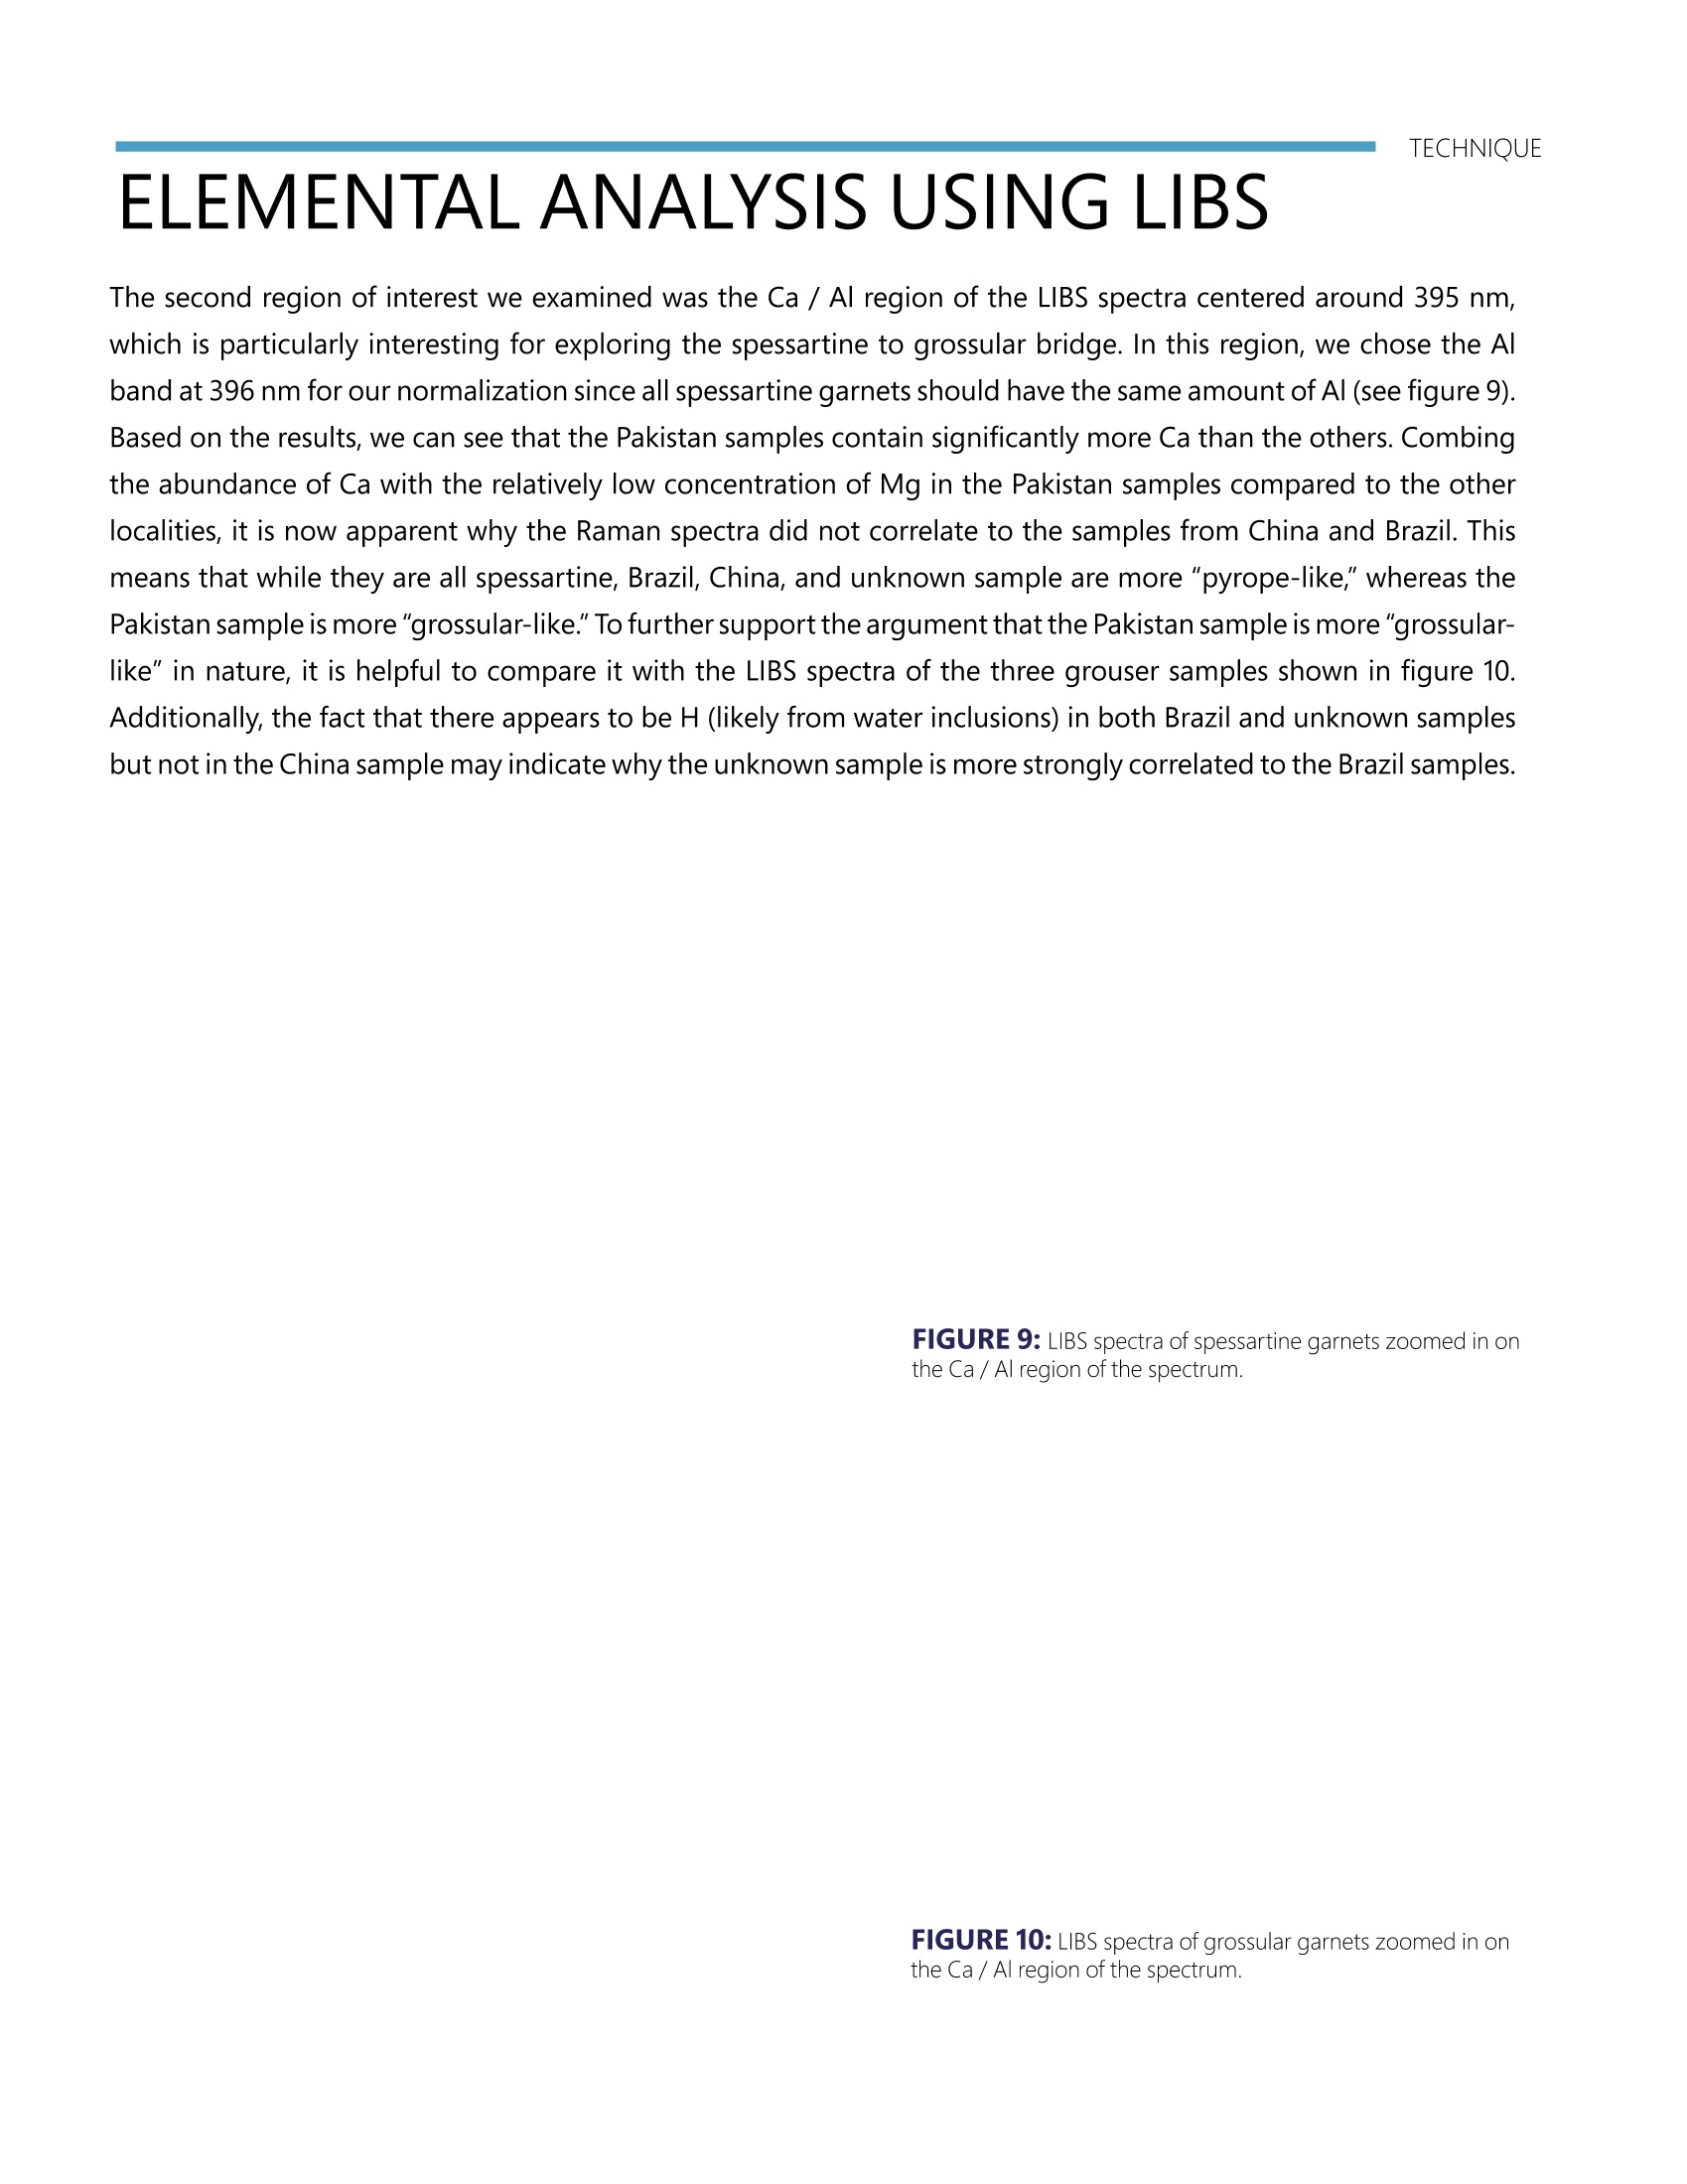
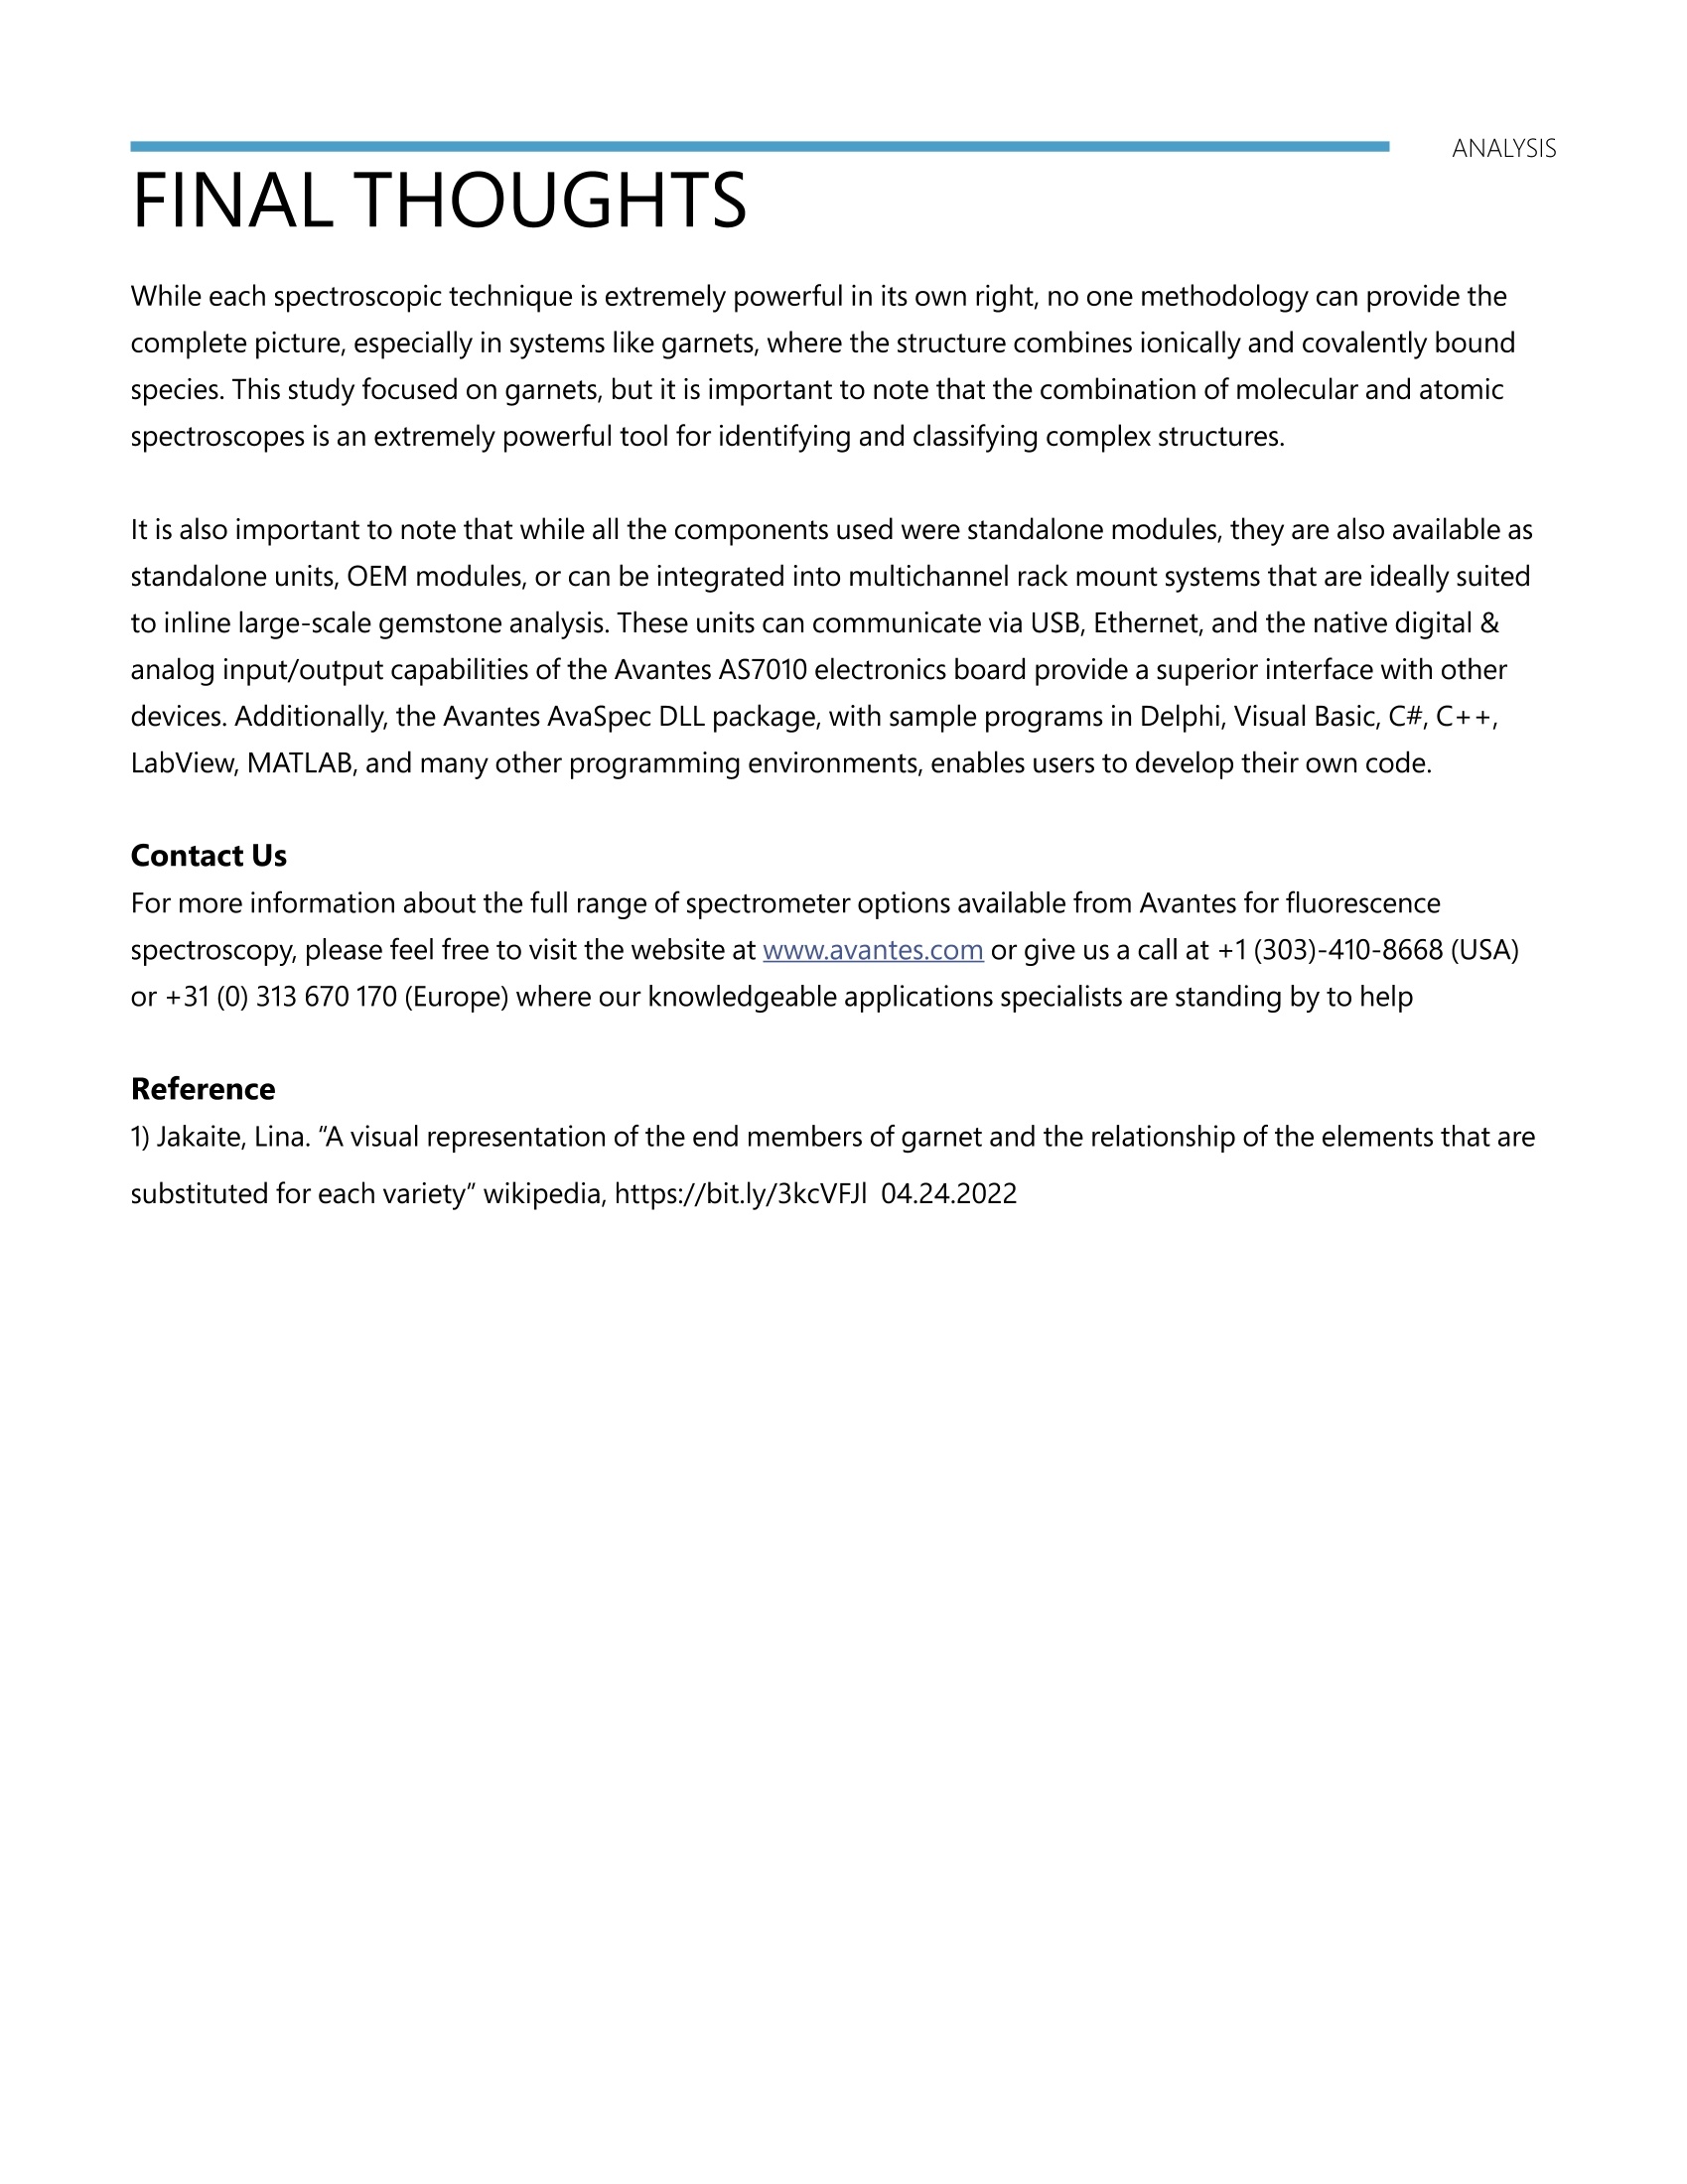
我们分析了来自多个产地的石榴石样品,发现不同产地的石榴石具有明显差异。为什么来自巴基斯坦的样品在近红外中的吸收比其他样品低?为什么来自巴西的样品是深红色,而另外两颗看起来更像琥珀色?是什么导致了三者的拉曼光谱有些许不同?为此,我们测量了石榴石的拉曼光谱,并利用LIBS分析不同石榴石之间的原子结构差异。AVANTESMEMBER OF THE NYNOMIC GROUP TECHNIQUE 一 APPLICATION NOTE RAMAN AND LIBS ANALYSISOF GARNET SPECIES INTRO SPECTROSCOPY METHODS FOR GEMOLOGY Earlier this year we had the opportunity to analyze an extensive sampling of garnets from around the world, courtesyof collections from Dan Zellner of DanZ Rockshop and Nathan Robey, Sales Application Engineer at Avantes. In our firstapplication note, "Characterization and Identification of Garnet Using Spectroscopy Techniques," we focused on a specificgarnet species known as spessartine. We examined color differences (reflection), absorption (transmission), and molecularstructure (Raman), which highlighted the differences between spessartine garnets from the Fujian Province of China, MinasGerais, Brazil, and the Federally Administrated Tribal Areas (F.A.T.A.) of Pakistan. However, we were still left with severalunanswered questions about the nature of these differences. For example, why was the sample from Pakistan less absorbentin the near-infrared than the other samples? Why was the stone from Brazil a deep red color, while the other two appearedto be more amber? What caused the slight differences in the Raman spectra of all three? As a result, we decided to revisit ourinitial analysis with a twofold goal; expanding the Raman analysis to include additional garnet species and performing LIBSanalysis to gain insight into the atomic differences between the different stones. FIGURE 1: End member compositions of thegarnet mineral groupl Uvarovite Before diving into the details of this analysis, it is helpful to briefly review theCayCrfundamentals of garnet chemical structure, XY (SiO). Their structure of isolatedPgyArIoSipO:e2 SiO tetrahedra is interconnected by a combination of covalent (Y,) and ionic (X,)Grossular metal substitutions producing an isometric cubic unit. Garnets are first divided intotwo distinct groups, the aluminum group consisting of almandine (Fe,+3Al SiO),andspessartine(Mn,*3Al Si),&pyrope(Mg,Al Sio)and thecalcium group membersAndradite are andradite (Ca,Fe,tSiO), uvarovite (Ca,Cr*si,o), & grossular (Ca,Al Si,O2)·CaFeySOIt should be noted that while grossular is typically classified as a member of theAlmandine、Fe:ALSI-O12 calcium group, the fact that it contains both calcium and aluminum means that itSpessar0t1i2n e can be considered the bridge between the two groups. In fact, as shown in Figure 1,it can be used quite literally to bridge the two groups together physically. Not onlyis the bridge between the calcium and aluminum groups significant, but so is thebridge between species within a group (figure 1). For example, the aluminum group members are bridged by the ionic element. Spessartine and pyrope have a Mn<->Mg bridge, spessartine and almandinehave a Mn<->Fe bridge, spessartine and grossular have a Mn<->Ca bridge. This means that every spessartine garnet has some Mn, Mg, Fe, and Ca, but most of the ionic (X ) elements must be Mn to be classified as spessartine. SPECTRAL CORRELATION USINGRAMAN SPECTROSCOPY In this study, we exampled a sample set of 14 different garnets, 12 of known species and origin and two of unknownspecies and origin. The known sample set included: 4 andradite stones, 2 from Stanley Butte, Arizona, and 2 (of themelanite variety of andradite) from the Kayes Region of Mali, six spessartine stones, two from Minas Gerais, Brazil,two from Fujian Province, China, two from F.A.T.A., Pakistan, and two grossular stones of the Tsavorite variety, bothfrom the Merelani Hills of Tanzania. The Raman spectra were acquired using an Avantes Avaspec-Mini4096CL ultracompact miniature spectrometer configured to measure from 785nm to 1100nm with a 50um slit and an AvaLaser785ultra-high throughput Raman probe with an integrated 785nm wavelength stabilized laser source (figure 2). FIGURE 2 Raman spectroscopy experimental set-up We employed a spectral correlation method called the hit quality index (HQI) or correlation coefficient to comparethe Raman spectra from the various samples. The exact details of the mathematics behind this analysis are beyondthe scope of this application note, but what is essential to understand is that it provides a single value to representhow well two spectra correlate to each other (with 1 being perfectly correlated and 0 being perfectly uncorrelated). Itshould be noted that while this method is relatively straightforward to implement, there are several steps along theway where human subjectivity comes into play. Therefore, we must take the time to walk through the assumptions/protocols followed in this analysis before moving on to any data interpolation. In this analysis, our first step was removing the sample's background fluorescence to ensure that we only factored theRaman scattering in our correlation analysis. This was done using an adaptive iteratively reweighted penalized leastsquares (airPLS) algorithm to fit the fluorescence background and subtract it from the raw data. Next, we chose tonormalize the data to the maximum peak height of each spectrum, ensuring that sample-to-sample measurementuncertainty would be removed. No other data preprocessing was done to the spectra. The spectra were then allcompared to each other using a confusion matrix, where an HQI > 0.85 was defined as a strong correlation (green),0.85> HQI > 0.5 weak correlation (yellow), and an HQI <0.5 uncorrelated (red). SPECTRAL CORRELATION USINGRAMAN SPECTROSCOPY Figure 3 shows a simple example of this process where the four different andradite samples were compared. As youcan see, the two samples from Arizona are exceptionally well correlated with HQI values of 0.9912. The two samplesfrom Mali are also well correlated with an HQI of 0.9026. Interestingly we also see that one of the Mali samples isstrongly correlated to the Arizona samples (HQI =0.9611). At the same time, the other one is only weakly correlatedto the Arizona samples (HQI=0.8130). This simple example illustrates two things simultaneously. First, the fact that correlation is extremely powerful for identifying similar Raman spectra, but it doesn't tell thewhole picture. For example, a close examination of the raw data indicates that both Mali samples have a higherfluorescence signal than the Arizona samples. Andradite Arizona 1 Arizona 2 Mali 1 Mali 2 Arizona 1 1.0000 0.9912 0.9611 0.8130 Arizona 2 0.9912 1.0000 0.9656 0.8265 Mali 1 0.9611 0.9656 1.0000 0.9026 Mali 2 0.8130 0.8265 0.9026 1.000 FIGURE 3 Example of spectral correlation procedure showing with the raw spectral data (upper left),baseline corrected and normalized spectra (upper right), and confusion matrix (bottom). SPECTRAL CORRELATION USINGRAMAN SPECTROSCOPY Next, we applied the same protocol to the six spessartine samples to follow up on the previous application note.The resultant confusion matrix (see figure 4) shows that spessartine samples from Brazil and China stronglycorrelated, but the samples from Pakistan only correlated with each other. This was surprising since China andPakistan samples appeared to be far more similar visually but provide a rationale for the NIR absorbance of thestone from Pakistan being much lower than the other two. We will further investigate these differences using LIBSin the following section. Spessartine Brazil 1 Brazil 2 China 1 China 2 Pakistan 1 Pakistan 2 Brazil 1 1.0000 0.9702 0.9162 0.9045 0.1350 0.1114 Brazil 2 0.9702 1.0000 0.8548 0.8499 1058 0.0876 China 1 0.9162 0.8548 1.0000 0.9916 2106 0.1782 China 2 0.9045 0.8499 0.9916 1.0000 2070 0.1792 Pakistan 1 1350 05 106 0.2070 1.0000 0.9770 Pakistan 2 0.1114 0.1782 0.1792 0.9770 1.0000 FIGURE 4: Confusion matrix for the various spessartine garnets. Finally, we attempted to classify the two unknown garnets by correlating the Raman spectra against our 12 knownsamples. Based on the confusion matrix (see figure 5), we could identify unknown sample 1 as spessartine andunknown sample 2 as grossular. Interestingly, the unknown spessartine appears to be more strongly correlatedwith the Brazil samples than China and not correlated with the ones from Pakistan.Unfortunately, we only have agrossular sample from one region, so it is hard to draw any more profound conclusions about the second unknowngarnet other than the fact that it is grossular. Garnets Unknown 1 Unknown 2 Andradite Arizona 1 396 0.0773 Andradite Arizona 2 354 0.0725 Andradite Mali 1 461 0.0877 Andradite Mali 2 0.0464 0.1715 Spessartine Brazil 1 0.7091 0.0087 Spessartine Brazil 2 0.8800 0.0051 Spessartine China 1 0.6119 0.0098 Spessartine China 2 0.6269 0.0102 Spessartine Pakistan 1 277 0.0570 Spessartine Pakistan 2 204 0.0740 Grossular Tanzania 1 067 0.8713 Grossular Tanzania 2 0.0076 0.8945 FIGURE 5: Confusion matrix comparing two unknown garnets against the entire collection of known garnets. ELEMENTAL ANALYSIS USING LIBS To gain a deeper understanding of results from the last part of this study, we measured the LIBS spectra of all 14garnets using the Avantes LIBS evaluation kit (see figure 6) with an AvaSpec-Mini2048CL configured with a 1200groove grating and a 25-micron slit to provides 0.25nm resolution from 200 nm to 450nm. This spectral range isideal for analyzing garnets because of the high density of LIBS bands for common garnet constituent elementssuch as Al, Ca, Si, Fe, and Mg. FIGURE 6: LIBS experimental set-up. Since all garnets, regardless of species, have the same amountof Si, we normalized all the spectra to the 288nm band,allowingus to compare the relative peak intensities. The spectra shownin figure 7 indicate a substantially higher Mg concentration inthe Brazil sample compared to the Pakistan sample, but not incomparison to the China sample. Interestingly though, when welook at the spessartine of unknown origin, we can see that it hasthe highest Mg concentration. This is consistent with the fact thatthe unknown sample has a deep red color (see figure 8) closer tothat of pure pyrope than pure spessartine. While we measured the LIBS spectra for all 14garnets, we will limit the discussion in this sectionprimarily to the spessartine samples since theyshowed the highest variability. Our first goal was toexplore the hypothesis of the prior application note,which suggested that the Brazil sample may havemore Mg (from the spessartine to pyrope bridge)than the China and Pakistan samples. We tested thishypothesis by looking at the Mg doublet band at280nm compared to the Si band at 288nm. FIGURE 7: LIBS spectra of spessartine garnets zoomed inon the Mg / Si region of the spectrum. ELEMENTAL ANALYSIS USING LIBS The second region of interest we examined was the Ca / Al region of the LIBS spectra centered around 395 nm,which is particularly interesting for exploring the spessartine to grossular bridge. In this region, we chose the Alband at 396 nm for our normalization since all spessartine garnets should have the same amount of Al (see figure 9).Based on the results, we can see that the Pakistan samples contain significantly more Ca than the others. Combingthe abundance of Ca with the relatively low concentration of Mg in the Pakistan samples compared to the otherlocalities, it is now apparent why the Raman spectra did not correlate to the samples from China and Brazil. Thismeans that while they are all spessartine, Brazil, China, and unknown sample are more "pyrope-like" whereas thePakistan sample is more "grossular-like." To further support the argument that the Pakistan sample is more "grossular-like" in nature, it is helpful to compare it with the LIBS spectra of the three grouser samples shown in figure 10.Additionally, the fact that there appears to be H (likely from water inclusions) in both Brazil and unknown samplesbut not in the China sample may indicate why the unknown sample is more strongly correlated to the Brazil samples. Spessartime-Braz Spessartme-Chm: FIGURE 9: LIBS spectra of spessartine garnets zoomed in onthe Ca / Al region of the spectrum. Wavelength (nm) FIGURE 10: LIBS spectra of grossular garnets zoomed in onthe Ca / Al region of the spectrum. FINAL THOUGHTS While each spectroscopic technique is extremely powerful in its own right, no one methodology can provide thecomplete picture, especially in systems like garnets, where the structure combines ionically and covalently boundspecies. This study focused on garnets, but it is important to note that the combination of molecular and atomicspectroscopes is an extremely powerful tool for identifying and classifying complex structures. It is also important to note that while all the components used were standalone modules, they are also available asstandalone units, OEM modules, or can be integrated into multichannel rack mount systems that are ideally suitedto inline large-scale gemstone analysis. These units can communicate via USB, Ethernet, and the native digital &analog input/output capabilities of the Avantes AS7010 electronics board provide a superior interface with otherdevices. Additionally, the Avantes AvaSpec DLL package, with sample programs in Delphi, Visual Basic, C#, C++,LabView, MATLAB, and many other programming environments, enables users to develop their own code. Contact Us For more information about the full range of spectrometer options available from Avantes for fluorescencespectroscopy, please feel free to visit the website at www.avantes.com or give us a call at +1 (303)-410-8668 (USA)or +31 (0) 313 670 170 (Europe) where our knowledgeable applications specialists are standing by to help Reference 1) Jakaite, Lina. "A visual representation of the end members of garnet and the relationship of the elements that aresubstituted for each variety" wikipedia, https://bit.ly/3kcVFJI 04.24.2022 CONTACT WE'RE HAPPY TO HELP Curious how spectroscopy can help you reveal answers by measuring all kinds of material in-line, at yourproduction facility, in a lab, or even in the field? Visit our website or contact one of our technical experts. Weare happy to help you. Avantes Headquarters Phone: +31 (0) 313 670 170 Email: info@avantes.com Website: www.avantes.com Avantes Inc. Phone: +1(303) 410 8668 Email: infousa@avantes.com Website: www.avantesUSA.com Avantes China Phone: +86 (0) 108 457 4045 Email: info@avantes.com.cn Website: www.avantes.cn Follow us on social media:
确定

还剩7页未读,是否继续阅读?

产品配置单

北京爱万提斯科技有限公司为您提供《利用拉曼和LIBS技术分析宝石特性》,该方案主要用于珠宝/玉石中宝石/石榴石特性检测,参考标准--,《利用拉曼和LIBS技术分析宝石特性》用到的仪器有Avantes Raman Bundles拉曼光谱仪、爱万提斯HS2048XL光纤光谱仪、AvaSpec-ULS2048XL光纤光谱仪、AvaSpec激光诱导击穿光谱仪
推荐专场


相关方案
更多