


方案详情
文
Using an automated scanning electron microscope (SEM)
and energy dispersive X-ray spectroscopy (EDS) to find
and positively identify gunshot residue (GSR), has been
an accepted method for forensic applications for quite a
number of years.
方案详情

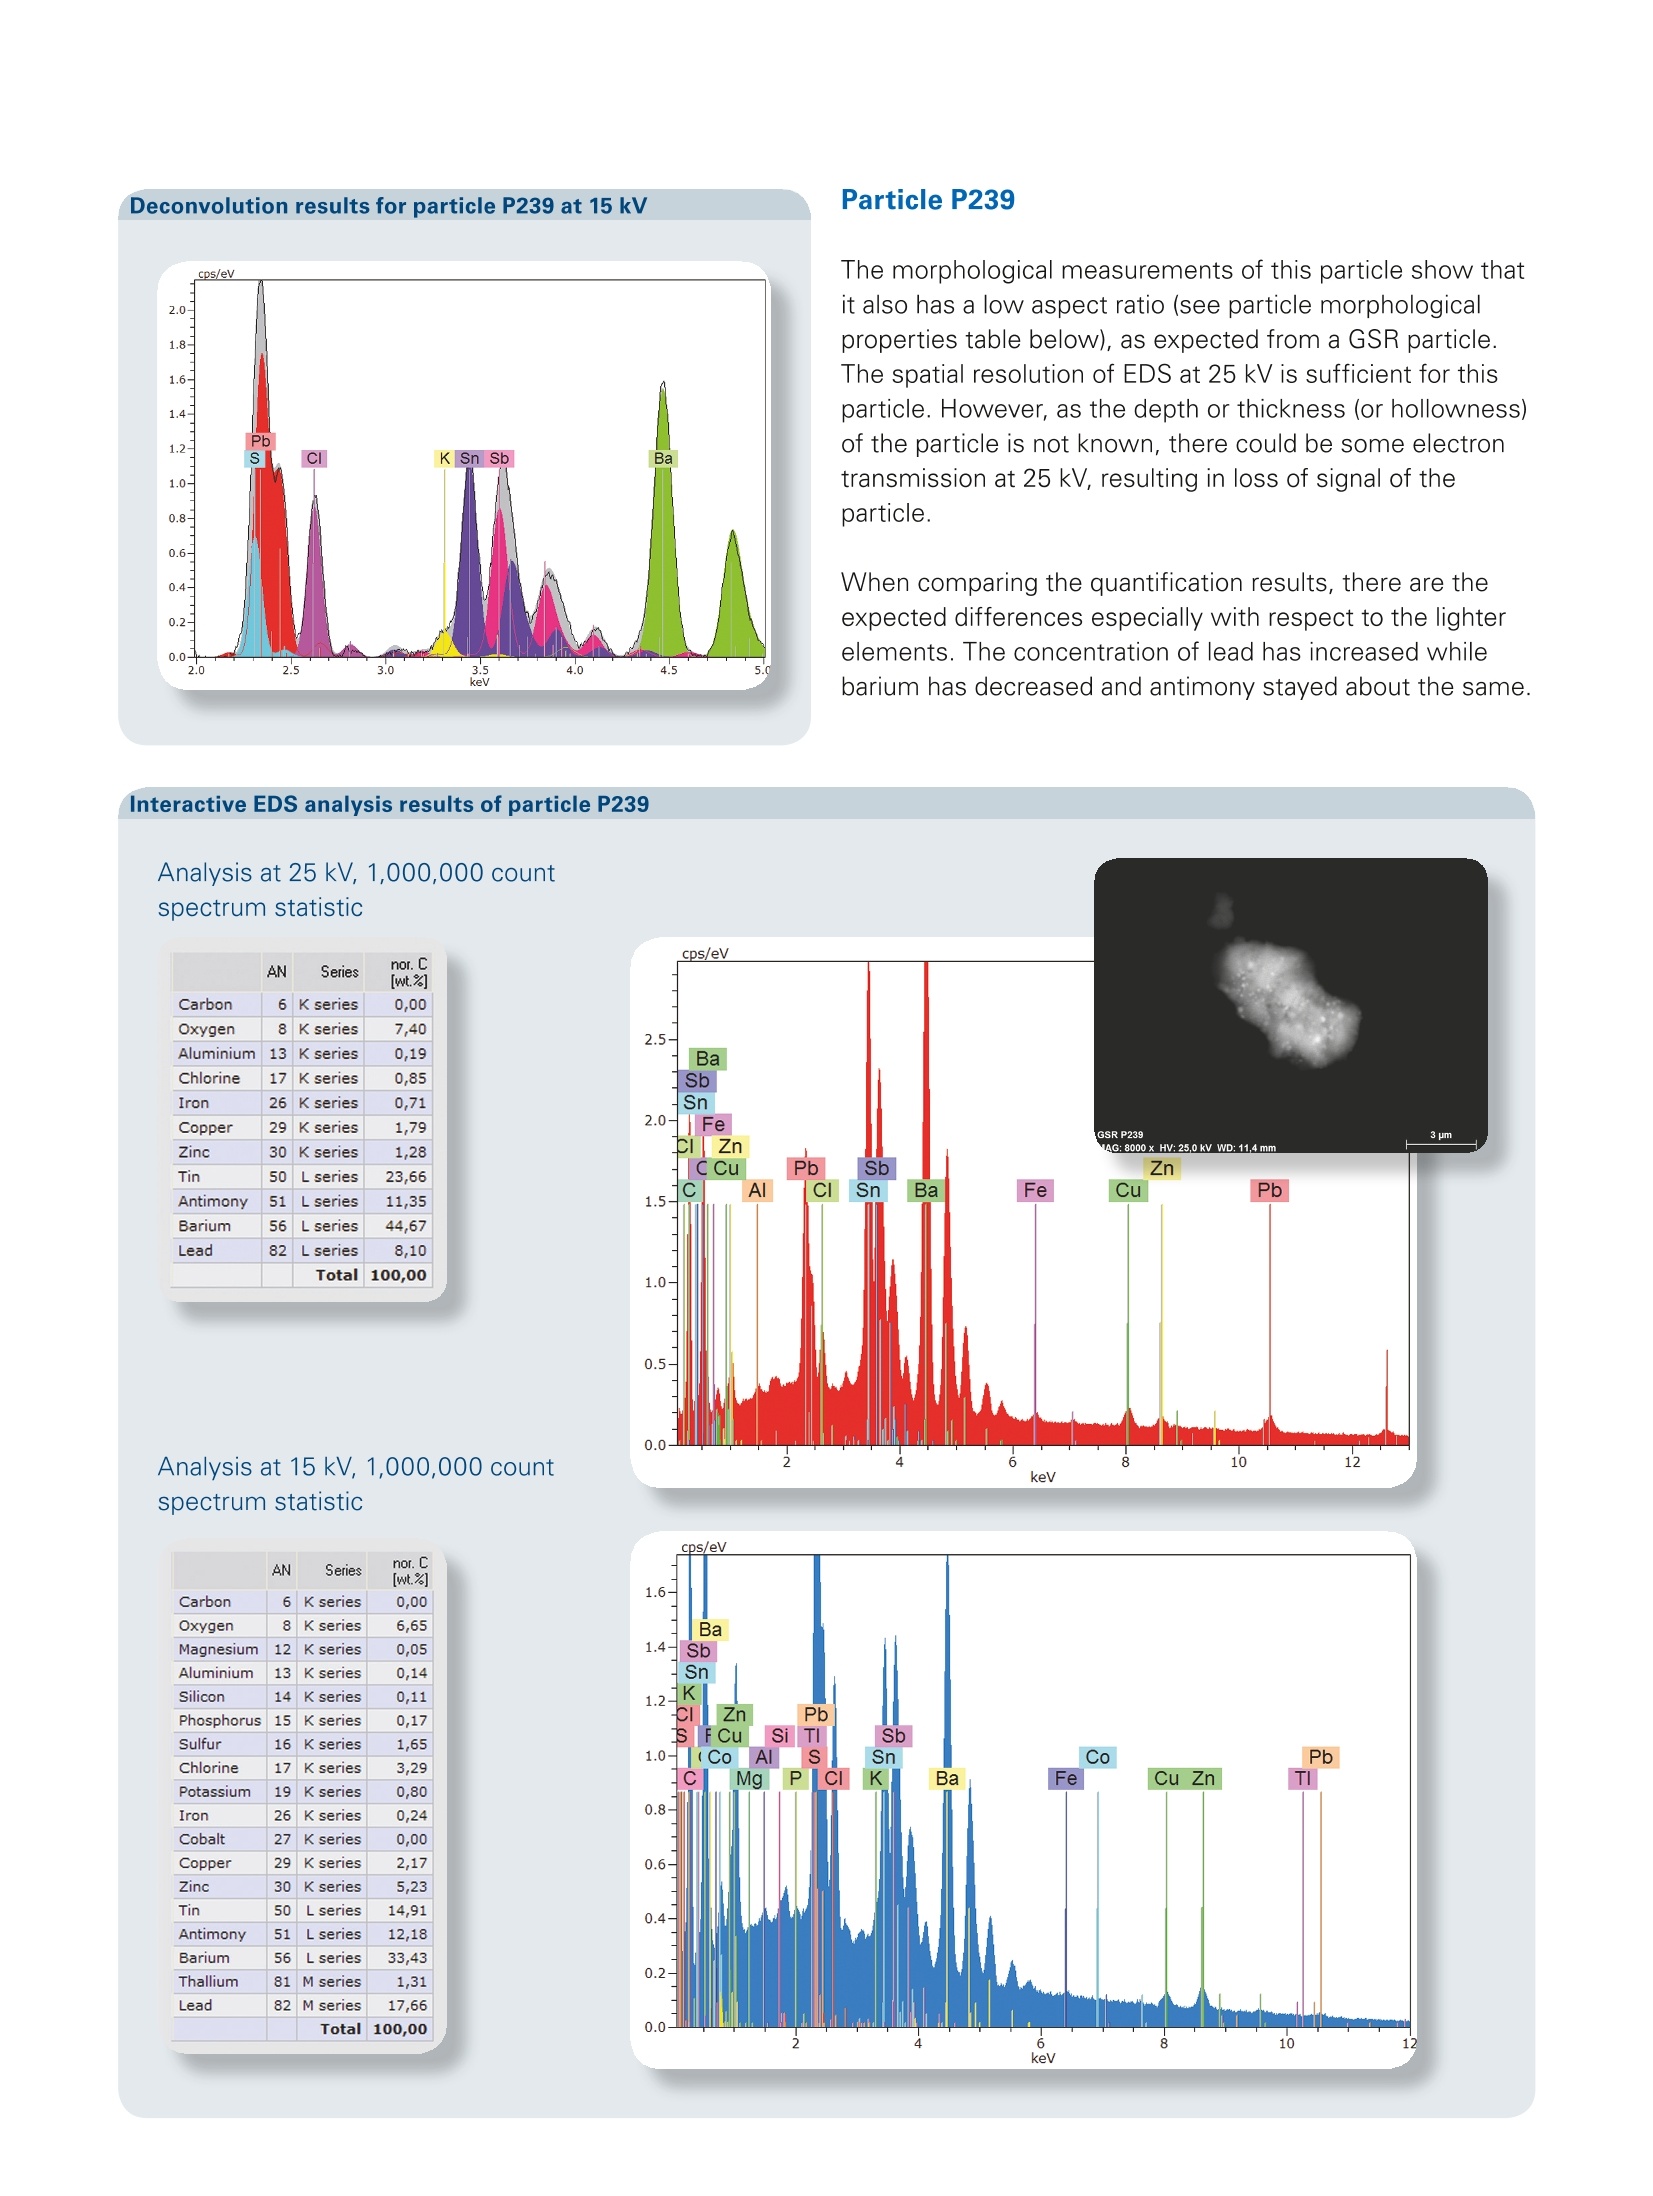
Particle P63 Composition Seres16 K seneses1,552orine17 K senes3,01tassiunm19 K sereses0,7326 K senes 0.4obalt 27 Ksenes0,009oper 29 Ksenes2,1230 K senes5,1050 Lsenes 13,6f Scatter plot GSR particle Deconvolutionresults Application Note # EDS-08 Determining gunshot residue using 15 kVacceleration voltage with optimizedspectra deconvolution and high resolutionXFlash@ silicon drift detectors Using an automated scanning electron microscope (SEM)and energy dispersive X-ray spectroscopy (EDS) to findand positively identify gunshot residue (GSR), has beenan accepted method for forensic applications for quite anumber of years. The push to find smaller and smaller GSR particles hasbecome a challenge. This is due to the calibration of themicroscope and the required high speed of the analysison the one hand. On the other hand the industry standard25 kV acceleration voltage and the insufficient resolutionrequirements for EDS detectors of currently <150 eV @ MnKa prove to be a limitation. The high acceleration voltagedue to the fact that until now EDS software relied on thelead L-lines for quantification because of the overlap of theM-lines of lead with sulphur and molybdenum. Additionallythere were and still are numerous errors in the M-linepositions and intensities with some software solutions.With the optimized tools available in QUANTAX ESPRITand the high resolution of 123 eV @ Mn Ka, which BrukerXFlash@ Detectors provide, this is no longer a limitation, asshows. We will explain why GSR analyses at 25 kV are suboptimaland describe GSR determination at 15 kV as an alternative.The challenge in this approach is that the lead M-lineshave to be used for quantification and one has to dealwith the mentioned line overlap with sulphur and possiblymolybdenum. This means that a well-functioning peakdeconvolution is required for reliable results. The reason for choosing 15 kV accelerating voltage- apartfrom the good excitation conditions for the M-lines- isthat the interaction volumes at 15 kV are much smallerthan those at 25 kV. This can be seen in the Monte Carloplots below, which compare interaction volumes within asample consisting of barium, lead and antimony, the typicalcomposition of GSR particles. In fact, the less than halfdiameter results in an eighth of the interaction volume at15 kV. This bears the promise that, compared to 25 kVacceleration voltage, relatively more radiation will stem fromthe particle itself rather than from its surroundings. Thesmaller the particle the more important this issue becomes,as it has a direct effect on the accuracy of quantification. Simulated interaction volumes of electrons hittinga sample consisting of barium, lead and antimonywith an energy of 25 keV (upper graph) and 15 keV(lower graph). Method A comparison of deconvolution and quantification of thelead L-line at 25 kV with the M-line at 15 kV can be doneusing a lead containing standard such as Galena. This givesthe accuracy of the method based on an absolute standard.However, to simulate real-world conditions, an actual GSRsample was measured as well. The ESPRIT Feature module was used in conjunction withJobs and StageControl to automatically scan an area ofabout 30 mm² of a GSR sample, to detect, measure and.classify all potential GSR candidates. The feature detectionwas set to a single phase binarization of the brightestparticles (between 150 and 255 grey scale) and to reject anyparticles smaller than 3 pixels. Chemical classification wasset to acquire the spectra as shown below, and quantifyautomatically and classify according to common GSRparticle compositions (containing Ba, Pb and Sb). The following conditions for the unattended run were set forimage resolution and not speed: Detector: XFlash@ 5010 Premium Plus 123 eV Solid angle: ~0.006 sr Spectra statistics: 50,000 counts between 0.5 and 15.0 keV Imaging: 1024x768 pixel, 16 ps / pixel dwell time, overlap of 8% Magnification: 500x,~0.26 pm/ pixel Acceleration voltage: 25kV Probe current: ~2nA Input count rate: ~20 kcps on Cu Once the run had been completed, the five particlescontaining over 10 weight % each of barium, lead andantimony-and therefore unambiguously identified as GSR- were reanalyzed with a 1,000,000 count statistic andinteractive quantification. This was then repeated for 15 kV.Finally the 5 particles were analyzed with 50,000 countsin the region between 0.5 and 15.0 keV and quantifiedautomatically with the same method as used in theunattended analysis run. Results The results for the automated analysis were ready to bereviewed after four and a half hours. 1603 particles weremeasured by EDS and just shy of 1000 hits wereclassifiedThe hits were divided into the following classes: GSR: Ba> 10 weight % and Pb > 10 weight % and Sb > 10 weight % GSR 1: Ba >15 weight % GSR 2: Pb > 15 weight % GSR 3: Sb> 15 weight % Particles the classes GSR 1 -3 are likely to be GSR butdo not fulfill the most stringent requirements regardingcomposition. The number of particles binned to the classes above were: GSR: 5 GSR 1: 905 GSR 2: 85 GSR 3: 2 Ba + Sb Brass: Iron: 180 Silver: 5 Tin:Tab: 89 Ni Cr: Salt: 81 Unclassified : 105 Classification results Scatter plot showing the distribution of particles according totheir Ba content vs. their Pb content (upper graph) and histo-D-gram showing the chemical classes and numbers of particlesthat were binned to them (lower graph). for measurement control, including revisitingparticles for post measurement analysis. In this report only two particles are described in detail,but the summary in the tables below contains results forall 5. Note that there was only a deconvolution and noquantification perfomed for carbon due to the fact that thesample is based on a carbon tab. The morphological measurements of this particle show thatit has a low aspect ratio (see also particle morphologicalproperties table below), as expected from a GSR particle,and is of a typical size. It is at the spatial resolution limitsof EDS at 25 kVas shown in the Monte Carlo simulationabove. Note how the summation spectrum (grey) of thedeconvolution peaks (in individual colors) in the graph onthe right show an extremely good match to the acquiredspectrum (black line). When comparing the results for the quantification, there areonly very minor discrepancies, with lead having a slightlydecreased concentration in the 15 kV quantification. Deconvolution results for particle P239 at 15 kV The morphological measurements of this particle show thatit also has a low aspect ratio (see particle morphologicalproperties table below), as expected from a GSR particle.The spatial resolution of EDS at 25 kV is sufficient for thisparticle. However, as the depth or thickness (or hollowness)of the particle is not known, there could be some electrortransmission at 25 kV, resulting in loss of signal of theparticle. When comparing the quantification results, there are theexpected differences especially with respect to the lighterelements. The concentration of lead has increased whilebarium has decreased and antimony stayed about the same. Particle morphological properties Particle Field Length Width Aspect Area in CenterX Center Y ratio pixels P63 6 4.42 2.44 1.81 104.00 301.01 589.95 P239 13 7.56 4.51 1.67 337.00 397.72 372.40 P604 58 1.50 1.06 1.41 13.00 95.62 282.54 P750 71 3.46 1.70 2.03 54.00 242.15 651.11 P918 91 2.14 1.60 1.34 35.00 762.89 4.09 Composition of GSR particles [mass %] (automatic quantification of 25 kV spectra) Spectrum Na CI Fe Cu Sn Sb Ba Pb P63 10.59 4.24 6.04 4.96 - - 7.8 23.27 18.93 24.17 P239 13.46 - 3.04 - 3.08 11.35 16.02 36.4 16.66 P604 22.94 - 7.02 - - - 25.72 18.72 25.6 P750 20.19 - 6.61 - - - 5.2 22.7 17.13 28.18 P918 26.4 - 11.46 4.65 2.24 - - 24.21 11.52 19.52 Mean value: 23.25 4.24 6.83 4.53 2.24 3.08 8.11 22.38 21.23 22.82 Sigma: 12.57 0 3.02 0.5 0 0 3.09 3.74 8.54 4.17 Sigma mean: 5.13 0 1.23 0.21 0 0 1.26 1.53 3.49 1.7 Composition of GSR particles [mass %] (automatic quantification of 15 kV spectra) Spectrum Na Si CI Sn Sb Ba Pb P63 5.19 3.33 1.33 8.38 2.27 7.52 26.75 22.75 22.48 P239 6.53 2.04 - - - 21.45 9.47 42.97 17.55 P604 5.05 - - 11.98 - 7.8 33.81 23.86 17.5 P750 2.71 - 14.06 - 7.38 29.9 14.67 31.28 P918 2.64 - - 11.9 2.38 7.39 38.72 18.12 18.85 Mean value: 4.42 2.68 1.33 11.58 2.33 10.31 27.73 24.47 21.53 Sigma: 1.7 0.91 0 2.36 0.08 6.23 11.15 10.97 5.82 Sigma mean: 0.76 0.41 0 1.05 0.04 2.79 4.98 4.91 2.6 Comparison of GSR Particles at 15 and 25 kV Note the similarity of the result for each particle for lead,barium and antimony. There are some deviations betweenparticles, especially between the smaller ones due to thesignal loss and the larger ones, as they are likely to behollow, skewing the result a little. However, it is also quite clear that the mean values of theseparticles vary only a few percent for lead, antimony andbarium when comparing 15 and 25 kV. Individual resultsvary a little more, but these are strongly dependant on the3 dimensional structure of the particle as well as on itshomogeneity. This is because particles smaller than 2 pmin any dimension or ones that are hollow, will display astronger variation due to the amount of material interactingwith the electrons and thus producing X-ray photonemission. One thing that can be concluded is that an accelerationvoltage of 15 kV will excite a much smaller volume of a GSRparticle, giving a higher level of confidence that the spectraare produced entirely from within the particles. Hence to absolutely compare the quantitative resultsobtained at 15 and 25 kV, free from influences of geometryand size, bulk Galena and Crocoite standards were analyzed. Comparison Galena and Crocoite standards Certified compositions (ASTIMEX standards): Galena (PbS) Pb Sum 13.4% 86.6% 100.0% Crocoite (PbCrO) Cr Pb Sum 19.8% 16.09% 64.11% 100.0% Acquiring both low and high count EDS spectra on theGalena and the Crocoite standard first at 25 kV followedby 15 kV, the standardless PB-ZAF quantification resultsare then compared to each other by count statistics andafterwards to the certified results. Using Bruker's new Opti-Series-Fit Deconvolution andconsidering carbon for deconvolution only (due to thesamples being carbon-coated), the results of the automaticquantification are as follows: Results of Galena analysis [mass %] Spectrum S Pb 15 kV, 1,000,000 counts 13.60 86.40 15 kV, 50,000 counts 13.53 86.47 25 kV, 1,000,000 counts 12.23 87.77 25 kV, 50,000 counts 13.42 86.58 Results of Crocoite analysis [mass %] Spectrum Cr Pb 15 kV, 1,000,000 counts 21.04 17.67 61.29 15 kV, 50,000 counts 20.95 17.54 61.51 25 kV, 1,000,000 counts 20.64 17.16 62.20 25 kV, 50,000 counts 20.35 16.79 62.86 As can be seen, the results obtained on the bulk standardsat 15 and 25 kV are quite similar. All together the deviationfrom certified values are negligible. In fact the quantificationresults of the 15 kV excitation are so close, that it isreasonable to suggest that the 15 kV quantification basedon the lead M-lines is reliable, even overlaps with sulphurOCcur. Conclusions It has been demonstrated that due to the spatial resolutionof EDS, it would be favorable to use 15 kV accelerationvoltage instead of 25 kV for GSR analysis. It has also beenshown that the results of low count spectra of real GSRparticles yield similar results when using 15 kV comparedto 25 kV. High count spectra also show comparable resultsfor these particles. However, the differences in 25 kV and15 kV can be attributed to the structure of the particles,such as flat, hollow or small particles affecting results.Furthermore, the inhomogeneous nature of GSR particlesadds to the complexity of result interpretation. The muchlarger excitation volume when analyzing with 25 kV canskew results of these particles even further. Also, it has been shown, that when using a bulk sampleor standard with a known concentration, the new Opti-Series-Fit Deconvolution and the standardless PB-ZAFquantification in conjunction with a high resolution XFlash@Detector, can in fact produce very reliable results at 15 kV,matching the certified values. Author Samuel Scheller, Global Product Manager EDS/SEM,Bruker Nano GmbH Acknowledgements Thanks to Ken Mason of Eastern Analytical for providing theGSR specimen. Particle review in detail The review function in detail. In this case thespectra tab is selected which provides access to all particle spectra. Quantifica-tion results can be reviewed here and if required a particle can be reclassified including requantification. oc Bruker Nano GmbH Berlin·Germany Phone +49 (30) 670990-0 Fax +49 (30)670990-30 info.bna@bruker.com www.bruker.com/quantax-eds-for-sem has been demonstrated that due to the spatial resolutionof EDS, it would be favorable to use 15 kV accelerationvoltage instead of 25 kV for GSR analysis. It has also beenshown that the results of low count spectra of real GSRparticles yield similar results when using 15 kV comparedto 25 kV. High count spectra also show comparable resultsfor these particles. However, the differences in 25 kV and15 kV can be attributed to the structure of the particles,such as flat, hollow or small particles affecting results.Furthermore, the inhomogeneous nature of GSR particlesadds to the complexity of result interpretation. The muchlarger excitation volume when analyzing with 25 kV canskew results of these particles even further.Also, it has been shown, that when using a bulk sampleor standard with a known concentration, the new Opti-Series-Fit Deconvolution and the standardless PB-ZAFquantification in conjunction with a high resolution XFlash®Detector, can in fact produce very reliable results at 15 kV,matching the certified values.
确定


还剩6页未读,是否继续阅读?

产品配置单

布鲁克电子显微纳米分析仪器部为您提供《枪弹残留物中元素检测方案(X射线能谱仪)》,该方案主要用于刑侦中元素分析检测,参考标准--,《枪弹残留物中元素检测方案(X射线能谱仪)》用到的仪器有布鲁克 , EDS, 能谱仪, SEM, TEM、布鲁克 QUANTAX EDS 能谱仪(TEM)、布鲁克3D EDS/EBSD重构软件QUBE
推荐专场
相关方案
更多