


方案详情
文
酸奶是一种发酵乳制品,通过向牛奶中添加微生物培养物,它会将牛奶中的糖、乳糖转化为乳酸。这一过程赋予酸奶清爽的酸味和凝胶质地。
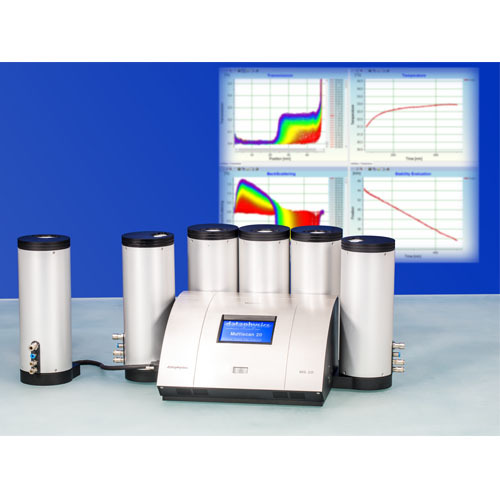
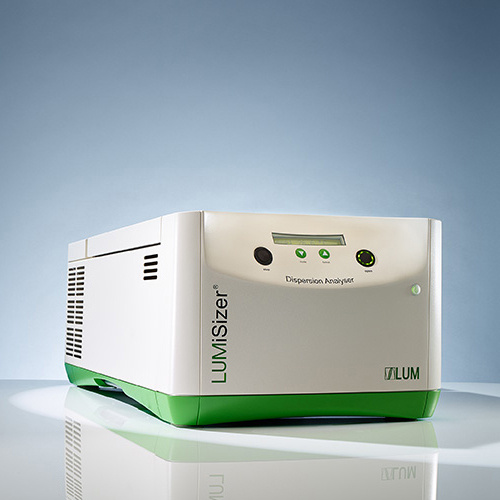
研究人员对市售的多种酸奶进行取样,利用LUMiSizer®分散体分析仪,通过SEPView中的界面追踪模块对酸奶的稳定性进行比较,为其定性和定量分析提供了一种工具。
实验条件:NIR近红外光源、2300倍重力加速度,在25℃条件下测试42min
方案详情

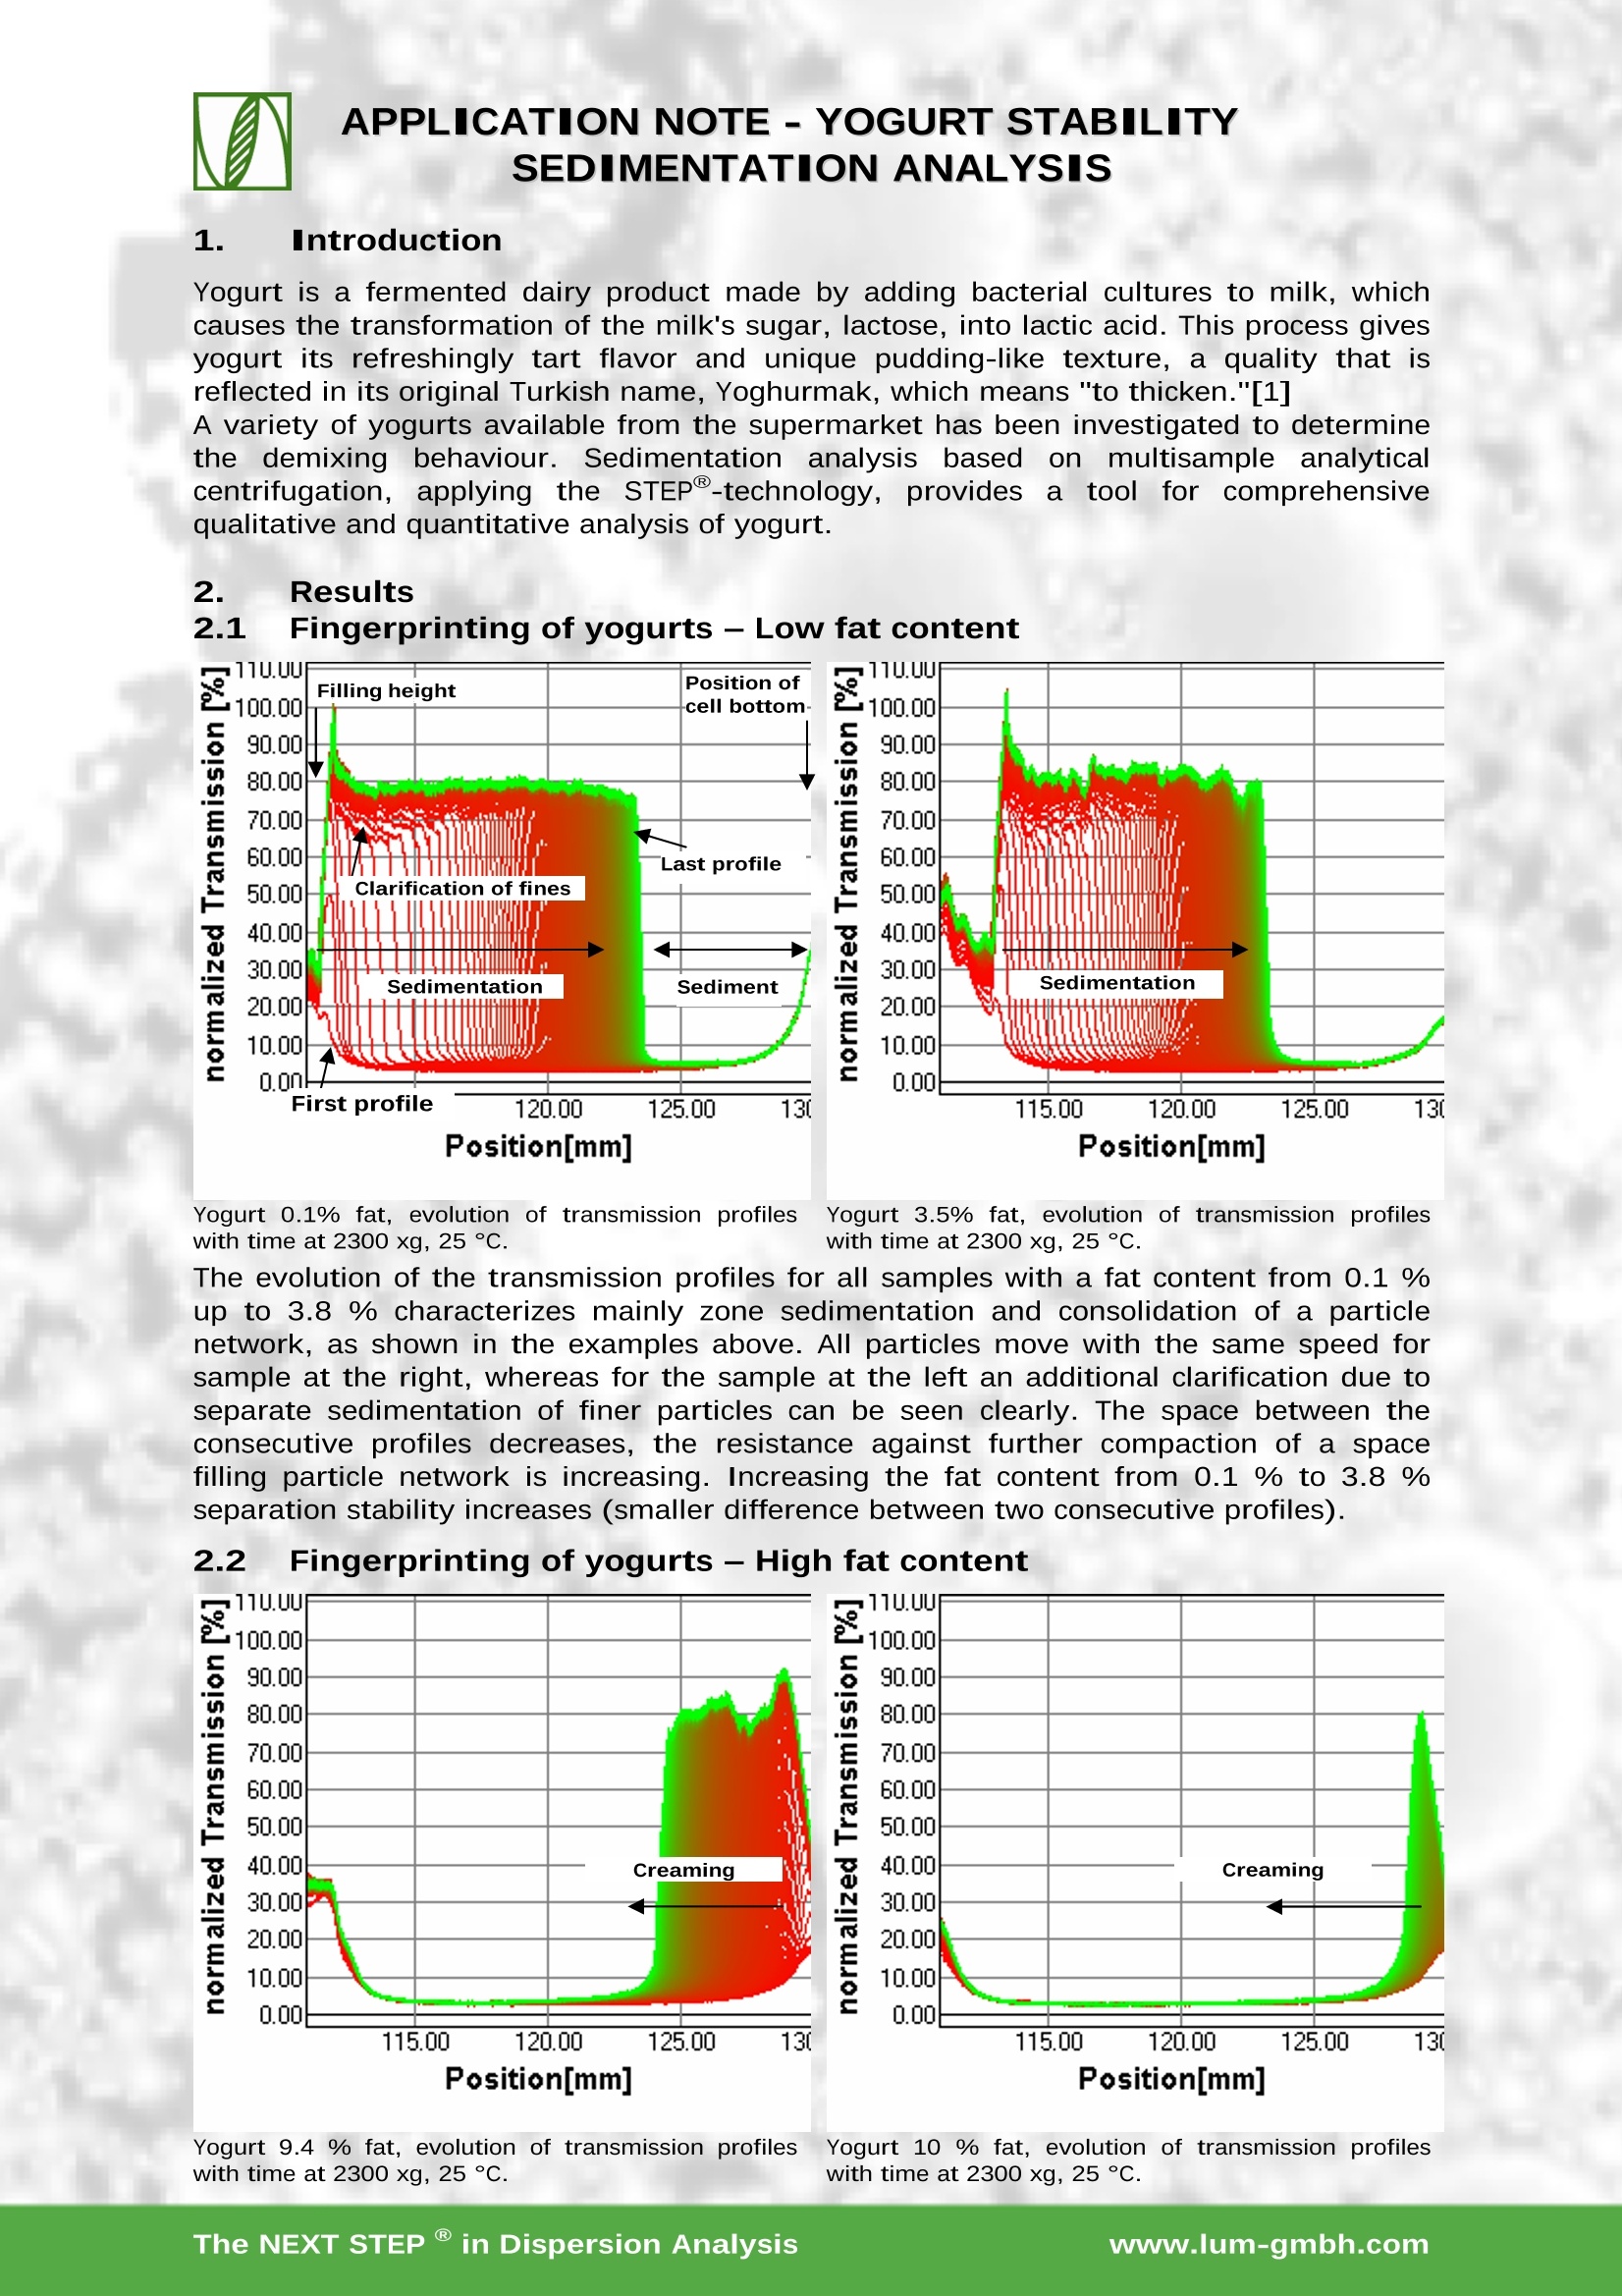
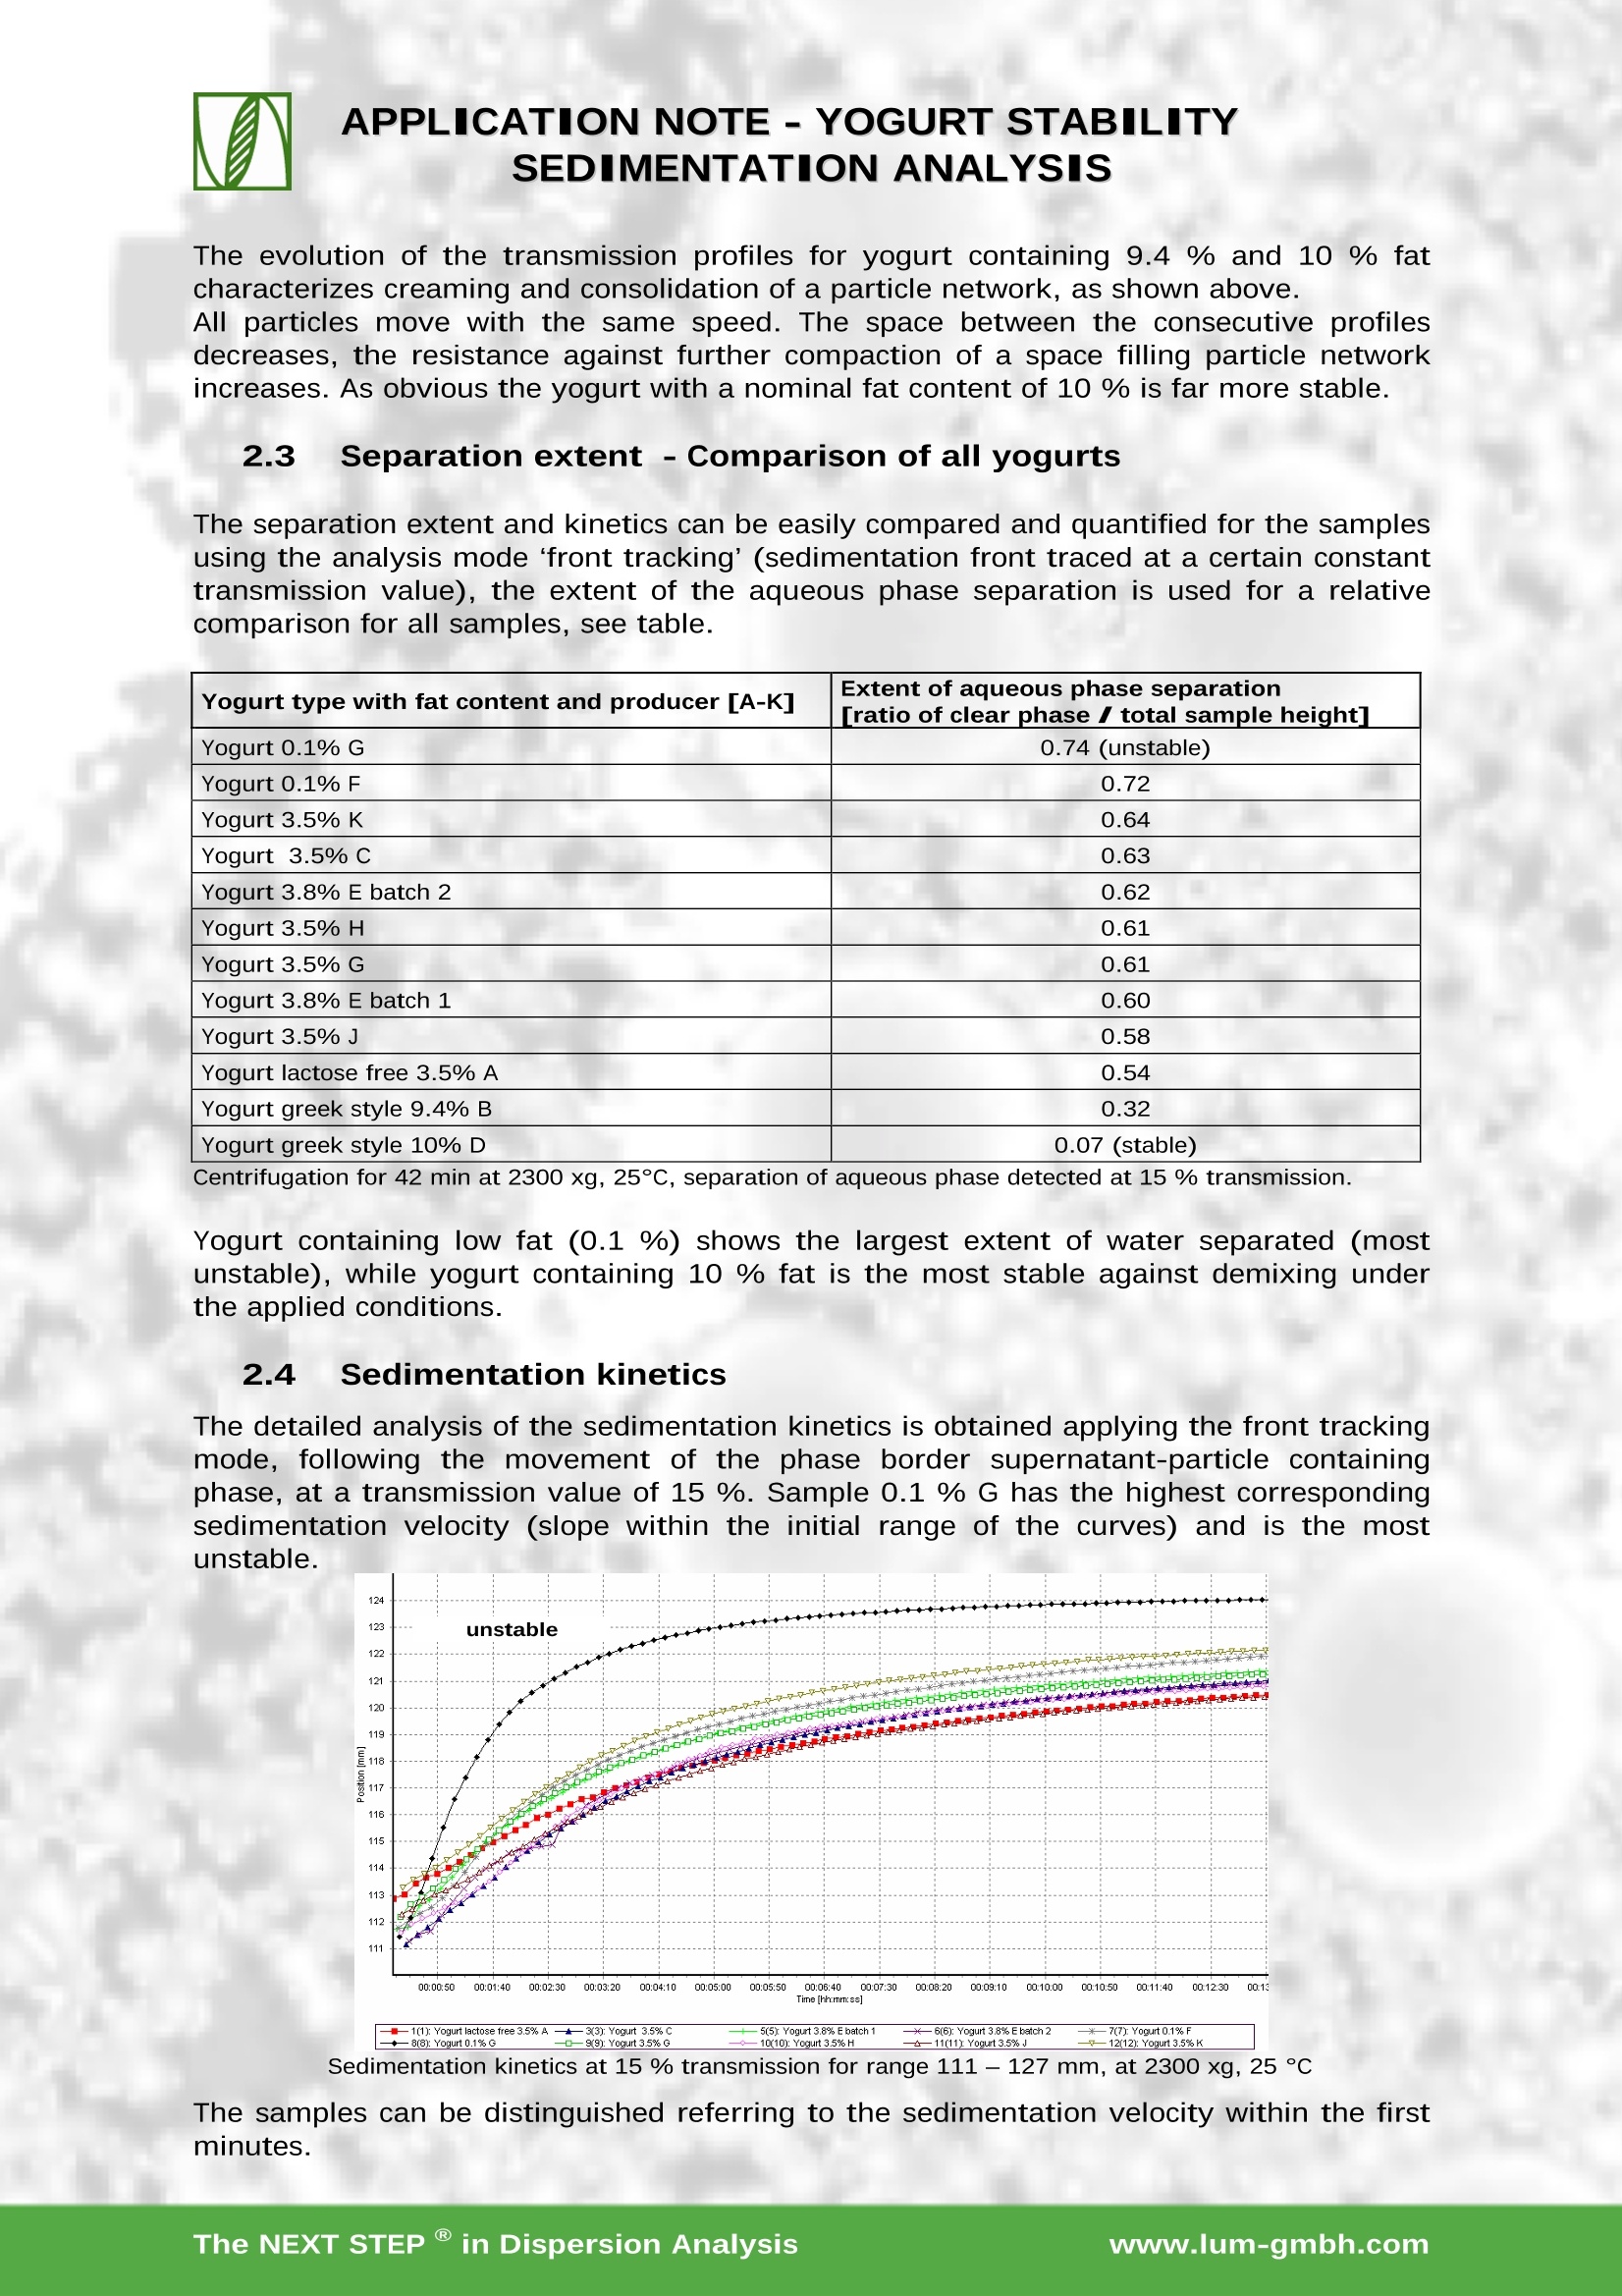
APPLICATION NOTE-YOGURT STABILITYSEDIMENTATIONANALYSIS 1. Introduction Yogurt is a fermented dairy product made by adding bacterial cultures to milk, whichcauses the transformation of the milk's sugar, lactose, into lactic acid. This process givesyogurt its refreshingly tart flavor and unique pudding-like texture, a quality that isreflected in its original Turkish name, Yoghurmak, which means "to thicken."[1] A variety of yogurts available from the supermarket has been investigated to determinethe demixingbehaviour. Sedimentation analysisbasedi on multisample analyticalcentrifugation, applying the STEP@-technology,providesatool for comprehensivequalitative and quantitative analysis of yogurt. 2. Results 2.1 Fingerprinting of yogurts - Low fat content Yogurt 0.1% fat, evolution of transmission profiles Yogurt 3.5% fat, evolution of transmission profileswith time at 2300 xg, 25°C. with time at 2300 xg, 25 °C. The evolution of the transmission profiles for all samples with a fat content from 0.1 %up to 3.8 % characterizes mainly zone sedimentation and consolidation of a particlenetwork, as shown in the examples above. All particles move with the same speed forsample at the right, whereas for the sample at the left an additional clarification due toseparate sedimentation of finer particles can be seen clearly. The space between theconsecutive profiles decreases, the resistance against further compaction of a spacefilling particle network is increasing. Increasing the fat content from 0.1% to 3.8 %separation stability increases (smaller difference between two consecutive profiles). 2.2 Fingerprinting of yogurts - High fat content Creaming Position[mm] Position[mm] Yogurt 9.4 % fat, evolution of transmission profileswith time at 2300 xg, 25°C. Yogurt 10 % fat, evolution of transmission profileswith time at 2300 xg, 25°C. APPLICATION NOTE-YOGURT STABILITY SEDIMENTATION ANALYSIS The evolution of the transmission profiles for yogurt containing 9.4 % and 10 % fatcharacterizes creaming and consolidation of a particle network, as shown above.All particles move with the same speed. The space between the consecutive profilesdecreases, the resistance against further compaction of a space filling particle networkincreases. As obvious the yogurt with a nominal fat content of 10 % is far more stable. 2.3 Separation extent -Comparison of all yogurts The separation extent and kinetics can be easily compared and quantified for the samplesusing the analysis mode front tracking'(sedimentation front traced at a certain constanttransmission value), the extent of the aqueous phase separation is used for a relativecomparison for all samples, see table. Yogurt type with fat content and producer [A-K] Extent of aqueous phase separation[ratio of clear phase / total sample height] Yogurt 0.1% G 0.74 (unstable) Yogurt 0.1% F 0.72 Yogurt 3.5% K 0.64 Yogurt 3.5% C 0.63 Yogurt 3.8% E batch 2 0.62 Yogurt 3.5% H 0.61 Yogurt 3.5% G 0.61 Yogurt 3.8% E batch 1 0.60 Yogurt 3.5%J 0.58 Yogurt lactose free 3.5% A 0.54 Yogurt greek style 9.4% B 0.32 Yogurt greek style 10% D 0.07 (stable) Centrifugation for 42 min at 2300 xg, 25°C, separation of aqueous phase detected at 15 % transmission. Yogurt containing low fat (0.1 %) shows the largest extent of water separated (mostunstable), while yogurt containing 10 % fat is the most stable against demixing underthe applied conditions. 2.4 Sedimentation kinetics The detailed analysis of the sedimentation kinetics is obtained applying the front trackingmode, following the movement of the phase border supernatant-particle containingphase, at a transmission value of 15 %. Sample 0.1 % G has the highest correspondingsedimentation velocity (slope within the initial range of the curves) and is the mostunstable. 三 Sedimentation kinetics at 15 % transmission for range 111 -127 mm, at 2300 xg,25°℃ The samples can be distinguished referring to the sedimentation velocity within the firstminutes. APPLICATION NOTE-YOGURT STABILITYSEDIMENTATION ANALYSIS 2.5 Comparison of two batches with different shelf life Two yogurts of identical type and producer but with different shelf life were compared.Batch 1 had a Best before date of 10 days after the purchase date and batch 2 had aBest before date of 16 days after purchase on the same day. Both samples were measured at 4°C immediately after purchase, after aging for one dayat 25°C and after aging for three days at 25°C. The calculated sedimentation rates (fronttracking at 15 %transmission for the range 108 - 123 mm, following the sedimentationwithin the first 150 sec) are compared in the following table. Sedimentation rate at 2300 xg [pm/sec] StdDev [um/sec] Corr.coeff. Yogurt 3.8% E 10 days shelf life, 4°C 23.0 0.4 0.999 Yogurt 3.8%E 16 days shelf life, 4°C 22.2 0.4 0.998 Yogurt 3.8% E 10 days shelf life, aged 1 day 25°C 36.8 1.1 0.994 Yogurt 3.8%E 16 days shelf life, aged 1 day 25°C 32.3 2.1 0.974 Yogurt 3.8% E 10 days shelf life, aged 3 days 25°C 33.0 0.4 0.999 Yogurt 3.8% E 16 days shelf life, aged 3 days 25°C 30.7 0.4 0.999 The fresh product with a shelf life of 16 days shows lower sedimentation rates at alltimes, i.e. a higher stability. 3.m Summary Multisample analytical centrifugation, applyingtthe STEP@-technology, provides apowerful tool for comprehensive qualitative andquantitative analysis of yogurt.Sedimentation and creaming is detected simultaneously. The extent of the separatedaqueous phase, the sedimentation or creaming rate give information on the stability ofthe yogurt samples. 4. References [1] http://www.whfoods.com/genpage.php?tname=foodspice&dbid=124, available 19.2.2008 Yogurt Quality with Fiber Addition, B. Olsen, Tate&Lyle, Cultured Diary Products Conference 2007, International Diary Products Association, May 22, 2007, www.idfa.org/meetings/presentations/cultureddairy07_olsen.pdf, available for download on 6th February 2008 Analysis of Milk and Dairy Products, Yogurt, Curd, Whey Drinks, Cream Liquors, Application note L.U.M. GmbH 5/2008 STEP-Technology see www.lum-gmbh.com/pages/technology.htm Characterization of food quality and structural stability by analytical centrifugation, D. Lerche, L. Piesendel, B. Senge, Proceedings 3dInternational Symposium of Food Rheology andStructure, 2003,149-153 The NEXT STEP @ in Dispersion Analysiswww.lum-gmbh.com 1. 介绍酸奶是一种发酵乳制品,通过向牛奶中添加微生物培养物,它会将牛奶中的糖、乳糖转化为乳酸。这一过程赋予酸奶清爽的酸味和凝胶质地。研究人员对市售的多种酸奶进行取样,利用LUMiSizer®分散体分析仪,通过SEPView中的界面追踪模块对酸奶的稳定性进行比较,为其定性和定量分析提供了一种工具。实验条件:NIR近红外光源、2300倍重力加速度,在25℃条件下测试42min2.结果2.1酸奶的指纹图谱-低脂肪含量如上述样品图谱为例,脂肪含量从0.1%到3.8%的所有样品的透射率谱线的变化主要表征了颗粒网络的区域沉降和固结。右图样品,所有的颗粒都以相同的几乎相同的速度迁移,而对于左侧的样品,由于更细小颗粒的分离沉降,可以清楚地看到更多的澄清层。谱线间的间距减小,对天空空间的网络结构进一步压缩的阻力持续增加。脂肪含量从0.1%增加到3.8%,酸奶的稳定性增加。2.2酸奶的指纹图谱-高脂肪含量如上图所示,脂肪含量9.4%和10%的样品的透射率谱线的变化主要表征了颗粒网络的区域上浮和固结。所有的颗粒都以相同的几乎相同的速度运动,谱线间的间距减小,对填充空间的网络结构进一步压缩的抵抗力持续增加。显而易见,脂肪含量10%的酸奶要稳定的多。2.3分离程度-所有酸奶进行比较采用分析模块“界面追踪”(在某一恒定透光率值下追踪到的界面),可以方便地对样品的分离行为和动力学进行比较和定量,对所有样品的水相分离程度进行比较,见下表。脂肪含量为0.1%的酸奶水相分离程度最大(最不稳定),而含脂肪含量为10%的酸奶最稳定。2.4沉降动力学采用界面追踪分析模块,在15%的透光率阈值下,随着界面的移动,对沉降动力学进行了详细的分析。0.1% G样品具有最高的界面迁移速度(曲线前期的斜率),且最不稳定。根据最初几分钟内的界面沉降速度可以区分样品。2.5两批不同保质期酸奶的比较对同一品种、同一制造商、不同货架期的两种酸奶进行比较。第一批酸奶的最佳货架期为购买日后的10天内,第二批酸奶的最佳货架期为购买日后的16天内。两种酸奶购买后立即在4℃条件下进行测定,25℃老化1天后测定,25℃老化3天后测定.下表比较了两种酸奶样品的界面沉降速度(界面追踪参数:分析区间108-123mm,阈值15%,前150s)。货架期为16天的新鲜产品在任何时候都显示出较低的沉降速度,即更高的稳定性。3. 总结多样品离心分析,应用STEP®技术,为酸奶的定性、定量分析提供了快捷有效的工具。同时检测样品的沉降和上浮。通过相分离程度、沉降或上浮速度提供酸奶样品稳定性的信息
确定
还剩1页未读,是否继续阅读?

产品配置单

罗姆(江苏)仪器有限公司为您提供《酸奶中沉降和上浮检测方案(激光光散射仪)》,该方案主要用于液体乳中理化分析检测,参考标准--,《酸奶中沉降和上浮检测方案(激光光散射仪)》用到的仪器有罗姆分散体分析仪LUMiSizer ® 650
推荐专场


相关方案
更多
该厂商其他方案
更多