


方案详情
文
TauSense: a fluorescence lifetime-based tool set for everyday imaging
方案详情

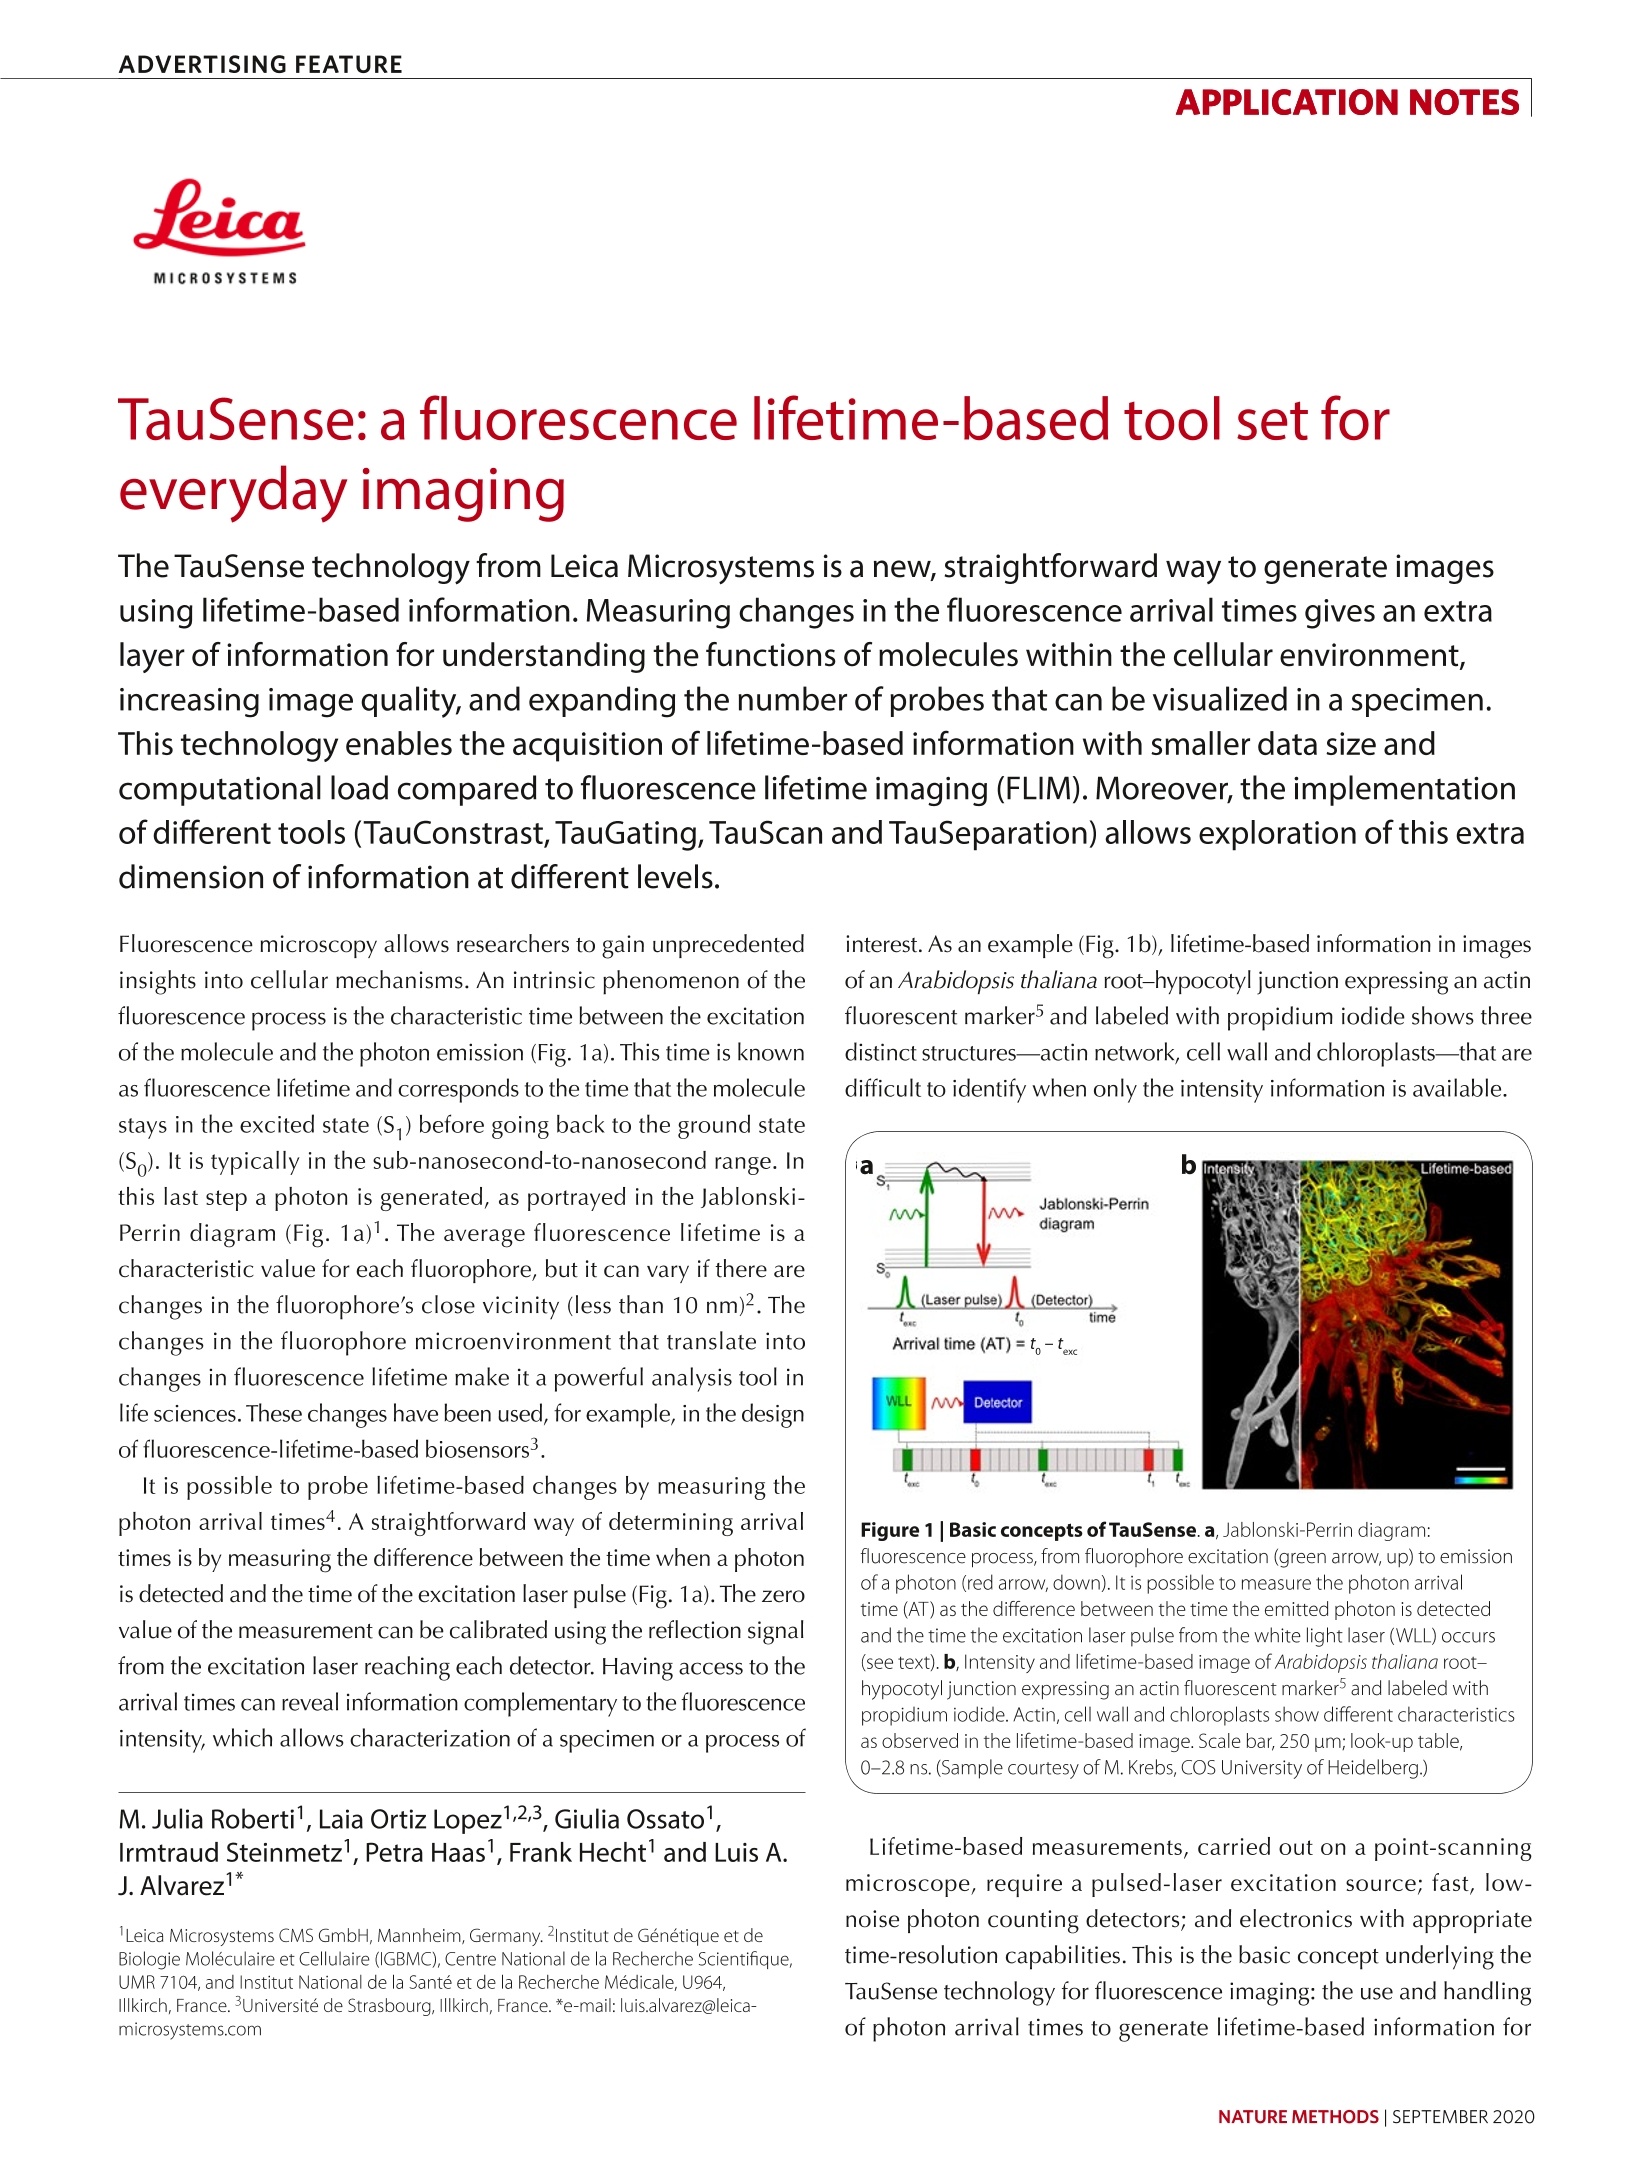
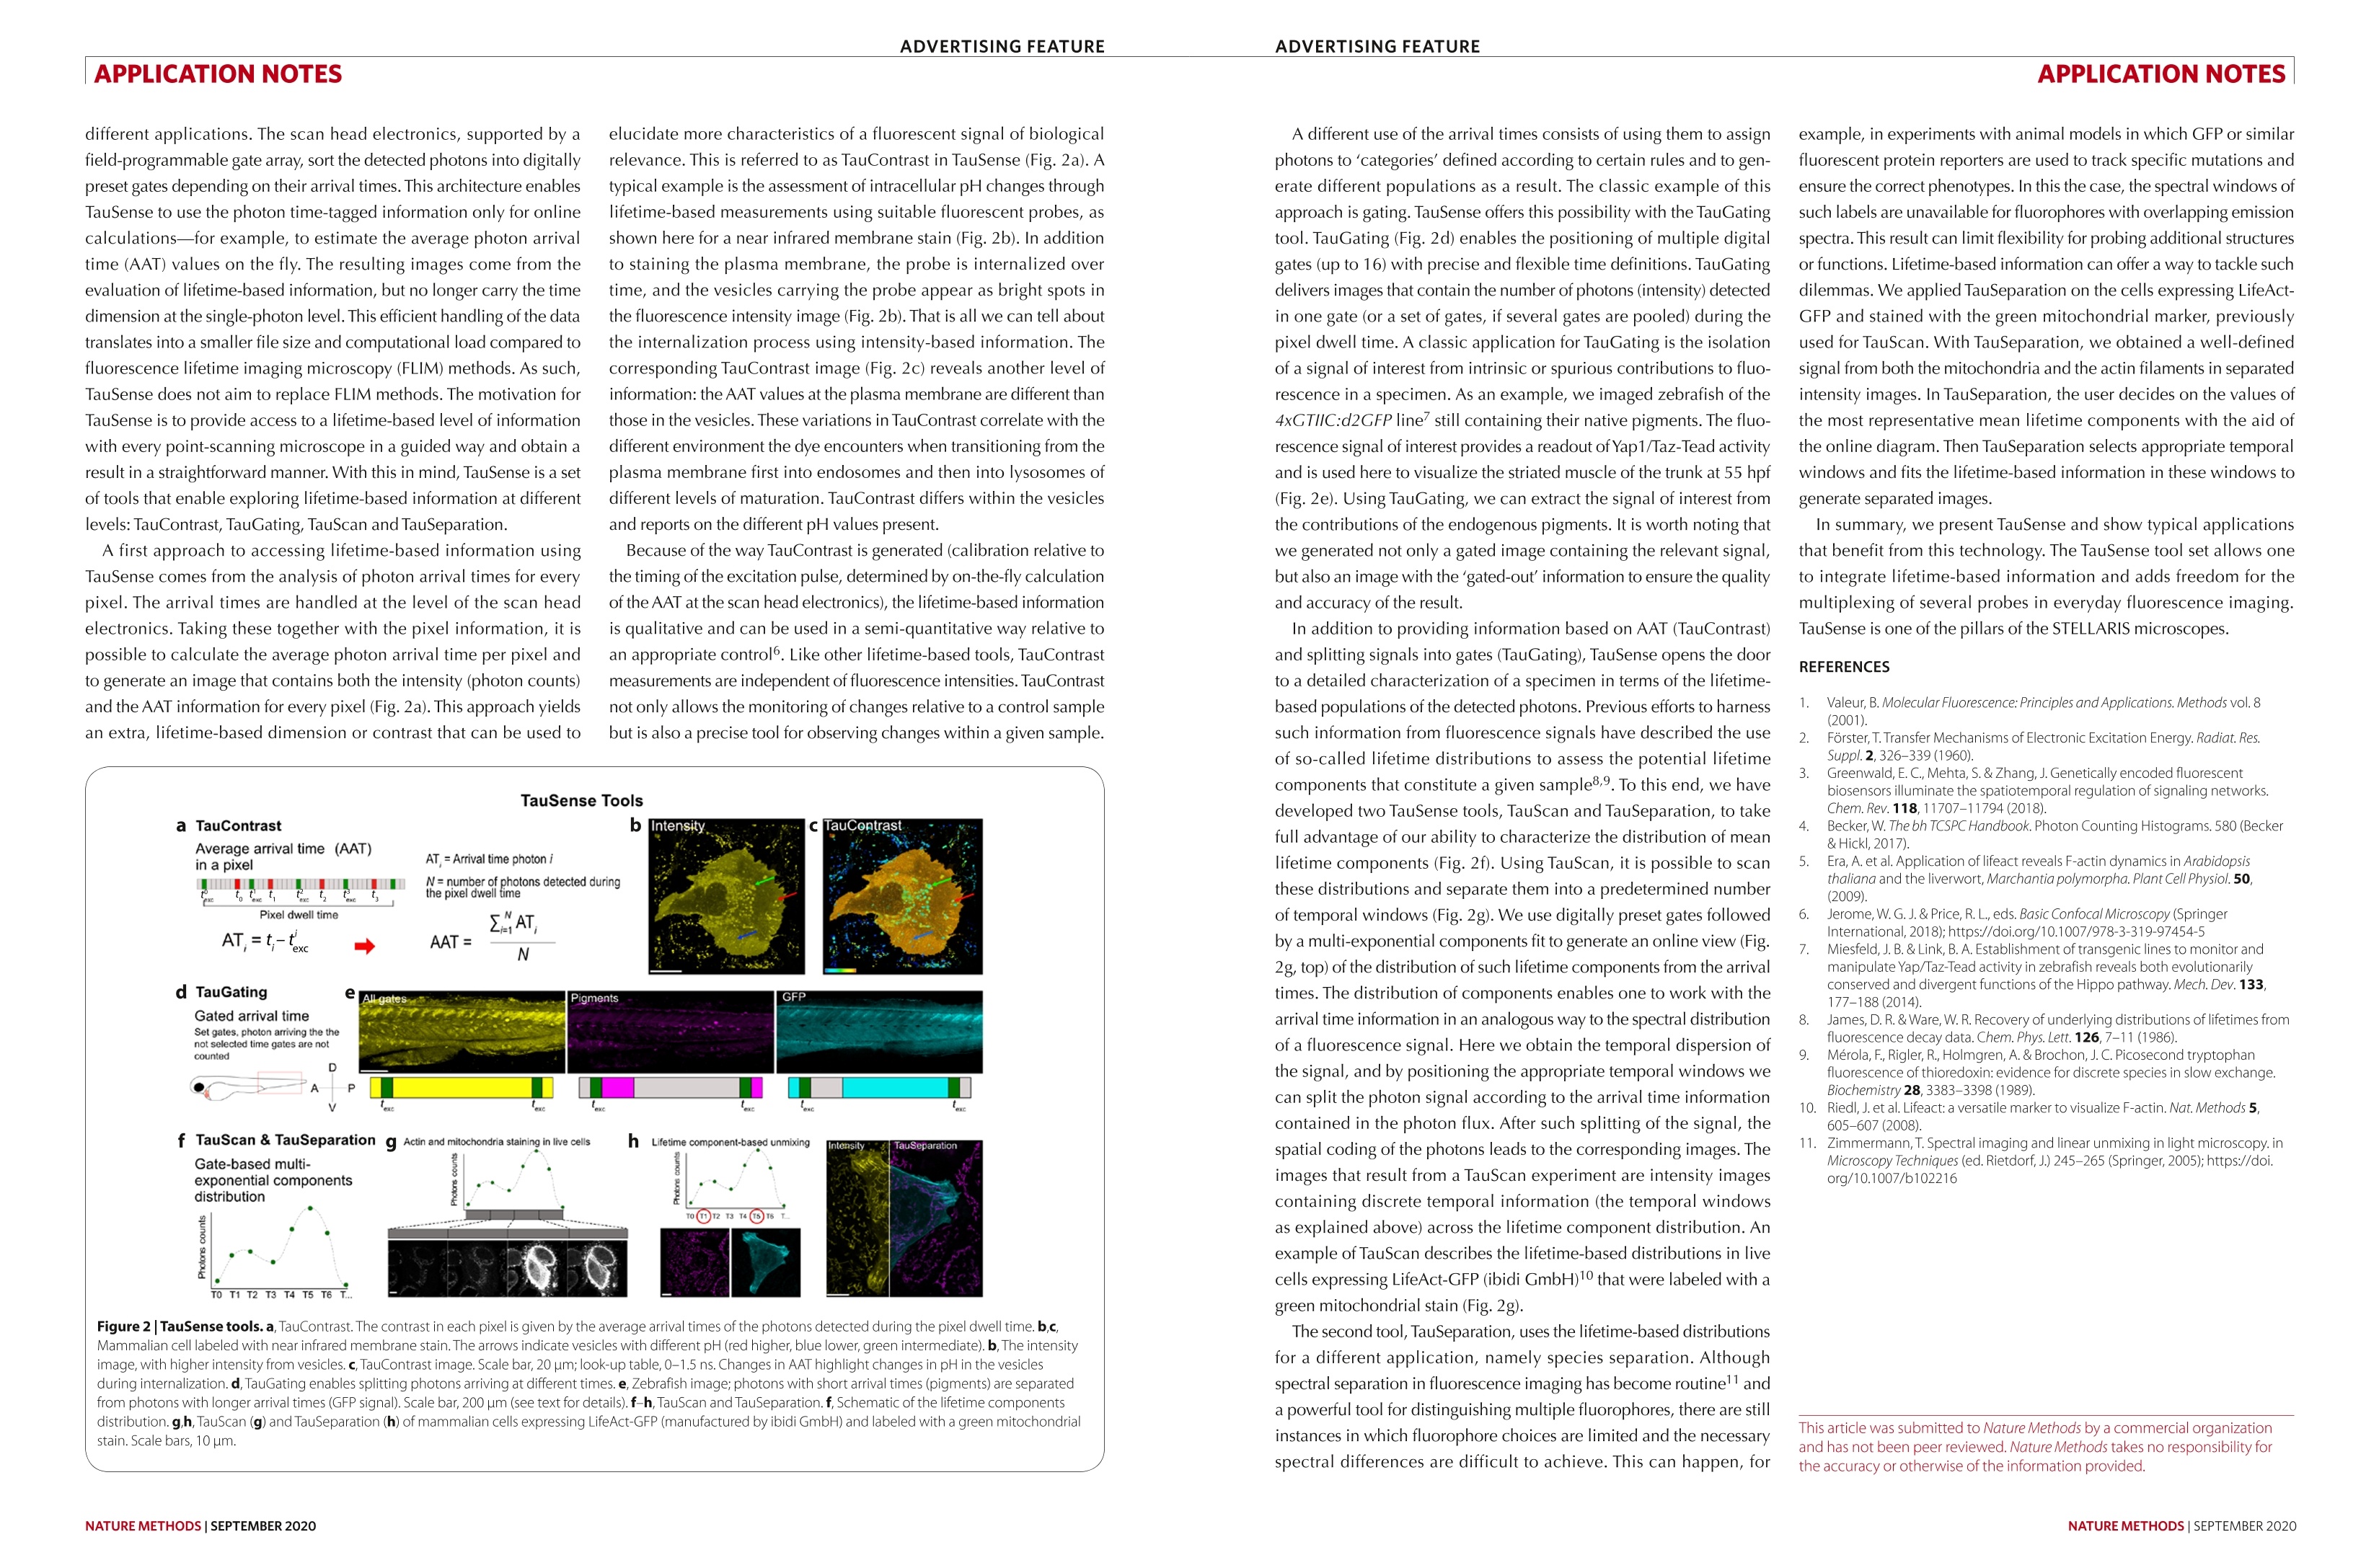
ADVERTISING FEATUREAPPLICATION NOTES TauSense: a fluorescence lifetime-based tool set foreveryday imaging The TauSense technology from Leica Microsystems is a new, straightforward way to generate imagesusing lifetime-based information. Measuring changes in the fluorescence arrival times gives an extralayer of information for understanding the functions of molecules within the cellular environment,increasing image quality, and expanding the number of probes that can be visualized in a specimen.This technology enables the acquisition of lifetime-based information with smaller data size andcomputational load compared to fluorescence lifetime imaging (FLIM). Moreover, the implementationof different tools (TauConstrast,TauGating,TauScan and TauSeparation) allows exploration of this extradimension of information at different levels. Fluorescence microscopy allows researchers to gain unprecedentedinsights into cellular mechanisms. An intrinsic phenomenon of thefluorescence process is the characteristic time between the excitationof the molecule and the photon emission (Fig. 1a). This time is knownas fluorescence lifetime and corresponds to the time that the moleculestays in the excited state (S) before going back to the ground state(S ). It is typically in the sub-nanosecond-to-nanosecond range. Inthis last step a photon is generated, as portrayed in the Jablonski-Perrin diagram (Fig. 1a)1. The average fluorescence lifetime is acharacteristic value for each fluorophore, but it can vary if there arechanges in the fluorophore's close vicinity (less than 10 nm)2. Thechanges in the fluorophore microenvironment that translate intochanges in fluorescence lifetime make it a powerful analysis tool inlife sciences. These changes have been used, for example, in the designof fluorescence-lifetime-based biosensors3. It is possible to probe lifetime-based changes by measuring thephoton arrival times4. A straightforward way of determining arrivaltimes is by measuring the difference between the time when a photonis detected and the time of the excitation laser pulse (Fig.1a). The zerovalue of the measurement can be calibrated using the reflection signalfrom the excitation laser reaching each detector. Having access to thearrival times can reveal information complementary to the fluorescenceintensity, which allows characterization of a specimen or a process of M. Julia Roberti1, Laia Ortiz Lopez1,2,3, Giulia Ossato1,Irmtraud Steinmetz, Petra Haas , Frank Hecht and Luis A.J.Alvarez' ( l Leica Microsystems C M S GmbH, M a nnheim, Germany. 21ns ti tut de Génetique e t de B iologie Moleculaire et Cellu l aire (IGB M C), C en tr e N a t i o n al de la Re c h e rche Sci e ntifiqu e , U MR 7 104, and Institut N a tional de la S an t e e t d e l a R echerche Medic a le, U964, I l l kirch ,Fr an c e. 3 U n i ver site de Str a sbourg, Il l k i rch, Fran ce . *e- mai l : luis . a lva r e z@ l eica- microsystems.c om ) interest. As an example (Fig. 1b), lifetime-based information in imagesof an Arabidopsis thaliana root-hypocotyl junction expressing an actinfluorescent marker and labeled with propidium iodide shows threedistinct structures-actin network, cell wall and chloroplasts-that aredifficult to identify when only the intensity information is available. Figure 1| Basic concepts of TauSense.a,Jablonski-Perrin diagram:fluorescence process, from fluorophore excitation (green arrow, up) to emissionof a photon (red arrow, down). It is possible to measure the photon arrivaltime (AT) as the difference between the time the emitted photon is detectedand the time the excitation laser pulse from the white light laser (WLL) occurs(see text). b, Intensity and lifetime-based image of Arabidopsis thaliana root-hypocotyl junction expressing an actin fluorescent marker and labeled withpropidium iodide. Actin, cell wall and chloroplasts show different characteristicsas observed in the lifetime-based image. Scale bar,250 um; look-up table,0-2.8 ns.(Sample courtesy of M. Krebs, COS University of Heidelberg.) Lifetime-based measurements, carried out on a point-scanningmicroscope, require a pulsed-laser excitation source; fast, low-noise photon counting detectors; and electronics with appropriatetime-resolution capabilities. This is the basic concept underlying theTauSense technology for fluorescence imaging: the use and handlingof photon arrival times to generate lifetime-based information for Figure 2|TauSense tools. a, TauContrast. The contrast in each pixel is given by the average arrival times of the photons detected during the pixel dwell time.b,c,Mammalian cell labeled with near infrared membrane stain. Thearrows indicate vesicles with different pH (red higher, blue lower, green intermediate). b,The intensityimage, with higher intensity from vesicles. c,TauContrast image. Scale bar, 20 um;look-up table, 0-1.5 ns. Changes in AAT highlight changes in pH in the vesiclesduring internalization. d,TauGating enables splitting photons arriving at different times.e, Zebrafish image;photons with short arrival times (pigments) are separatedfrom photons with longer arrival times (GFP signal). Scale bar, 200 um (see text for details). f-h,TauScan and TauSeparation. f, Schematic of the lifetime componentsdistribution.g.h,TauScan(g) and TauSeparation (h) of mammalian cells expressing LifeAct-GFP(manufactured by ibidi GmbH) and labeled with a green mitochondrialstain. Scale bars, 10 pm. A different use of the arrival times consists of using them to assignphotons to 'categories' defined according to certain rules and to gen-erate different populations as a result. The classic example of thisapproach is gating. TauSense offers this possibility with the TauGatingtool. TauGating (Fig.2d) enables the positioning of multiple digitalgates (up to 16) with precise and flexible time definitions. TauGatingdelivers images that contain the number of photons (intensity) detectedin one gate (or a set of gates, if several gates are pooled) during thepixel dwell time. A classic application for TauGating is the isolationof a signal of interest from intrinsic or spurious contributions to fluo-rescence in a specimen. As an example, we imaged zebrafish of the4xGTIIC:d2GFP line’ still containing their native pigments. The fluo-rescence signal of interest provides a readout of Yap1/Taz-Tead activityand is used here to visualize the striated muscle of the trunk at 55 hpf(Fig.2e). Using TauGating, we can extract the signal of interest fromthe contributions of the endogenous pigments. It is worth noting thatwe generated not only a gated image containing the relevant signal,but also an image with the'gated-outinformation to ensure the qualityand accuracy of the result. In addition to providing information based on AAT (TauContrast)and splitting signals into gates (TauGating), TauSense opens the doorto a detailed characterization of a specimen in terms of the lifetime-based populations of the detected photons. Previous efforts to harnesssuch information from fluorescence signals have described the useof so-called lifetime distributions to assess the potential lifetimecomponents that constitute a given sample8,9. To this end, we havedeveloped two TauSense tools, TauScan and TauSeparation, to takefull advantage of our ability to characterize the distribution of meanlifetime components (Fig. 2f). Using TauScan, it is possible to scanthese distributions and separate them into a predetermined numberof temporal windows (Fig. 2g). We use digitally preset gates followedby a multi-exponential components fit to generate an online view (Fig.2g, top) of the distribution of such lifetime components from the arrivaltimes. The distribution of components enables one to work with thearrival time information in an analogous way to the spectral distributionof a fluorescence signal. Here we obtain the temporal dispersion ofthe signal, and by positioning the appropriate temporal windows wecan split the photon signal according to the arrival time informationcontained in the photon flux. After such splitting of the signal, thespatial coding of the photons leads to the corresponding images. Theimages that result from a TauScan experiment are intensity imagescontaining discrete temporal information (the temporal windowsas explained above) across the lifetime component distribution. Anexample of TauScan describes the lifetime-based distributions in livecells expressing LifeAct-GFP (ibidi GmbH)10 that were labeled with agreen mitochondrial stain (Fig.2g). The second tool, TauSeparation, uses the lifetime-based distributionsfor a different application, namely species separation. Althoughspectral separation in fluorescence imaging has become routinell anda powerful tool for distinguishing multiple fluorophores, there are stillinstances in which fluorophore choices are limited and the necessaryspectral differences are difficult to achieve. This can happen, for example, in experiments with animal models in which GFP or similafluorescent protein reporters are used to track specific mutations andensure the correct phenotypes. In this the case, the spectral windows ofsuch labels are unavailable for fluorophores with overlapping emissionspectra. This result can limit flexibility for probing additional structuresor functions. Lifetime-based information can offer a way to tackle suchdilemmas. We applied TauSeparation on the cells expressing LifeAct-GFP and stained with the green mitochondrial marker, previouslyused for TauScan. With TauSeparation, we obtained a well-definedsignal from both the mitochondria and the actin filaments in separatedintensity images. In TauSeparation, the user decides on the values ofthe most representative mean lifetime components with the aid ofthe online diagram. Then TauSeparation selects appropriate temporalwindows and fits the lifetime-based information in these windows togenerate separated images. In summary, we present TauSense and show typical applicationsthat benefit from this technology. The TauSense tool set allows oneto integrate lifetime-based information and adds freedom for themultiplexing of several probes in everyday fluorescence imagingTauSense is one of the pillars of the STELLARIS microscopes. REFERENCES ( 1 V al eu r, B. Mole c u la r Fl uoresc en ce : P r i n c ip l e s and App licat io ns . Met ho d s v ol. 8 ) ( (2 0 01). 2 F o r s ter, T . T rans f er Me ch an i sm s o f E l ec tr on i c Ex c i t ation En e r g y. R adiat . R es Suppl.2,326- 3 39 (19 60 ) . 3 ) ( G r eenwald,E . C . , M eh ta,S .& Z h ang ,J.Ge n e ti cal ly e nc o d ed f lu ore sc ent bi o se n sors ill um i n a t e t he s pati o tem p o r al re q ula ti on o f signaling n e tw o rks Ch em.R e v . 1 1 8, 1 1 707-1179 4(201 8 ). ) 45 ( Beck e r , W. T he b h T C SP C Ha nd book. Pho to n Coun ting Hi s togra m s . 580 (B ec ker & Hi c k l, 2 0 17) ) ( Era, A. e t a l. Ap p lic a tio n o f li fe act r e ve a l s F -ac t i n d y n amics in A r a bi dopsis thali a n a a nd t h e l iv er wo rt , Ma rch a n tia po ly m orph a . P lan t C e l l Phy s i o l. 5 0, ( 20 09 ) . ) ( 6 J e ro m e, W. G . J . & P r i ce ,R. L . , ed s . B a s ic C on f ocal Mi cro s copy (Springe r I n ter n ati o nal , 2018);https: / /d oi . o r g / 1 0. 10 0 7 /978 - 3 - 31 9- 97 45 4 - 5 7 ) ( M ies feld, J . B. & Link, B . A . E st a bl ish me nt of t r ansge nic l i n es to mon i tor a n d m a n ip u l a t e Y ap/ Ta z - T e a d activi t y in zebr a fi sh re ve als both e volu t iona r ilycons er v ed a n d d iver ge nt fu ncti on s o f the Hi ppo p ath w a y. M ech . Dev. 133 177-188( 2 01 4 ). ) ( 8 J am e s, D. R . & War e, W . R . R e cove ry of un d erly in g d i stri bu t i o ns of l i f e t im es from Jar f luo r esce nc e dec ay da t a . Che m . P hy s. Le t t . 126,7-11 ( 1986) . ) Merola, F. Rigler, R., Holmgren,A. & Brochon,J. C. Picosecond tryptophan ( f luo r esce nc e o f t hiored o xin: ev ide nce f o r d iscrete s pecies in slow exch an g e Bioc h em is tr y 28 , 3383 -33 98 ( 19 8 9 ) . ) ( R R iedl , J . e t al . L ifea c t : a v e rsa ti le marke r to vi su a li ze F-a ct in . Na t . M e t hods 5 6 605- 6 0 7 ( 2 0 0 8) . Z ) ( Zimmer m a n n, T. Sp e c tral i maging and li ne ar u n m ix in g in ligh t m icroscop y. in Mi cro s c o p y T e ch n iq u es ( ed.Ri e tdorf, J.) 2 45 - 2 6 5 ( Sp ringe r , 2 005 ); h t tps : / / d o i .orq /1 0 . 1 00 7/b102216 ) ( Th i s ar ti c l e w a s s u bmi tt e d t o N a t u r e M e t h od s b y a c o mme r c i al o r g ani z a t i o n an d h as no t b een pee r re vi e w e d . Nat u r e M e t h o d s t a ke s n o r e s p o n sib il i ty f or t l t he a c c u r a cy o r o t h e rw ise o f t he i n form a ti o n pr ovi d e d d . ) NATURE METHODS|SEPTEMBER
确定
还剩1页未读,是否继续阅读?

产品配置单
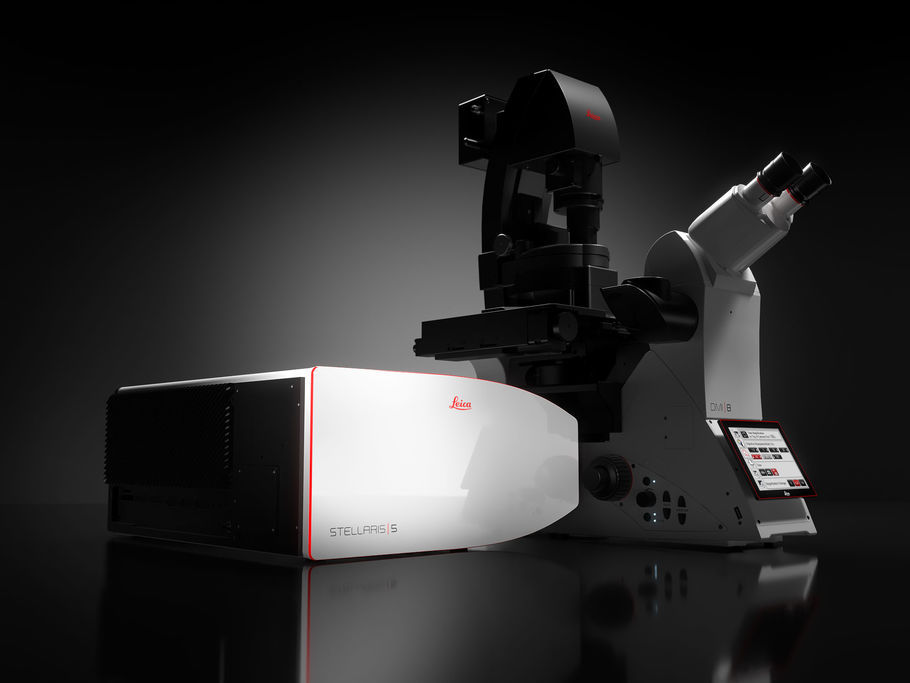
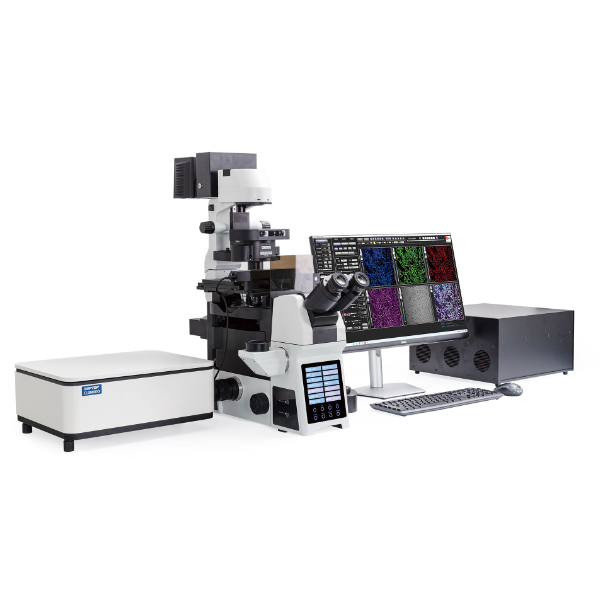
徕卡显微系统(上海)贸易有限公司为您提供《活细胞中有丝分裂检测方案(共聚焦显微镜)》,该方案主要用于其他中有丝分裂检测,参考标准--,《活细胞中有丝分裂检测方案(共聚焦显微镜)》用到的仪器有德国徕卡 数字光片显微镜 STELLARIS DLS、德国徕卡 共聚焦显微镜 STELLARIS 5
推荐专场
相关方案
更多