方案详情
文
Description of the application:
The production step is the mixing of the powder with some substances. Then passing it through the grinding process and finally pump it into a storage tank. The location of inline viscometer is suitable placed at the storage tank on the pipe which can continuous monitor the viscosity whether in the range of the specification although consists of many different new batch for every day
方案详情

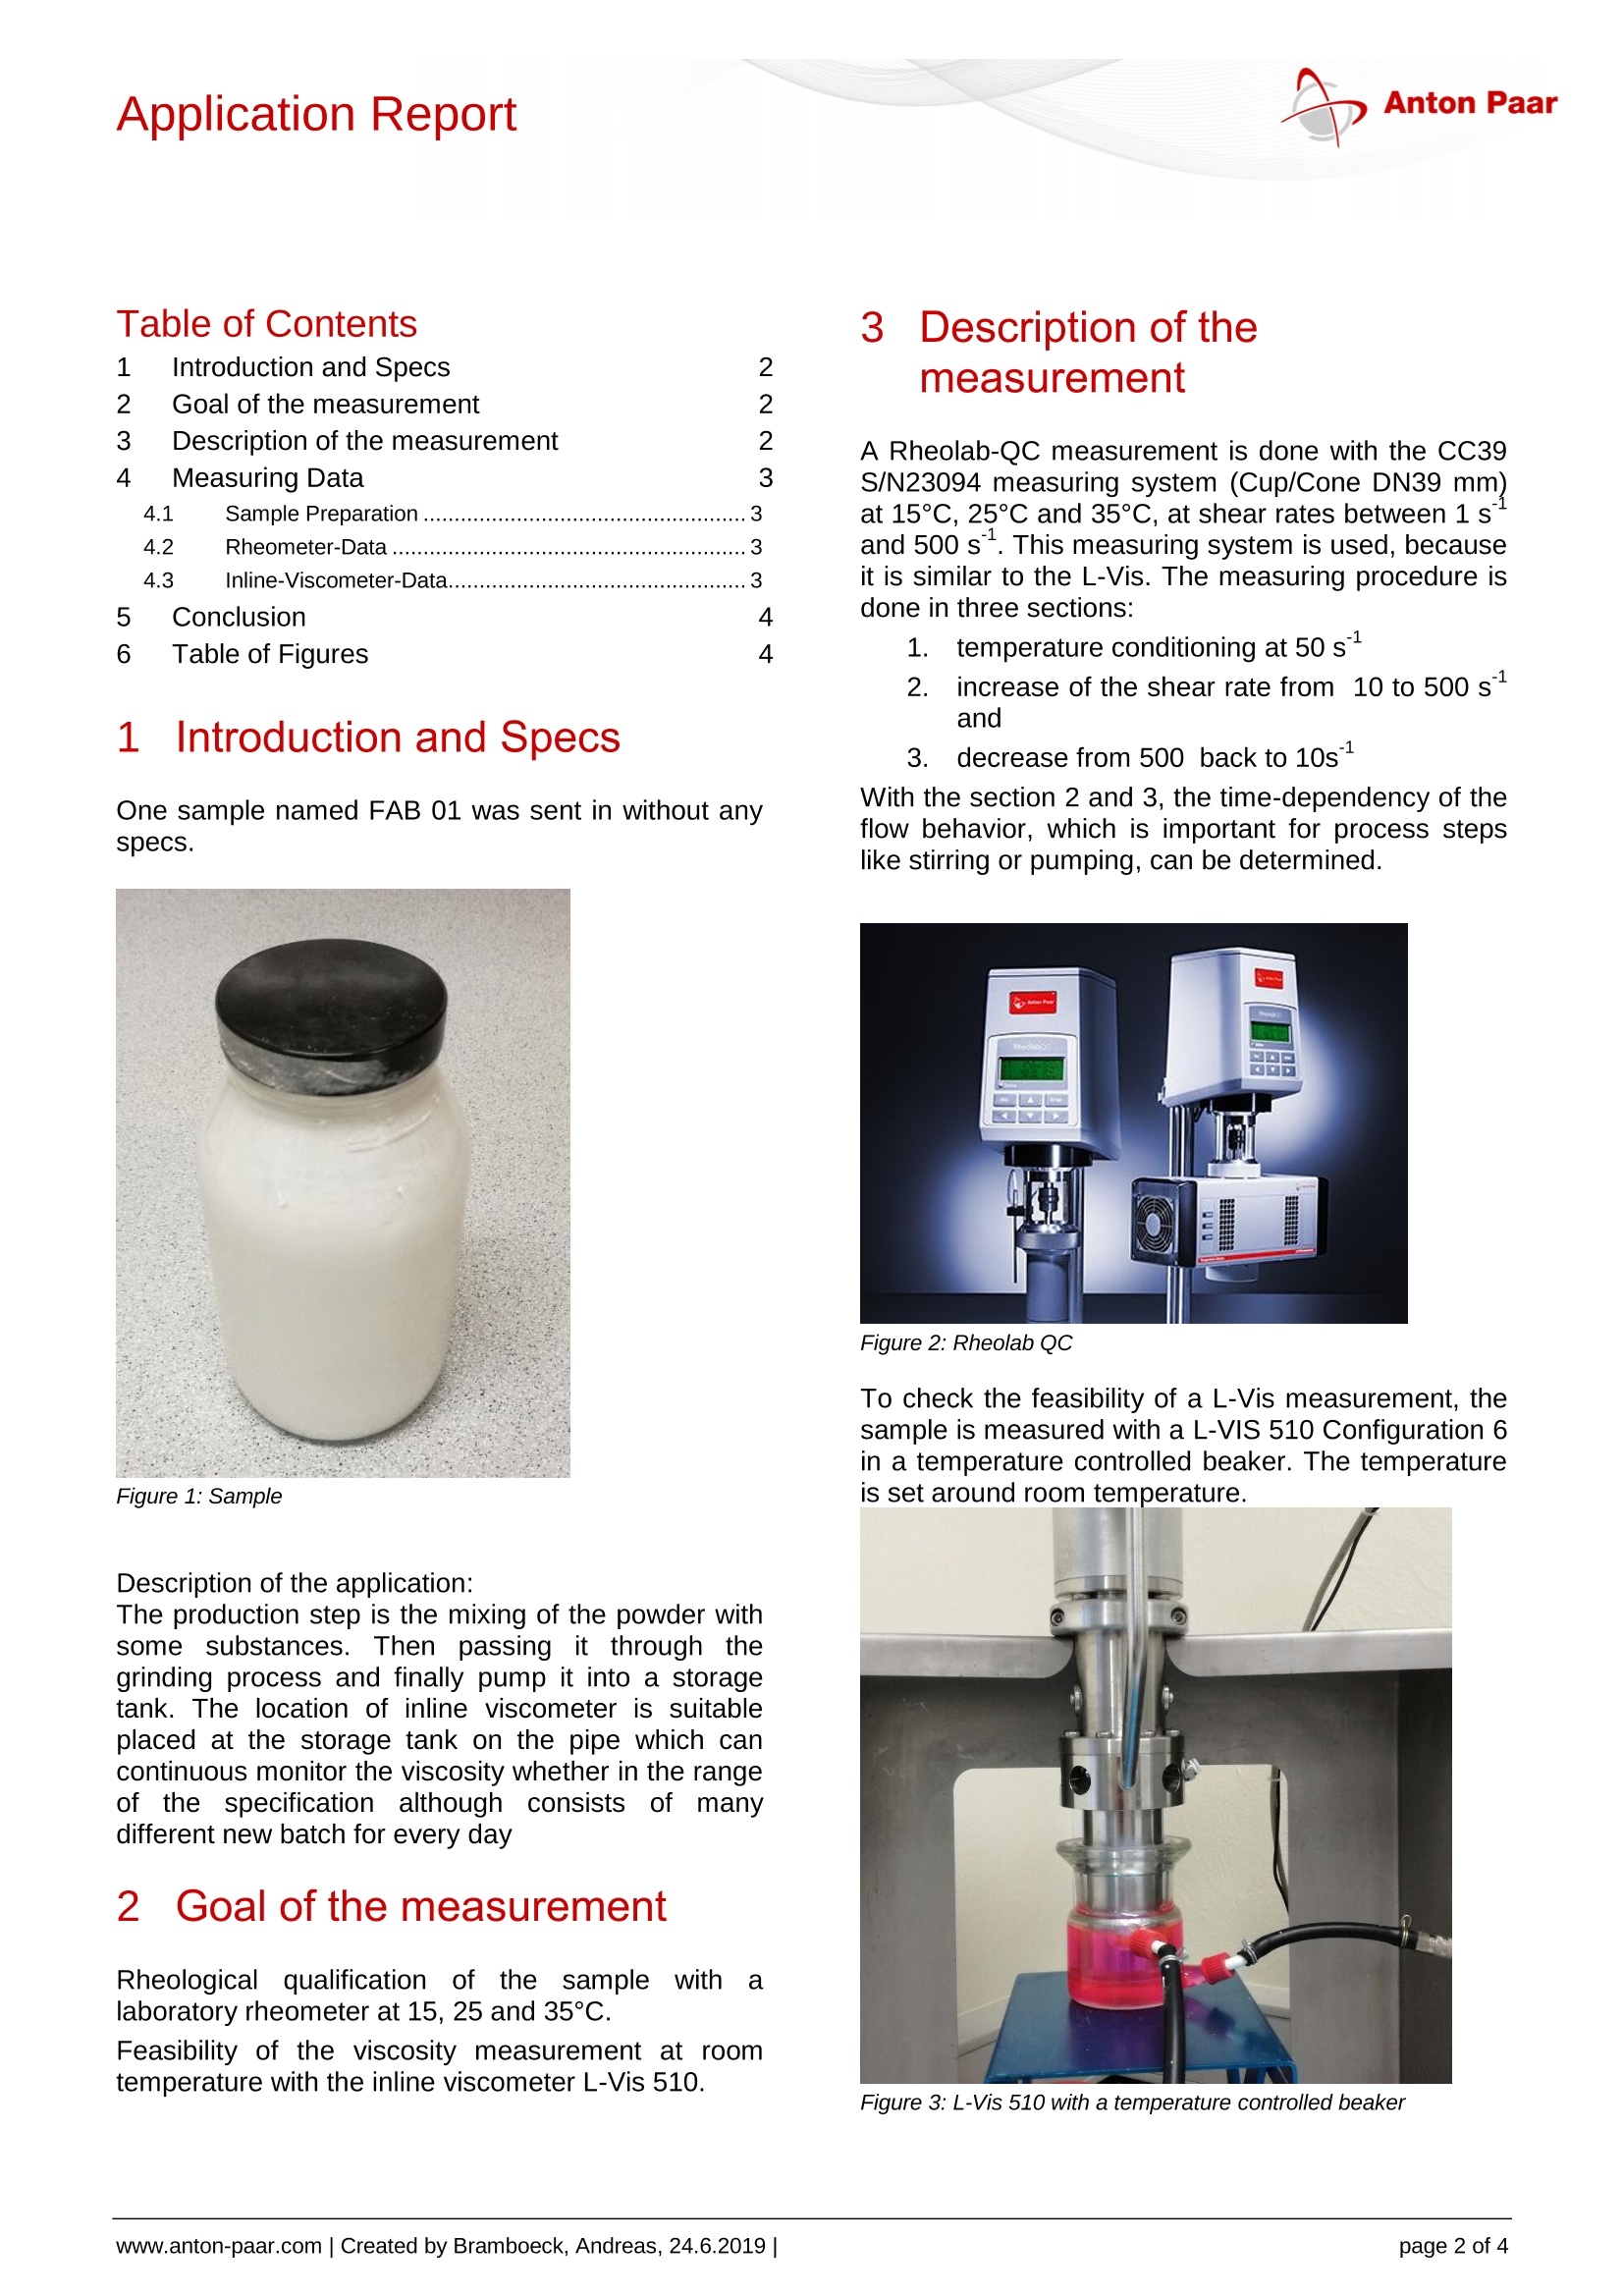
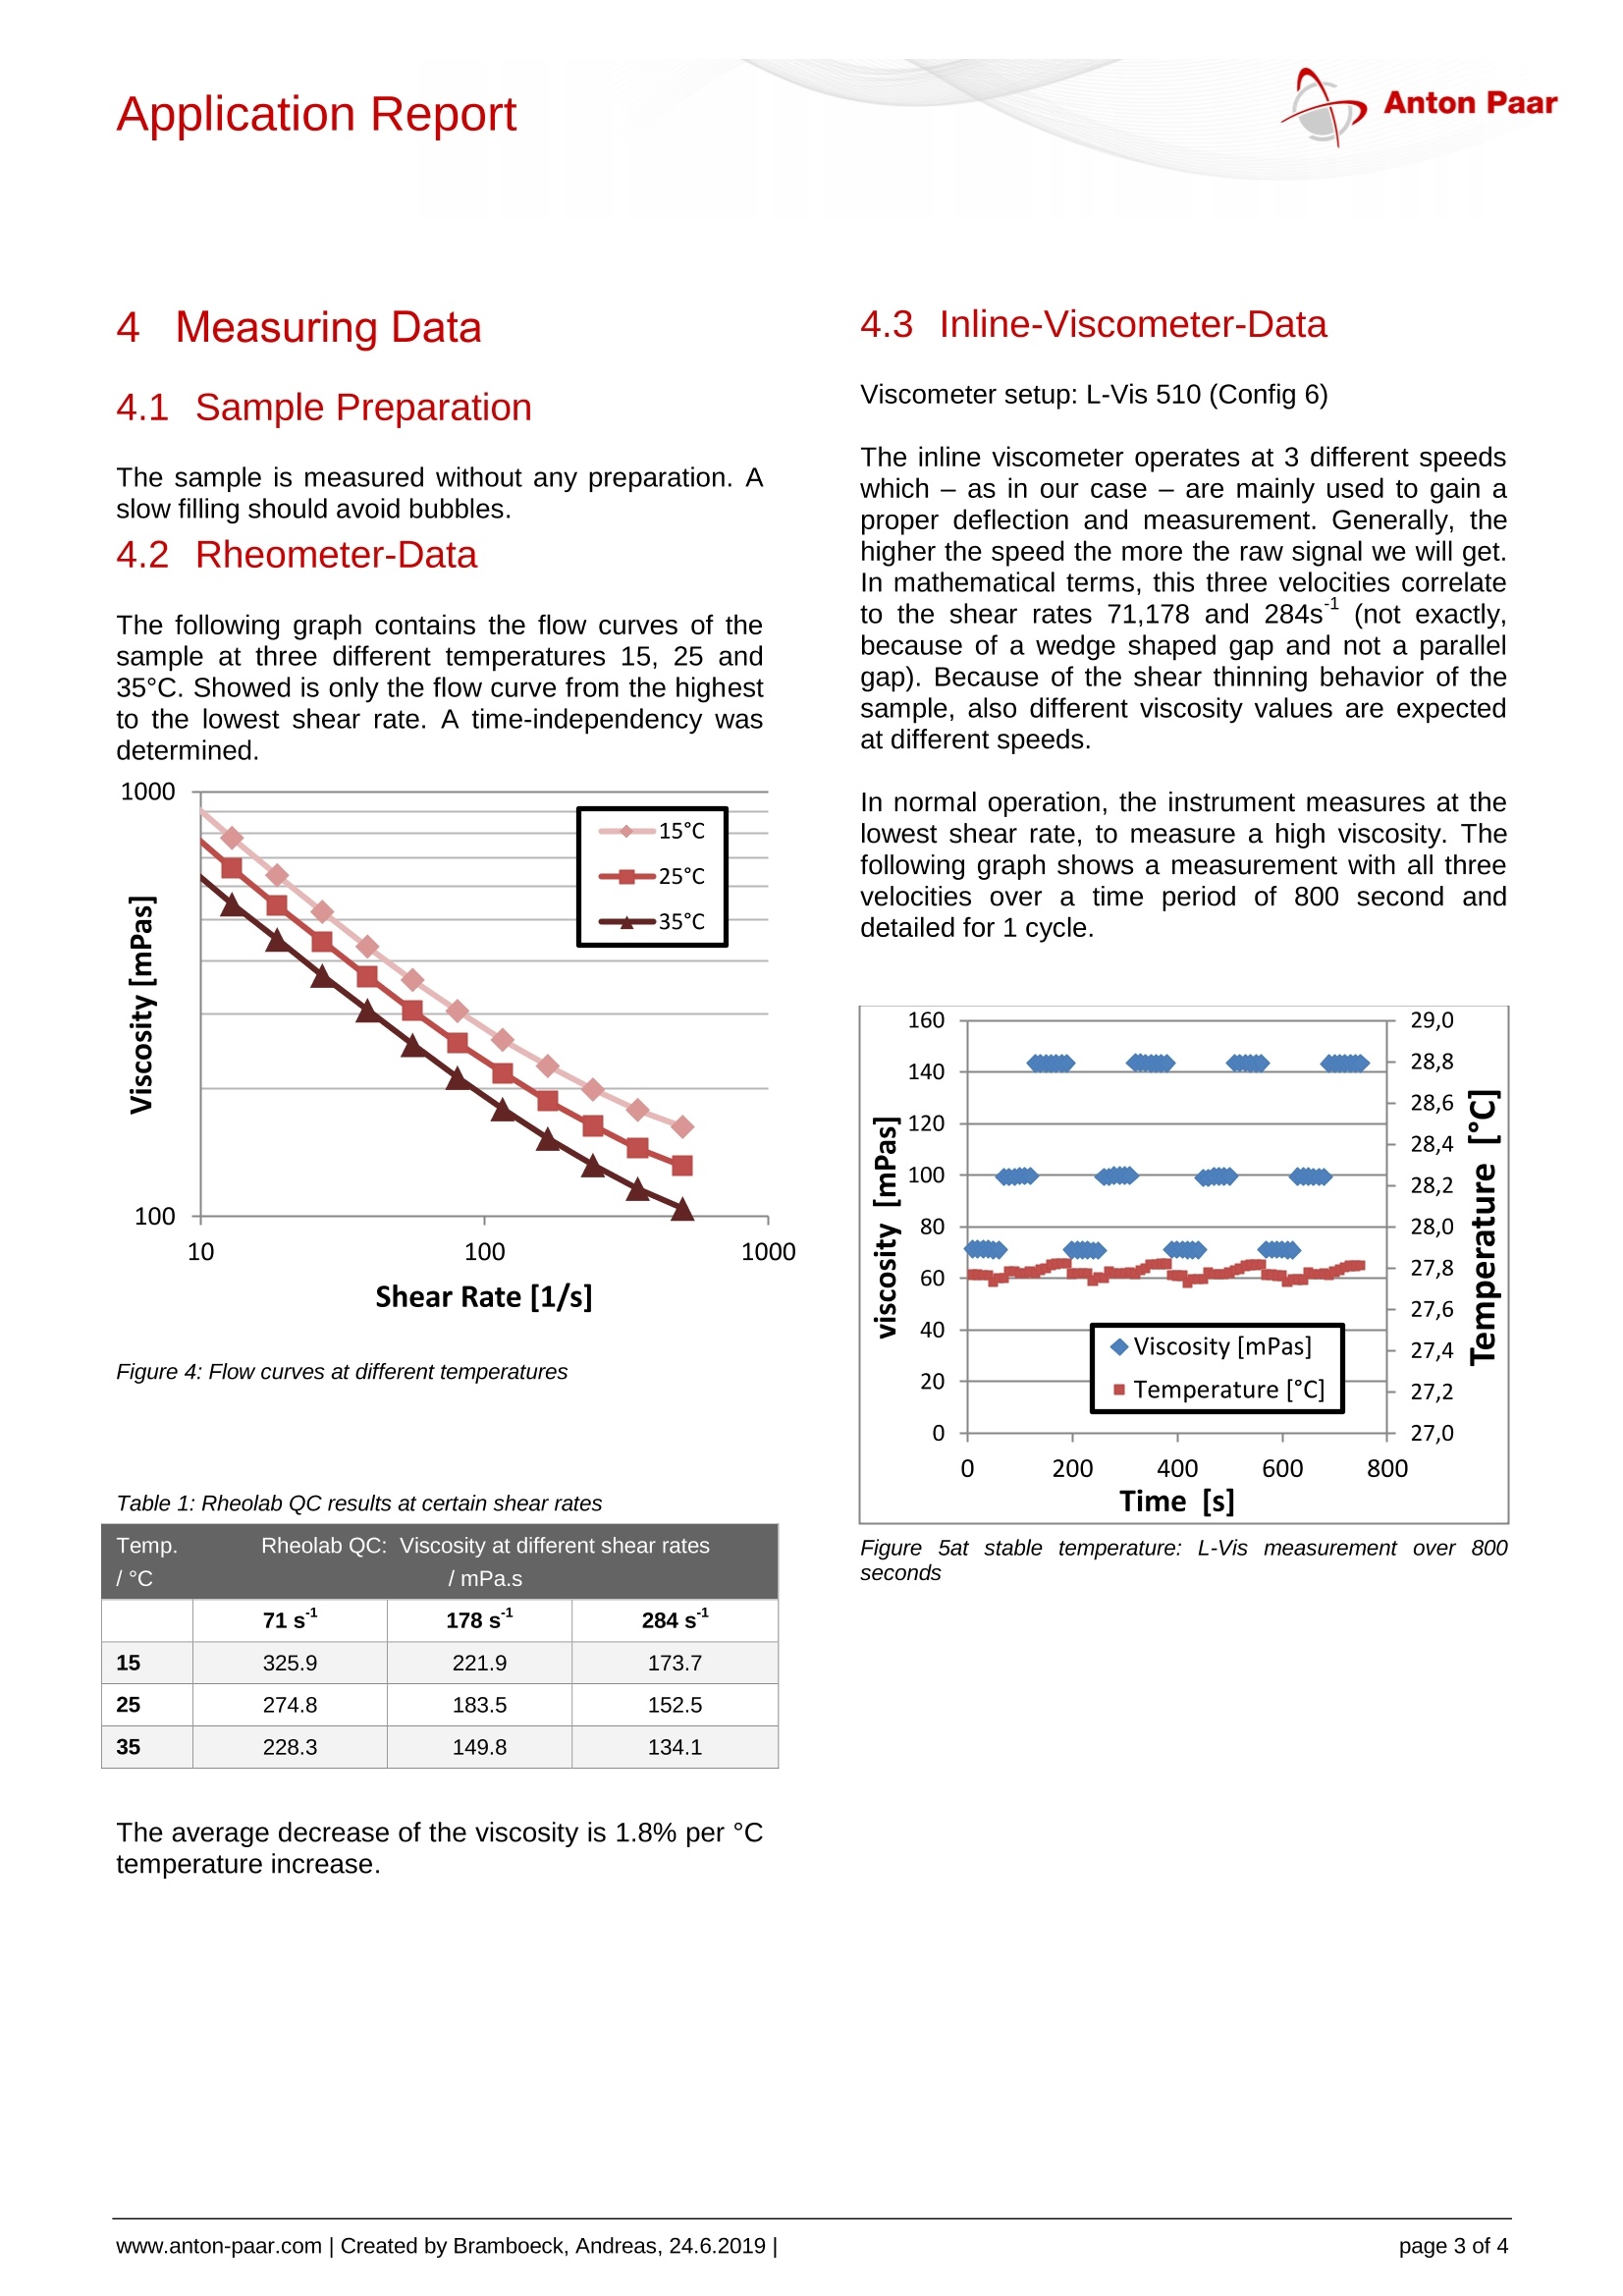
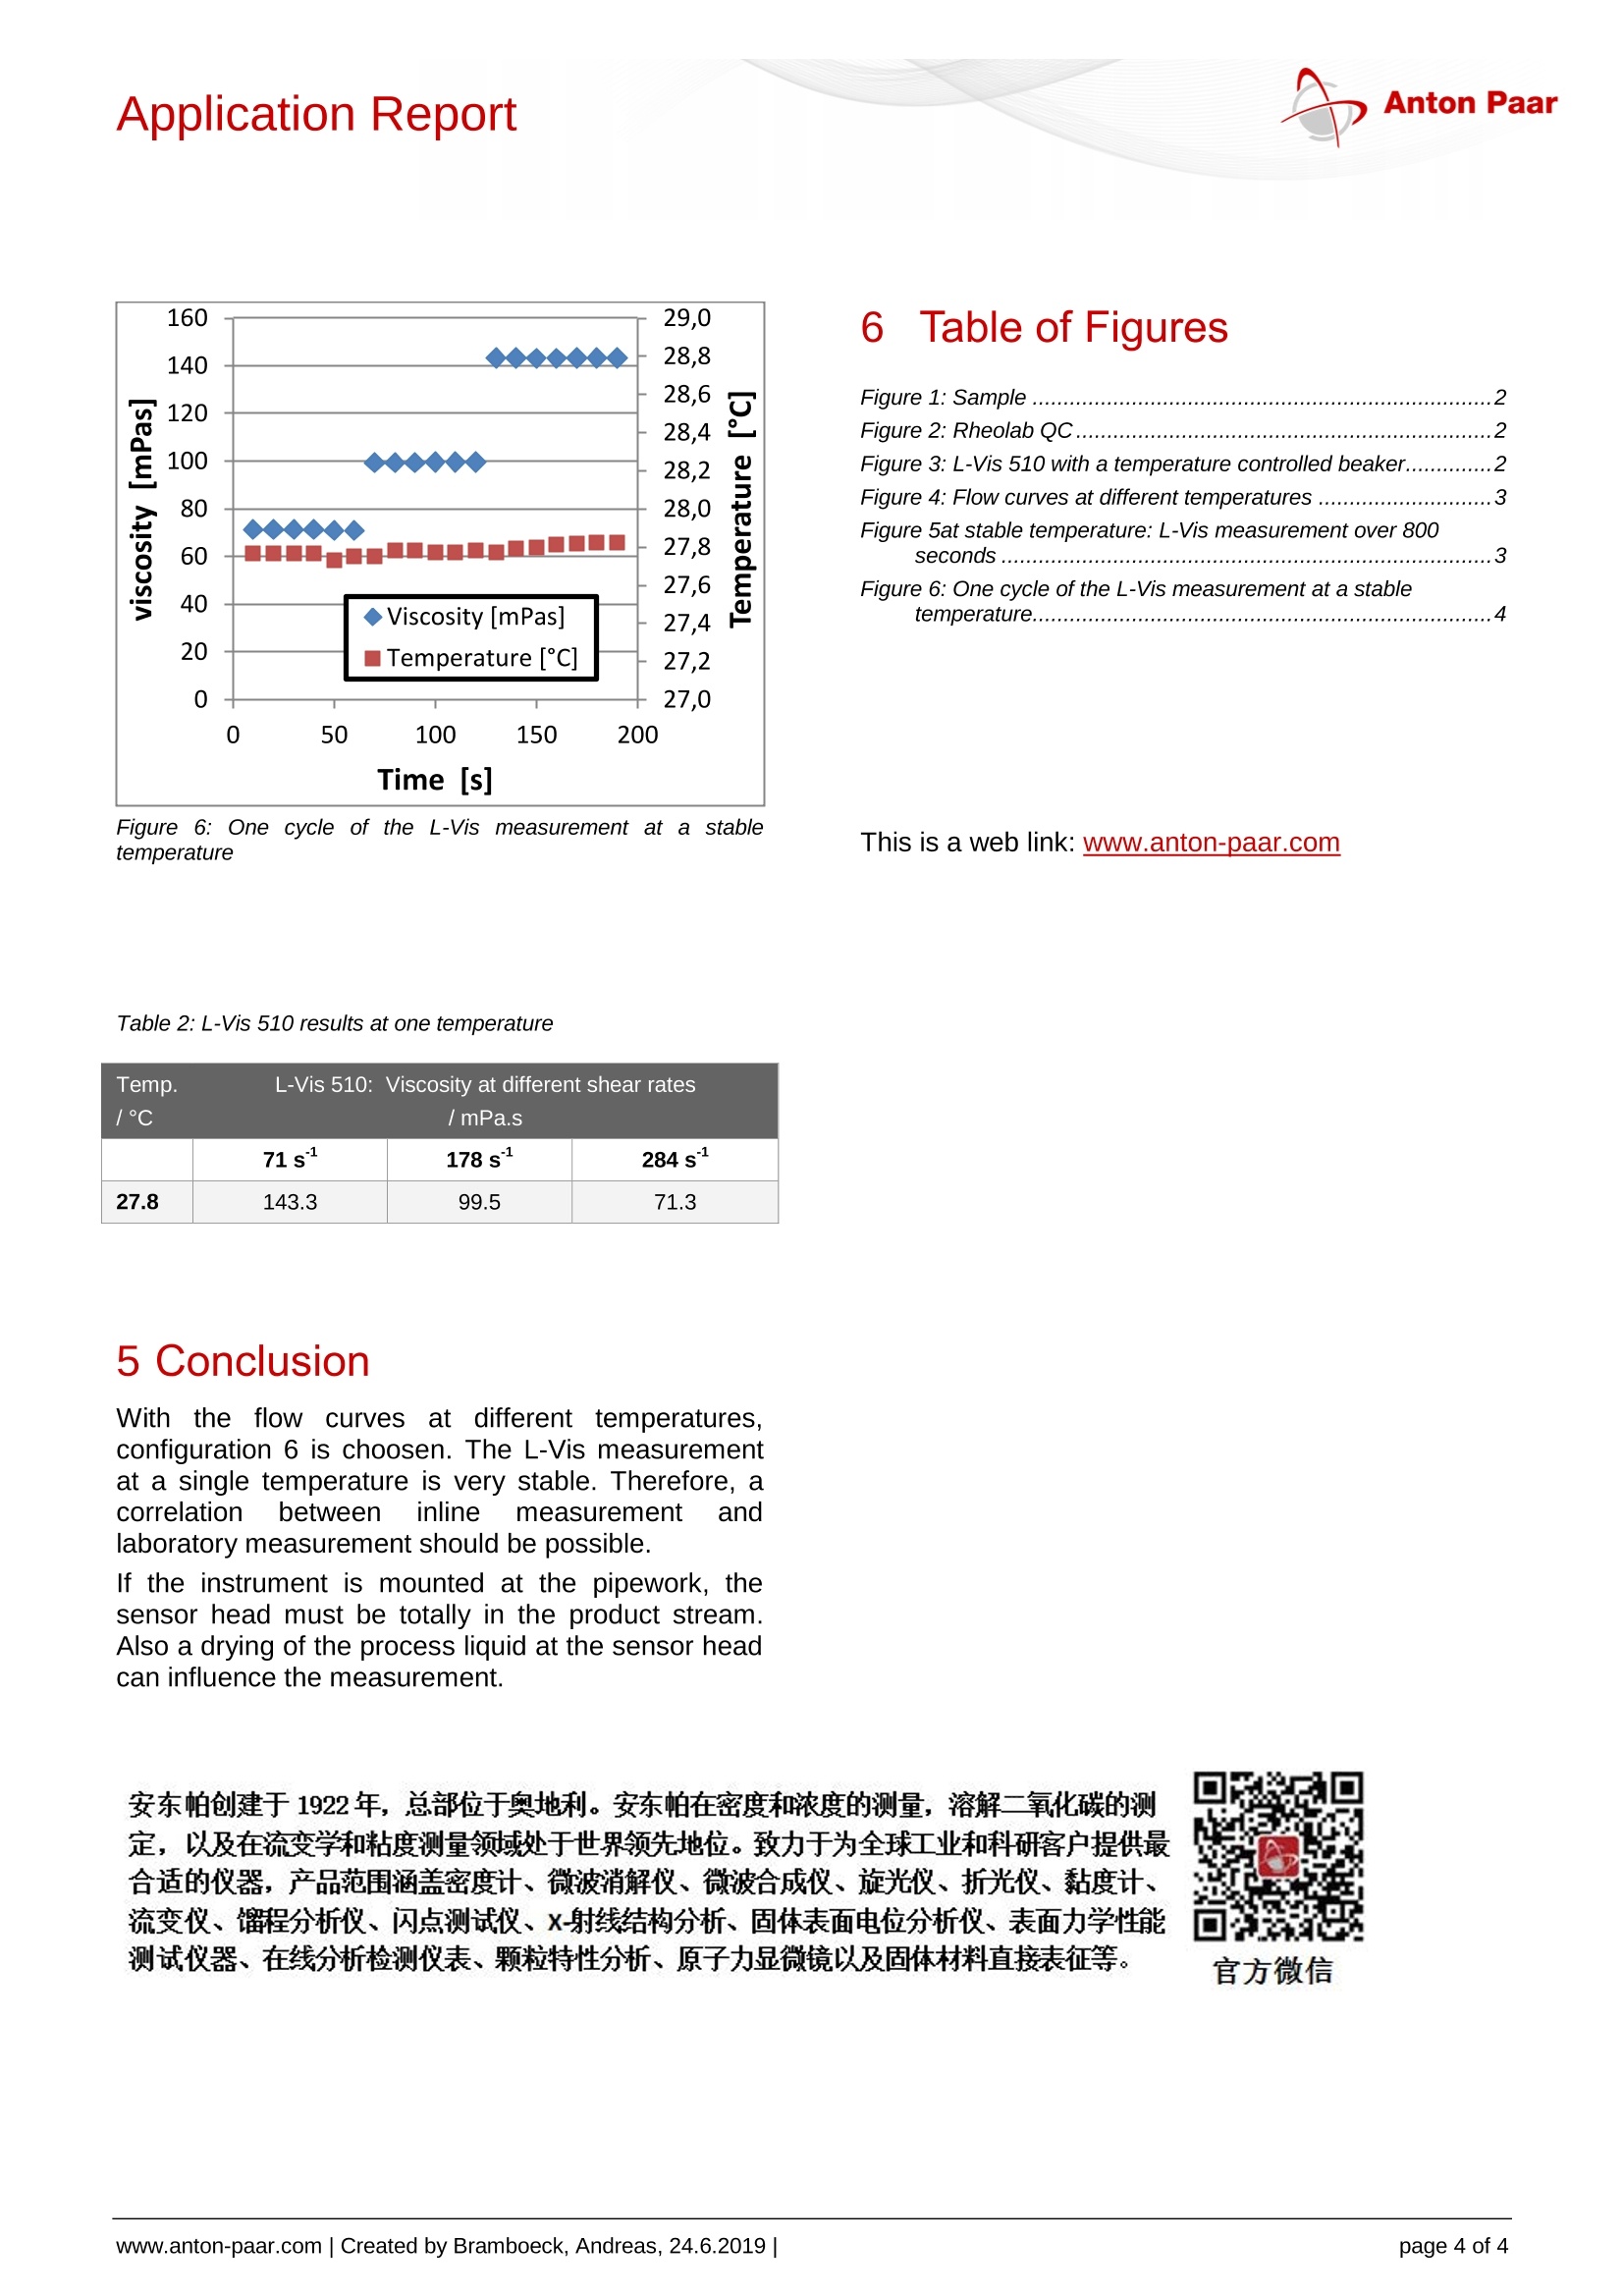
Anton PaarApplication Report Anton Paar Application Report Datum und Messplatz: 28.01.2019Anton Paar Graz Company Data: Sales Contact: Application: Chemical Filler at 15, 25 und 35°C Tests carried out by: Andreas BrambockAnton Paar GmbH Anton-Paar-Str. 20 A-8054 Graz Fax: +43 316257 257 process@anton-paar.com http://www.anton-paar.com Table of Contents 1 lntroduction and Specs 2 2 Goal of the measurement 2 3 Description of the measurement 2 4 Measuring Data 3 4.1 Sample Preparation ........ ...3 4.2 Rheometer-Data .... imm.3 4.3 Inline-Viscometer-Data.... .3 5 Conclusion 4 6 Table of Figures 4 1 lIntroduction and Specs One sample named FAB 01 was sent in without anyspecs. Figure 1: Sample Description of the application: The production step is the mixing of the powder withsome substances. Then passing it through thegrinding process and finally pump it into a storagetank. The location of inline viscometer is suitableplaced at the storage tank on the pipe which cancontinuous monitor the viscosity whether in the rangeoftthe specification althoughconsistsof manydifferent new batch for every day 2) Goal of the measurement Rheological qualificatiotion ofthe samplee withlaboratory rheometer at 15, 25 and 35℃.Feasibility of the viscosity measurement at roomtemperature with the inline viscometer L-Vis 510. 3Description of themeasurement A Rheolab-QC measurement is done with the CC39S/N23094 measuring system (Cup/Cone DN39 mm)at 15°℃,25°℃ and 35°C, at shear rates between 1sand 500 s. This measuring system is used, becauseit is similar to the L-Vis. The measuring procedure isdone in three sections: 1. temperature conditioning at 50 s’ 2. increase of the shear rate from 10 to 500 sand 3. decrease from 500 back to 10s" With the section 2 and 3, the time-dependency of theflow behavior, which is important for process stepslike stirring or pumping, can be determined. .Figure 2: Rheolab QC To check the feasibility of a L-Vis measurement, thesample is measured with a L-VIS 510 Configuration 6in a temperature controlled beaker. The temperatureis set around room temperature. Figure 3: L-Vis 510 with a temperature controlled beaker 4Measuring Data 4.1 Sample Preparation The sample is measured without any preparation. Aslow filling should avoid bubbles. 4.2 Rheometer-Data The following graph contains the flow curves of thesample at three different temperatures 15, 25 and35℃. Showed is only the flow curve from the highestto the lowest shear rate. A time-independency wasdetermined. 1000 Figure 4: Flow curves at different temperatures Table 1: Rheolab QC results at certain shear rates Temp./°C Rheolab QC: Viscosity at different shear rates /mPa.s 71 s 178s° 284s-1 15 325.9 221.9 173.7 25 274.8 183.5 152.5 35 228.3 149.8 134.1 The average decrease of the viscosity is 1.8% perCtemperature increase. 4.3 Inline-Viscometer-Data Viscometer setup: L-Vis 510 (Config 6) The inline viscometer operates at 3 different speedswhich - as in our case - are mainly used to gain aproper deflection and measurement. Generally, thehigher the speed the more the raw signal we will get.In mathematical terms, this three velocities correlateto the shear rates 71,178 and 284s(not exactly,because of a wedge shaped gap and not a parallelgap). Because of the shear thinning behavior of thesample, also different viscosity values are expectedat different speeds. In normal operation, the instrument measures at thelowest shear rate, to measure a high viscosity. Thefollowing graph shows a measurement with all threevelocities over a time period of 800 second anddetailed for 1 cycle. Figure 5at stable temperature: L-Vis measurement over 800seconds 6Table of Figures .Figure 1: Sample........ .2 Figure 2: Rheolab QC.. ...2 Figure 3: L-Vis 510 with a temperature controlled beaker...... 2 Figure 4: Flow curves at different temperatures ... .3 Figure 5at stable temperature: L-Vis measurement over 800seconds.... 3 Figure 6: One cycle of the L-Vis measurement at a stabletemperature.... 4 Figure 6: One cycle of the L-Vis measurement at a stabletemperature This is a web link: www.anton-paar.com Table 2: L-Vis 510 results at one temperature Temp./°C L-Vis 510: Viscosity at different shear rates /mPa.s 71s° 178s° 284s 27.8 143.3 99.5 71.3 5 Conclusion With the flow curves aat different temperatures,configuration 6 is choosen. The L-Vis measurementat a single temperature is very stable. Therefore, acorrelation. between inline measurement andlaboratory measurement should be possible. If the instrument is mounted at the pipework, thesensor head must be totally in the product stream.Also a drying of the process liquid at the sensor headcan influence the measurement. 安东帕创建于1922年,总部位于奥地利。安东帕在密度和浓度的测量,溶解二氧化碳的测定,以及在流变学和粘度测量领域处于世界领先地位。致力于为全球工业和科研客户提供最合适的仪器,产品范围涵盖密度计、微波消解仪、微波合成仪、旋光仪、折光仪、黏度计、流变仪、馏程分析仪、闪点测试仪、x-射线结构分析、固体表面电位分析仪、表面力学性能测试仪器、在线分析检测仪表、颗粒特性分析、原子力显微镜以及固体材料直接表征等。 官方微信 page of www.anton-paar.com|Created by Bramboeck, Andreas, Description of the application:The production step is the mixing of the powder with some substances. Then passing it through the grinding process and finally pump it into a storage tank. The location of inline viscometer is suitable placed at the storage tank on the pipe which can continuous monitor the viscosity whether in the range of the specification although consists of many different new batch for every day
确定
还剩2页未读,是否继续阅读?
安东帕(上海)商贸有限公司为您提供《化学品填料中黏度检测方案(在线粘度计)》,该方案主要用于其他中黏度检测,参考标准--,《化学品填料中黏度检测方案(在线粘度计)》用到的仪器有
相关方案
更多
该厂商其他方案
更多


