


方案详情
文
地质材料的libs-mapping可提供一种快速生成元素和矿物分布图的方法。可以展示一个具有铬铁矿层的岩石样品的libs-mapping和分类结果,结果与edxrf显微镜测量结果相一致。
方案详情

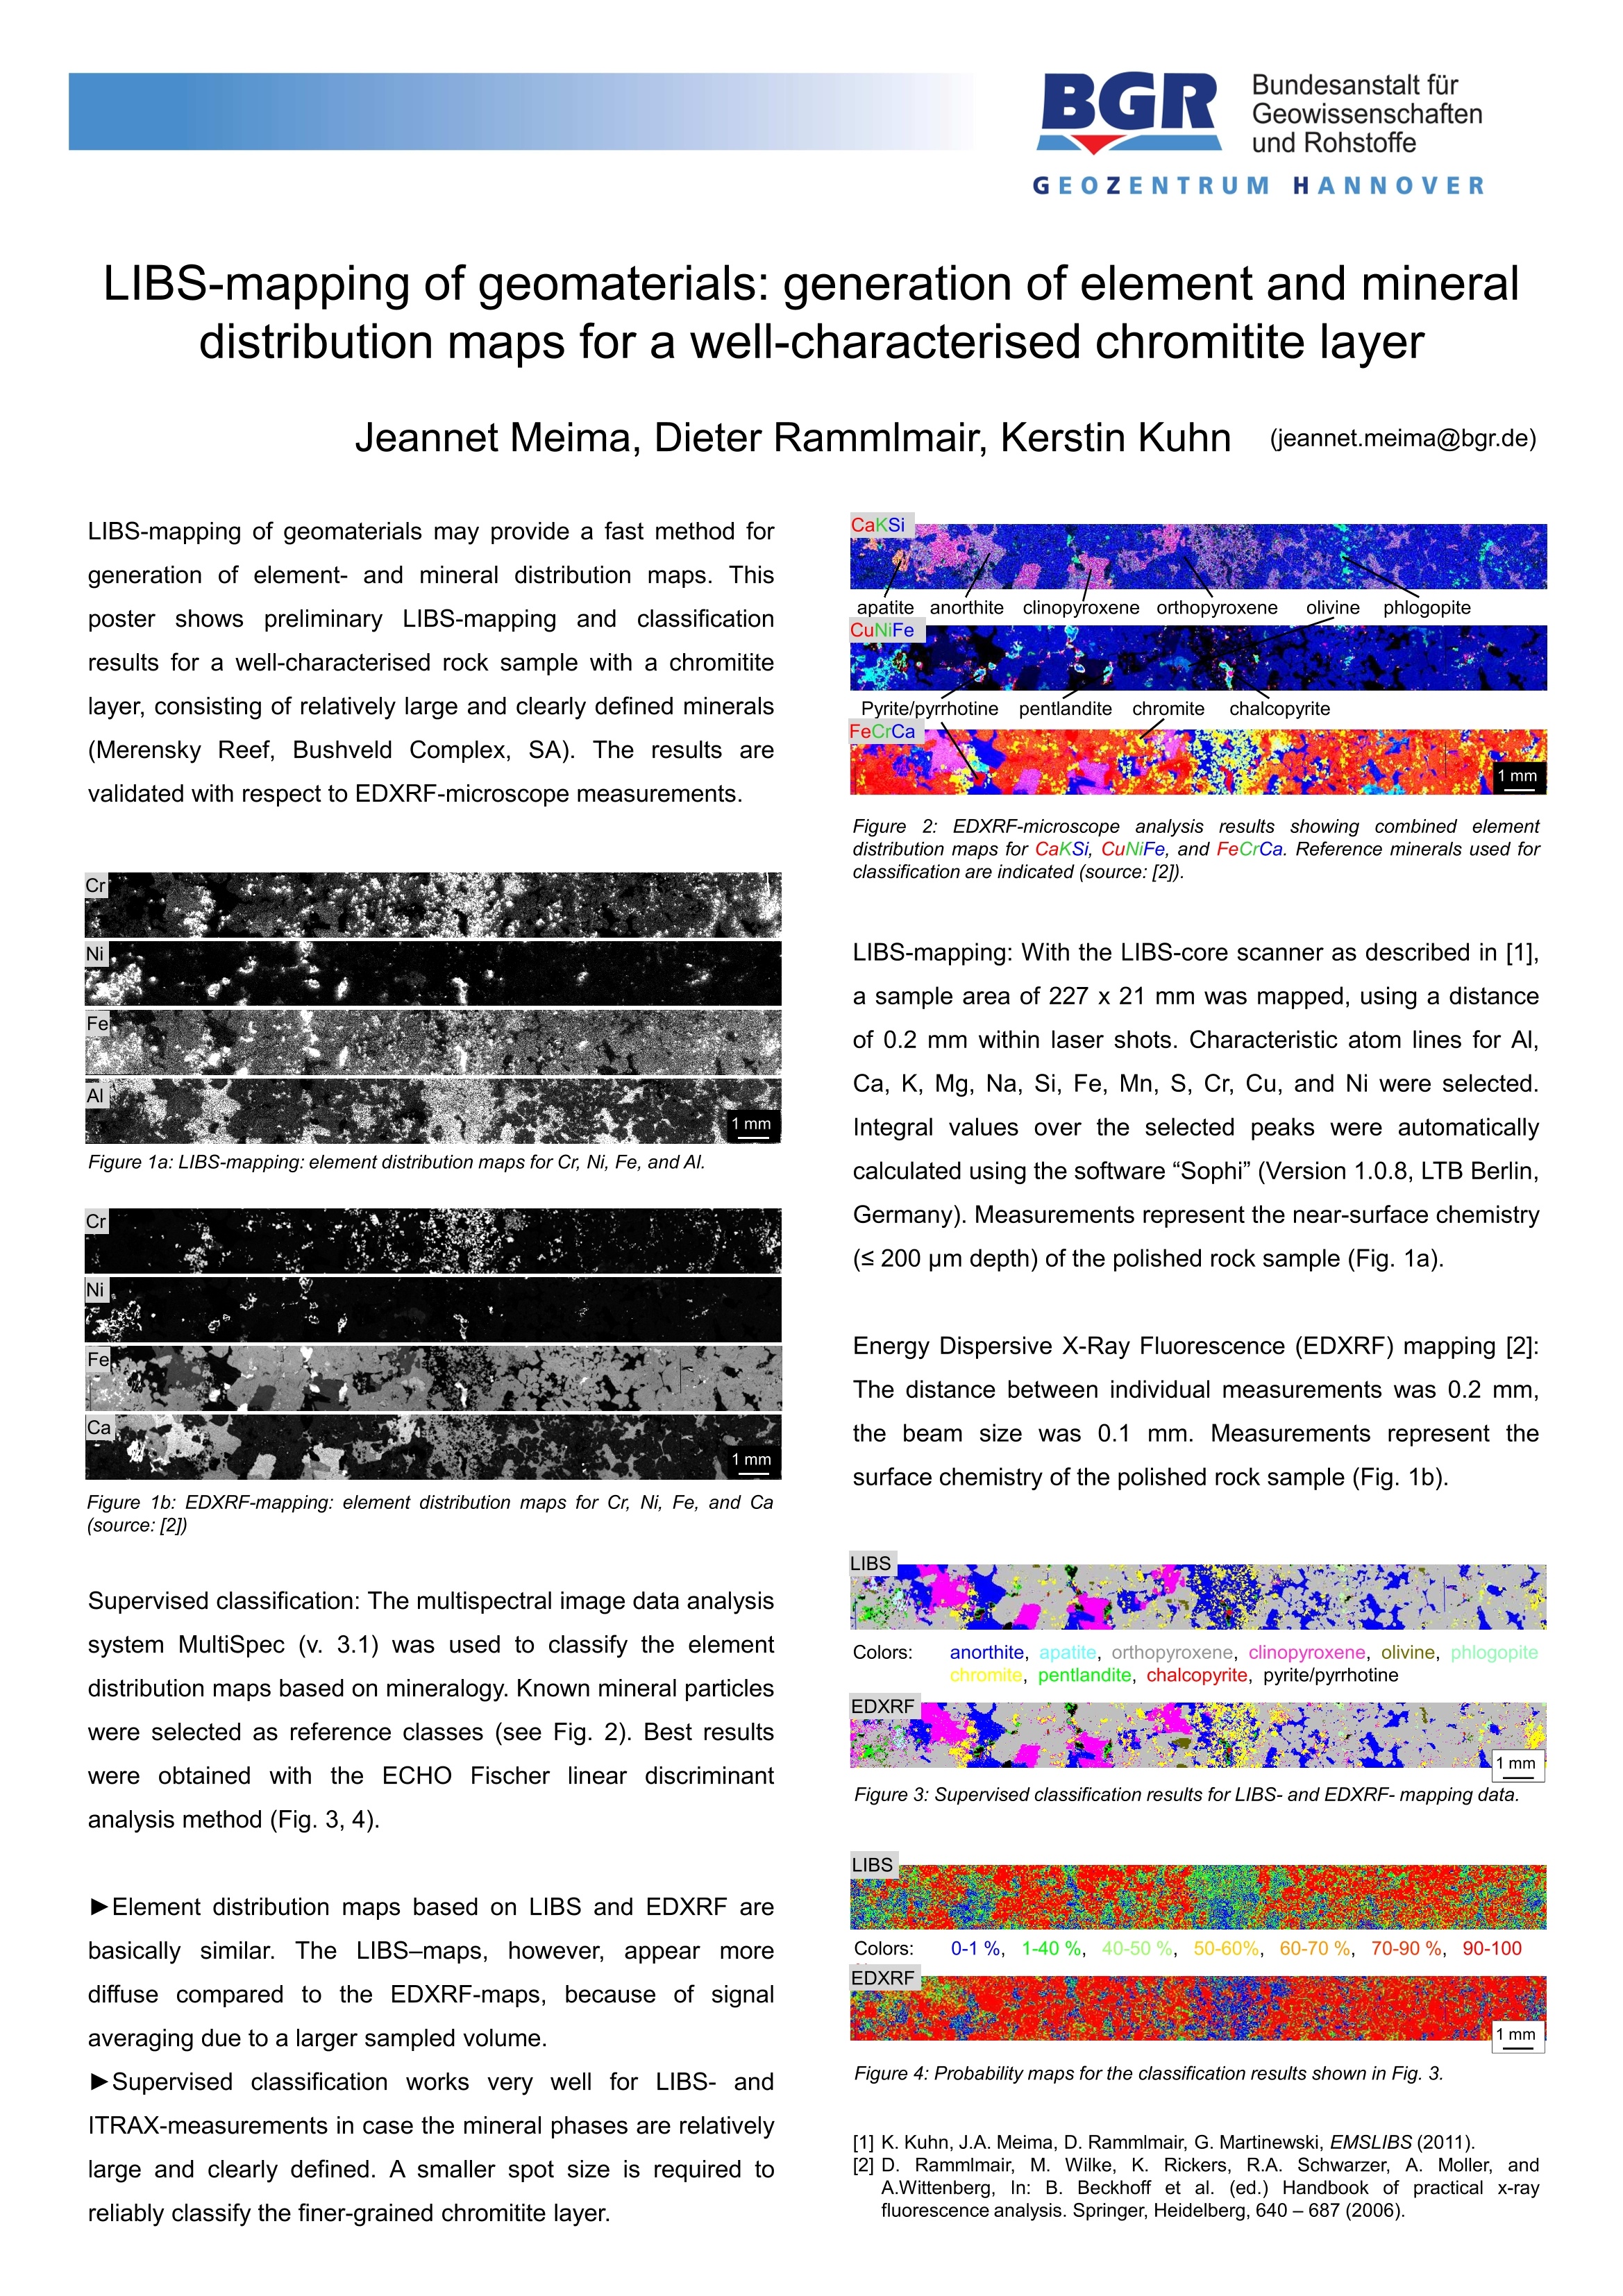
Bundesanstalt furGeowissenschaftenund RohstoffeGEOZENTRUMHANNOVER LIBS-mapping of geomaterials: generation of element and mineraldistribution maps for a well-characterised chromitite layer Jeannet Meima, Dieter Rammlmair, Kerstin Kuhn(jeannet.meima@bgr.de) LIBS-mapping of geomaterials may provide a fast method forgeneration of element- and mineral distribution maps. Thisposter showspreliminary LIBS-mapping and classificationresults for a well-characterised rock sample with a chromititelayer, consisting of relatively large and clearly defined minerals(Merensky Reef, Bushveld Complex, SA). The results arevalidated with respect to EDXRF-microscope measurements. Figure 1a:LIBS-mapping: element distribution maps for Cr, Ni, Fe, and Al. Figure 1b: EDXRF-mapping: element distribution maps for Cr, Ni, Fe, and Ca(source:[2]) Supervised classification: The multispectral image data analysissystem MultiSpec (v.3.1) was used to classify the elementdistribution maps based on mineralogy. Known mineral particleswere selected as reference classes (see Fig. 2). Best resultswere obtained with the ECHO Fischer linear discriminantanalysis method (Fig.3,4). DElement distribution maps based on LIBS and EDXRF arebasically similar. The LIBS-maps, however, appear morediffuse compared to the EDXRF-maps, because of signalaveraging due to a larger sampled volume. D Supervised classification works very well for LIBS- andITRAX-measurements in case the mineral phases are relativelylarge and clearly defined. A smaller spot size is required toreliably classify the finer-grained chromitite layer. Figure 2: EDXRF-microscope analysis results showing combined elementdistribution maps for CaKSiUS, CuNiFe, and FeCrCa. Reference minerals used forclassification are indicated (source:[2]). LIBS-mapping: With the LIBS-core scanner as described in [1],a sample area of 227 x 21 mm was mapped, using a distanceof 0.2 mm within laser shots. Characteristic atom lines for Al,Ca, K, Mg, Na, Si, Fe, Mn, S, Cr, Cu, and Ni were selected.Integral values over the selected peaks were automaticallycalculated using the software“Sophi” (Version 1.0.8, LTB Berlin,Germany). Measurements represent the near-surface chemistry(≤ 200 pm depth) of the polished rock sample (Fig. 1a). Energy Dispersive X-Ray Fluorescence (EDXRF) mapping [2]:The distance between individual measurements was 0.2 mm,the beam size was 0.1 mm. Measurements represent thesurface chemistry of the polished rock sample (Fig. 1b). LIBS 1mmn Figure 3: Supervised classification results for LIBS-and EDXRF-mapping data. Figure 4: Probability maps for the classification results shown in Fig.3 ( [1] K. Kuhn, J.A. Meima, D. Rammlmair, G. Martinewski, EMSLIBS (2011). ) [2] D. Rammlmair, M. Wilke, K. Rickers, R.A. Schwarzer, A. Moller, andA.Wittenberg, In: B. Beckhoff et al. (ed.) Handbook of practical x-ray. fluorescence analysis. Springer, Heidelberg, 640-687 (2006). 地质材料的libs-mapping可提供一种快速生成元素和矿物分布图的方法。可以展示一个具有铬铁矿层的岩石样品的libs-mapping和分类结果,结果与edxrf显微镜测量结果相一致。
确定
还剩1页未读,是否继续阅读?

产品配置单
埃德比光子科技(中国)有限公司为您提供《岩石样品中元素和矿物分布图检测方案(激光诱导击穿)》,该方案主要用于非金属矿产中元素和矿物分布图检测,参考标准--,《岩石样品中元素和矿物分布图检测方案(激光诱导击穿)》用到的仪器有LTB ARYELLE200 激光诱导击穿-LIBS光谱仪
推荐专场
相关方案
更多