


方案详情
文
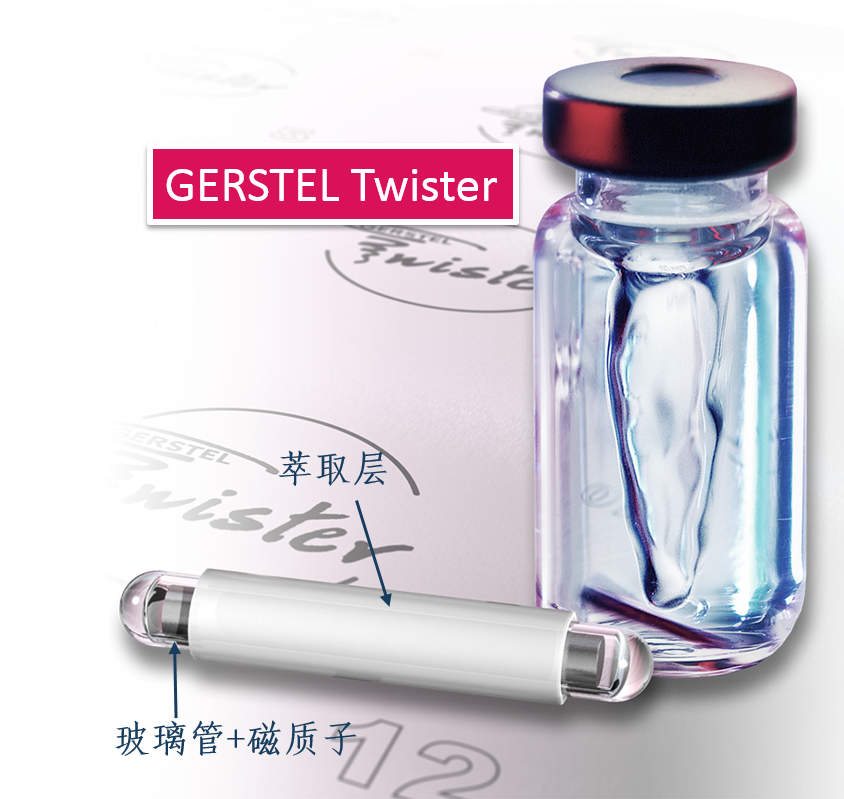
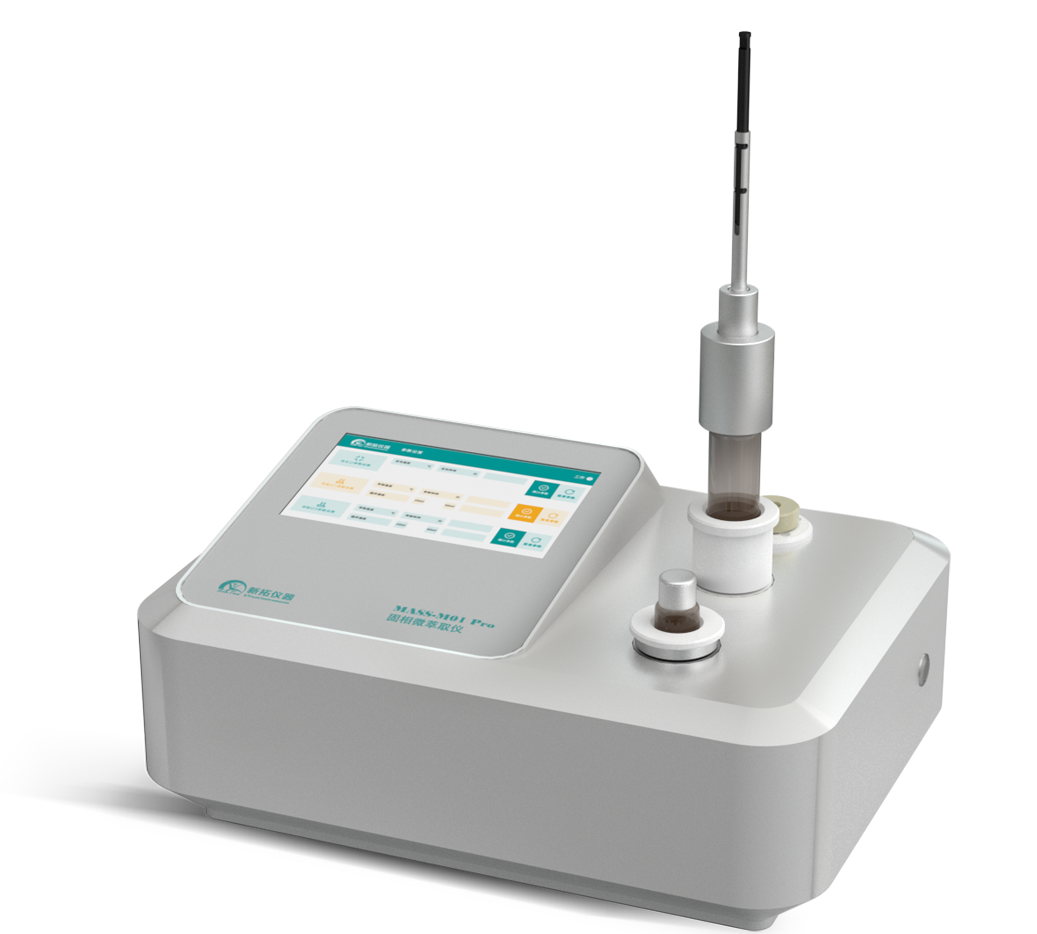
对饮用水和饮料中的多环芳烃使用SBSE-TD-GC/MS搅拌棒吸附萃取联合热脱附和质谱联用分析,可以得到极低的检测下限,非常高的可重复性,并且无需溶剂,所需样品体积小,即环保又经济!
方案详情

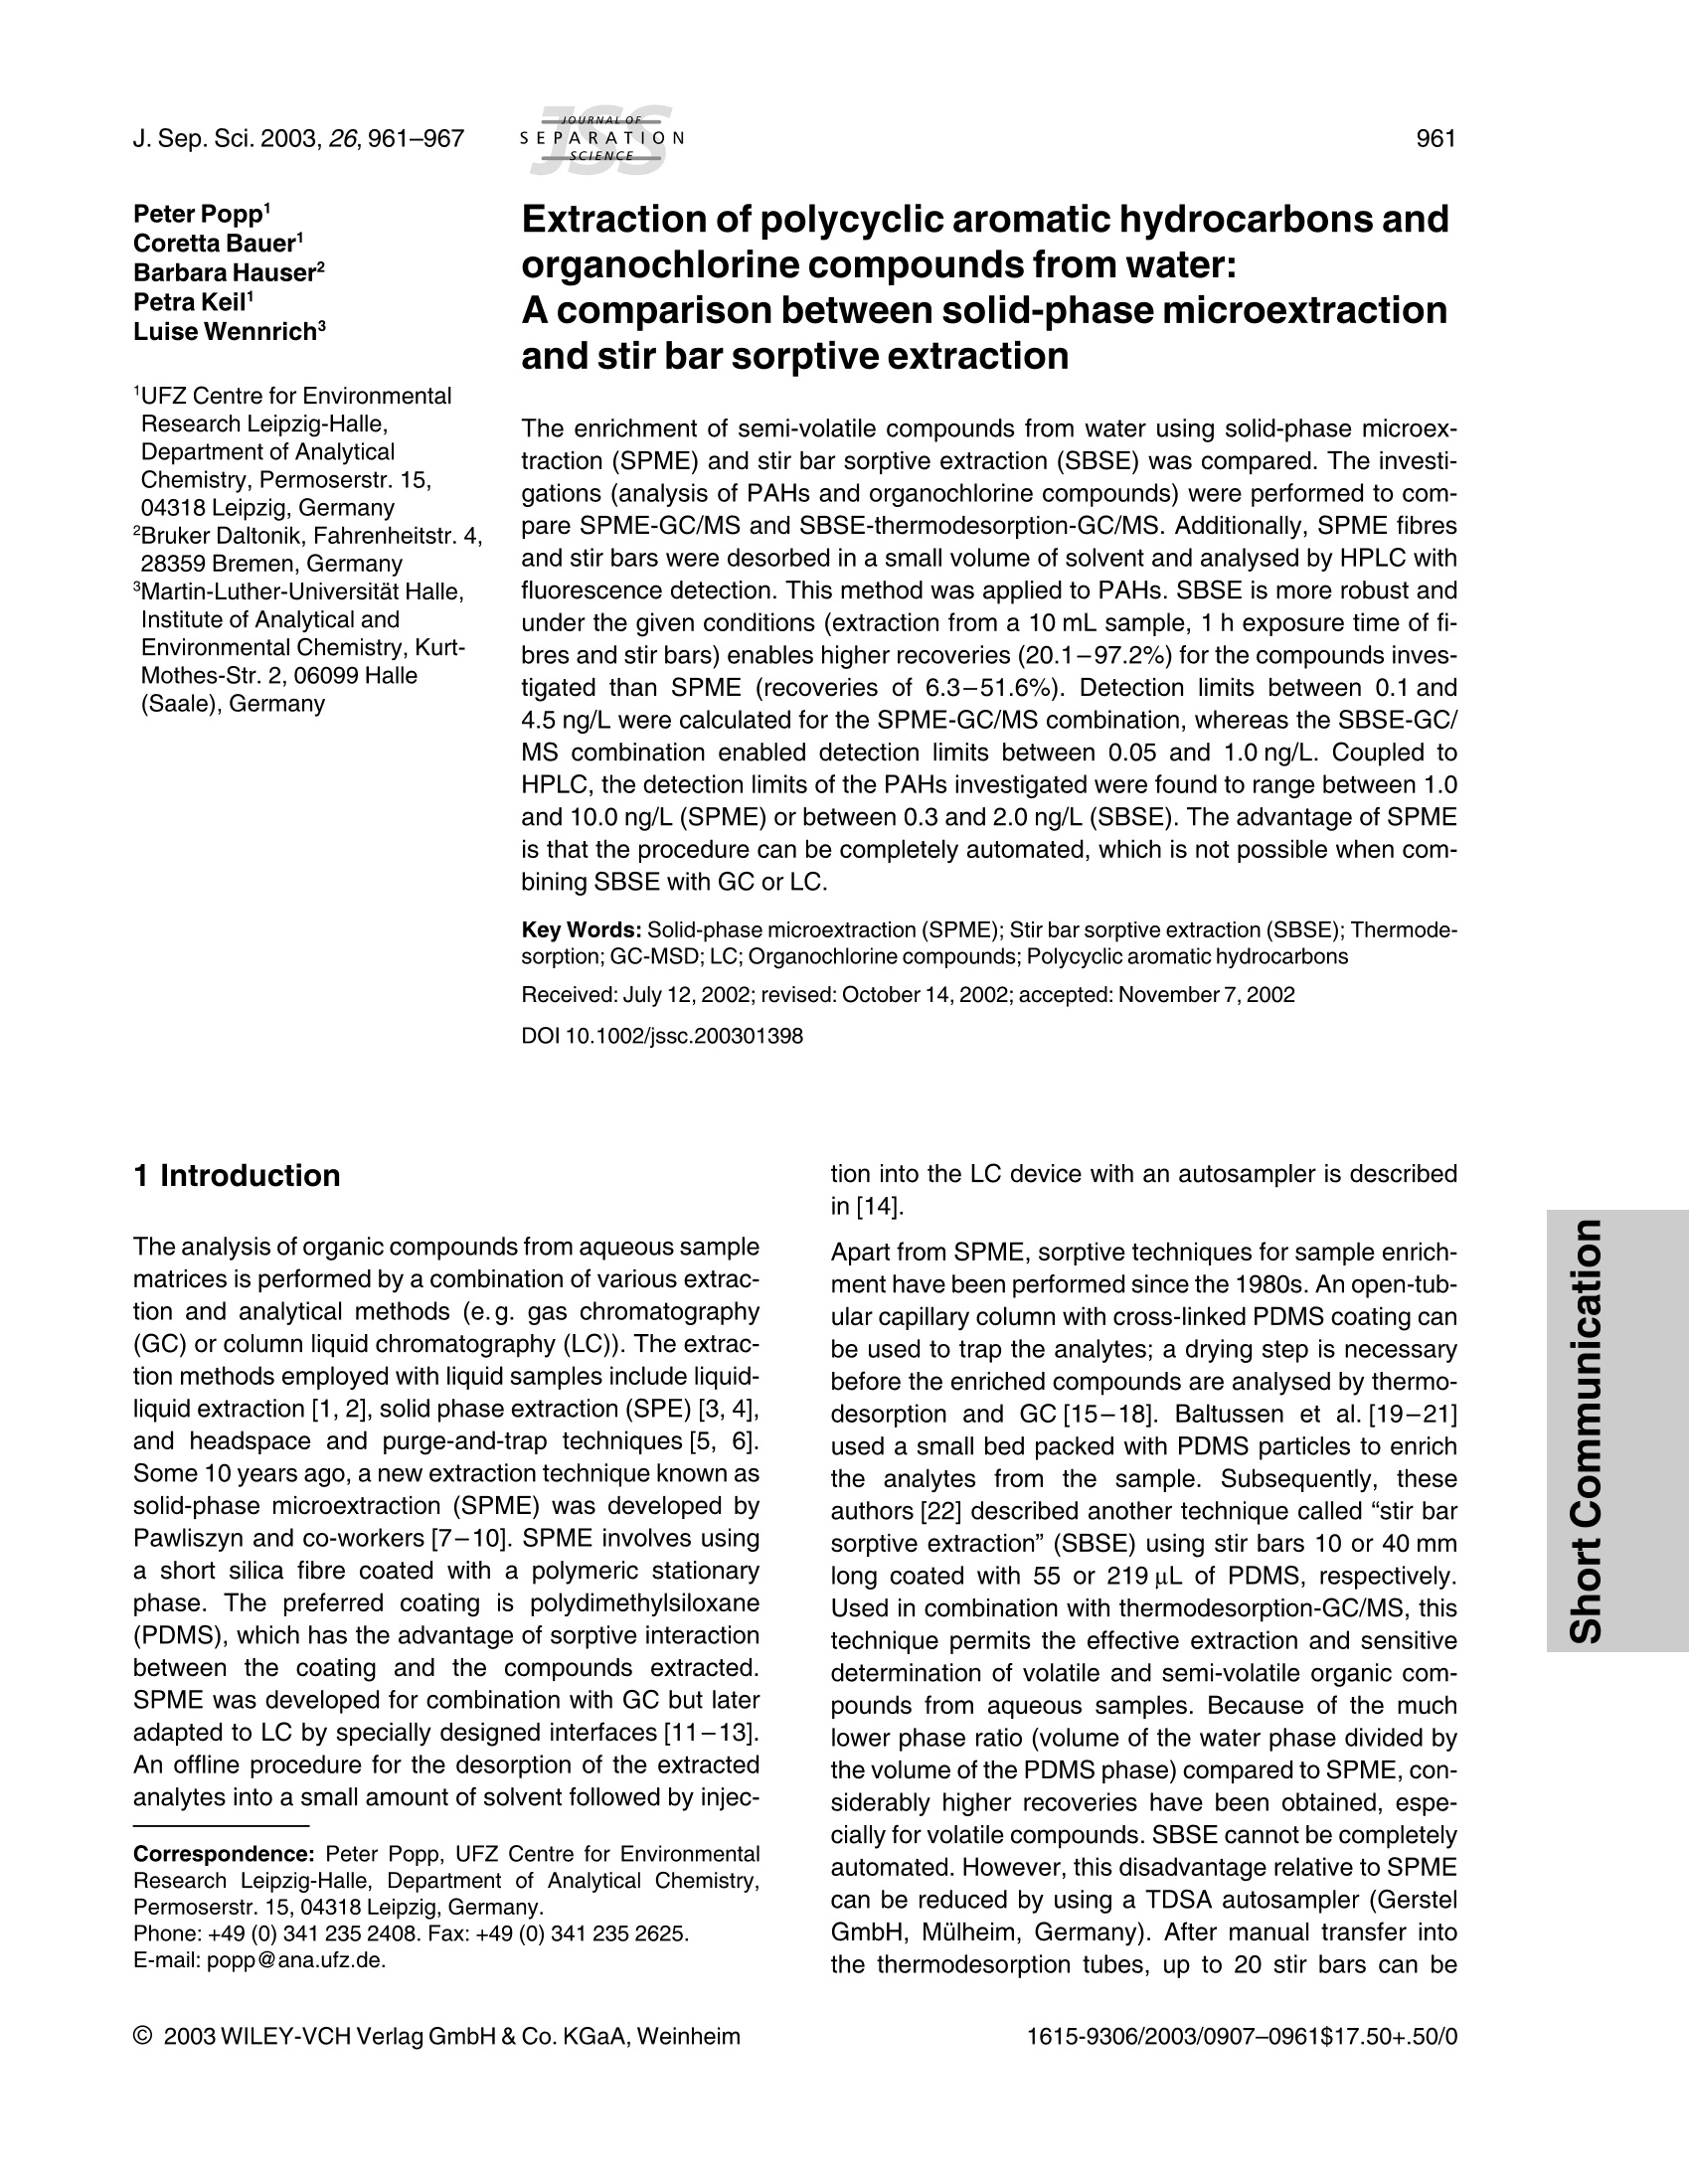
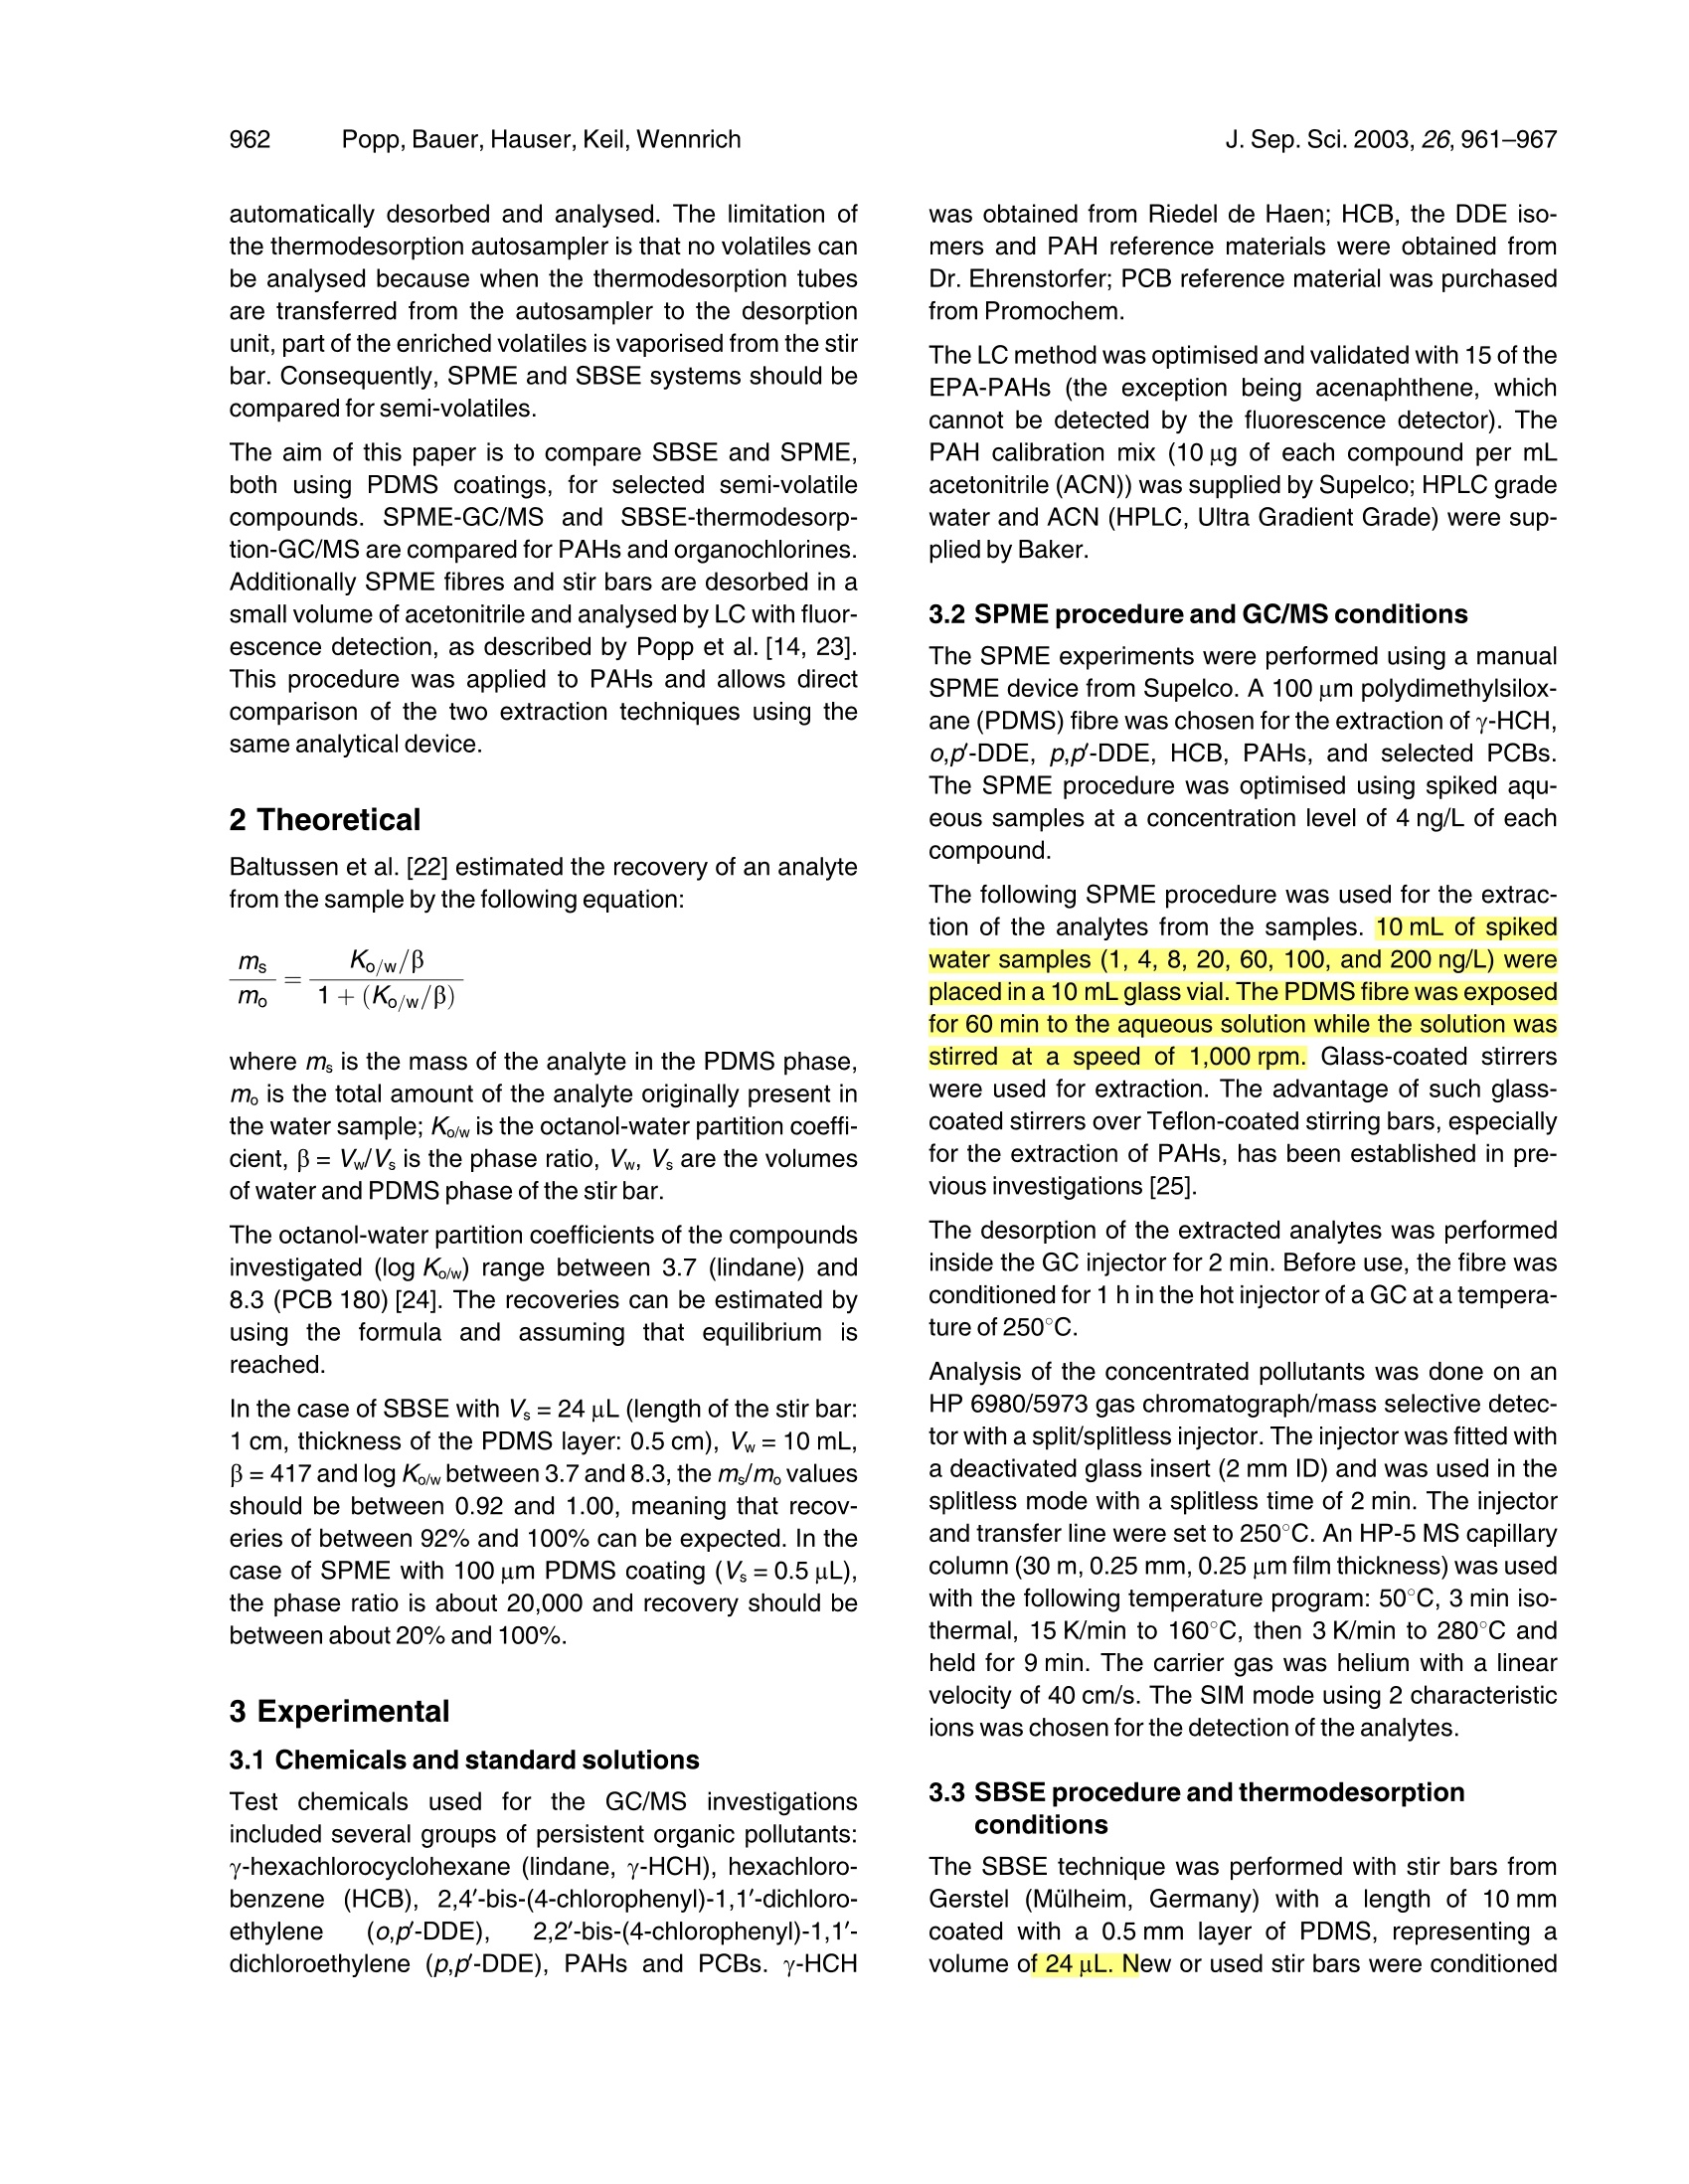
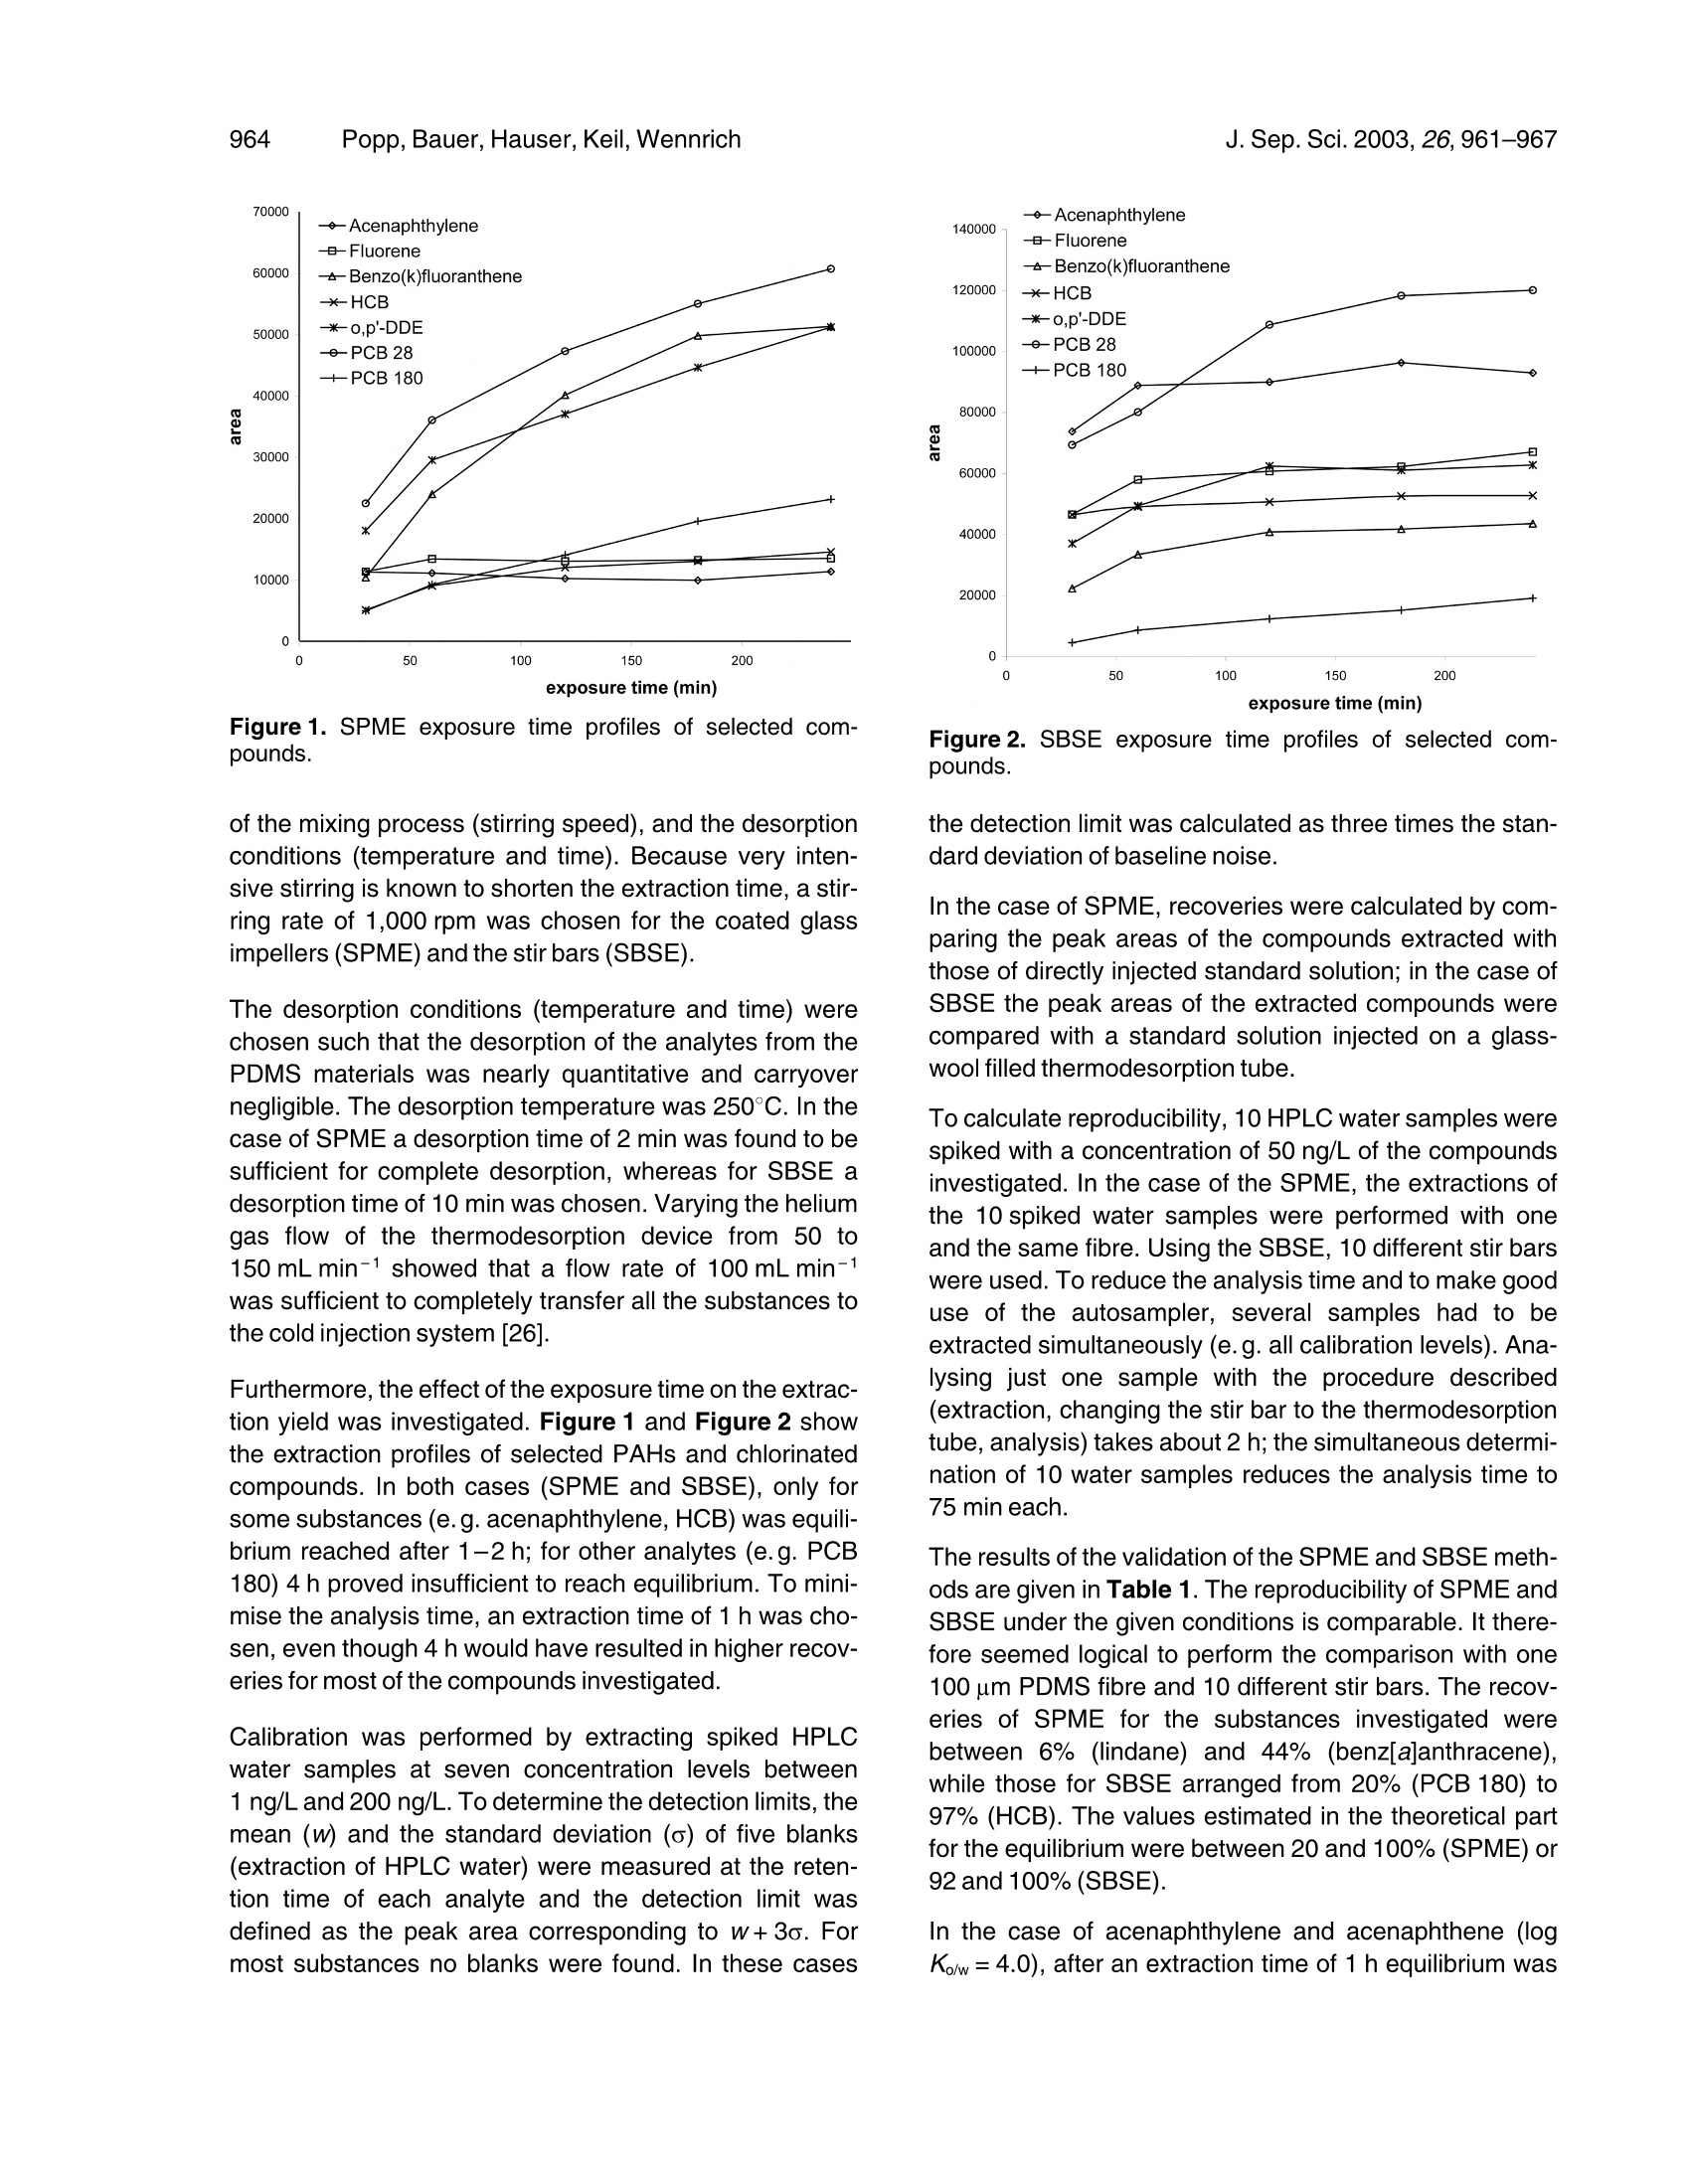
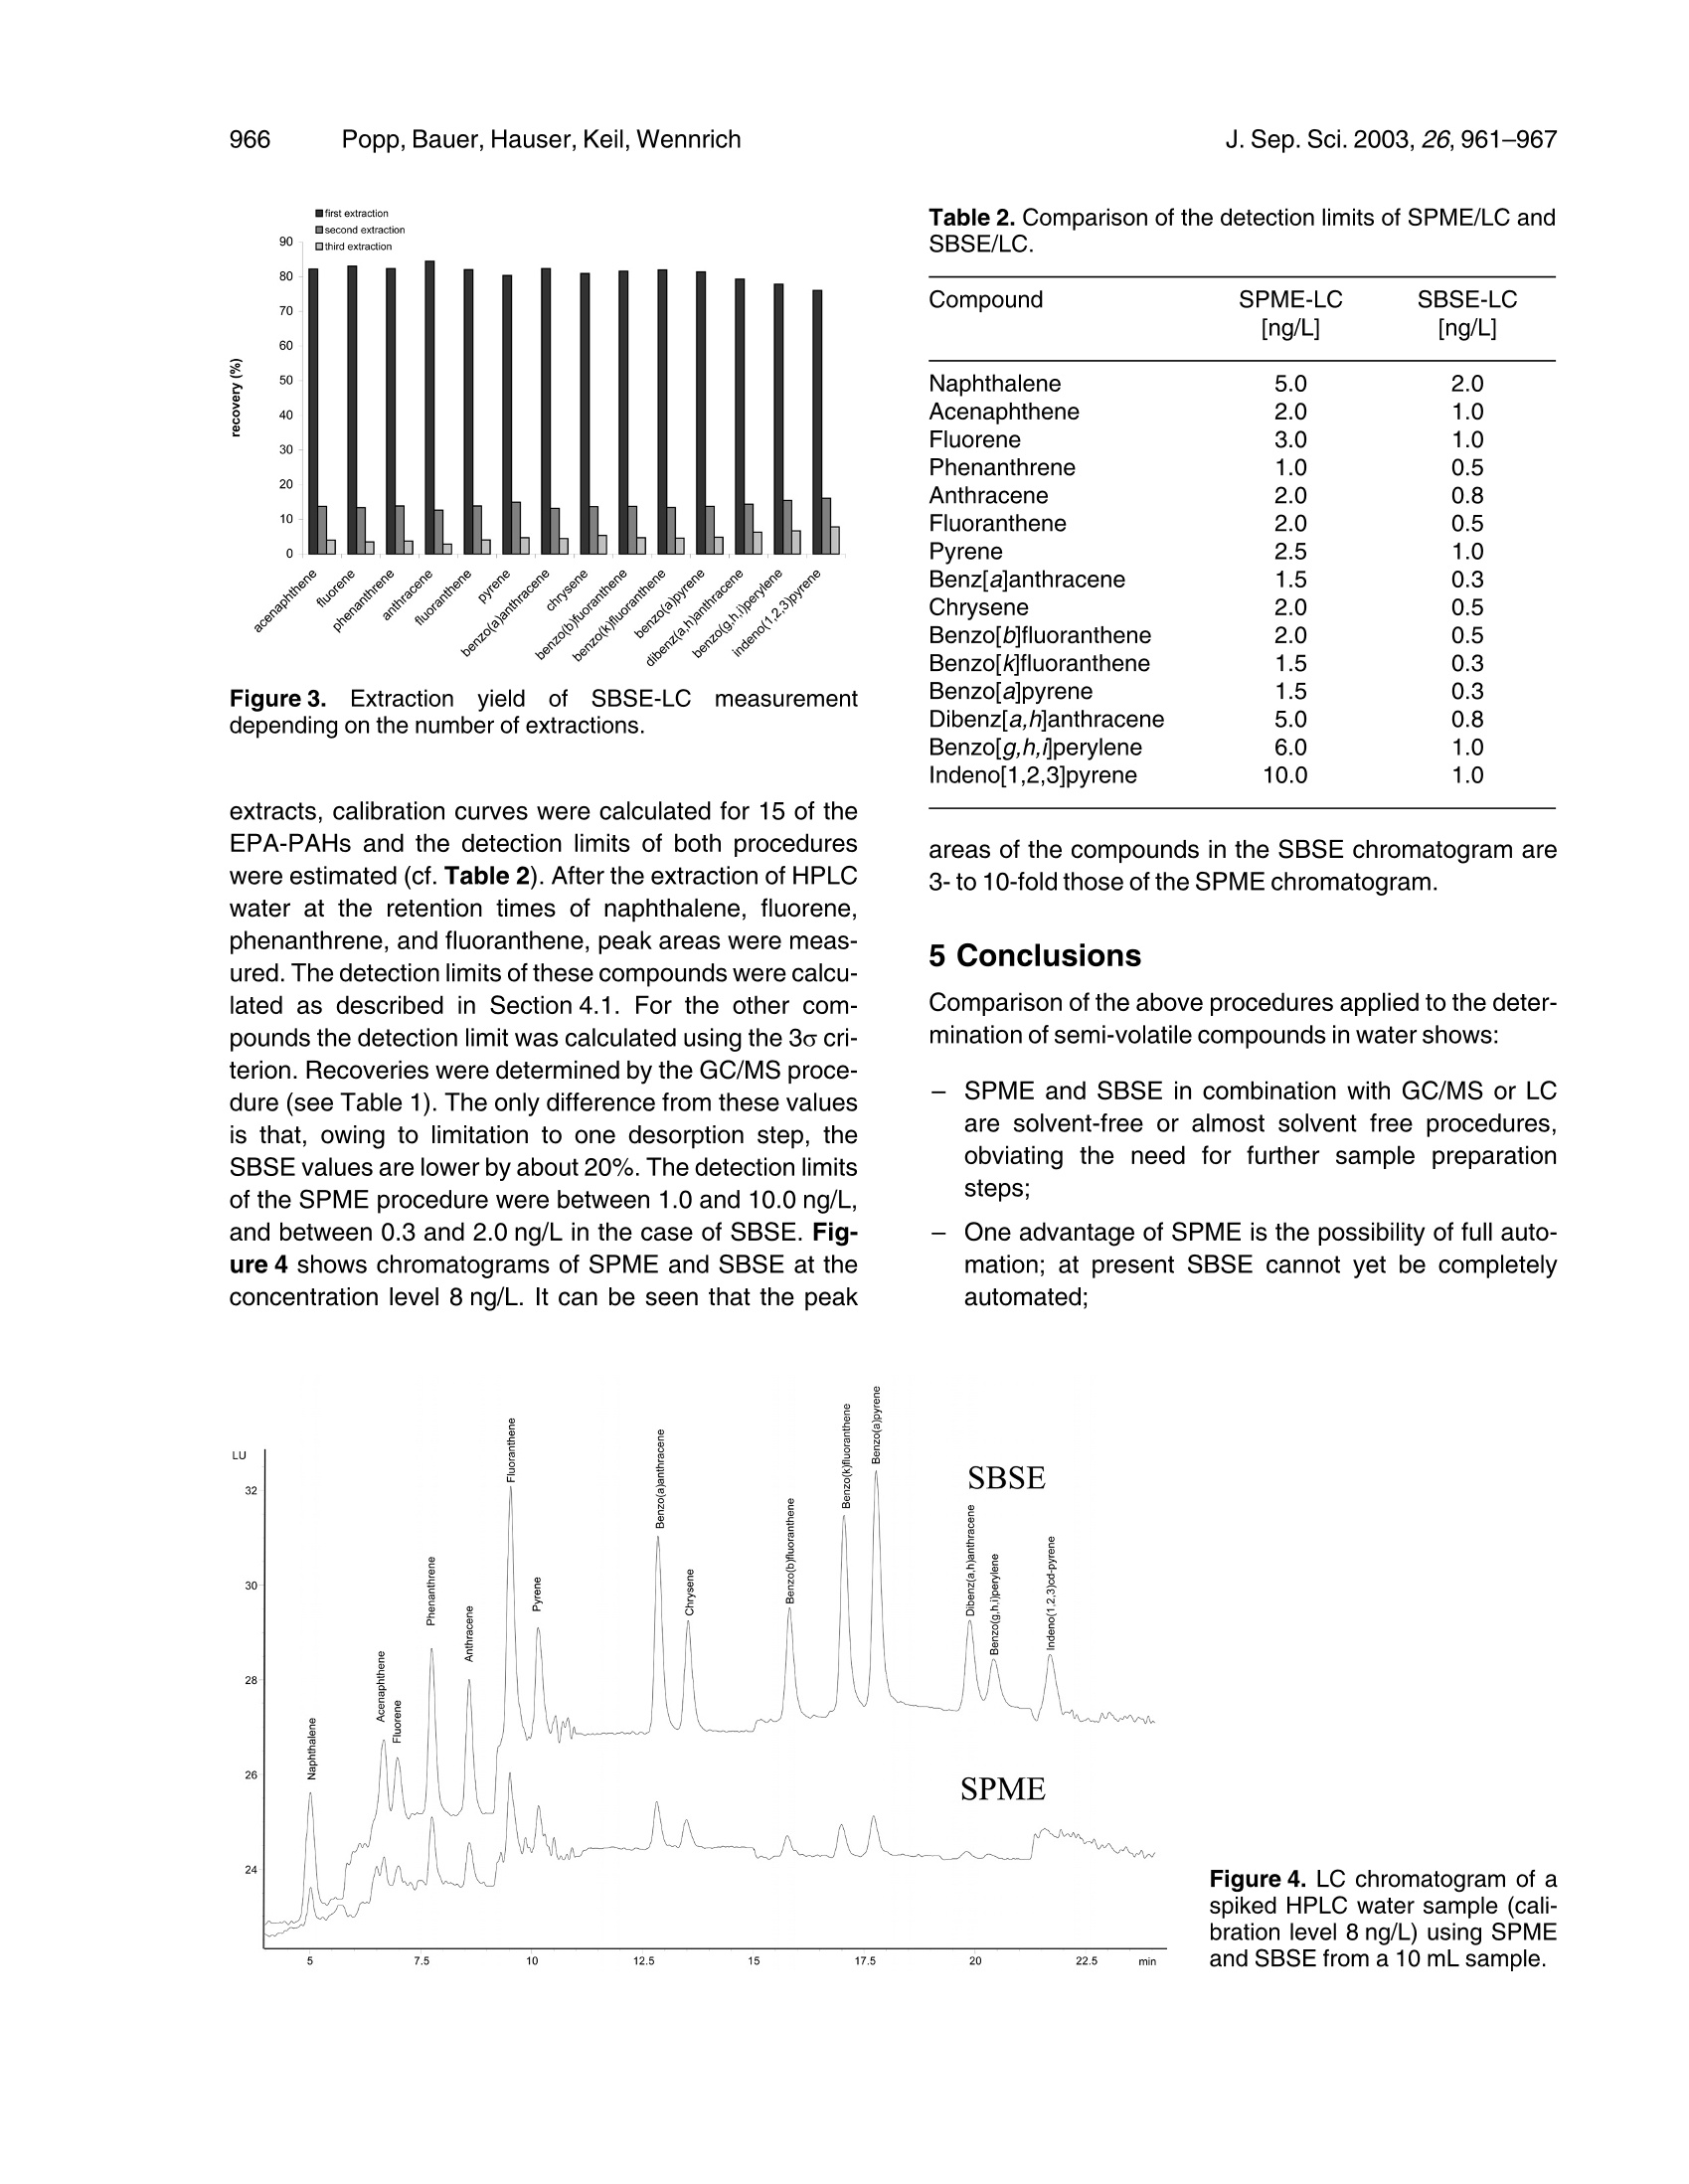
JOURNAL OFoFSEPARATIO NSCIENCEJ. Sep. Sci. 2003, 26,961-967961 Popp,Bauer, Hauser,Keil, WennrichJ. Sep. Sci.2003,26,961-967962 @ 2003 WILEY-VCH Verlag GmbH & Co. KGaA, Weinheim1615-9306/2003/0907-0961$17.50+.50/0 Peter PoppCoretta Bauer'Barbara HauserPetra KeilLuise Wennrich 1UFZ Centre for EnvironmentalResearch Leipzig-Halle,Department of AnalyticalChemistry, Permoserstr. 15,04318 Leipzig, Germany2Bruker Daltonik, Fahrenheitstr. 4,28359 Bremen, Germany3Martin-Luther-Universitat Halle,Institute of Analytical andEnvironmental Chemistry,Kurt-Mothes-Str. 2, 06099 Halle(Saale),Germany Extraction of polycyclic aromatic hydrocarbons andorganochlorine compounds from water: A comparison between solid-phase microextractionand stir bar sorptive extraction The enrichment of semi-volatile compounds from water using solid-phase microex-traction (SPME) and stir bar sorptive extraction (SBSE) was compared. The investi-gations (analysis of PAHs and organochlorine compounds) were performed to com-pare SPME-GC/MS and SBSE-thermodesorption-GC/MS. Additionally, SPME fibresand stir bars were desorbed in a small volume of solvent and analysed by HPLC withfluorescence detection. This method was applied to PAHs. SBSE is more robust andunder the given conditions (extraction from a 10 mL sample, 1 h exposure time of fi-bres and stir bars) enables higher recoveries (20.1-97.2%) for the compounds inves-tigated than SPME (recoveries of 6.3-51.6%). Detection limits between 0.1 and4.5 ng/L were calculated for the SPME-GC/MS combination, whereas the SBSE-GC/MS combination enabled detection limits between 0.05 and 1.0 ng/L. Coupled toHPLC, the detection limits of the PAHs investigated were found to range between 1.0and 10.0 ng/L (SPME) or between 0.3 and 2.0 ng/L(SBSE). The advantage of SPMEis that the procedure can be completely automated, which is not possible when com-bining SBSE with GC or LC. Key Words: Solid-phase microextraction (SPME); Stir bar sorptive extraction (SBSE); Thermode-sorption; GC-MSD;LC;Organochlorine compounds; Polycyclic aromatic hydrocarbons Received: July 12, 2002; revised: October 14, 2002; accepted: November 7,2002 DOI 10.1002/jssc.200301398 1 Introduction The analysis of organic compounds from aqueous samplematrices is performed by a combination of various extrac-tion and analytical methods (e.g. gas chromatography(GC) or column liquid chromatography (LC)). The extrac-tion methods employed with liquid samples include liquid-liquid extraction [1, 2],solid phase extraction (SPE) [3, 4],and headspace and purge-and-trap techniques [5, 6].Some 10 years ago, a new extraction technique known assolid-phase microextraction (SPME) was developed byPawliszyn and co-workers [7-10]. SPME involves usinga short silica fibre coated with a polymeric stationaryphase. The preferred coating is polydimethylsiloxane(PDMS), which has the advantage of sorptive interactionbetween the coating and the compounds extracted.SPME was developed for combination with GC but lateradapted to LC by specially designed interfaces [11-13].An offline procedure for the desorption of the extractedanalytes into a small amount of solvent followed by injec- ( Correspondence: P e ter Popp, UFZ Centre f o r Environmental Research Leipzig-Halle, Department of Ana l ytical Chemistry,Permoserstr. 1 5, 04318 Leipzig, Germany. Phone: +49 (0) 341 235 2408. F a x: +49 (0) 341 2 3 5 2625. E-mail: popp@ana.ufz.de. ) tion into the LC device with an autosampler is describedin[14]. Apart from SPME, sorptive techniques for sample enrich-ment have been performed since the 1980s. An open-tub-ular capillary column with cross-linked PDMS coating canbe used to trap the analytes; a drying step is necessarybefore the enriched compounds are analysed by thermo-desorption and GC [15-18]. Baltussen et al.[19-21]used a small bed packed with PDMS particles to enrichthe analytes from the sample. Subsequently, theseauthors [22] described another technique called “stir barsorptive extraction”(SBSE) using stir bars 10 or 40 mmlong coated with 55 or 219 pL of PDMS, respectively.Used in combination with thermodesorption-GC/MS, thistechnique permits the effective extraction and sensitivedetermination of volatile and semi-volatile organic com-pounds from aqueous samples. Because of the muchlower phase ratio (volume of the water phase divided bythe volume of the PDMS phase) compared to SPME, con-siderably higher recoveries have been obtained, espe-cially for volatile compounds. SBSE cannot be completelyautomated. However, this disadvantage relative to SPMEcan be reduced by using a TDSA autosampler (GerstelGmbH, Mulheim, Germany). After manual transfer intothe thermodesorption tubes, up to 20 stir bars can be automatically desorbed and analysed. The limitation ofthe thermodesorption autosampler is that no volatiles canbe analysed because when the thermodesorption tubesare transferred from the autosampler to the desorptionunit, part of the enriched volatiles is vaporised from the stirbar. Consequently, SPME and SBSE systems should becompared for semi-volatiles. The aim of this paper is to compare SBSE and SPME,both using PDMS coatings, for selected semi-volatilecompounds. SPME-GC/MS and SBSE-thermodesorp-tion-GC/MS are compared for PAHs and organochlorines.Additionally SPME fibres and stir bars are desorbed in asmall volume of acetonitrile and analysed by LC with fluor-escence detection, as described by Popp et al. [14, 23].This procedure was applied to PAHs and allows directcomparison of the two extraction techniques using thesame analytical device. 2 Theoretical Baltussen et al. [22]estimated the recovery of an analytefrom the sample by the following equation: where ms is the mass of the analyte in the PDMS phase,m. is the total amount of the analyte originally present inthe water sample; Kow is the octanol-water partition coeffi-cient,β=Vw/V, is the phase ratio, Vw, Vs are the volumesof water and PDMS phase of the stir bar. The octanol-water partition coefficients of the compoundsinvestigated (log Kow) range between 3.7 (lindane) and8.3 (PCB 180) [24]. The recoveries can be estimated byusing the formula and assuming that equilibrium isreached. In the case of SBSE with Vs=24 uL (length of the stir bar:1 cm, thickness of the PDMS layer: 0.5 cm), Vw=10 mL,β=417 and log Ko/w between 3.7 and 8.3, the ms/m, valuesshould be between 0.92 and 1.00, meaning that recov-eries of between 92% and 100% can be expected. In thecase of SPME with 100 um PDMS coating (Vs=0.5 uL),the phase ratio is about 20,000 and recovery should bebetween about 20% and 100%. 3 Experimental 3.1 Chemicals and standard solutions Test chemicalss used for the GC/MS investigationsincluded several groups of persistent organic pollutants:y-hexachlorocyclohexane (lindane, y-HCH), hexachloro-benzene((HCB), 2,4'-bis-(4-chlorophenyl)-1,1'-dichloro-ethylene (o,p-DDE), 2,2'-bis-(4-chlorophenyl)-1,1'-dichloroethylene (p,p-DDE), PAHs and PCBs. y-HCH was obtained from Riedel de Haen; HCB, the DDE iso-mers and PAH reference materials were obtained fromDr. Ehrenstorfer; PCB reference material was purchasedfrom Promochem. The LC method was optimised and validated with 15 of theEPA-PAHs (the exception being acenaphthene, whichcannot be detected by the fluorescence detector). ThePAH calibration mix (10 ug of each compound per mLacetonitrile (ACN)) was supplied by Supelco; HPLC gradewater and ACN (HPLC, Ultra Gradient Grade) were sup-plied by Baker. 3.2 SPME procedure and GC/MS conditions The SPME experiments were performed using a manualSPME device from Supelco. A 100 um polydimethylsilox-ane (PDMS) fibre was chosen for the extraction of y-HCH,o,p-DDE, p,p-DDE, HCB, PAHs, and selected PCBs.The SPME procedure was optimised using spiked aqu-eous samples at a concentration level of 4 ng/L of eachcompound. The following SPME procedure was used for the extrac-tion of the analytes from the samples. 10 mL of spikedwater samples (1, 4, 8, 20, 60, 100, and 200 ng/L) wereplaced in a 10 mL glass vial. The PDMS fibre was exposedfor 60 min to the aqueous solution while the solution wasstirred at a speed of 1,000 rpm. Glass-coated stirrerswere used for extraction. The advantage of such glass-coated stirrers over Teflon-coated stirring bars, especiallyfor the extraction of PAHs, has been established in pre-vious investigations [25]. The desorption of the extracted analytes was performedinside the GC injector for 2 min. Before use, the fibre wasconditioned for 1 h in the hot injector of a GC at a tempera-ture of 250°C. Analysis of the concentrated pollutants was done on anHP 6980/5973 gas chromatograph/mass selective detec-tor with a split/splitless injector. The injector was fitted witha deactivated glass insert (2 mm lD) and was used in thesplitless mode with a splitless time of 2 min. The injectorand transfer line were set to 250°C. An HP-5 MS capillarycolumn (30 m, 0.25 mm, 0.25 um film thickness) was usedwith the following temperature program: 50℃, 3 min iso-thermal, 15 K/min to 160°℃, then 3 K/min to 280°℃ andheld for 9 min. The carrier gas was helium with a linearvelocity of 40 cm/s. The SIM mode using 2 characteristicions was chosen for the detection of the analytes. 3.3 SBSE procedure and thermodesorptionconditions The SBSE technique was performed with stir bars fromGerstel (Mulheim, Germany) with a length of 10 mmcoated with a 0.5 mm layer of PDMS, representing avolume of 24 uL. New or used stir bars were conditioned as follows: the stir bars were placed in a vial containing1 mL of a 1:1 mixture of methylene chloride and metha-nol, and treated for 5 min with sonication.Then the solventmixture was discarded and the procedure repeated threetimes. The stir bar was dried in a desiccator at room tem-perature and heated for 90 min at 280C with a nitrogenstream of about 100 mL min-1. The SBSE procedure was as follows: 10 mL of spikedwater samples (1, 4, 8, 20,60,80, 100, and 200 ng/L)were placed in a 10 mL glass vial, then extracted for60 min at a stirring speed of about 1,000 rpm. After extrac-tion, the stir bar was removed from the sample with a pairof tweezers and placed in an empty thermodesorptiontube. Thermodesorption-GC/MS analysis was performed on anHP 6980/5973 GC/mass selective detector system (Agi-lent Technologies) fitted with a TDS-2 thermodesorptiondevice and a TDSA autosampler (both from Gerstel, Mul-heim, Germany). To cryofocus the pollutants after thermo-desorption, a cold injection system (CIS-4) from Gerstelwith an empty liner was used, with the CIS being cooled to-150℃ using liquid nitrogen. The transfer lines both fromthe thermodesorption device to the CIS and from the GCto the MSD ion source were set to 250°C. The followingconditions were chosen for the thermodesorption of theanalytes from the stir bars: desorption temperature,250°℃; helium flow rate, 100 mL/min; desorption time,4 min. After desorption of the stir bars, the CIS was heatedto 250℃ at a rate of 12 K/s, and the injector was used inthe splitless mode with a splitless time of 1.5 min.The GCcolumn and the GC/MS conditions were the same asdescribed above. To compare SPME and SBSE, two different GC/MSdevices (but the same type of GC and mass selectivedetector) were used. Before starting the comparison thesensitivity of both devices for the substances under inves-tigation was checked. In the first case (the GC/MSdevice), a standard solution was injected directly, while inthe second (thermodesorption-GC/MS) the standard wasinjected into a thermodesorption tube filled with quartzwool. In both cases the signal-to-noise ratio was compar-able for most of the compounds investigated. For somecompounds such as benzo[g,h,jperylene and inde-no[1,2,3]pyrene, the sensitivity of the thermodesorption-GC/MS system was significantly lower. This was probablycaused by adsorption losses in the transfer line betweenthe TDS and the cold injection system. 3.4 SPME procedure and LC conditions SPME followed by LC was also performed with a 100 umPDMS fibre. Before use the fibre was placed for 5 min in5 mL ACN and then conditioned in the same manner asfor the GC/MS experiments. The method was optimised and validated with 15 EPA-PAHs (the exception beingacenaphthylene). The extraction procedure for the PAHs from the fortifiedHPLC water samples was the same as described in Sec-tion 3.2. The analytes were desorbed for 2 min by exposing the100 um PDMS fibre in 40 uL of an ACN/water mixture(4:1) using 0.1 mL conical inserts for crimp-top vials(Chrompack). 4 pL ACN/water mixture was injected withthe desorbed PAHs using the autosampler of the LCdevice employed. For PAH analysis,an HP 1100 system with a programma-ble fluorescence detector (HP1046A) was used. ThePAHs were separated on a Vydac 201, TP 52 column(250×2.1 mm ID). The conditions were as follows. Themobile phase was acetonitrile-water with an initial contentof 50% (v/v) ACN. Then the ACN content was increasedto 60% (0-2 min), 90%(2-13.5 min), and 95% (13.5-19 min). This level was held constant for 7 min until theend of analysis. The temperature was 22℃. The excita-tion (ex) and emission (em) wavelength programme usedfor detection is described in [14]. 3.5 SBSE procedure and LC conditions The preconditioning of the stir bars and the enrichment ofthe PAHs were performed as described in Section 3.3. After extraction the stir bar was removed with clean twee-zers and dried with a lint-free tissue. Then the stir bar wasplaced into the insert (250 uL glass flat bottom) of a 2 mLvial. The insert was filled with 150 uL of an ACN-watermixture (4:1). The PAHs were desorbed for 10 min keep-ing the vial at laboratory temperature. After desorption thestir bar was removed by a magnetic rod and the vial withthe 250 uL insert was placed in the autosampler of the LCinstrument used. The LC conditions were identical with those described inSection 3.4. The only difference was that in the case ofSBSE, 15 uL of the total extract of 150 uL was injected. In both cases (SPME-LC and SBSE-LC) the same devicewas used to analyse the samples. Furthermore, in bothcases 10% of the total extract volume was injected, i. e.4 uL of the SPME extract and 15 uL of the SBSE extract,respectively. 4 Results and discussion 4.1 Optimisation and validation of the SPME-GC/MS and the SBSE-thermodesorption-GC/MSprocedures The parameters which significantly influence the extrac-tion yield of SPME and SBSE are the exposure time of thefibre and the stir bar in the aqueous sample, the intensity exposure time (min) Figure1. SPME exposure time profiles of selected com-pounds. of the mixing process (stirring speed), and the desorptionconditions (temperature and time). Because very inten-sive stirring is known to shorten the extraction time, a stir-ring rate of 1,000 rpm was chosen for the coated glassimpellers (SPME) and the stir bars (SBSE). The desorption conditions (temperature and time) werechosen such that the desorption of the analytes from thePDMS materials was nearly quantitative and carryovernegligible. The desorption temperature was 250°℃. In thecase of SPME a desorption time of 2 min was found to besufficient for complete desorption, whereas for SBSE adesorption time of 10 min was chosen. Varying the heliumgas flow of the thermodesorption device from 50 to150 mL min-1 showed that a flow rate of 100 mL min-1was sufficient to completely transfer all the substances tothe cold injection system [26]. Furthermore, the effect of the exposure time on the extrac-tion yield was investigated. Figure 1 and Figure 2 showthe extraction profiles of selected PAHs and chlorinatedcompounds. In both cases (SPME and SBSE), only forsome substances (e.g. acenaphthylene, HCB) was equili-brium reached after 1-2 h; for other analytes (e.g. PCB180) 4 h proved insufficient to reach equilibrium. To mini-mise the analysis time, an extraction time of 1 h was cho-sen, even though 4 h would have resulted in higher recov-eries for most of the compounds investigated. Calibration was performed by extracting spiked HPLCwater samples at seven concentration levels between1 ng/L and 200 ng/L. To determine the detection limits, themean (w) and the standard deviation (o) of five blanks(extraction of HPLC water) were measured at the reten-tion time of each analyte and the detection limit wasdefined as the peak area corresponding to w+3o. Formost substances no blanks were found. In these cases Figure 2. SBSE exposure time profiles of selected com-pounds. the detection limit was calculated as three times the stan-dard deviation of baseline noise. In the case of SPME, recoveries were calculated by com-paring the peak areas of the compounds extracted withthose of directly injected standard solution; in the case ofSBSE the peak areas of the extracted compounds werecompared with a standard solution injected on a glass-wool filled thermodesorption tube. To calculate reproducibility, 10 HPLC water samples werespiked with a concentration of 50 ng/L of the compoundsinvestigated. In the case of the SPME, the extractions ofthe 10 spiked water samples were performed with oneand the same fibre. Using the SBSE, 10 different stir barswere used. To reduce the analysis time and to make gooduse of the autosampler, several samples had to beextracted simultaneously (e.g. all calibration levels). Ana-lysing just one sample with the procedure described(extraction, changing the stir bar to the thermodesorptiontube, analysis) takes about 2 h; the simultaneous determi-nation of 10 water samples reduces the analysis time to75 min each. The results of the validation of the SPME and SBSE meth-ods are given in Table 1. The reproducibility of SPME andSBSE under the given conditions is comparable. It there-fore seemed logical to perform the comparison with one100 um PDMS fibre and 10 different stir bars. The recov-eries of SPME for the substances investigated werebetween 6% (lindane) and 44% (benz[a]anthracene),while those for SBSE arranged from 20% (PCB 180) to97%(HCB). The values estimated in the theoretical partfor the equilibrium were between 20 and 100%(SPME) or92 and 100%(SBSE). In the case of acenaphthylene and acenaphthene (logKo/w=4.0), after an extraction time of 1 h equilibrium was Table 1. Validation of the SPME and the SBSE method coupled to GC/MS. Compound Recovery [%] Reproducibility [%]a) Detection limit [ng/L] R2 SPME SBSE SPME SBSE SPME SBSE SPME SBSE Acenaphthylene 23 88 5.9 4.2 0.7 0.1 0.995 0.997 Acenaphthene 20 95 3.0 3.6 1.2 0.2 0.998 0.994 Fluorene 26 90 4.2 2.5 0.2 0.1 0.995 0.998 Phenanthrene 44 84 4.1 2.9 0.1 0.05 0.969 0.997 Anthracene 14 79 4.5 4.3 1.0 0.1 0.994 0.999 Fluoranthene 41 87 6.0 6.2 0.2 0.1 0.995 0.997 Pyrene 41 85 5.8 5.3 0.2 0.1 0.999 0.998 Benz[a]anthracene 45 87 10.2 14.2 0.2 0.1 0.996 0.983 Chrysene 40 86 11.3 10.5 0.2 0.1 0.989 0.988 Benzo[b]fluoranthene 23 70 14.5 17.1 0.3 0.2 0.994 0.959 Benzo[kjf fluoranthene 12 55 14.3 20.5 0.3 0.2 0.993 0.972 Benzo[,apyrene 14 55 12.2 21.7 0.6 0.4 0.994 0.963 Indeno[1,2,3]pyrene 11 32 13.9 18.8 0.8 0.6 0.980 0.970 Benzo[g,h,jperylene 11 29 16.8 21.6 0.8 0.5 0.990 0.969 HCB 14 97 7.8 3.5 0.4 0.1 0.992 0.972 y-HCH 6 80 4.7 4.0 4.5 1.0 0.999 0.999 o,p-DDE 24 73 6.3 5.3 0.2 0.1 0.999 0.990 p,p-DDE 33 67 6.8 5.8 0.2 0.1 1.000 0.990 PCB 28 32 86 7.3 1.9 0.2 0.1 0.995 0.994 PCB 52 31 85 6.4 2.4 0.2 0.1 0.996 0.993 PCB 101 24 68 10.8 4.4 0.2 0.05 1.000 0.990 PCB 153 14 47 12.2 7.4 0.2 0.1 0.999 0.975 PCB 138 15 47 15.5 10.5 0.2 0.05 0.996 0.971 PCB 180 12 20 20.2 14.7 0.2 0.05 0.976 0.976 nearly reached and the recoveries of SPME and SBSEconfirm the theoretical estimation using Formula 1 (33%for SPME, 96% for SBSE).In other cases (e.g. the morehydrophobic PAHs and some PCBs), the extraction yieldsafter an extraction time of 1 h were still far off from equili-brium and so the recoveries were much lower than thevalues calculated for equilibrium. Depending on the recoveries, the baseline noise, theoccurrence of blanks and the response of the MSD for thegiven compound, the detection limits were between0.1 ng/L and 4.5 ng/L for SPME and between 0.05 ng/Land 1.0 ng/L for SBSE. For most of the substances inves-tigated, owing to the increase in recoveries SBSEimproved the detection limit by a factor of 2-3. Linearity was investigated within a range between thedetection limit and 200 ng/L, and the Rvalues werefound to be between 0.963 and 1.000. 4.2 Optimisation and validation of the SPME-LCand the SBSE-LC procedures The desorption procedure for SPME and SBSE usingacetonitrile or an acetonitrile water mixture is described intwo papers [14, 23]. For SPME a desorption time of 5 minwas found to be enough for all the PAHs investigated; in the case of SBSE a desorption time of 10 min was chosen.On the basis of these investigations, a desorption time of10 min was chosen for SPME-SBSE comparison. In the case of SPME, the completeness of desorption waschecked by a triple repetition of the desorption procedure,and the analysis of the three extracts showed a very lowcarryover. The values in the second extract were between0.3% and 1.3%, and after the second desorption stepcarryover was negligible [14]. Because about 99% of thedesorbed sample was found in the first extract, all SPMEinvestigations were performed with only one desorptionstep. The results of the SBSE measurements are given in Fig-ure 3. If the sum of the first, second, and third desorptionis defined as 100%, the proportion of the first desorptionstep is between 75.5 and 84.5%, that of the second isbetween 12.6 and 20.7%, and the proportion of the thirdstep varies between 2.9 and 7.8%. Although one desorp-tion step represents only about 80% of the compoundsextracted, the comparison of the detection limits of SPMEand SBSE was performed thus because the experimentaleffort of SPME and SBSE needed to be the same. Employing an extraction time of 1 h, 10 min desorptiontime, one desorption step and injecting 10% of the Figure 3. Extraction yield of SBSE·E-LC nmeasurementdepending on the number of extractions. extracts, calibration curves were calculated for 15 of theEPA-PAHs and the detection limits of both procedureswere estimated (cf. Table 2). After the extraction of HPLCwater at the retention times of naphthalene, fluorene,phenanthrene, and fluoranthene, peak areas were meas-ured. The detection limits of these compounds were calcu-lated as described in Section 4.1. For the other com-pounds the detection limit was calculated using the 3o cri-terion. Recoveries were determined by the GC/MS proce-dure (see Table 1). The only difference from these valuesis that, owing to limitation to one desorption step, theSBSE values are lower by about 20%. The detection limitsof the SPME procedure were between 1.0 and 10.0 ng/L,and between 0.3 and 2.0 ng/L in the case of SBSE. Fig-ure 4 shows chromatograms of SPME and SBSE at theconcentration level 8 ng/L. It can be seen that the peak Table 2. Comparison of the detection limits of SPME/LC andSBSE/LC. Compound SPME-LC SBSE-LC [ng/L] [ng/L] Naphthalene 5.0 2.0 Acenaphthene 2.0 1.0 Fluorene 3.0 1.0 Phenanthrene 1.0 0.5 Anthracene 2.0 0.8 Fluoranthene 2.0 0.5 Pyrene 2.5 1.0 Benz[a]anthracene 1.5 0.3 Chrysene 2.0 0.5 Benzo[b]fluoranthene 2.0 0.5 Benzo[k]fluoranthene 0.3 Benzo[a]pyrene 0.3 Dibenz[a,h]anthracene 5.0 0.8 Benzo[g,h,jperylene 6.0 1.0 Indeno[1,2,3]pyrene 10.0 1.0 areas of the compounds in the SBSE chromatogram are3-to 10-fold those of the SPME chromatogram. 5 Conclusions Comparison of the above procedures applied to the deter-mination of semi-volatile compounds in water shows: -SPME and SBSE in combination with GC/MS or LCare solvent-free or almost solvent free procedures,obviating the need for further sample preparationsteps; - One advantage of SPME is the possibility of full auto-mation; at present SBSE cannot yet be completelyautomated: Figure 4. LC chromatogram of aspiked HPLC water sample (cali-bration level 8 ng/L) using SPMEand SBSE from a 10 mL sample. -LUsing SPME, adsorption losses of compounds on theTeflon or glass-coated stirrer are possible; in the caseof SBSE the PDMS-coated stirrer is the active ele-ment -adsorptive losses on the stirrer are avoided; -EBecause of the lower phase ratio (volume of the waterphase to the volume of the PDMS phase), SBSEresults in higher recoveries and lower detection limitsthan SPME. References ( [1] M. B iziuk, A. Pryjazny, J. Czerwinski, M. W iergowski, J . C hromatogr. A 1996, 754, 103. ) ( [2] J.J. Vreuls, U.A.Th. Brinkman, G.J. de Jong, K. G rob, A.Artho,J. High Resol. Chromatogr. 1991, 1 4,455. ) ( [3] EE.R. Brouwer, A .N.J. Hermans, H. H ingeman, U.A.Th.Brinkman, J. Chromatogr.A 1994,45, 669. ) ( [4] A.J.H. Louter,J.J. Vreuls, U.A.Th. Brinkman, J. Chromatogr. A1999,842,391. ) ( [5] B. Kolb, J. Chromatogr.A1999, 842, 163. ) ( [6] T. Huysbrechts, J. Dewulf, O. Moerman, H. van Langen-hove, J. Chromatogr.A 2000, 893,367. ) ( [7] R.G. B elardi, J. Pawliszyn, W ater Pollut. R es. J. C an. 1989, 24,179. ) ( [8] D C .S. Lough, S . Motlagh, J. Pawliszyn, Anal. Chem. 1992, 64,1187. ) ( [9] JJ. Pawliszyn, Solid Phase Microextraction, T h eory and Prac- tice. Wiley-VCH,New York 1997. ) ( [10] H. Lord, J. Pawliszyn, J . Chromatogr.A 2000,885,153. ) ( [11] J.Chen,J.B. Pawliszyn, Anal. Chem. 1995,67,2530. ) ( [12] M. Moder, P. Popp,J. Pawliszyn, J. Microcol. Sep.1998,10, 225. ) ( [13] M. M oder, P. Popp, R . E i sert, J. P awliszyn, F resenius’J. Anal. Chem. 1999. 363.680. ) ( [14] P. Popp,C. Bauer, M. Moder, A. Paschke, J. Chromatogr. A 2000,897,153. ) ( [15] K. Grob,A. Habich,J. Chromatogr. A1985, 321, 45. ) ( [16] B .V. Burger, Z. Munro, J. Chromatogr.A1986,370,449. ) ( [17] C . Bicchi, A. D'Amato, F . David, P. Sandra, Flavor Flagr. J.1988,3,143. ) ( [18] S. Blomberg, J.Roerade, J . High Resol. Chromatogr. 1 988, 11,457. ) ( [19] E . Baltussen, H.-G. Janssen, P. Sandra, C . A. C r amers, J.High Resol.Chromatogr. 1997,20,385. ) [20] E. Baltussen, H.-G. Janssen, P. Sandra, C.A. Cramers, J.High Resol. Chromatogr. 1997, 20,395. [21] E. Baltussen, F. David, P. Sandra,H.-G. Janssen,C.A. Cra-mers,J. Chromatogr.A1998,805,237. ( [22] E. Baltussen, P. Sandra, F . David, C. Cramers, J. Microcol.Sep.1999, 11,737. ) ( [23] P. Popp, C. Bauer, L. Wennrich, Anal. Chim. Acta 2001, 436, 1. ) ( [24] DC.Mackay,W.Y. Shi u , Eds., Illustrated handbook of physi-cal-chemical properties of environmental fate of organicchemicals. L ewis Publishers: Boca Raton, FL, 1 9 92, Vol. 1 and Vol. 2. ) ( [25] A. Paschke, P. P opp, G. Schuurmann, Fresenius’J. Anal. Chem. 1999, 363,4. ) ( [26] L. Wennrich, P . P opp, J. B reuste, C hromatographia 2001, 53,380. ) 对饮用水和饮料中的多环芳烃使用SBSE-TD-GC/MS搅拌棒吸附萃取联合热脱附和质谱联用分析,可以得到极低的检测下限,非常高的可重复性,并且无需溶剂,所需样品体积小,即环保又经济! 18种多环芳烃标样化合物回收率更高首先看一下与SPME相比,对加标的水样中18种PAH的萃取回收率[1]。比较条件:加标水样都是10毫升;SBSE和SPME都是浸入式萃取60分钟(此处SPME需要额外搅拌棒,而SBSE则自带搅拌功能);SBSE和SPME都是使用PDMS吸附层,SBSE吸附层体积24微升(这是SBSE搅拌棒的最小吸附体积),SPME吸附层体积0.5微升(这是SPME纤维头可含的最大吸附体积)。 萃取结果如下。 事实证明,SBSE由于其更大的吸附层和主动的搅拌萃取模式,对18种PAHs的萃取回收率,远远高于SPME法。对18种多环芳烃的萃取回收率对比检测限更低自然的,检测下限也就更低。。。萃取条件同上对18种多环芳烃的检测下限对比更高的可重复性以下是15次重复试验得到的RSD数据[2],其中SBSE使用的样品浓度为100ppt, SPME使用的样品浓度为2ppb (2000ppt), 样品浓度是根据每个检测技术的最低检测下限来选择的。可见SBSE拥有更好的可重复性,加上其牢固的设计和可重复使用的特性,使其更适合于常规检测。 适用的样品SBSE技术使用的是Twister搅拌棒来完成萃取工作, Twister是一个表面包裹有吸附层的磁力搅拌棒。如下图所示:SBSE技术中所用到的TwisterTwister最适合的样品就是液态样品,因为它可以边搅拌,边主动萃取样品中的化合物,萃取效率最高。当然Twister也可以用来顶空萃取,但是由于是被动萃取,所以萃取效率较浸入式萃取略逊一筹。同样的道理也是为什么SPME对液体样品的萃取不如SBSE,因为SPME主要用于顶空萃取,属于被动萃取。 而液体样品也不光是水样,饮料,酒类这些本身是液态的,而是更多的可能性,如:可以与水混合的:如奶粉,酸奶,水果压榨后的汁水,各种食品如粽子,月饼,咸蛋等使用溶剂萃取后的萃取液,取部分再加水混合,如:蔬菜,水果,土壤等使用QuEChERS净化技术后的萃取液:如蔬菜,水果等萃取原理为什么对于多环芳烃,SBSE较SPME而言是最佳的选择? SBSE较之SPME而言,增加了50-250倍的吸附相的体积,并且通过搅拌加快萃取的效率,所以萃取能力可至SPME的1000倍。根据回收率的公式,在样品体积不变的情况下,萃取层的体积越大,回收率就越高。下图是SBSE和SPME的理论回收率,横坐标是化合物的logKow辛醇-水的分配系数常用对数值。我们可以根据LogKow的大小来大致判定化合物的极性,LogKow 越小,化合物的极性就越高。一般而言,LogKow小于4的化合物属于极性化合物,LogKow大于4的化合物属于中极性到非极性化合物。很自然的非极性的吸附层PDMS对极性化合物的回收率低。下图中,SPME对LogKow大于7的化合物,可以达到100%的回收率,而SBSE通过增大的吸附相的优势,弥补了对中极性化合物的低回收率,对于LogKow小于7的化合物,SBSE比SPME更敏感,而多环芳烃PAHs的LogKow约在3-7之间,固SBSE较SPME而言是最佳的选择。同样的原理,由于SBSE是目前无溶剂萃取层技术中所含萃取层最大的,所以在相同的萃取条件下,SBSE的灵敏度最高。再加上是浸入式搅拌的主动萃取,所以萃取效率更高。例子:可口可乐使用SBSE技术,检测可口可乐的水源,被处理后的水和装瓶后的饮料中的各类污染物,有机氯农药,有机磷农药,多氯联苯,拟除虫菊酯,苯酚,以及其他目标分析物的定量浓度在8-100 ng/L (ppt级别), 多环芳烃在0.4 - 5 ng/L,塑化剂 0.08 -1 µg/L (ppb级别)。使用SBSE技术,多环芳烃的线性非常好,重现性高,平均标准偏差仅为 5.82 %, 平均回收率为101.6% 。 此方法于2010年10月被可口可乐比利时欧洲管理中心所采用。参考文献:[1] P. Popp, C. Bauer, B. Hauser, P. Keil, L. Wennrich, Extraction of polycyclic aromatichydrocarbons and organochlorine compounds from water: A comparison betweensolid-phase microextraction and stir bar sorptiveextraction,J. Sep. Sci. 26 (2003) 961-967[2] Gerstel AppNote: 08/2001
确定


还剩5页未读,是否继续阅读?

产品配置单
GERSTEL(哲斯泰)为您提供《饮用水,饮料中多环芳烃检测方案(其它萃取设备)》,该方案主要用于包装饮用水中环境污染物检测,参考标准--,《饮用水,饮料中多环芳烃检测方案(其它萃取设备)》用到的仪器有GERSTEL 搅拌棒Twister (萃取、固相微萃取)
推荐专场

该厂商其他方案
更多