


BET法测比表面时,只需注意准确称量和复核样品质量,将数值填写到软件中,系统就可以进行计算。实验过程全部通过电脑控制,不仅操作简单、易于上手,还能最大程度的保证实验的精确度,避免了操作误差。对于传统水泥工艺改进和来料检测等项目而言,部门要进行大量实验,需要高效与准确度兼备,BET法测比表面积的优势就不言而喻了。
方案详情

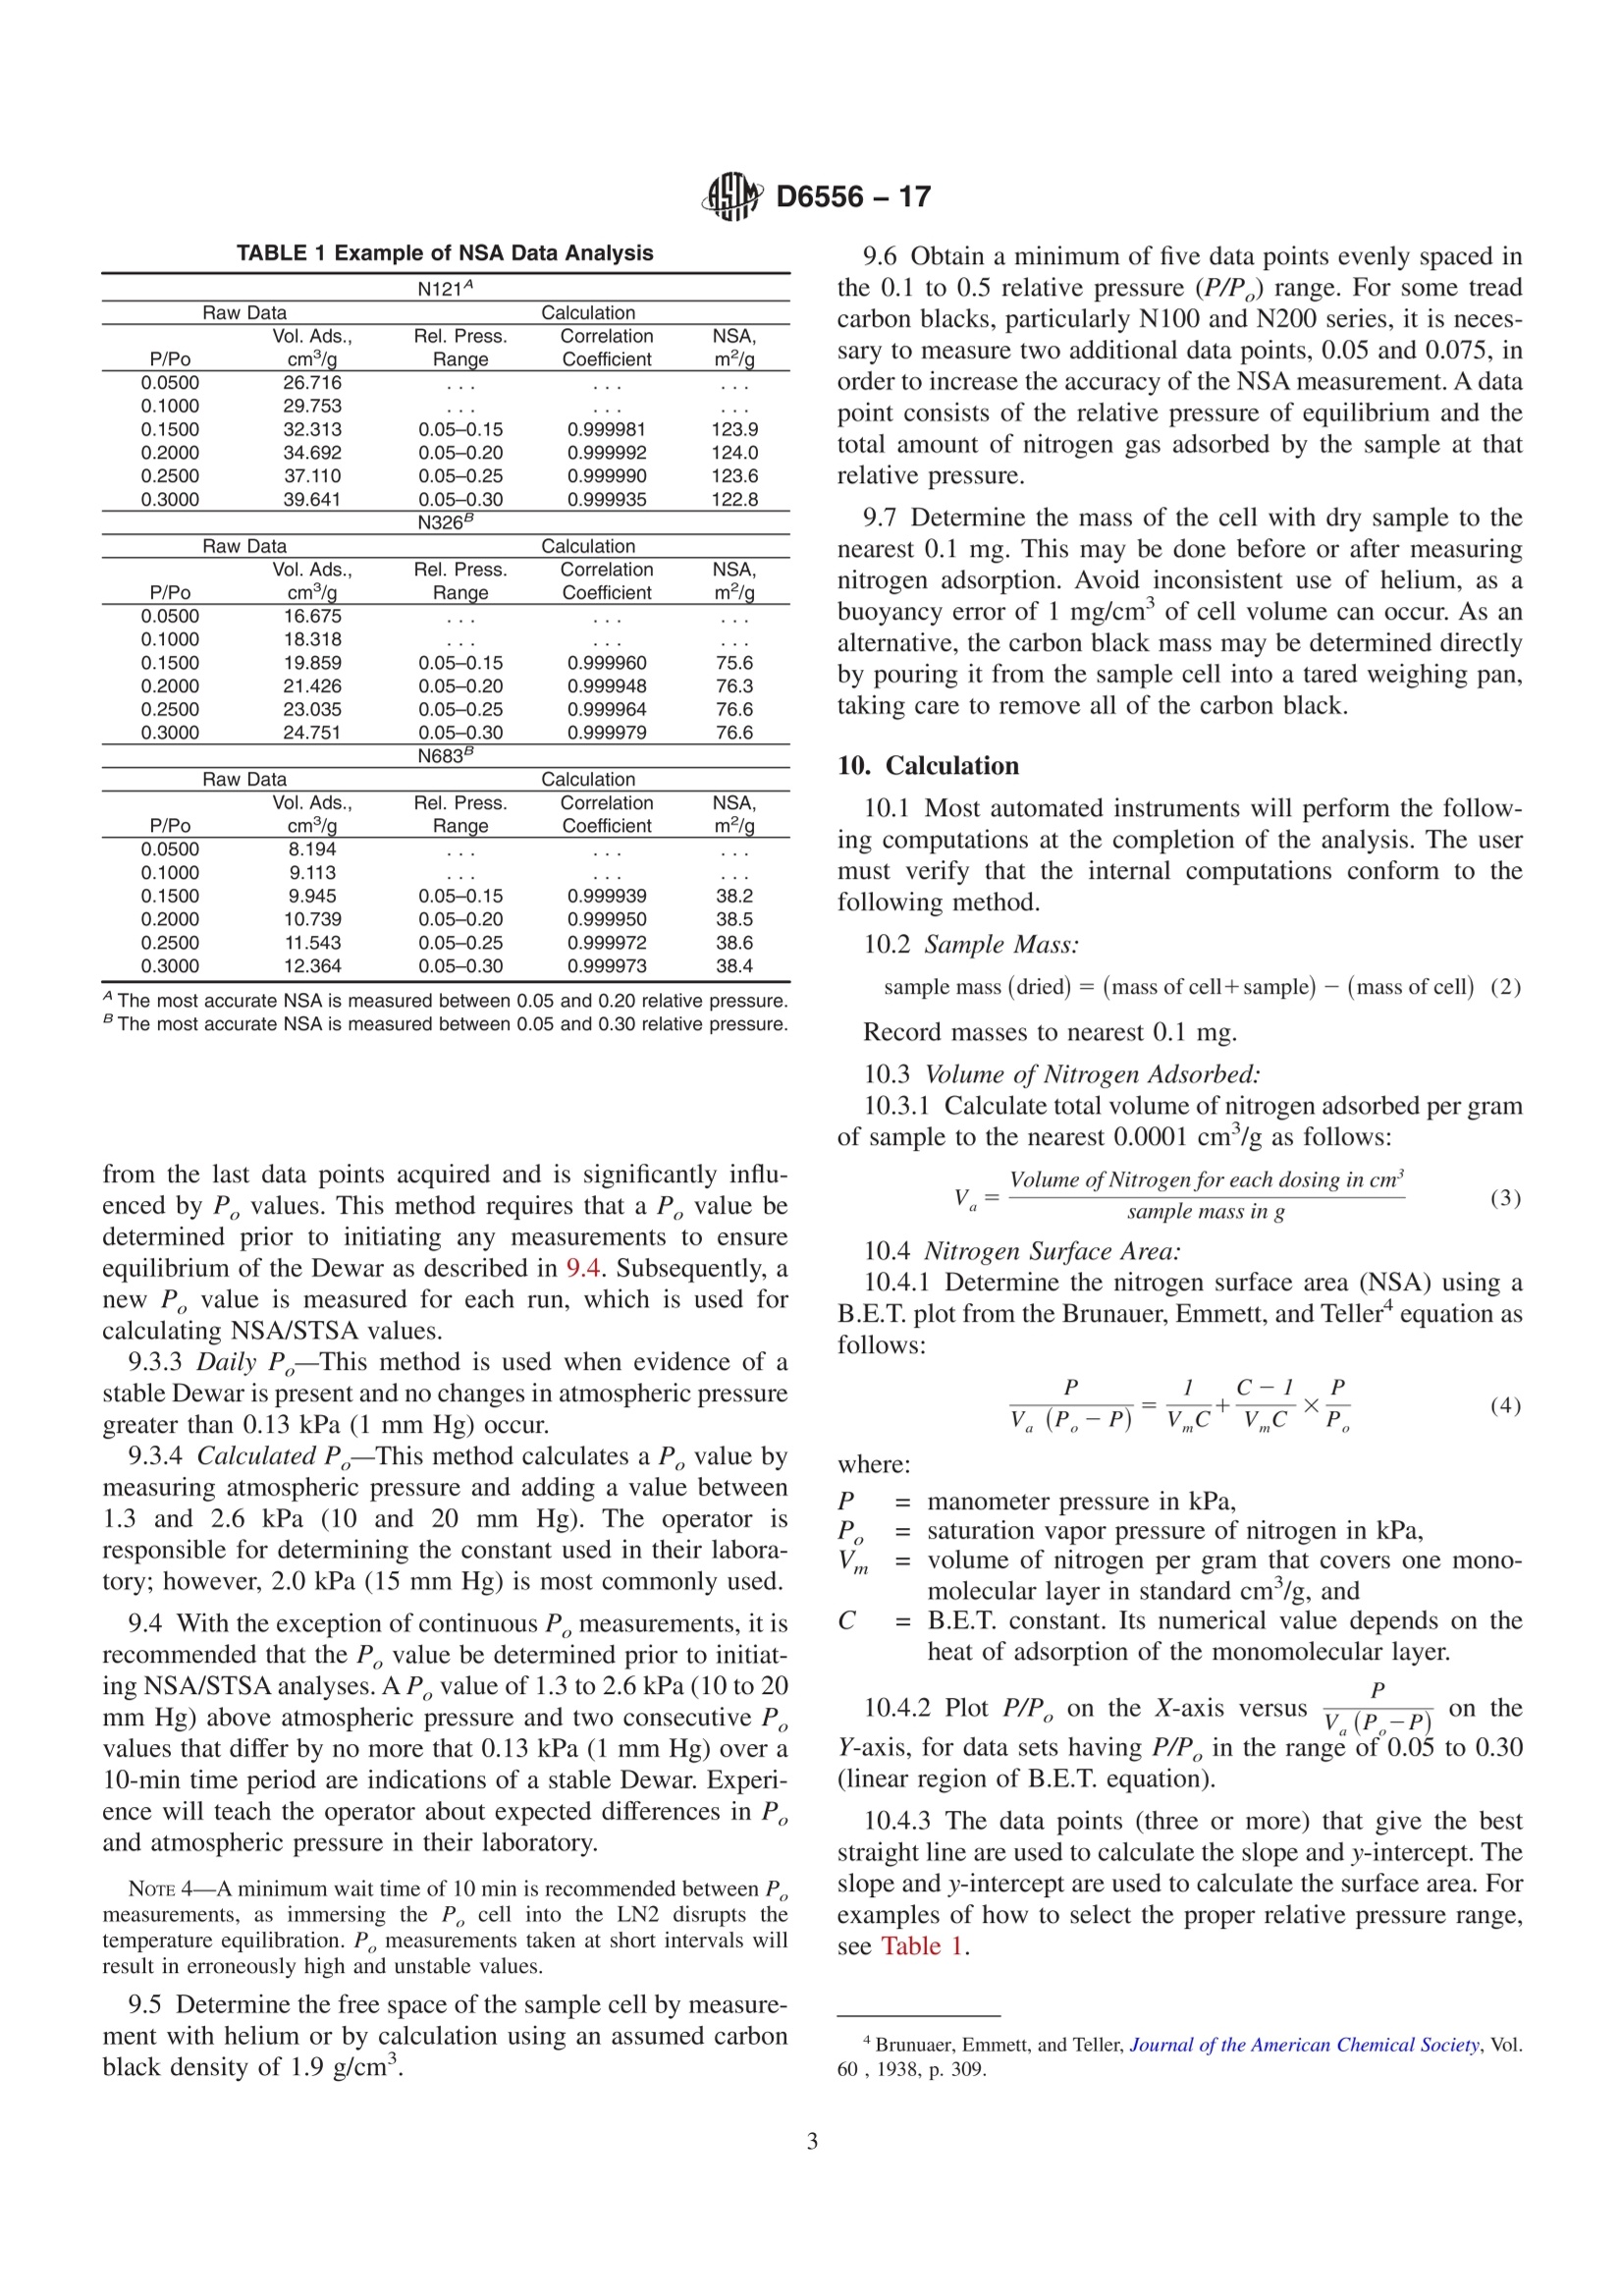
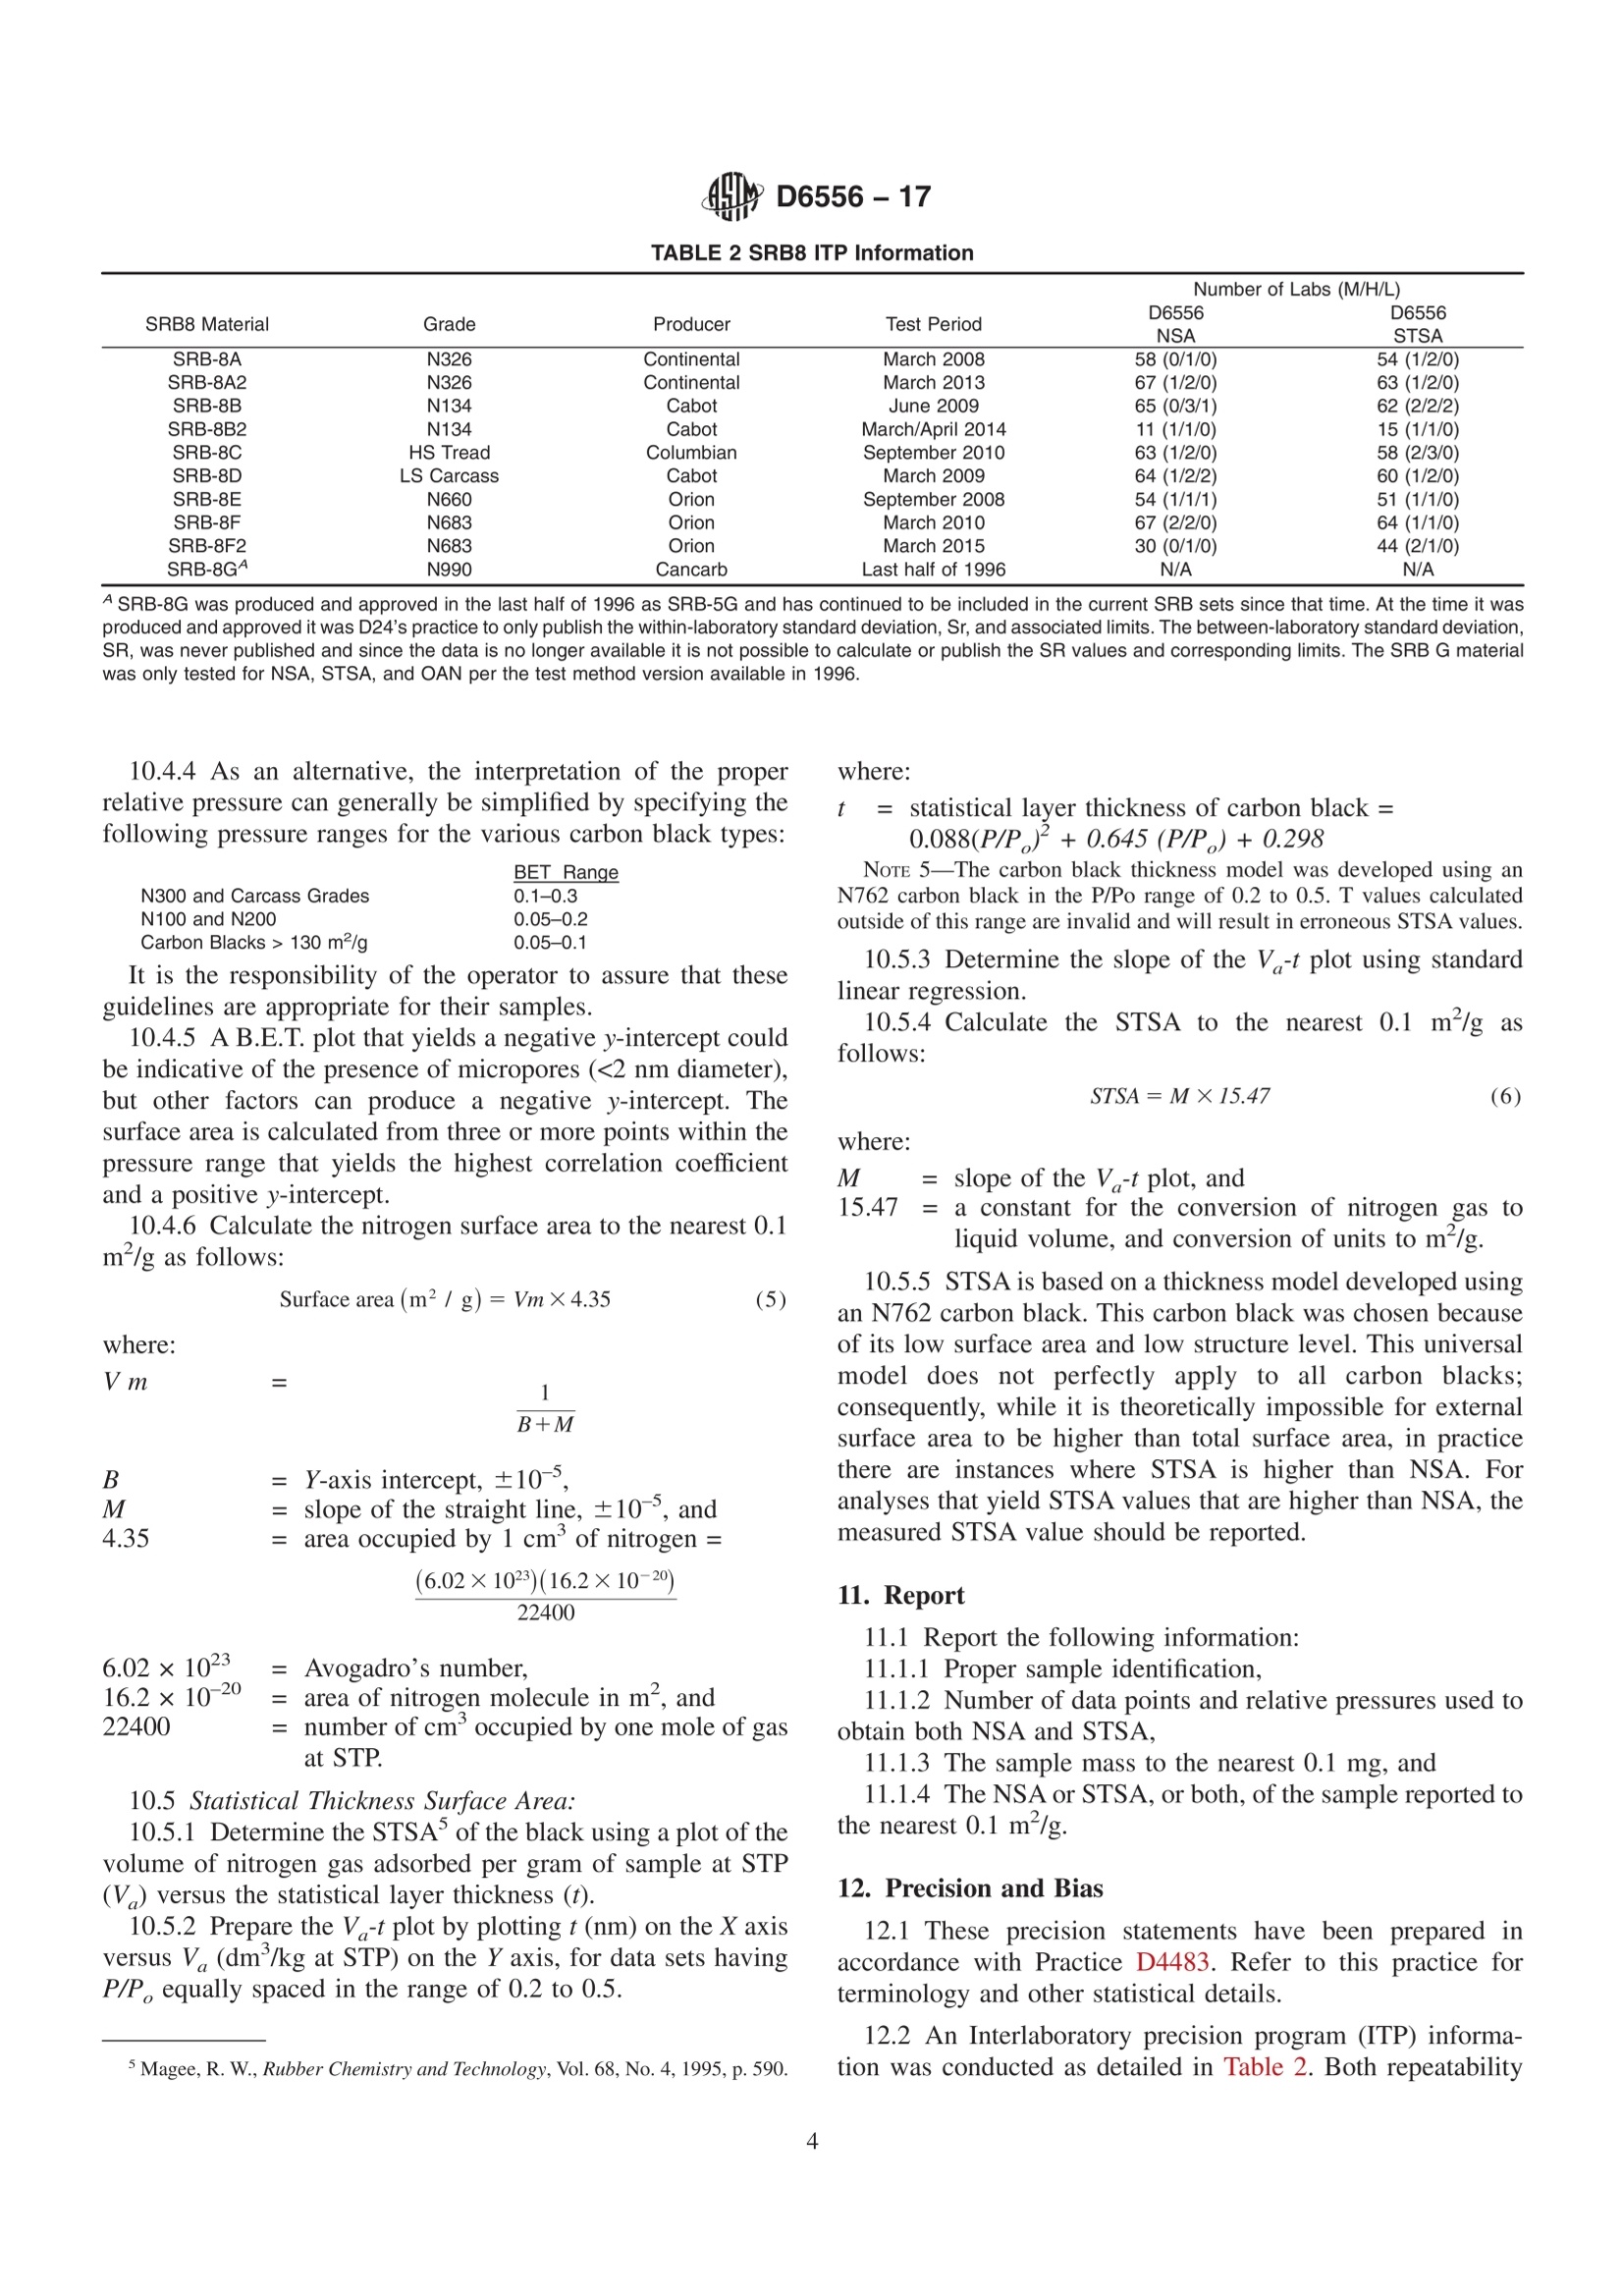
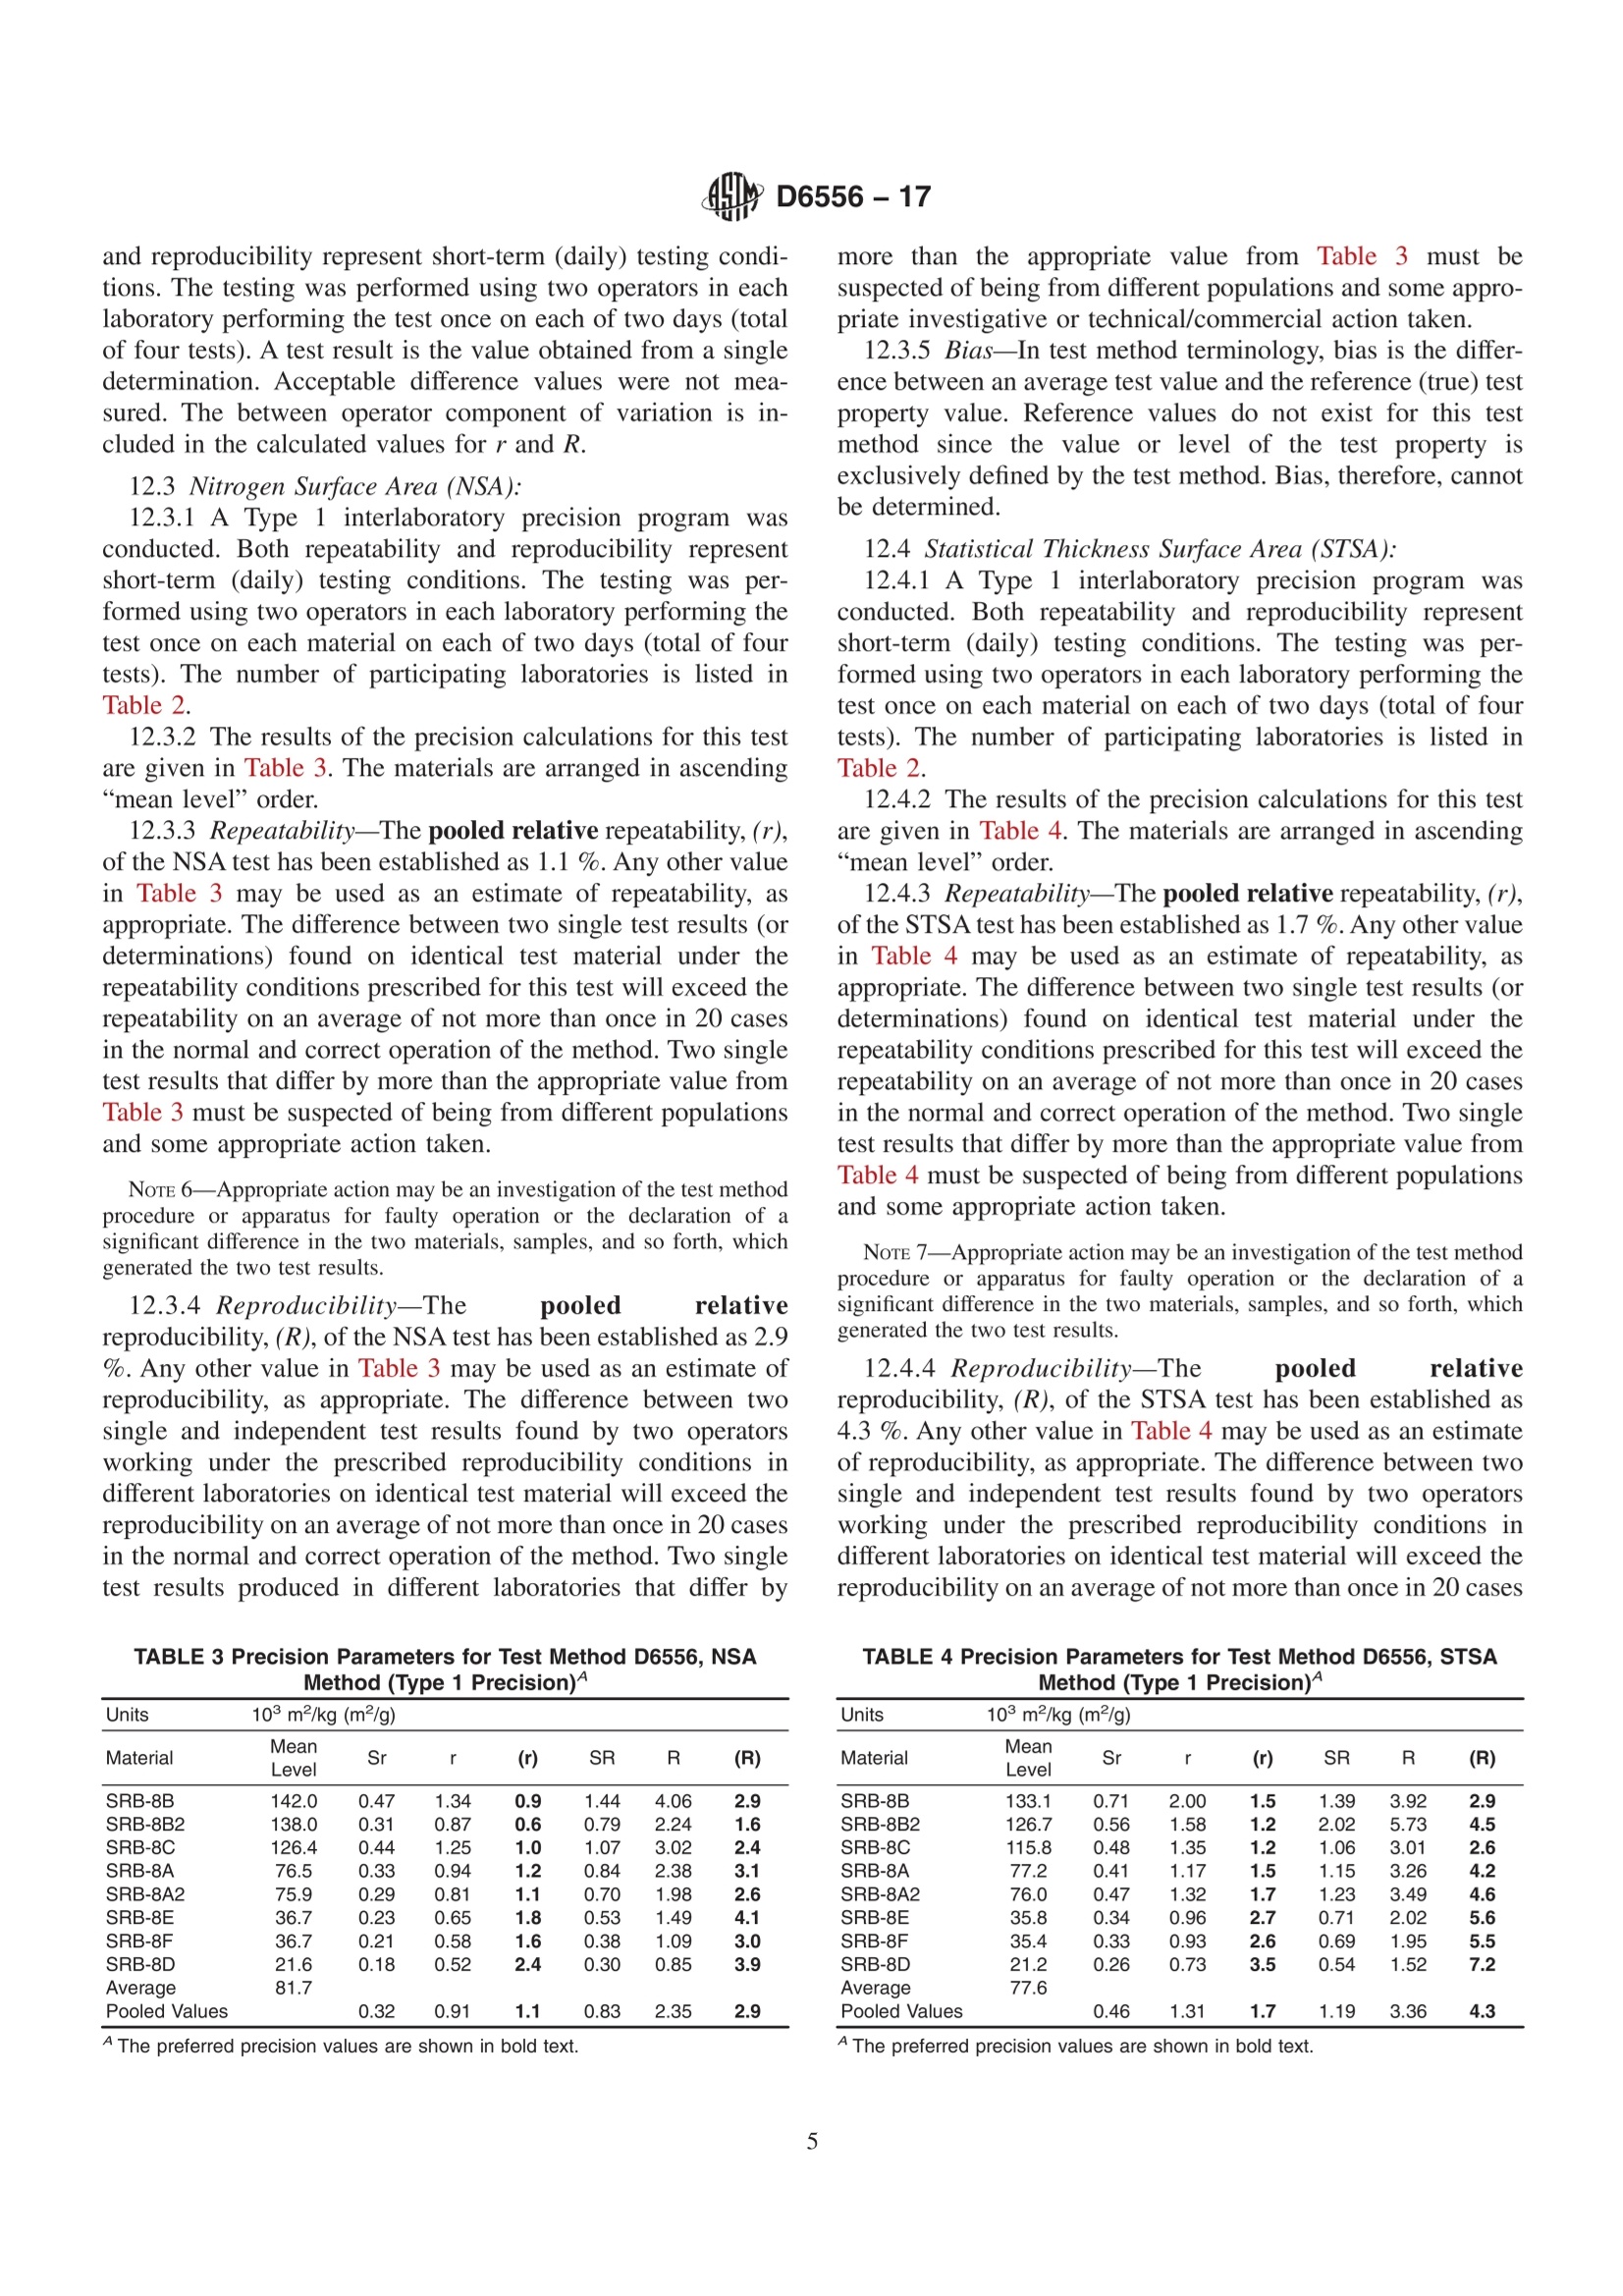
This international standard was developed in accordance with internationally recognized principles on standardization established in the Decision on Principles for theDevelopment of International Standards, Guides and Recommendations issued by the World Trade Organization Technical Barriers to Trade (TBT) Committee. 4ly D6556-17 Designation: D6556-17 INTERNATIONAL Standard Test Method forCarbon Black—Total and External Surface Area by NitrogenAdsorption' This standard is issued under the fixed designation D6556; the number immediately following the designation indicates the year oforiginal adoption or, in the case of revision, the year of last revision. A number in parentheses indicates the year of last reapproval. Asuperscript epsilon (e) indicates an editorial change since the last revision or reapproval. 1. Scope 1.1 This test method covers the determination of the totalsurface area by the Brunauer, Emmett, and Teller (B.E.T. NSA)theory of multilayer gas adsorption behavior using multipointdeterminations and the external surface area based on thestatistical thickness surface area method. 1.2 The values stated in SI units are to be regarded as thestandard. The values given in parentheses are for informationonly. 1.3 This standard does not purport to address all of thesafety concerns, if any, associated with its use. It is theresponsibility of the user of this standard to establish appro-priate safety, health, and environmental practices and deter-mine the applicability of regulatory limitations prior to use.(The minimum safety equipment should include protectivegloves, sturdy eye and face protection). 1.4 This international standard was developed in accor-dance with internationally recognized principles on standard-ization established in the Decision on Principles for theDevelopment of International Standards, Guides and Recom-mendations issued by the World Trade Organization TechnicalBarriers to Trade (TBT) Committee. 2. Referenced Documents 2.1 ASTM Standards: D1799 Practice for Carbon Black—Sampling PackagedShipments D1900 Practice for Carbon Black—Sampling Bulk Ship-ments ( T h is t e s t m et h od is u nder the jurisdi c tion o f ASTM Co m mittee D 2 4 o n Carb o n B lac k a nd i s t he dir e ct r e sponsibili t y o f Subcommitte e D24.21 on Carbon B lac kS urface Area a nd Rel a ted Propertie s . ) ( Current e dition a p proved Oc t . 1 , 20 17. Published Nove m ber 2017. Origi n al l y a pproved i n 2 00 0 . L a st previous edition approved in 2016 as D6556- 16 . D O I:10.15 2 0/D6 5 56-17. ) For referenced ASTM standards, visit the ASTM website, www.astm.org, orcontact ASTM Customer Service at service@astm.org. For Annual Book of ASTMStandards volume information, refer to the standard’s Document Summary page onthe ASTM website. 3. Summary of Test Method 3.1 The total and external surface areas are measured byevaluating the amount of nitrogen adsorbed, at liquid nitrogentemperature, by a carbon black at several partial pressures ofnitrogen. The adsorption data is used to calculate the NSA andSTSA values. 4. Significance and Use 4.1 This test method is used to measure the total andexternal surface area of carbon blacks based on multipointnitrogen adsorption. The NSA measurement is based on theB.E.T. theory and it includes the total surface area, inclusive ofmicropores, pore diameters less than 2 nm (20 A). The externalsurface area, based on the statistical thickness method (STSA),is defined as the specific surface area that is accessible torubber. 4.2 CTAB Surface Area (formerly Test Method D3765) hasbeen withdrawn. The CTAB value may be estimated from theSTSA value using Eq 1. The equation is based on a linearregression of the STSA and CTAB measured values of the SRB5 standards. 5. Apparatus 5.1 Multipoint Static-Volumetric Gas Adsorption Apparatus,with Dewar flasks and all other accessories required foroperation. 5.2 Sample Cells, that when attached to the adsorptionapparatus, will maintain isolation of the sample from theatmosphere equivalent to a helium leak rate of <10-5cm’/min,per atmosphere of pressure difference. ( T he l a st a pp roved v e rs i on of t hi s hi s t orical s ta n d ard is r e fer e nced onw w w . astm.o r g. ) 5.3 Balance, Analytical, with 0.1 mg sensitivity. 5.4 Heating Mantle or Equivalent, capable of maintaining atemperature of 300 ±10°C. 5.5 Oven, Gravity Convection, capable of maintaining atemperature of 125 ±10C. 6. Reagents 6.1 Liquid Nitrogen, 98 % or higher purity. 6.2 Ultra-High Purity Nitrogen Gas, cylinder or othersource of prepurified nitrogen gas. 6.3 Ultra-High Purity Helium Gas, cylinder or other sourceof prepurified helium gas. 7. Sampling 7.1 Samples may be taken in accordance with PracticesD1799 and D1900. 8. Sample Preparation Procedure 8.1 Dry a portion of carbon black at 125°C for 1 h. If thecarbon black is known to be substantially free of moisture, orsubsequent preparation steps are known to be adequate formoisture removal, then this step may be omitted. 8.2 Condition an empty sample cell for a minimum of 10min at the same conditions intended for degassing the sample.Weigh the empty sample cell to the nearest 0.1 mg and recordthe mass. 8.3 Weigh approximately 0.4 g of the carbon black into thesample cell. NoTE 1-For carbon black powder samples, add enough carbon blackto give a depth of approximately 2 in. in straight wall sample tubes, orapproximately 0.4 g for bulb-type sample cells. 8.4 Flow Degassing: 8.4.1 Open the gas control valve and insert the delivery tubeinto the sample tube, and allow purging with either helium ornitrogen for a minimum of 1 min. 8.4.2 Place a heating mantle or other source of heat aroundthe sample cell and degas the sample at 300 ±10℃ for V2 hor longer to ensure that all traces of moisture condensing in thetop of the tube are absent. The minimum degassing time thatgives a stable surface area (that is, a surface area that does notincrease with additional degassing) may be used for degassing. NoTE 2—For carbon blacks at their moisture pickup equilibrium, likestandard reference blacks, longer degassing times likely will be requiredin order to achieve stable results. It has been found that for SRB B8 andSRB C8, it is necessary to extend the degassing time to at least 60 min inorder to reliably obtain the target NSA and STSA values. This may be truefor other high structure and high porosity carbon blacks. 8.4.3 Once thettypical degassingtimeshave beendetermined, future samples can be degassed on the basis oftime alone, if desired, allowing a reasonable margin of excesstime. Some samples will be found to require less than V h,especially if moisture exposure has been minimal. In thesecases, the minimum time that gives a stable surface area maybe used for degassing. 8.4.4 After degassing, the sample tube may be moveddirectly to the analyzer. Otherwise, remove the sample tube from the heat source and continue the flow of purging gas untilit is ready for analysis. 8.4.5 Go directly to Section 9 and continue the remainingsteps of the procedure. 8.5 Vacuum Degassing: 8.5.1 With the apparatus at atmospheric pressure, place thesample cell containing the carbon black onto the degassingapparatus. 8.5.2 Begin the degassing procedure as appropriate for theapparatus. 8.5.3 Place a heating mantle or other source of heat aroundthe sample cell and degas the sample at 300 ±10°℃ for V2 hor longer as required to obtain and hold a pressure less than 1.4Pa (10 um Hg). NoTE 3-Attention! One-half hour vacuum degassing may be inad-equate for some grades and may result in statistically different results toflow degassing. 8.5.4 Once the typical degassing times have beendetermined, future samples can be degassed on the basis oftime alone, if desired, allowing a reasonable margin of excesstime. Some samples will be found to require less than V h,especially if moisture exposure has been minimal. In thesecases, the minimum time that gives a stable surface area maybe used for degassing (see Note 2). 8.5.5 Go directly to Section 9 and continue the remainingsteps of the procedure. 9.Measurement Procedure 9.1 Refer to the user’s manual or specific instructions for themultipoint gas adsorption analyzer to be used, and becomethoroughly familiar with the procedures. Ther)ce(e are numerousinstruments available that offer a variety of saturation vaporpressure (P) measurement options and Dewar sizes. 9.2 Fill the Dewar with liquid nitrogen (LN2) and allow it toreach temperature equilibrium. The Dewar should be refilledapproximately once per hour or between each analysis. Thetime required to reach equilibrium is dependent upon Dewarsize and quality. 9.2.1 Small Dewar (<1 L)-Fill and cover the Dewar for aminimum of 2 h prior to use. The Dewar should be cleaned anddried at the end of each day. 9.2.2 Large Dewar (>1L)-Fill and cover the Dewar for aminimum of 16 h prior to use, unless continuous P measure-ments are employed. For continuous P, use a 2-h Dewarequilibration. Once equilibration is reached, a large Dewar canmaintain this equilibration for several days if kept filled andcovered. The cleaning frequency is left to the discretion of theoperator, but is not to exceed once per week. 9.3 Following is a list of P, measurement options: 9.3.1 Continuous P,(measurement at each relative pressurepoint)-This method is considered the best practice. Whenavailable with the instrument and software package, it isrecommended to use this option. 9.3.2 Single P。 Per Analysis-Although this value can bemeasured before, during, or after the run, a P, value measuredat the end of the analysis is preferred, since STSA is calculated TABLE 1 Example of NSA Data Analysis N121A Raw Data Calculation Vol. Ads., Rel. Press. Correlation NSA, P/Po cm/g Range Coefficient m²/g 0.0500 26.716 ... ... ... 0.1000 29.753 ... ... 0.1500 32.313 0.05-0.15 0.999981 123.9 0.2000 34.692 0.05-0.20 0.999992 124.0 0.2500 37.110 0.05-0.25 0.999990 123.6 0.3000 39.641 0.05-0.30 0.999935 122.8 N326B Raw Data Calculation Vol. Ads.. Rel. Press. Correlation NSA. P/Po cm/g Range Coefficient m2/g 0.0500 16.675 ... ... ... 0.1000 18.318 ... ... 0.1500 19.859 0.05-0.15 0.999960 75.6 0.2000 21.426 0.05-0.20 0.999948 76.3 0.2500 23.035 0.05-0.25 0.999964 76.6 0.3000 24.751 0.05-0.30 0.999979 76.6 N683 Calculation Raw Data Vol. Ads., Rel. Press. Correlation NSA. P/Po cm/g Range Coefficient m²/g 0.0500 8.194 ... ... ... 0.1000 9.113 ... ... ... 0.1500 9.945 0.05-0.15 0.999939 38.2 0.05-0.20 0.999950 38.5 0.05-0.30 0.999973 38.4 The most accurate NSA is measured between 0.05 and 0.20 relative pressure.The most accurate NSA is measured between 0.05 and 0.30 relative pressure. from the last data points acquired and is significantly influ-enced by P,values. This method requires that a P。 value bedetermined prior to initiating any measurements to ensureequilibrium of the Dewar as described in 9.4. Subsequently, anew P. value is measured for each run, which is used forcalculating NSA/STSA values. 9.3.3 Daily P.-This method is used when evidence of astable Dewar is present and no changes in atmospheric pressuregreater than 0.13 kPa (1 mm Hg) occur. 9.3.4 Calculated P,-This method calculates a P, value bymeasuring atmospheric pressure and adding a value between1.3 and 2.6 kPa (10 and 20 mm Hg). The operator isresponsible for determining the constant used in their labora-tory; however, 2.0 kPa (15 mm Hg) is most commonly used. 9.4 With the exception of continuous P, measurements, it isrecommended that the P value be determined prior to initiat-ing NSA/STSA analyses. A P, value of 1.3 to 2.6 kPa (10 to 20mm Hg) above atmospheric pressure and two consecutive P,values that differ by no more that 0.13 kPa (1 mm Hg) over a10-min time period are indications of a stable Dewar. Experi-ence will teach the operator about expected differences in P,and atmospheric pressure in their laboratory. NoTE 4—A minimum wait time of 10 min is recommended between Pmeasurements, as immersing the P, cell into the LN2 disrupts thetemperature equilibration. P,measurements taken at short intervals willresult in erroneously high and unstable values. 9.5 Determine the free space of the sample cell by measure-ment with helium or by calculation using an assumed carbonblack density of 1.9 g/cm. 9.6 Obtain a minimum of five data points evenly spaced inthe 0.1 to 0.5 relative pressure (P/P,) range. For some treadcarbon blacks, particularly N100 and N200 series, it is neces-sary to measure two additional data points, 0.05 and 0.075, inorder to increase the accuracy of the NSA measurement. A datapoint consists of the relative pressure of equilibrium and thetotal amount of nitrogen gas adsorbed by the sample at thatrelative pressure. 9.7 Determine the mass of the cell with dry sample to thenearest 0.1 mg. This may be done before or after measuringnitrogen adsorption. Avoid inconsistent use of helium, as abuoyancy error of 1 mg/cm’ of cell volume can occur. As analternative, the carbon black mass may be determined directlyby pouring it from the sample cell into a tared weighing pan,taking care to remove all of the carbon black. 10. Calculation 10.1 Most automated instruments will perform the follow-ing computations at the completion of the analysis. The usermust verify that the internal computations conform to thefollowing method. 10.2 Sample Mass: sample mass (dried)= (mass of cell+ sample) - (mass ofcell) (2)Record masses to nearest 0.1 mg. 10.3 Volume of Nitrogen Adsorbed: 10.3.1 Calculate total volume of nitrogen adsorbed per gramof sample to the nearest 0.0001 cm /g as follows: 10.4 Nitrogen Surface Area: 10.4.1 Determine the nitrogen surface area (NSA) using aB.E.T. plot from the Brunauer, Emmett, and Tellert equation asfollows: where: P= manometer pressure in kPa,P = saturation vapor pressure of nitrogen in kPa, = volume of nitrogen per gram that covers one mono-molecular layer in standard cm/g, and C =: B.E.T. constant. Its numerical value depends on theheat of adsorption of the monomolecular layer. P10.4.2 Plot P/P, on the X-axis versus.ayY-axis, for data sets having P/P, in the range of 0.05 to 0.30(linear region of B.E.T. equation). 10.4.3 The data points (three or more) that give the beststraight line are used to calculate the slope and y-intercept. Theslope and y-intercept are used to calculate the surface area. Forexamples of how to select the proper relative pressure range,see Table 1. Number of Labs (M/H/L) SRB8 Material D6556 D6556 Grade Producer Test Period NSA STSA SRB-8A N326 Continental March 2008 58 (0/1/0) 54 (1/2/0) SRB-8A2 N326 Continental March 2013 67 (1/2/0) 63 (1/2/0) SRB-8B N134 Cabot June 2009 65 (0/3/1) 62(2/2/2) SRB-8B2 N134 Cabot March/April 2014 11 (1/1/0) 15 (1/1/0) SRB-8C HS Tread Columbian September 2010 63(1/2/0) 58 (2/3/0) SRB-8D LS Carcass Cabot March 2009 64 (1/2/2) 60(1/2/0) SRB-8E N660 Orion September 2008 54 (1/1/1) 51 (1/1/0) SRB-8F N683 Orion March 2010 67(2/2/0) 64(1/1/0) SRB-8F2 N683 Orion March 2015 30 (0/1/0) 44 (2/1/0) SRB-8GA N990 Cancarb Last half of 1996 N/A N/A ^SRB-8G was produced and approved in the last half of 1996 as SRB-5G and has continued to be included in the current SRB sets since that time. At the time it wasproduced and approved it was D24's practice to only publish the within-laboratory standard deviation, Sr, and associated limits. The between-laboratory standard deviation,SR, was never published and since the data is no longer available it is not possible to calculate or publish the SR values and corresponding limits. The SRB G materialwas only tested for NSA, STSA, and OAN per the test method version available in 1996. 10.4.4 As an alternative, the interpretation of the properrelative pressure can generally be simplified by specifying thefollowing pressure ranges for the various carbon black types: BET Range It is the responsibility of the operator to assure that theseguidelines are appropriate for their samples. 10.4.5 A B.E.T. plot that yields a negative y-intercept couldbe indicative of the presence of micropores (<2 nm diameter),but other factors can produce a negative y-intercept. Thesurface area is calculated from three or more points within thepressure range that yields the highest correlation coefficientand a positive y-intercept. 10.4.6 Calculate the nitrogen surface area to the nearest 0.1m /g as follows: where: (6.02×10²³)(16.2×10⁻²⁰) 22400 6.02×1023 =Avogadro’s number, 16.2×10-20 =aarea of nitrogen molecule in m , and22400 = rnumber ofcm’occupied by one mole of gasat STP. 10.5 Statistical Thickness Surface Area: 10.5.1 Determine the STSA’ of the black using a plot of thevolume of nitrogen gas adsorbed per gram of sample at STP(V) versus the statistical layer thickness (t). 10.5.2 Prepare the V-t plot by plotting t (nm) on the X axisversus V (dm /kg at STP) on the Y axis, for data sets havingP/P,equally spaced in the range of 0.2 to 0.5. where: t = statistical layer thickness of carbon black =0.088(P/P,)+ 0.645 (P/P ,) + 0.298 NoTE 5-The carbon black thickness model was developed using anN762 carbon black in the P/Po range of 0.2 to 0.5. T values calculatedoutside of this range are invalid and will result in erroneous STSA values. 10.5.3 Determine the slope of the V-t plot using standardlinear regression. 10.5.4 Calculate the STSA to the nearest 0.1 m²/g asfollows: where: M slope of the V-t plot, and 15.47 a constant for the conversion of nitrogen gas toliquid volume, and conversion of units to m²/g. 10.5.5 STSA is based on a thickness model developed usingan N762 carbon black. This carbon black was chosen becauseof its low surface area and low structure level. This universalmodel does not perfectly apply to all carbon blacks;consequently, while it is theoretically impossible for externalsurface area to be higher than total surface area, in practicethere are instances where STSA is higher than NSA. Foranalyses that yield STSA values that are higher than NSA, themeasured STSA value should be reported. 11. Report 11.1 Report the following information: 11.1.1 Proper sample identification, 11.1.2 Number of data points and relative pressures used toobtain both NSA and STSA. 11.1.3 The sample mass to the nearest 0.1 mg, and 11.1.4 The NSA or STSA, or both, of the sample reported tothe nearest 0.1 m/g. 12. Precision and Bias 12.1 These precision statements have been prepared inaccordance with Practice D4483. Refer to this practice forterminology and other statistical details. 12.2 An Interlaboratory precision program (ITP) informa-tion was conducted as detailed in Table 2. Both repeatability and reproducibility represent short-term (daily) testing condi-tions. The testing was performed using two operators in eachlaboratory performing the test once on each of two days (totalof four tests). A test result is the value obtained from a singledetermination. Acceptable difference values were not mea-sured. The between operator component of variation is in-cluded in the calculated values for r and R. 12.3 Nitrogen Surface Area (NSA): 12.3.1 A Type 1 interlaboratory precision program wasconducted. Both repeatability and reproducibility representshort-term (daily) testing conditions. The testing was per-formed using two operators in each laboratory performing thetest once on each material on each of two days (total of fourtests). The number of participating laboratories is listed inTable 2. 12.3.2 The results of the precision calculations for this testare given in Table 3. The materials are arranged in ascending“mean level”order. 12.3.3 Repeatability-The pooled relative repeatability,(r),of the NSA test has been established as 1.1 %. Any other valuein Table 3 may be used as an estimate of repeatability, asappropriate. The difference between two single test results (ordeterminations) found on identical test material under therepeatability conditions prescribed for this test will exceed therepeatability on an average of not more than once in 20 casesin the normal and correct operation of the method. Two singletest results that differ by more than the appropriate value fromTable 3 must be suspected of being from different populationsand some appropriate action taken. NoTE 6—Appropriate action may be an investigation of the test methodprocedure or apparatus for faulty operation or the declaration of asignificant difference in the two materials, samples, and so forth, whichgenerated the two test results. 12.3.4 Reproducibility-The pooled relativereproducibility, (R), of the NSA test has been established as 2.9%. Any other value in Table 3 may be used as an estimate ofreproducibility, as appropriate. The difference between twosingle and independent test results found by two operatorsworking under the prescribed reproducibility conditions indifferent laboratories on identical test material will exceed thereproducibility on an average of not more than once in 20 casesin the normal and correct operation of the method. Two singletest results produced in different laboratories that differ by TABLE 3 Precision Parameters for Test Method D6556,NSAMethod (Type 1 Precision)^ Units 10°m2/kg(m²/g) Material Mean Level Sr r (r) SR R (R) SRB-8B 142.0 0.47 1.34 0.9 1.44 4.06 2.9 SRB-8B2 138.0 0.31 0.87 0.6 0.79 2.24 1.6 SRB-8C 126.4 0.44 1.25 1.0 1.07 3.02 2.4 SRB-8A 76.5 0.33 0.94 1.2 0.84 2.38 3.1 SRB-8A2 75.9 0.29 0.81 1.1 0.70 1.98 2.6 SRB-8E 36.7 0.23 0.65 1.8 0.53 1.49 4.1 SRB-8F 36.7 0.21 0.58 1.6 0.38 1.09 3.0 SRB-8D 21.6 0.18 0.52 2.4 0.30 0.85 3.9 Average 81.7 Pooled Values 0.32 0.91 1.1 0.83 2.35 2.9 A The preferred precision values are shown in bold text. more than the appropriate value from Table 3 must besuspected of being from different populations and some appro-priate investigative or technical/commercial action taken. 12.3.5 Bias-In test method terminology, bias is the differ-ence between an average test value and the reference (true) testproperty value. Reference values do not exist for this testmethod since the value or level of the test property isexclusively defined by the test method. Bias, therefore, cannotbe determined. 12.4 Statistical Thickness Surface Area (STSA): 12.4.1 A Type 1 interlaboratory precision program wasconducted. Both repeatability and reproducibility representshort-term (daily) testing conditions. The testing was per-formed using two operators in each laboratory performing thetest once on each material on each oftwo days (total of fourtests). The number of participating laboratories is listed inTable 2. 12.4.2 The results of the precision calculations for this testare given in Table 4. The materials are arranged in ascending“mean level”order. 12.4.3 Repeatability-The pooled relative repeatability,(r),of the STSA test has been established as 1.7 %.Any other valuein Table 4 may be used as an estimate of repeatability, asappropriate. The difference between two single test results (ordeterminations) found on identical test material under therepeatability conditions prescribed for this test will exceed therepeatability on an average ofnot more than once in 20 casesin the normal and correct operation of the method. Two singletest results that differ by more than the appropriate value fromTable 4 must be suspected of being from different populationsand some appropriate action taken. NoTE 7-Appropriate action may be an investigation of the test methodprocedure or apparatus for faulty operation or the declaration of asignificant difference in the two materials, samples, and so forth, whichgenerated the two test results. 12.4.4 Reproducibility-The pooled relativereproducibility, (R), of the STSA test has been established as4.3 %. Any other value in Table 4 may be used as an estimateof reproducibility, as appropriate. The difference between twosingle and independent test results found by two operatorsworking under the prescribed reproducibility conditions indifferent laboratories on identical test material will exceed thereproducibility on an average of not more than once in 20 cases TABLE 4 Precision Parameters for Test Method D6556, STSA Units 10°m²/kg(m²/g) Material Mean Level Sr r (r) SR R (R) SRB-8B 133.1 0.71 2.00 1.5 1.39 3.92 2.9 SRB-8B2 126.7 0.56 1.58 1.2 2.02 5.73 4.5 SRB-8C 115.8 0.48 1.35 1.2 1.06 3.01 2.6 SRB-8A 77.2 0.41 1.17 1.5 1.15 3.26 4.2 SRB-8A2 76.0 0.47 1.32 1.7 1.23 3.49 4.6 SRB-8E 35.8 0.34 0.96 2.7 0.71 2.02 5.6 SRB-8F 35.4 0.33 0.93 2.6 0.69 1.95 5.5 SRB-8D 21.2 0.26 0.73 3.5 0.54 1.52 7.2 Average 77.6 Pooled Values 0.46 1.31 1.7 1.19 3.36 4.3 The preferred precision values are shown in bold text. in the normal and correct operation of the method. Two singletest results produced in different laboratories that differ bymore than the appropriate value from Table 4must besuspected of being from different populations and some appro-priate investigative or technical/commercial action taken. 12.5 Bias-In test method terminology, bias is the differencebetween an average test value and the reference (true) testproperty value. Reference values do not exist for this testmethod since the value or level of the test property isexclusively defined by the test method. Bias, therefore, cannotbe determined. 13. Keywords 13.1 Brunauer/Emmett/Teller; carbon black, B.E.T.; nitro-gen adsorption; nitrogen surface area; statistical thicknesssurface area; surface area by multipoint B.E.T. method, exter-nal surface area ASTM International takes no position respecting the validity of any patent rights asserted in connection with any item mentionedin this standard. Users of this standard are expressly advised that determination of the validity of any such patent rights, and the riskof infringement of such rights, are entirely their own responsibility. This standard is subject to revision at any time by the responsible technical committee and must be reviewed every five years andif not revised, either reapproved or withdrawn. Your comments are invited either for revision of this standard or for additional standardsand should be addressed to ASTM International Headquarters. Your comments will receive careful consideration at a meeting of theresponsible technical committee, which you may attend. If you feel that your comments have not received a fair hearing you shouldmake your views known to the ASTM Committee on Standards, at the address shown below. This standard is copyrighted by ASTM International, 100 Barr Harbor Drive, PO Box C700, West Conshohocken, PA 19428-2959,United States. Individual reprints (single or multiple copies) of this standard may be obtained by contacting ASTM at the aboveaddress or at 610-832-9585 (phone), 610-832-9555 (fax), or service@astm.org (e-mail); or through the ASTM website(www.astm.org). Permission rights to photocopy the standard may also be secured from the Copyright Clearance Center, 222Rosewood Drive, Danvers, MA 01923, Tel: (978) 646-2600; http://www.copyright.com/ Copyright O ASTM International, Barr Harbor Drive, PO Box C West Conshohocken, PA United States 摘要本文从水泥材料的特性入手,通过引入GB/T8074-2008《水泥比表面积测定方法(勃氏法)》、GB/T208-2014《水泥密度测定方法》等国家标准及JC/T956-2014《勃氏透气仪》行业标准,对水泥材料的比表面测试方法进行介绍,并对BET氮吸附法测比表面进行对比和分析,总结各自特点,为今后不同材料的比表面测定提供理论支持。 前言水泥是我国建筑行业不可或缺的一种重要材料,它硬化后不但强度较高,而且还能抵抗淡水或含盐水的侵蚀,不仅关系到工程项目的施工速度和成本、标志着我国建筑行业和材料领域的交互发展里程,更关系到建筑的安全系数。所以,水泥的品质和特性受到了各行各业的广泛关注。由于水泥的比表面积是评价水泥质量的重要标准,我们只有测量出较为精确的数据,才能保证施工项目的品质。因此,下文将对比勃氏法和BET氮吸附法的原理及特点,探讨最适合水泥的比表面测试方法。 一、勃氏法测比表面积勃氏法主要用于测定水泥的比表面积及比表面积在0.2至0.6 m2/g范围的粉状物料,但不适用于多孔材料和超细粉状物料。该方法主要根据一定量的空气通过具有一定空隙率和规定厚度的试料层时,所受到的阻力不同而引起流速的变化来测定试料的比表面积。实验方法主要分为两部分。首先,通过李氏瓶法测得被测样品的密度,利用砝码调整透气仪试料筒中试料层的样品空隙率。其次,将预处理过的样品,利用砝码将其压实在试料筒中,将试料筒与压力计紧密连接进行透气实验,通过压力计中蒸馏水凹液面的升降表示压力计内压力变化并记录凹液面通过第一、二条刻度线时,液面下降所用的相对时间。结构图如下所示:将标准样品和待测样品的上述参数分别测试后,代入下方计算公式后即得所求比表面积。 当实验温差≤3℃时,按下式计算: 如实验温差>3℃时,按下式计算:式中:——被测样品的比表面积,平方厘米每克(cm2/g)——标准样品的比表面积,平方厘米每克(cm2/g)——被测试样品的密度,克每立方厘米(g/cm3)——被测试样品的密度,克每立方厘米(g/cm3)——被测样品实验时,压力计中液面降落测得的时间,秒(s)——标准样品实验时,压力计中液面降落测得的时间,秒(s)——被测标样的实验温度下的空气粘度,微帕·秒(μPa·s)——标准标样的实验温度下的空气粘度,微帕·秒(μPa·s) ——被测试样试料层中的空隙率——标准样品试料层中的空隙率 由于勃氏法比表面仪分为自动和手动两种,由于测试参数较多,两种仪器测试所得结果出现分岐时,需以手动结果为准。 二、BET法测比表面BET法适用于粉末及多孔材料(包括纳米粉末及纳米级的多孔材料)比表面积的测定,测定范围0.001 m2/g至1 000 m2/g。 其实验原理主要围绕放到气体体系中的样品,其物质表面(颗粒外部和内部通孔的表面积,如下图示意)在低温下将发生物理吸附。当吸附达到平衡时,测量平衡吸附压力和吸附的气体量,根据BET方程式求出试样单分子层吸附量,从而计算出试样的比表面积。用虚线表示测定的颗粒表面积根据BET氮吸附原理测量比表面的方法分为静态容量法和动态法(气相色谱流动法)两种,由此为依据的仪器也同样分为静态和动态两种。 静态容量法测量仪器原理示意图见下图:1——样品2——盛有液氮的杜瓦瓶3——真空系统4——压力计5——气体量管 气相色谱法测量仪原理示意图见下图:1——样品 2——盛有液氮的杜瓦瓶3——热导他鉴定器4——气体混合器 通过一系列相对压力P/P0和吸附气体量V的测量,由BET图或最小二乘法求出斜率A和截距B值,并导出单层容量和BET参数C。C值表示了吸附剂和吸附质之间的相互作用力,但不能用作定量计算吸附热。采用氮吸附气体时,截距相对斜率而言,往往是比较小的,C值>>1。 比表面积SW可通过单层容量和每个分子在一个完整的单层上所占有的平均面积求出:——单层吸附体积,立方厘米(cm3) ——1摩尔吸附质的体积(标准态)22.414,立方厘米(cm3)——吸附质分子横断面积,平方厘米(cm2) 通常认为氮气是最适宜的吸附气体。对于低比表面积的样品,采用氮气测量时,仪器的灵敏度不够,此时可采用较重分子或蒸气压比氮气低的吸附气体,例如氢气。用不同吸附气体测量所得结果,由于不同分子横断面积、不同的可及孔和不同的测量温度,彼此会有偏离。为了实现测量结果的重复性,重新取样进行多次测量,并报出标准偏差的平均值。 采用氮吸附气体时,其分子横断面积在77K 温度下为0.162 nm2,则可按下式求出固态物质的比表面积。三、对比分析通过上文的方法介绍,我们可以看出这两种比表面测试方法各自均有优势。 从仪器的表现来分析,我们可以得到以下对比表 表现指标勃氏透气仪BET比表面分析仪测试范围水泥、0.2-0.6 m2/g0.001 m2/g至1 000 m2/g测试项目比表面积比表面积、孔径分析测试时间根据操作人员熟练程度决定40min左右准备项目称量样品、校准仪器、测试标样、测试读秒,计算称量质量实验难度流程较复杂,易受外界影响全自动实验,无难度实验影响及结果精度重复性需要手动测量计算的参数多,受操作人员的操作手法和熟练程度影响非常大,精度和准确度对比BET法较差,结果重复性一般只需核对质量,全程软件自动控制,隔绝人工误差,结果精度大、准确度高,重复性好必备耗材煤油、标准样品、滤纸、穿孔板实验气体仪器维护3-6个月校正一次一年校正一次仪器价格几百至几千元不等,但需加购李氏瓶和恒温水浴装置根据需求,几万至十几万元不等通过上表,我们可以清晰的对比出两种方法的优缺点。勃氏法测比表面积需要手动测量及计算的参数众多,而且在测量比表面积的过程中,水泥密度的测量非常关键,密度决定了测定出的水泥的重量是否有偏差,将影响到试验中水泥的的空隙率,从而影响比表面积的测定结果。运用李氏瓶测密度需要严格控制恒温水浴温度、实验时间和读数时间,以保证在煤油挥发、质量出现偏差前,尽量的减少读数的误差。在测量水泥比表面积时,实验室条件需要的要求也需要尽可能的控制,要求试验室的湿度不能超过50%。实验过程中要保证压力计中液面应在合适的高度,当液面高度过高时,气体流速变慢,比表面积会偏大;当液面高度过低,气体流速变快,测量的数值则会偏小。BET法测比表面时,只需注意准确称量和复核样品质量,将数值填写到软件中,系统就可以进行计算。实验过程全部通过电脑控制,不仅操作简单、易于上手,还能最大程度的保证实验的精确度,避免了操作误差。对于水泥工艺改进和来料检测等项目而言,部门要进行大量实验,需要高效与准确度兼备,BET法测比表面积的优势就不言而喻了。 本文部分内容节选自国家标准,详见:GB/T 8074-2008 《水泥比表面积测定方法 勃氏法》GB/T 208-2014 《水泥密度测定方法》JC/T 956-2014 《勃氏透气仪》 GB/T 19587-2004 《气体吸附BET法测定固态物质比表面积》
确定
还剩4页未读,是否继续阅读?

北京精微高博仪器有限公司为您提供《水泥粉末中比表面积检测方案(孔径/隙度分析)》,该方案主要用于水泥/混凝土中比表面积检测,参考标准--,《水泥粉末中比表面积检测方案(孔径/隙度分析)》用到的仪器有
相关方案
更多