


方案详情
文
采用人工强化处理污水的方法,模拟和加速了污水中微生物的腐蚀,研究了污水中掺加生物膜和不掺生物膜砂浆的重量变化规律。对比研究了砂浆上生物膜的微生物结构和活性表面。在此基础上,分析了生物膜对砂浆老化的影响机理。结果表明,在砂浆上形成的生物膜有污水导致的不同程度的腐蚀具有一定的阻隔作用。生长在具有化学需氧量为3000 mg/L时的污水中的生物膜(COD)对砂浆的保护作用最为显著,这与COD对砂浆的保护作用有关,这可能是高pH值和密集的结构。对于普通污水中的样品,生物膜的厚度起着主要作用,尤其是在第一个月,而在污水浓度过高的情况下,污水的腐蚀性增加对后期生物膜对砂浆的防护作用会明显降低。
方案详情

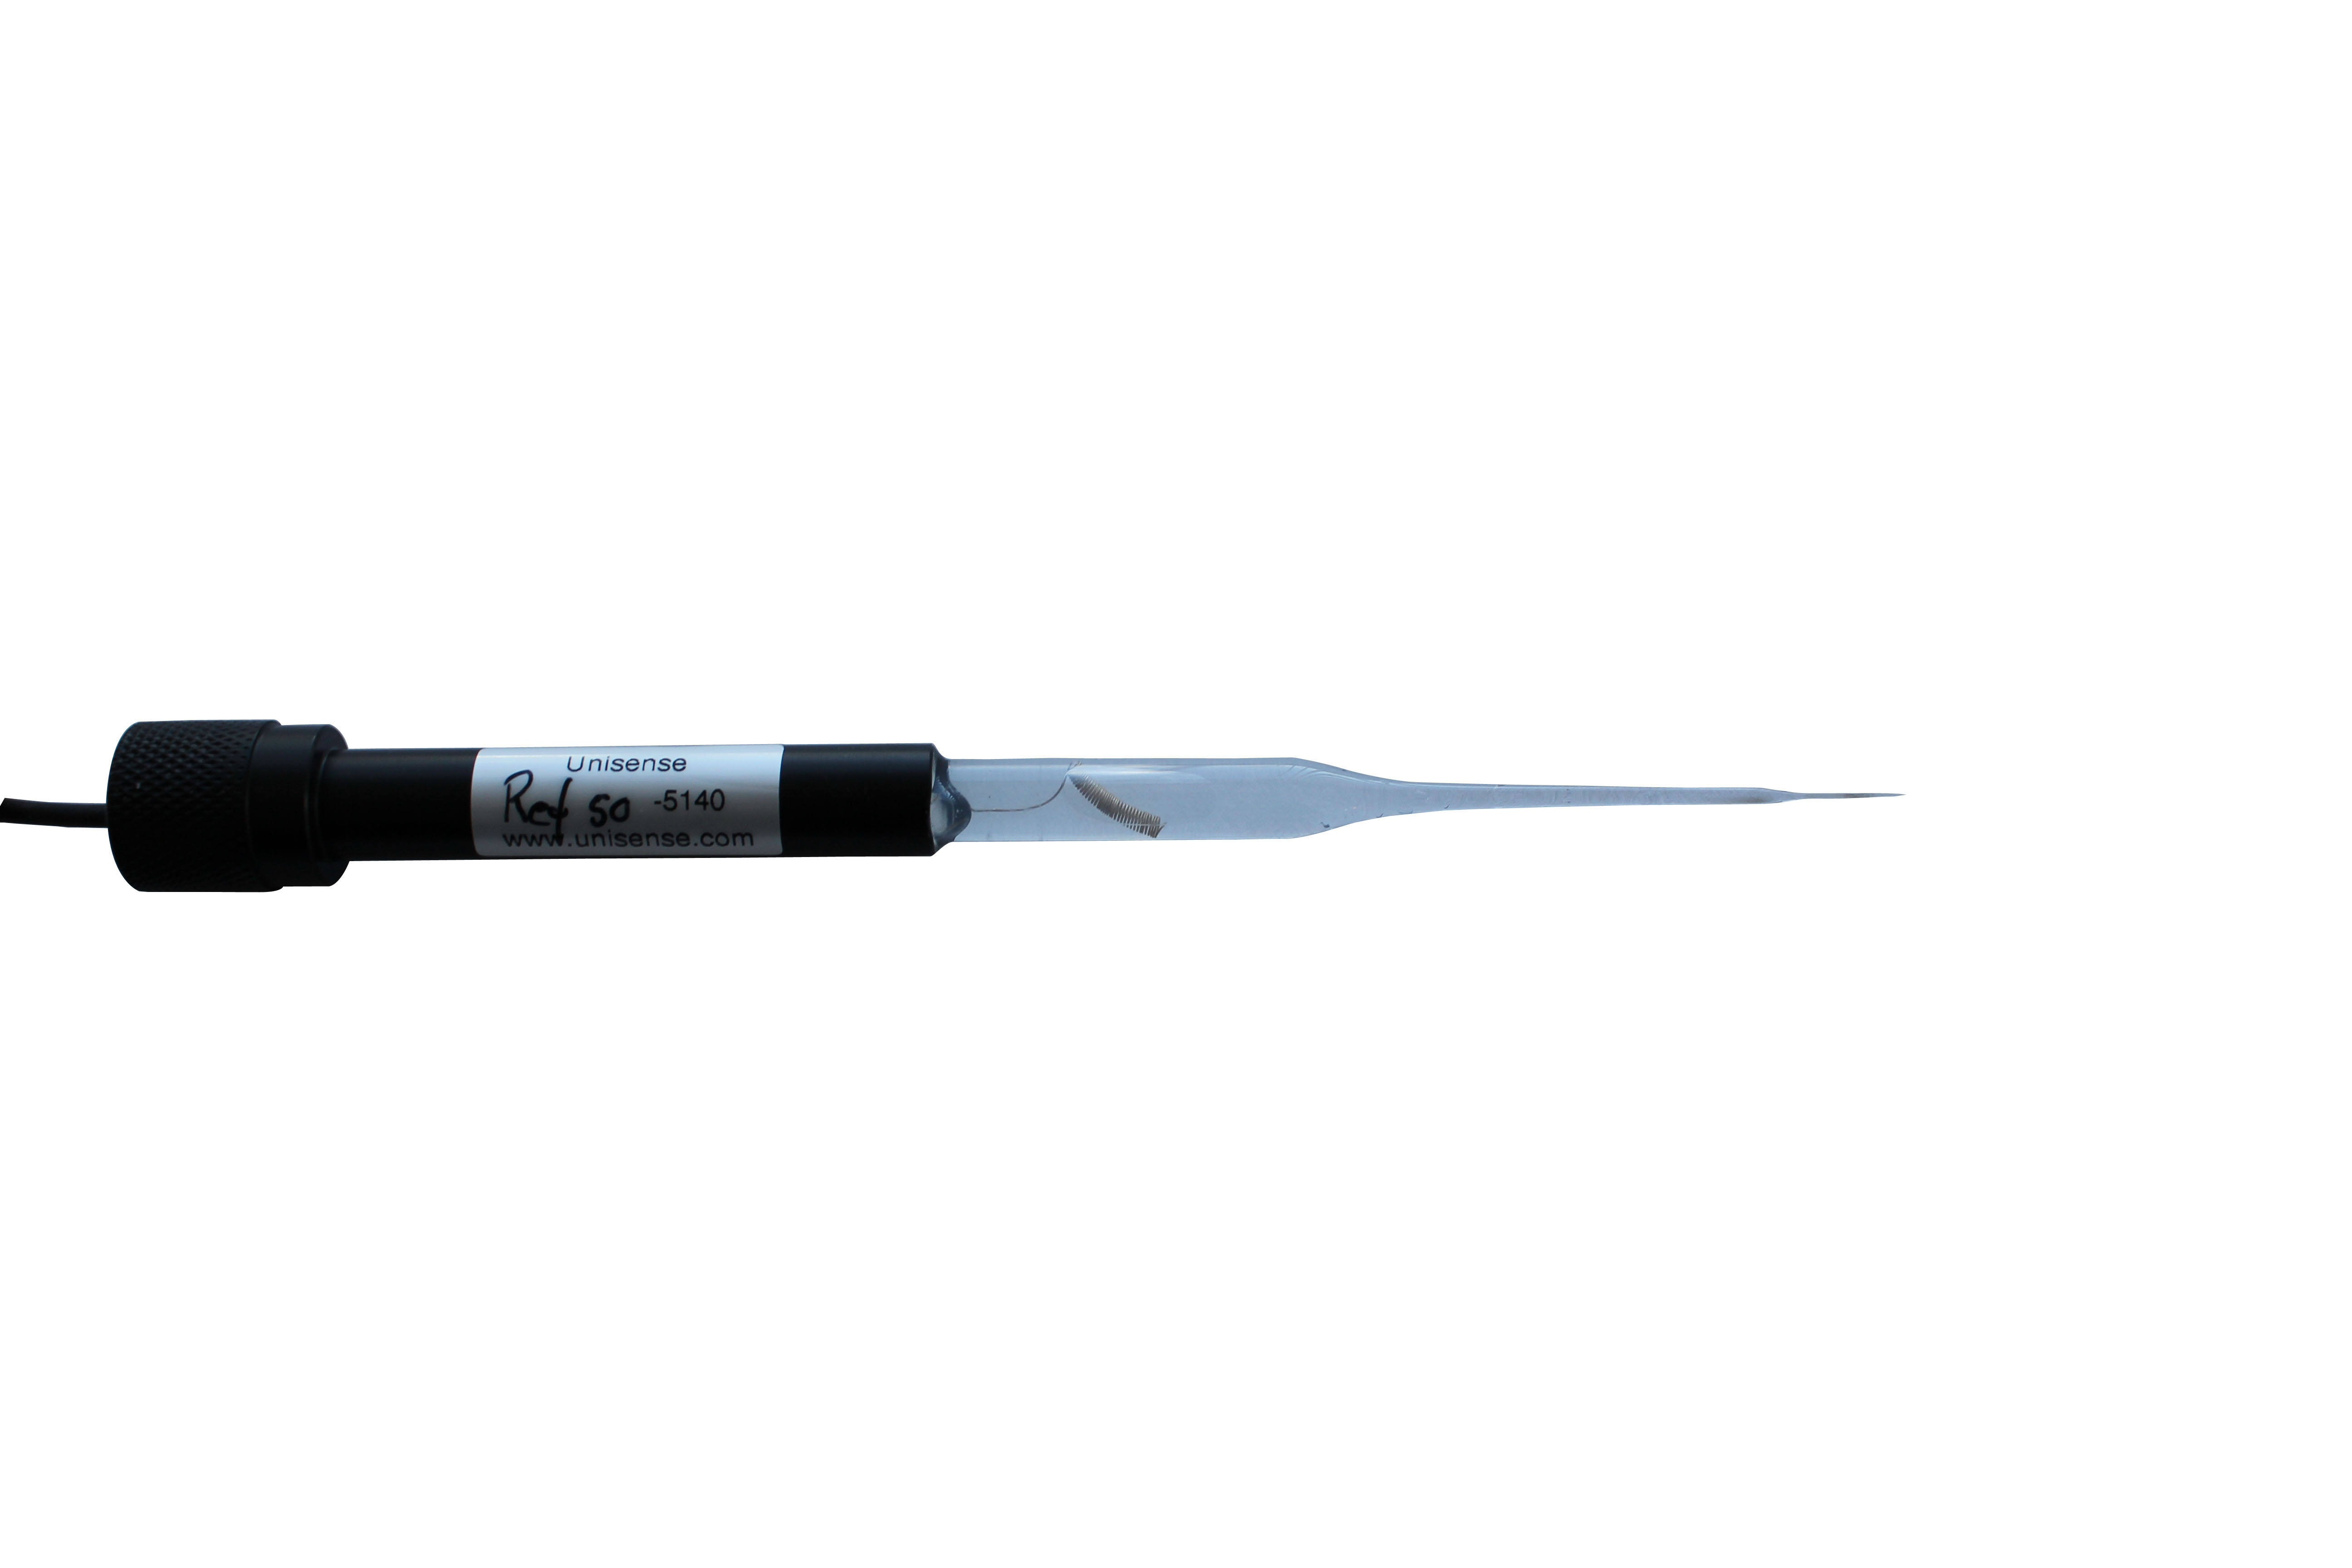
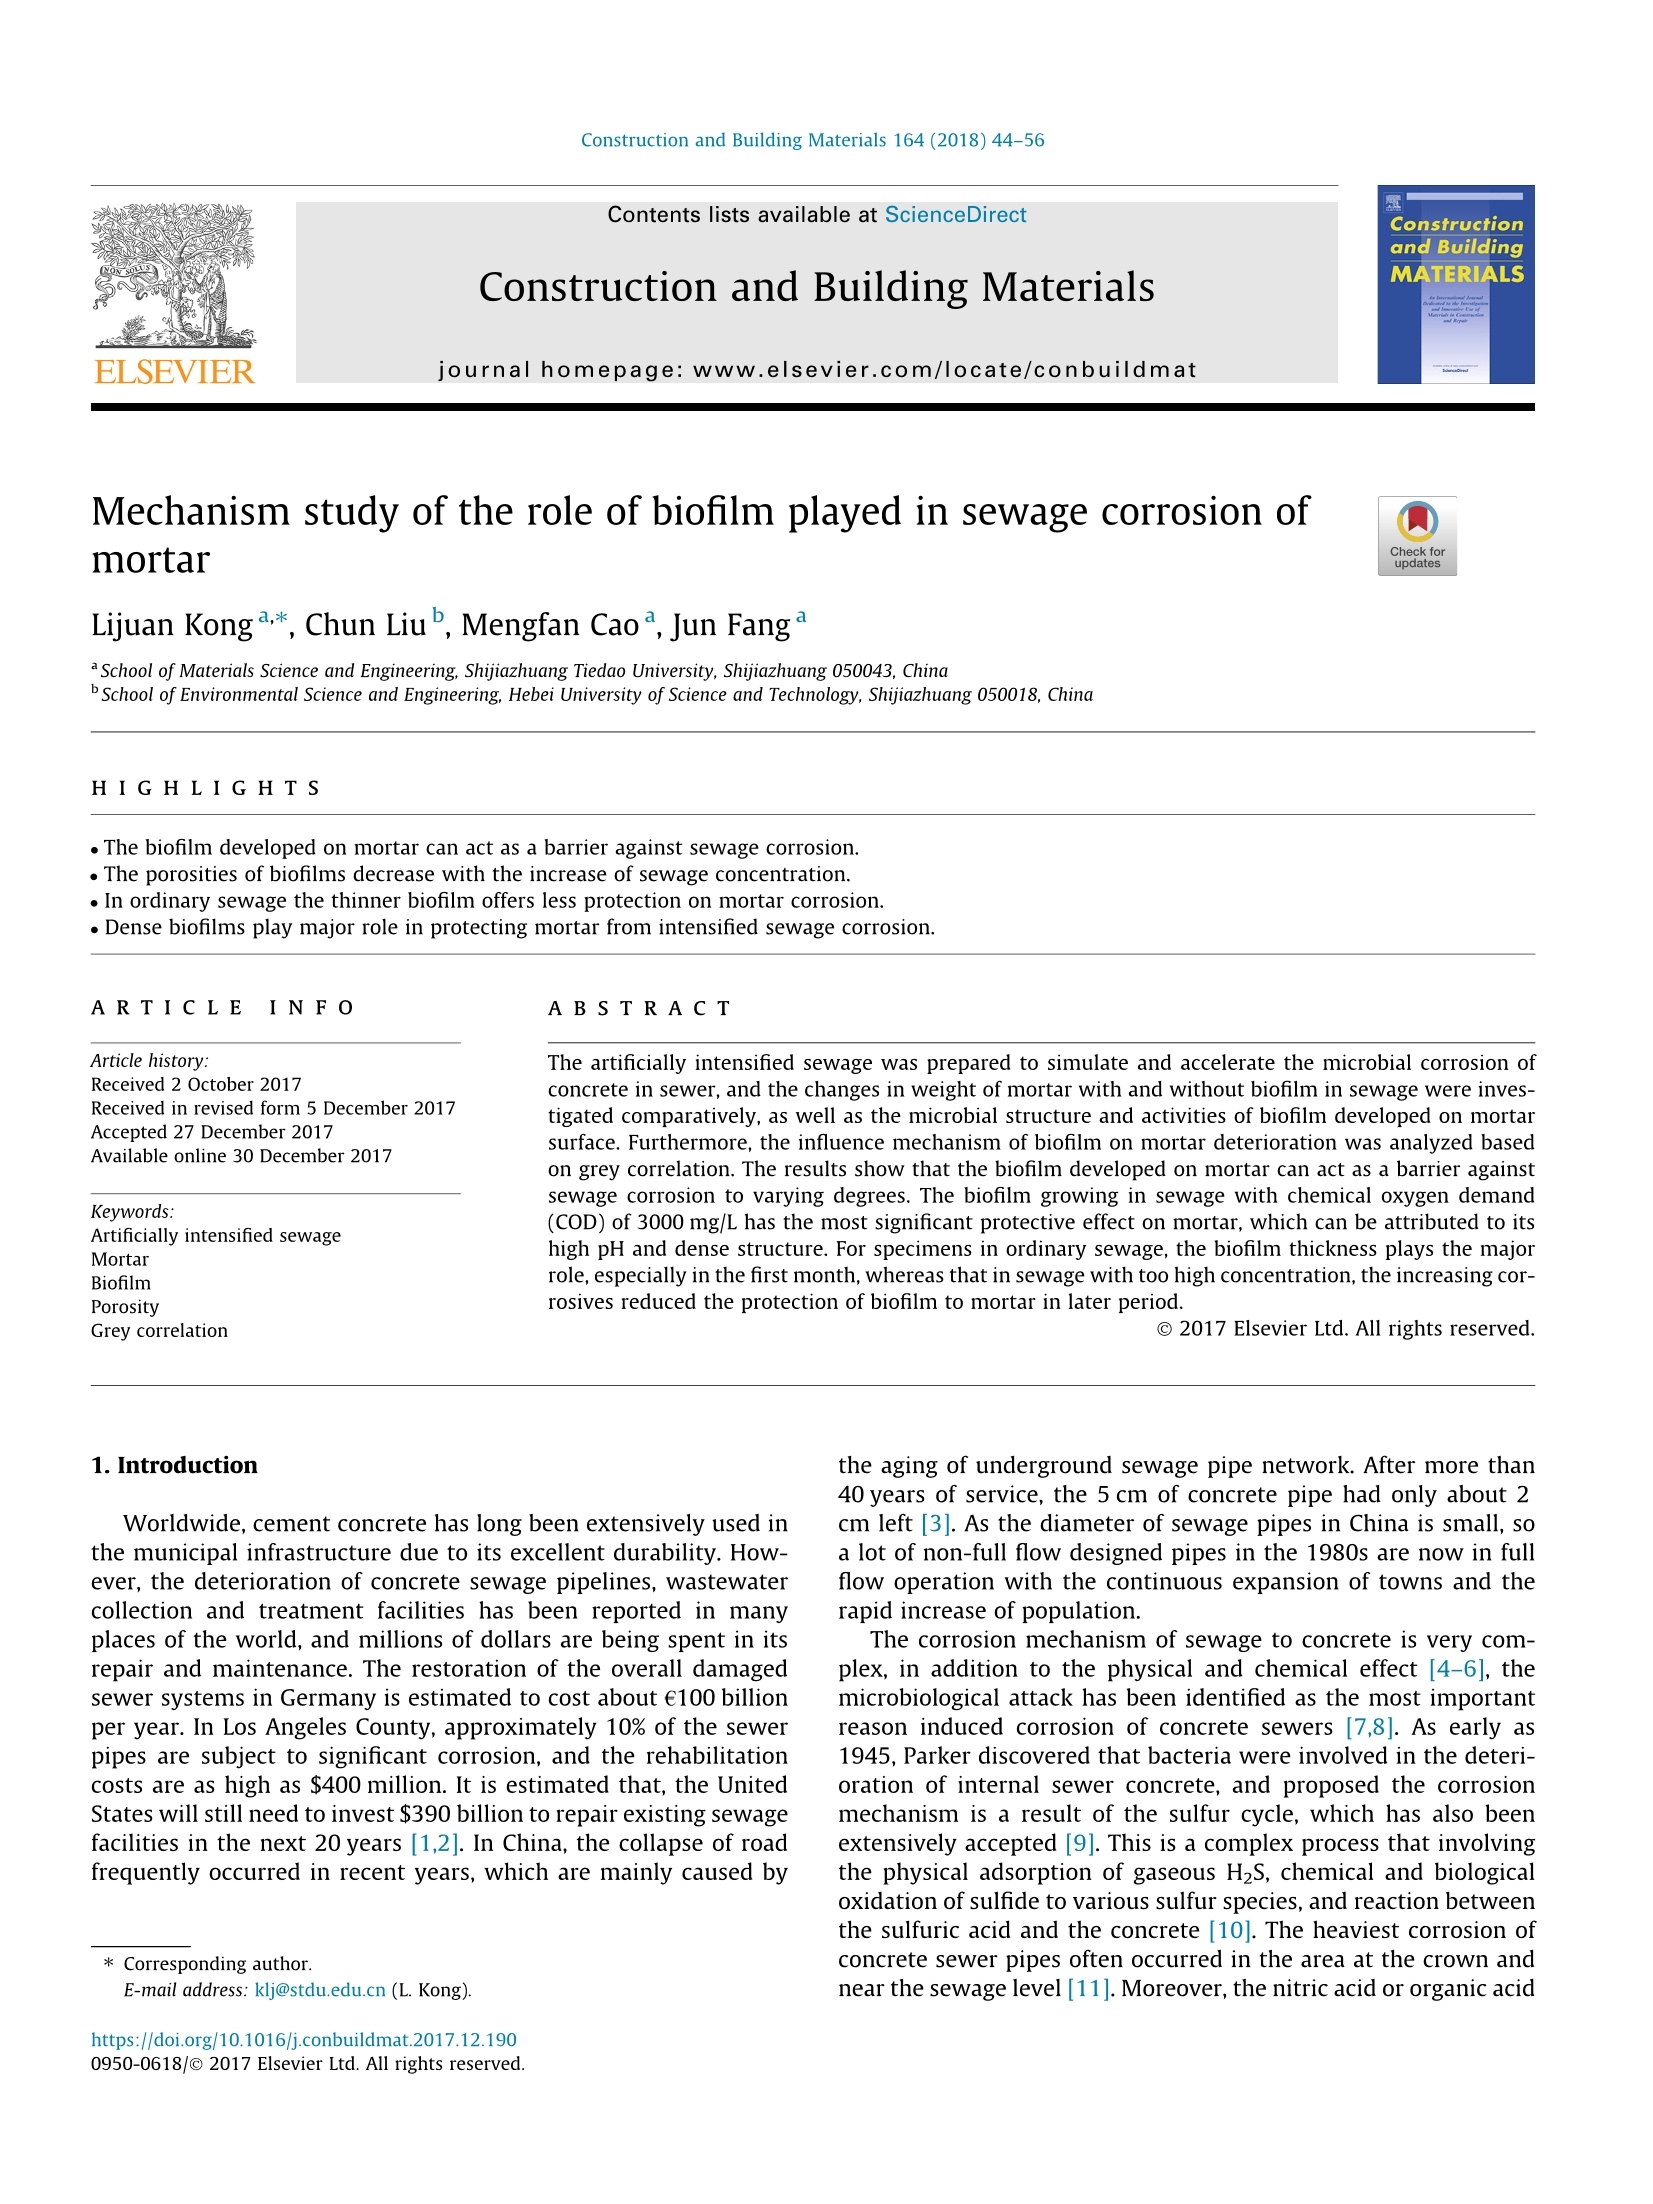
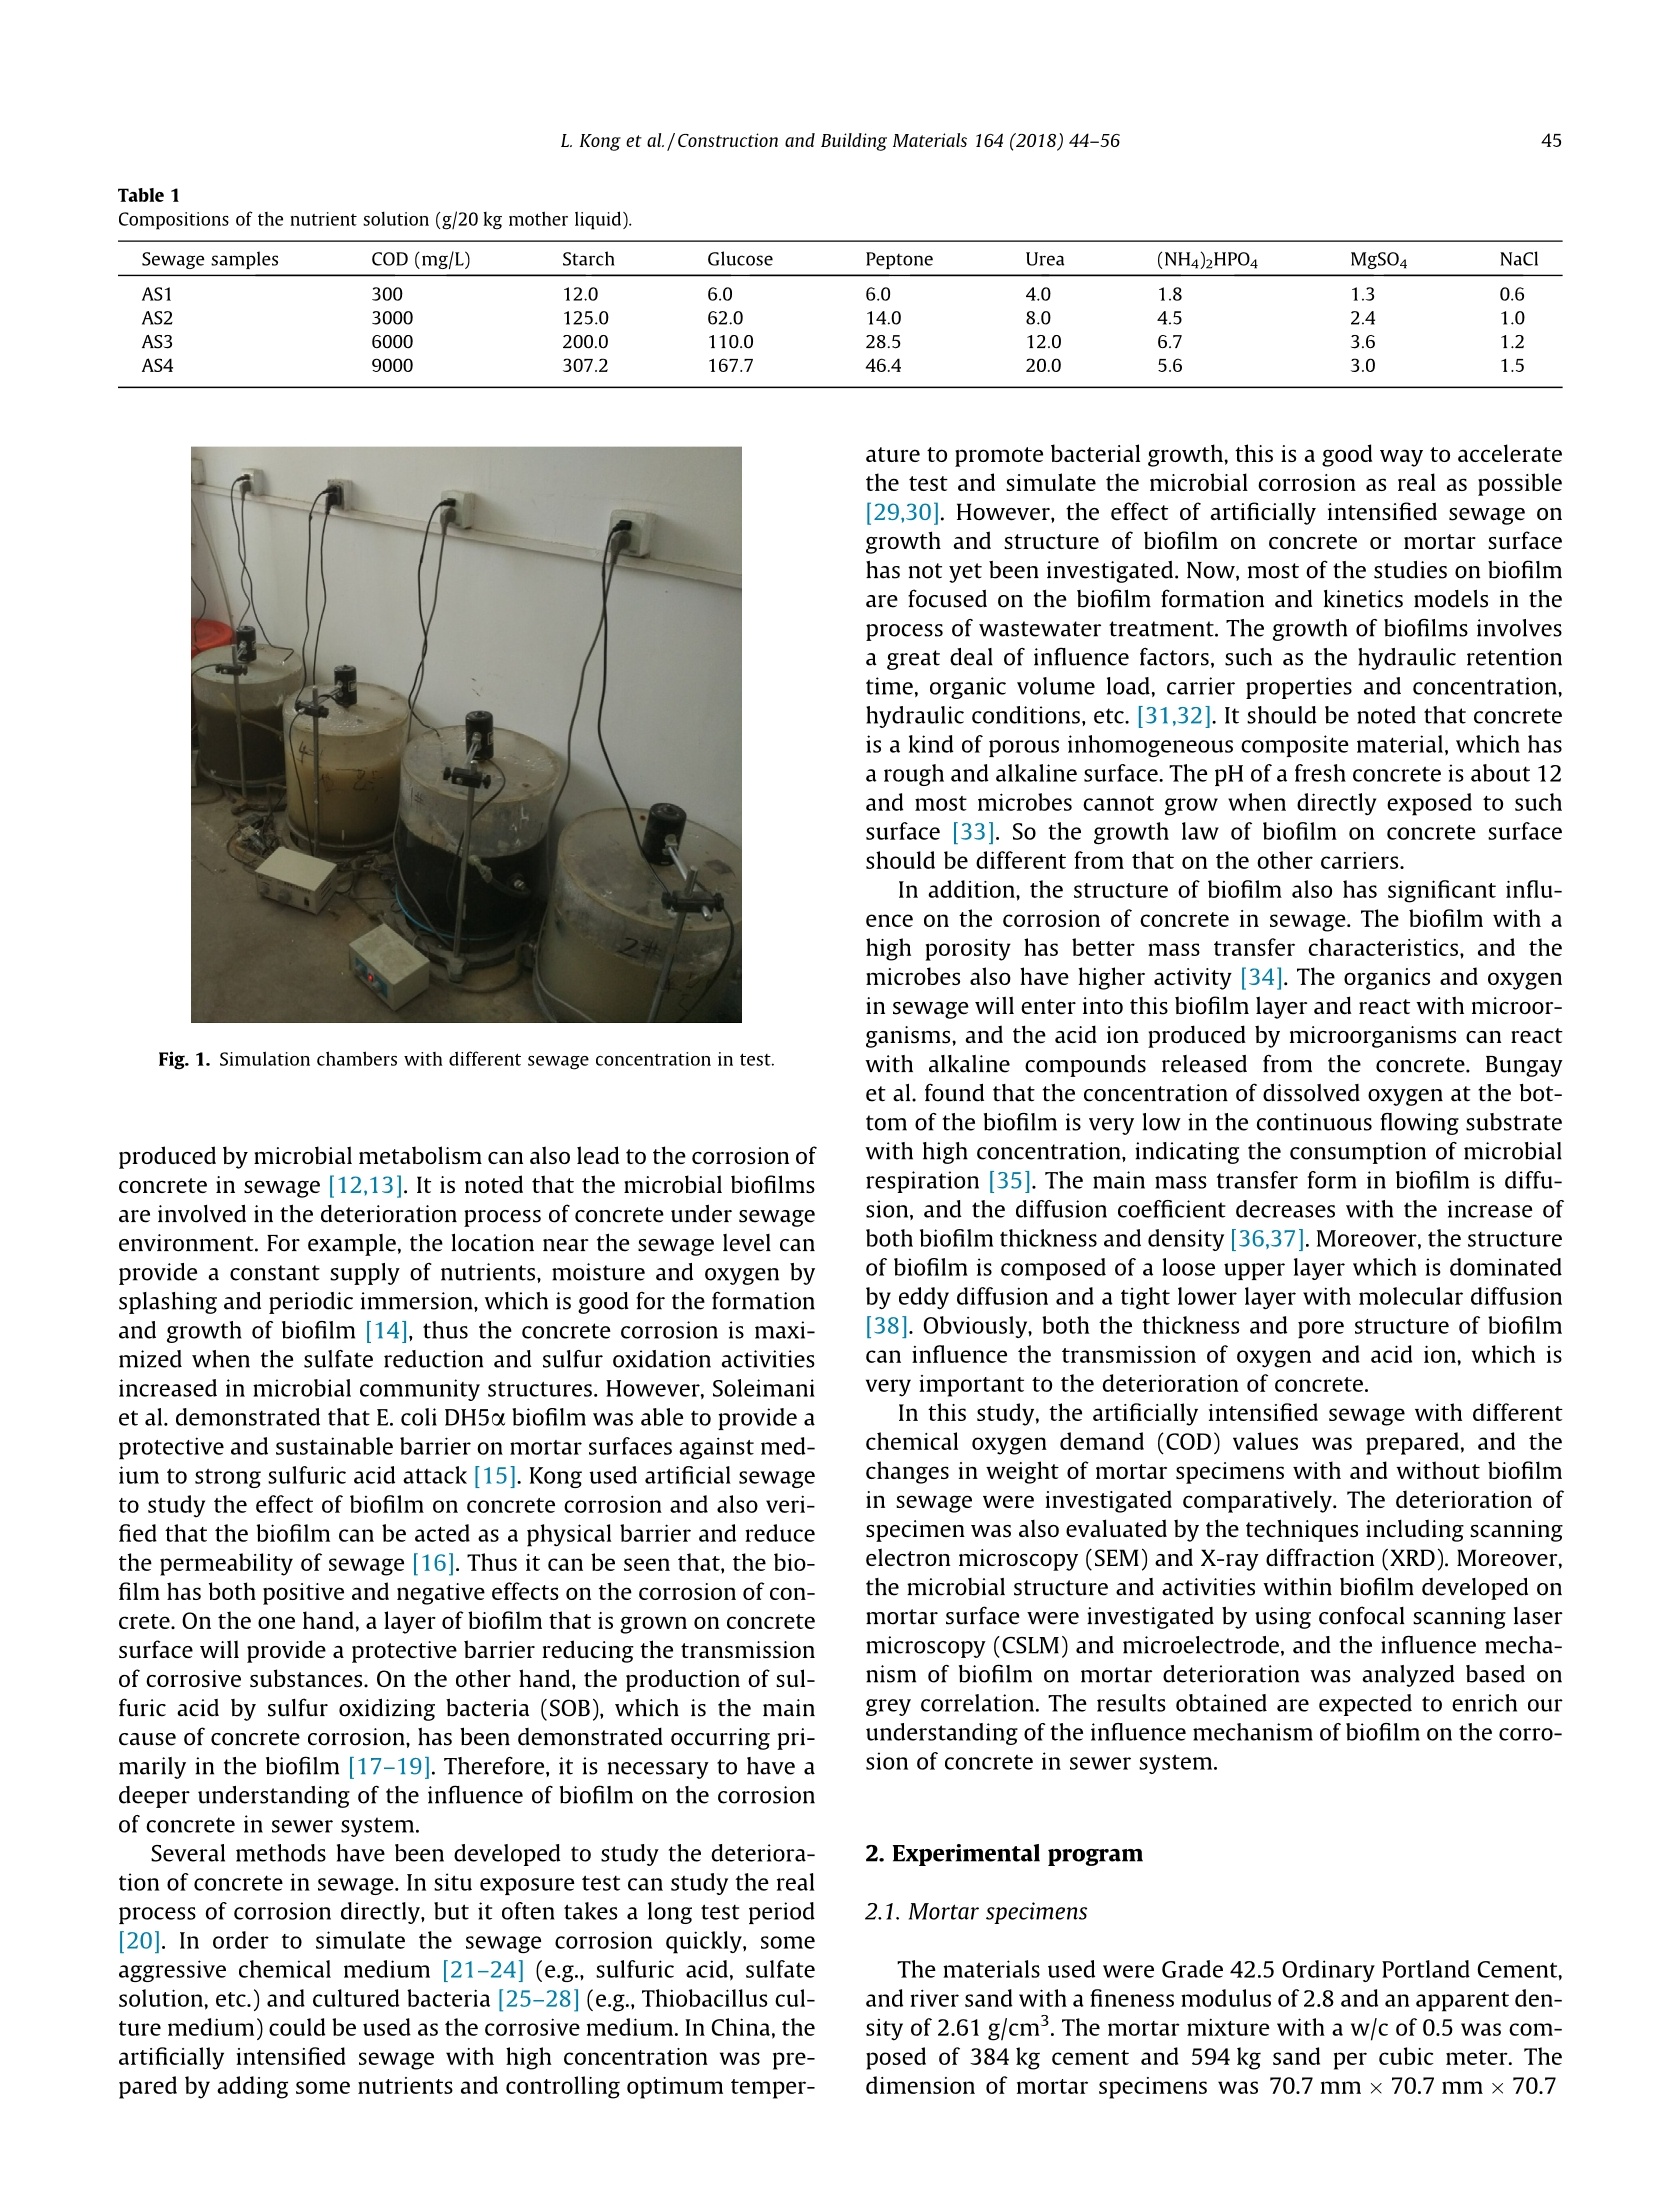
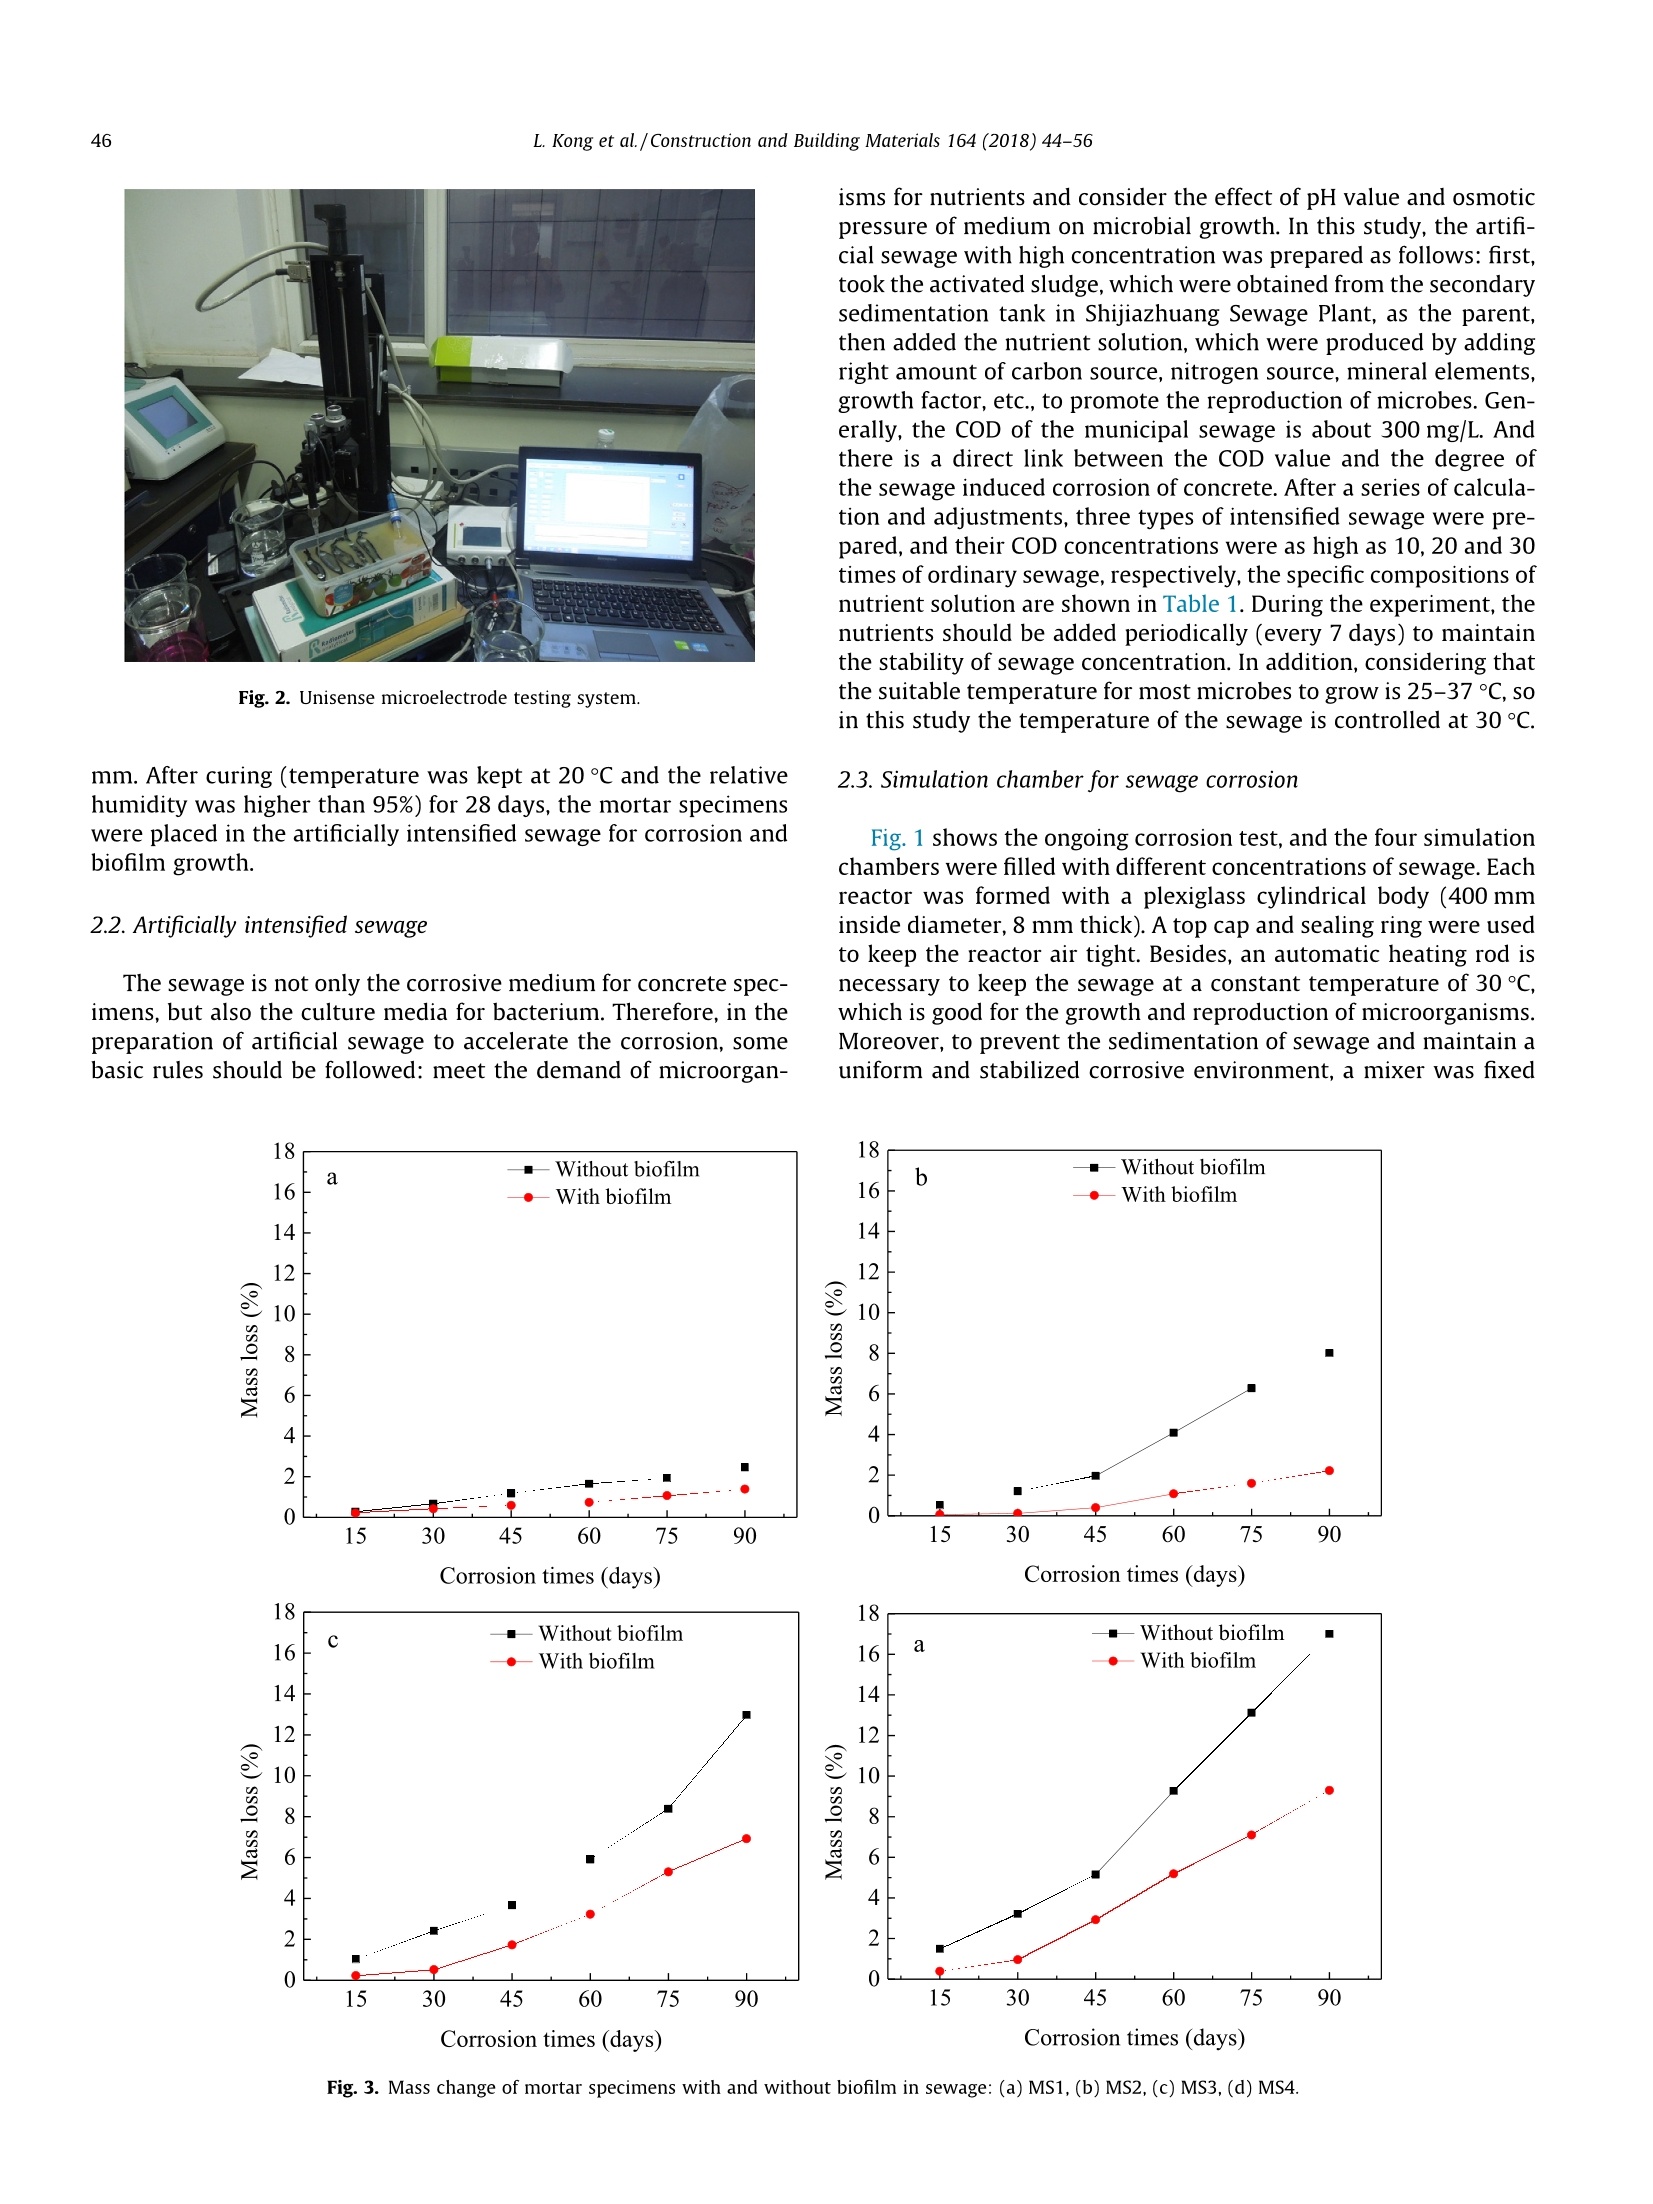
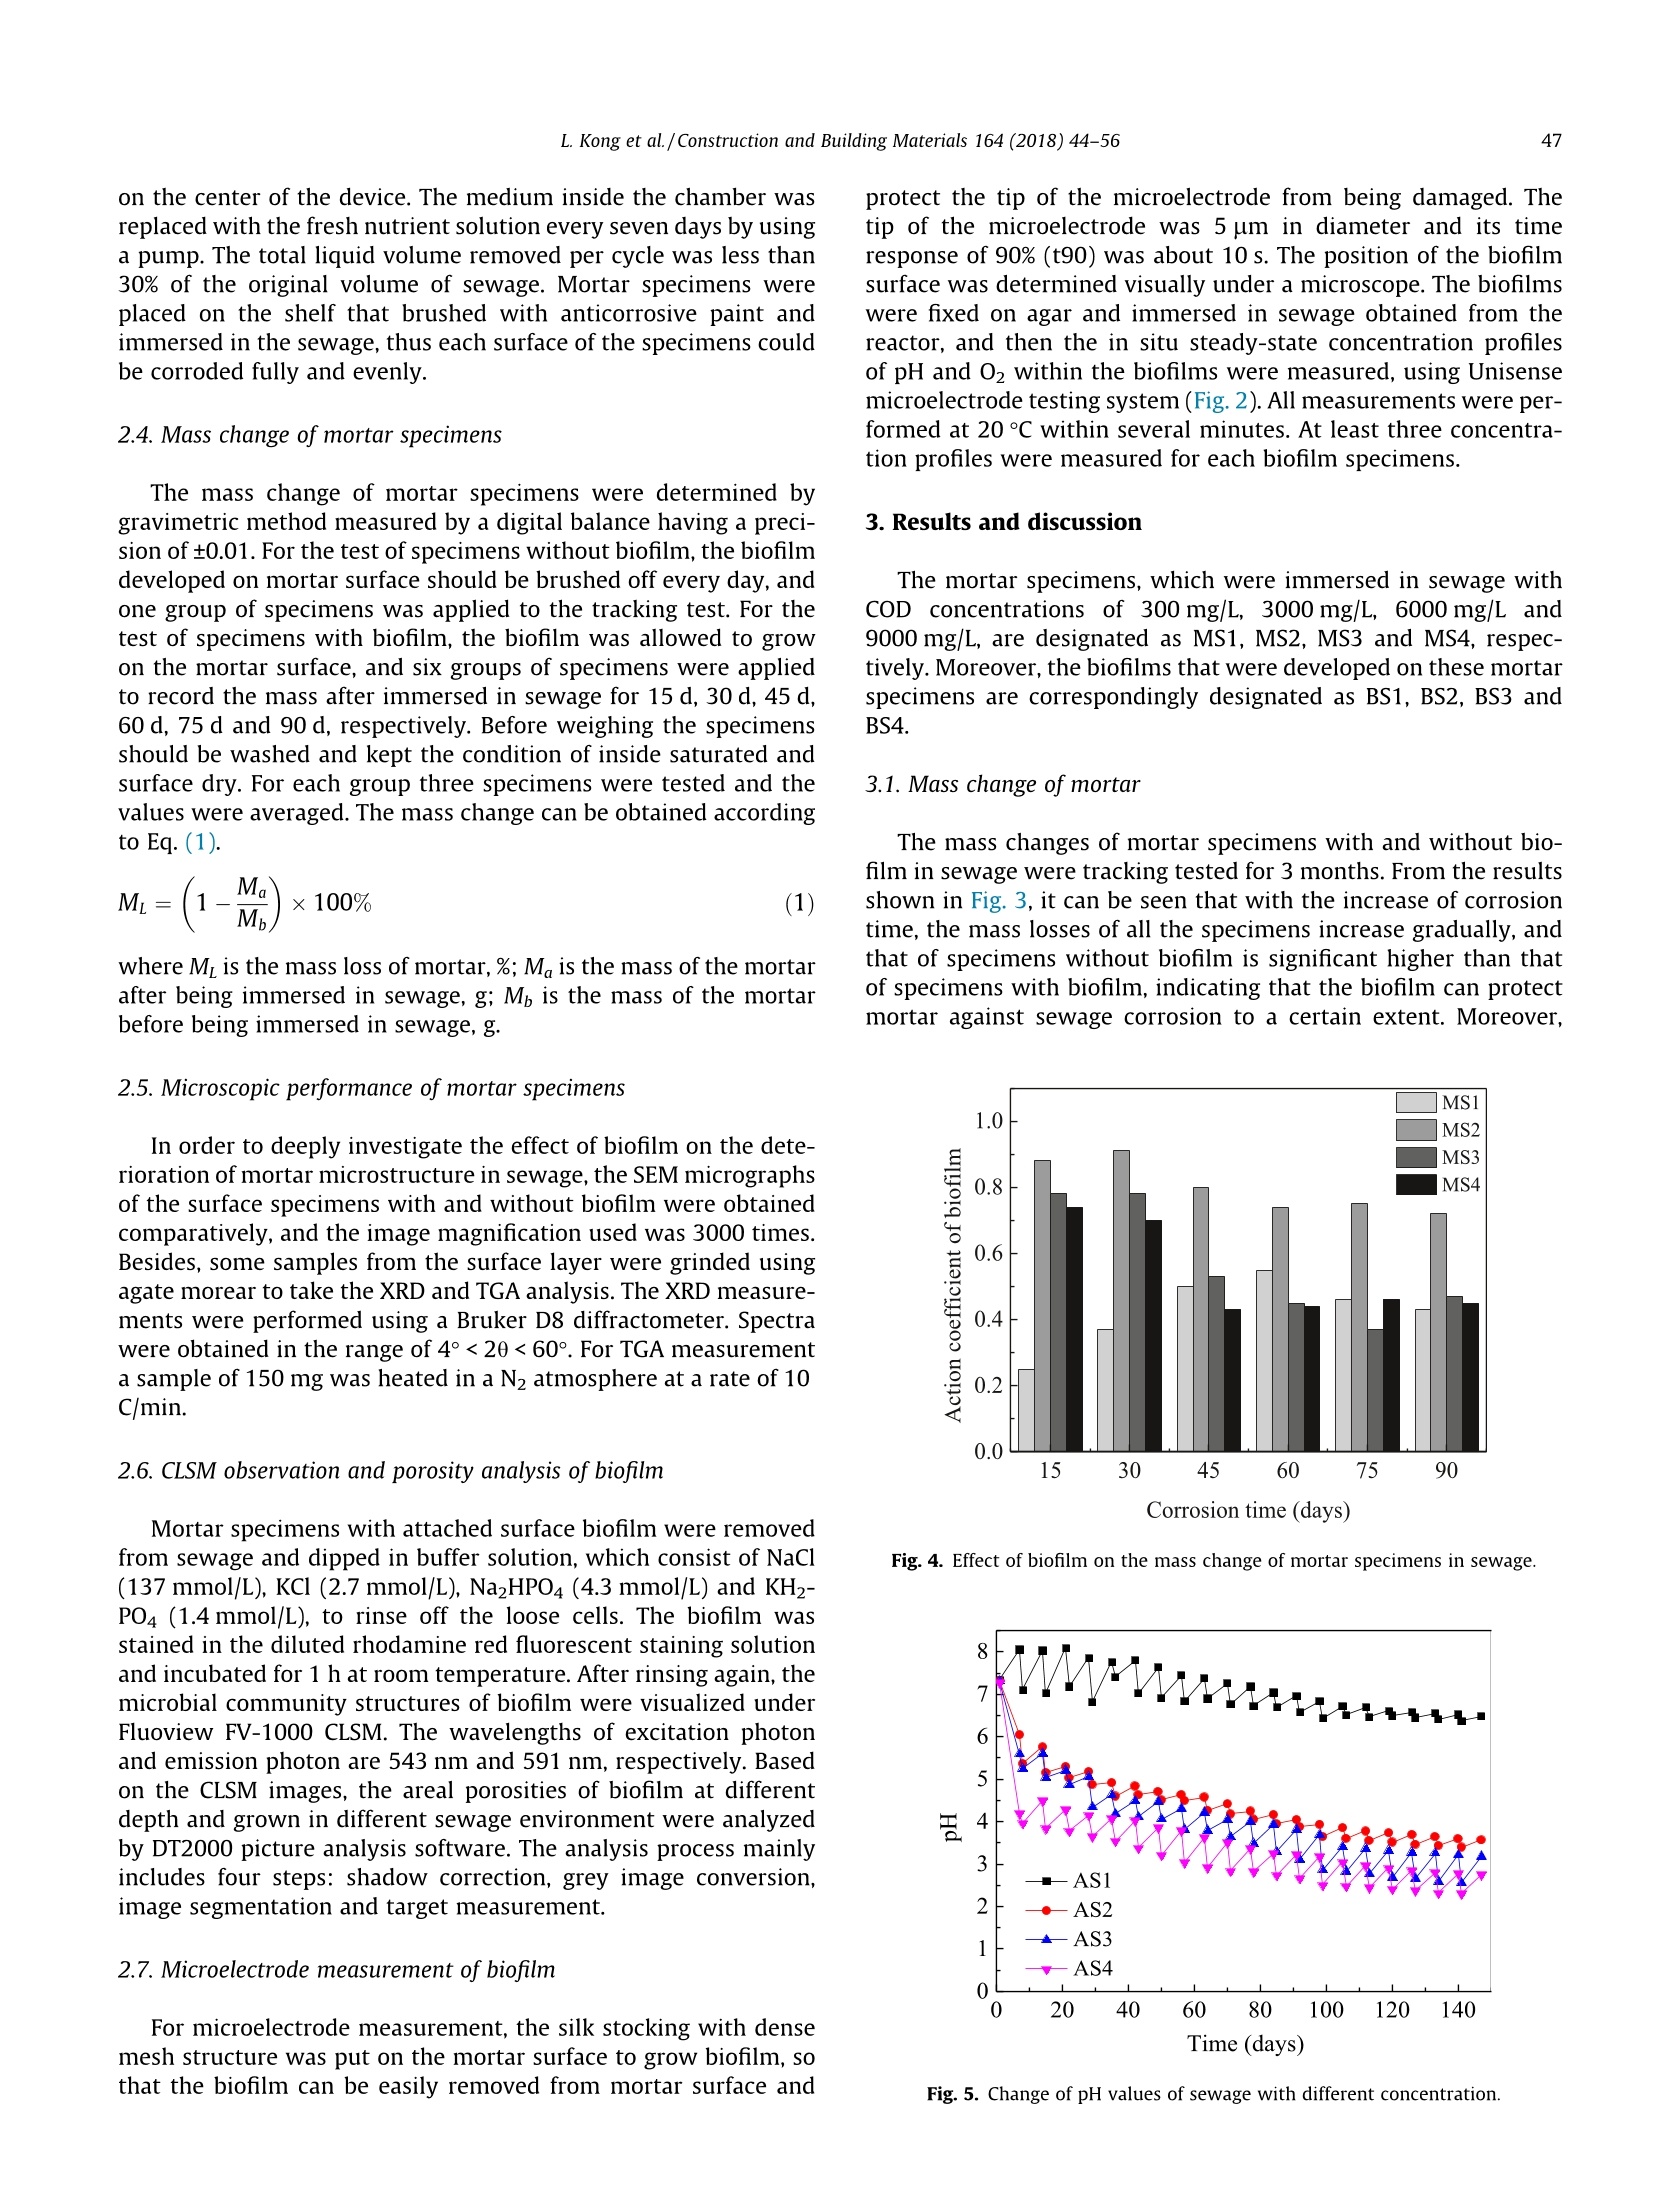
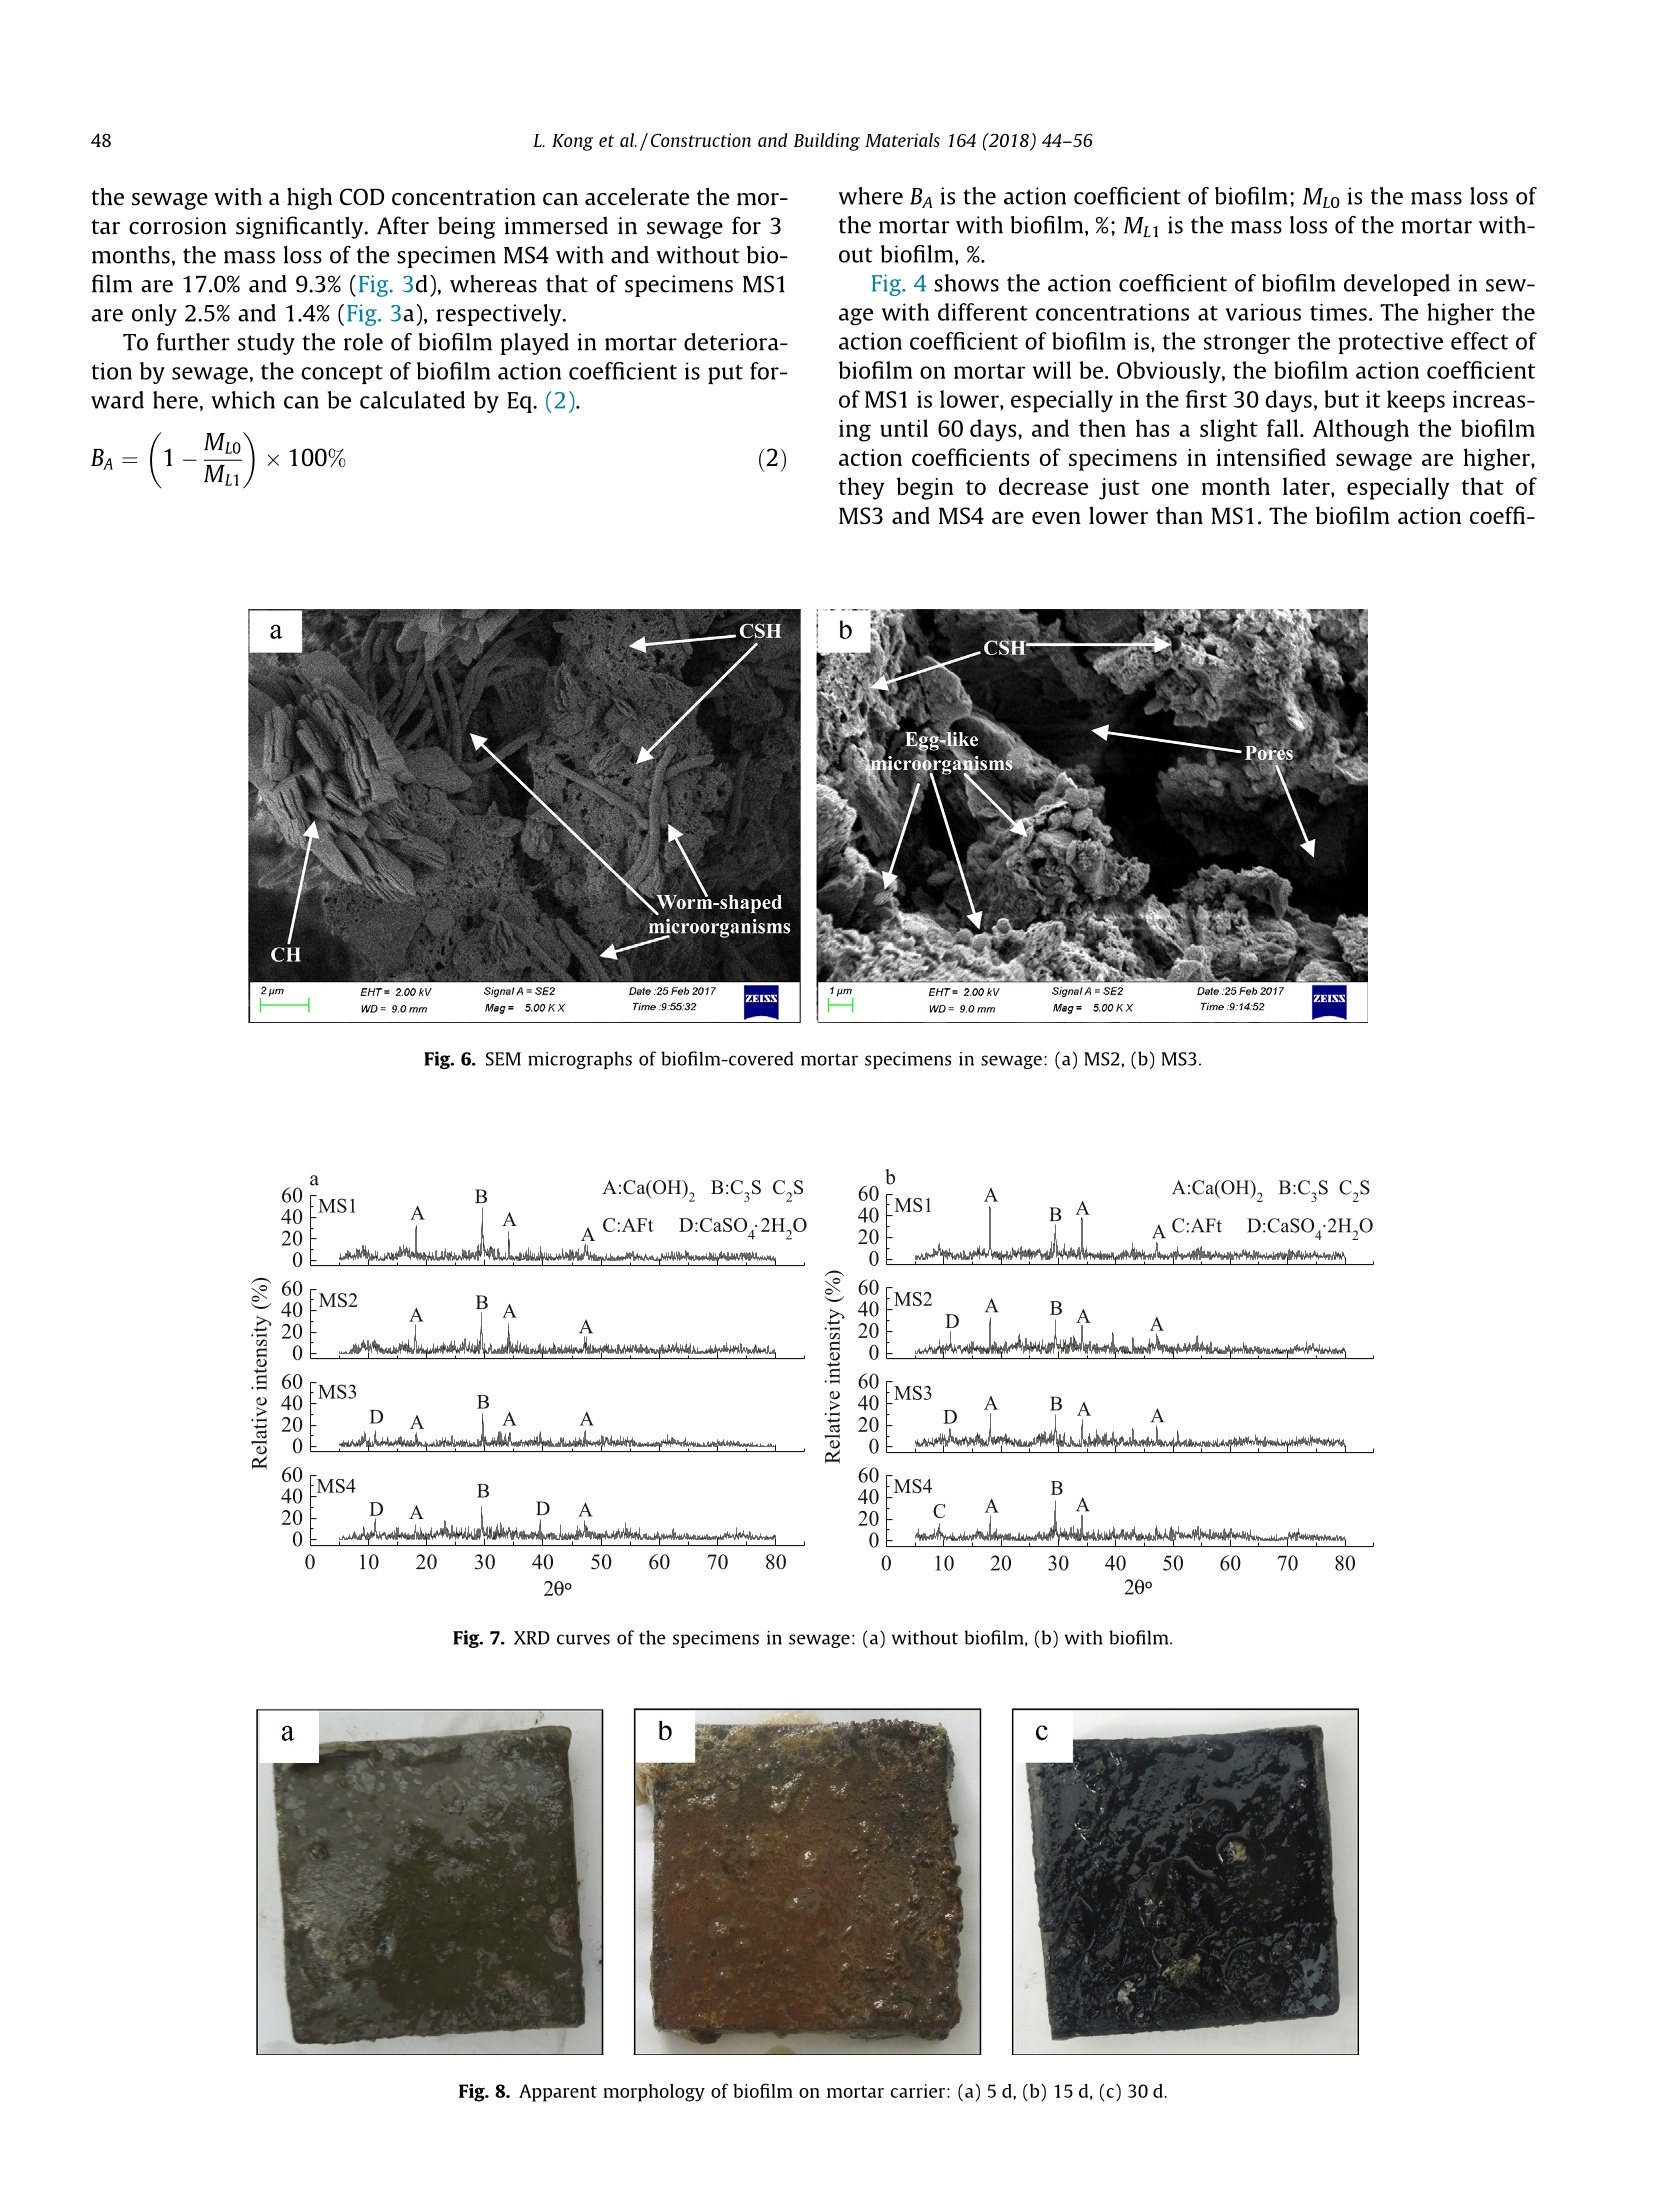
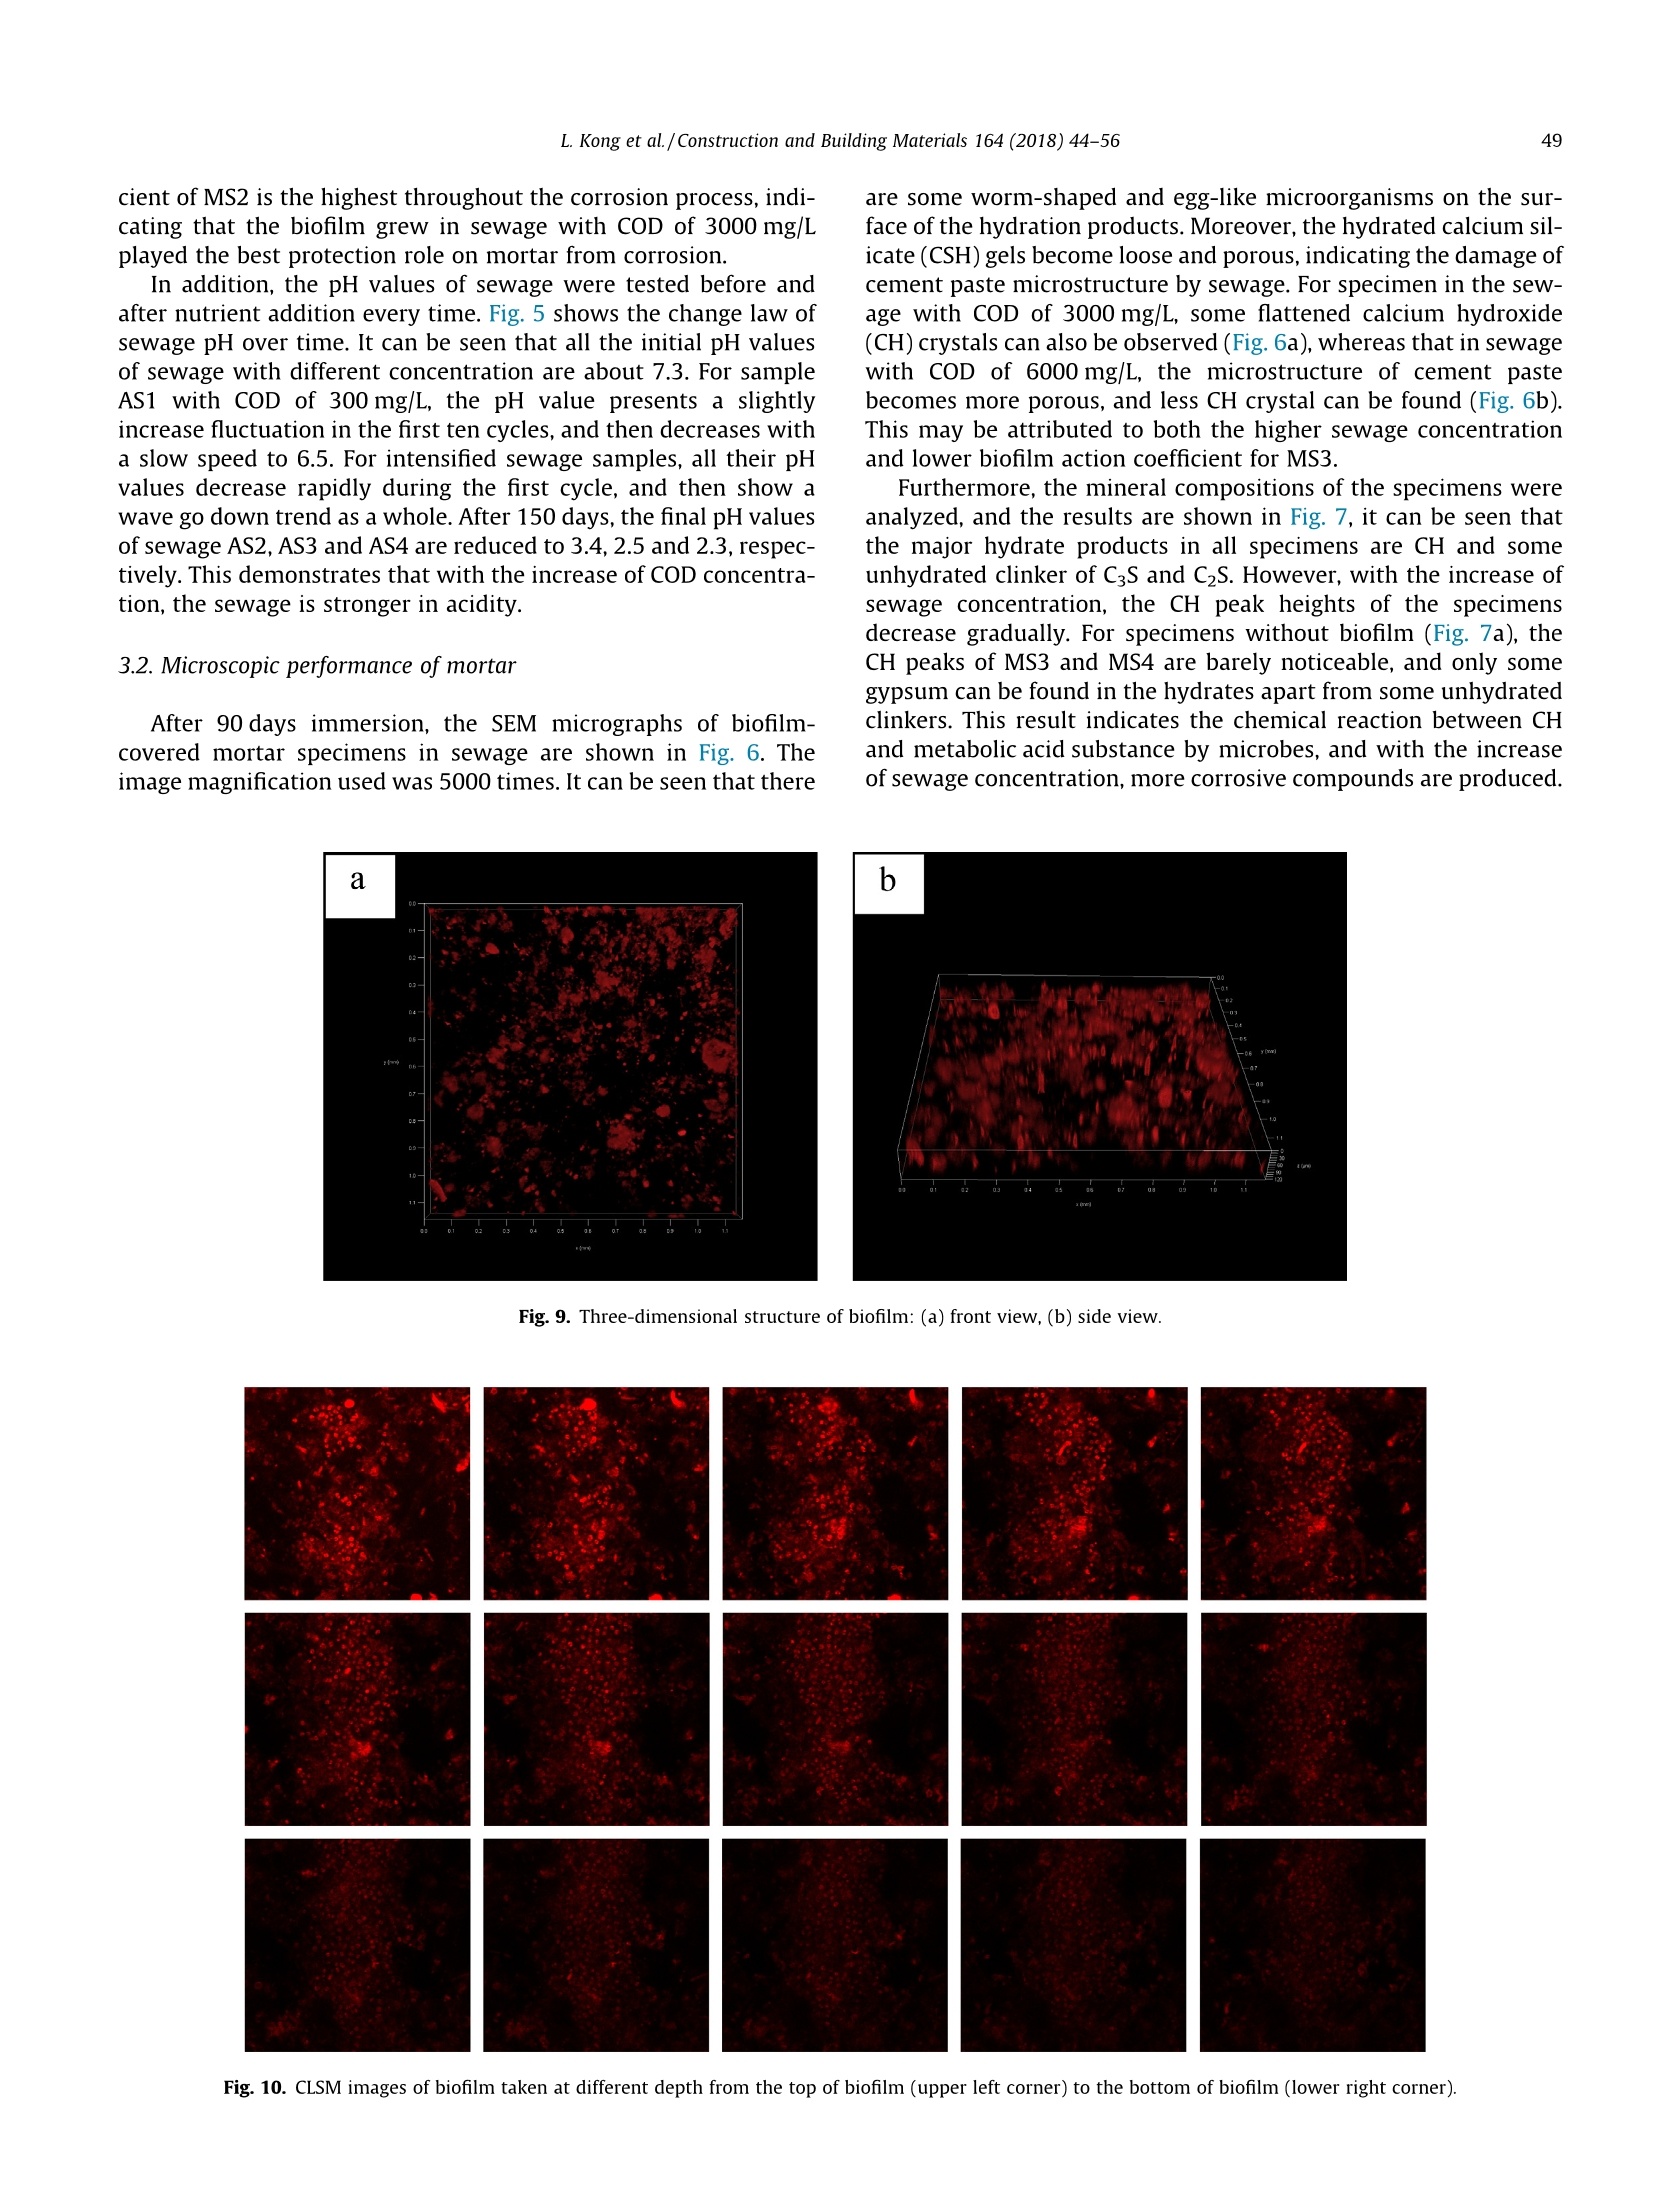
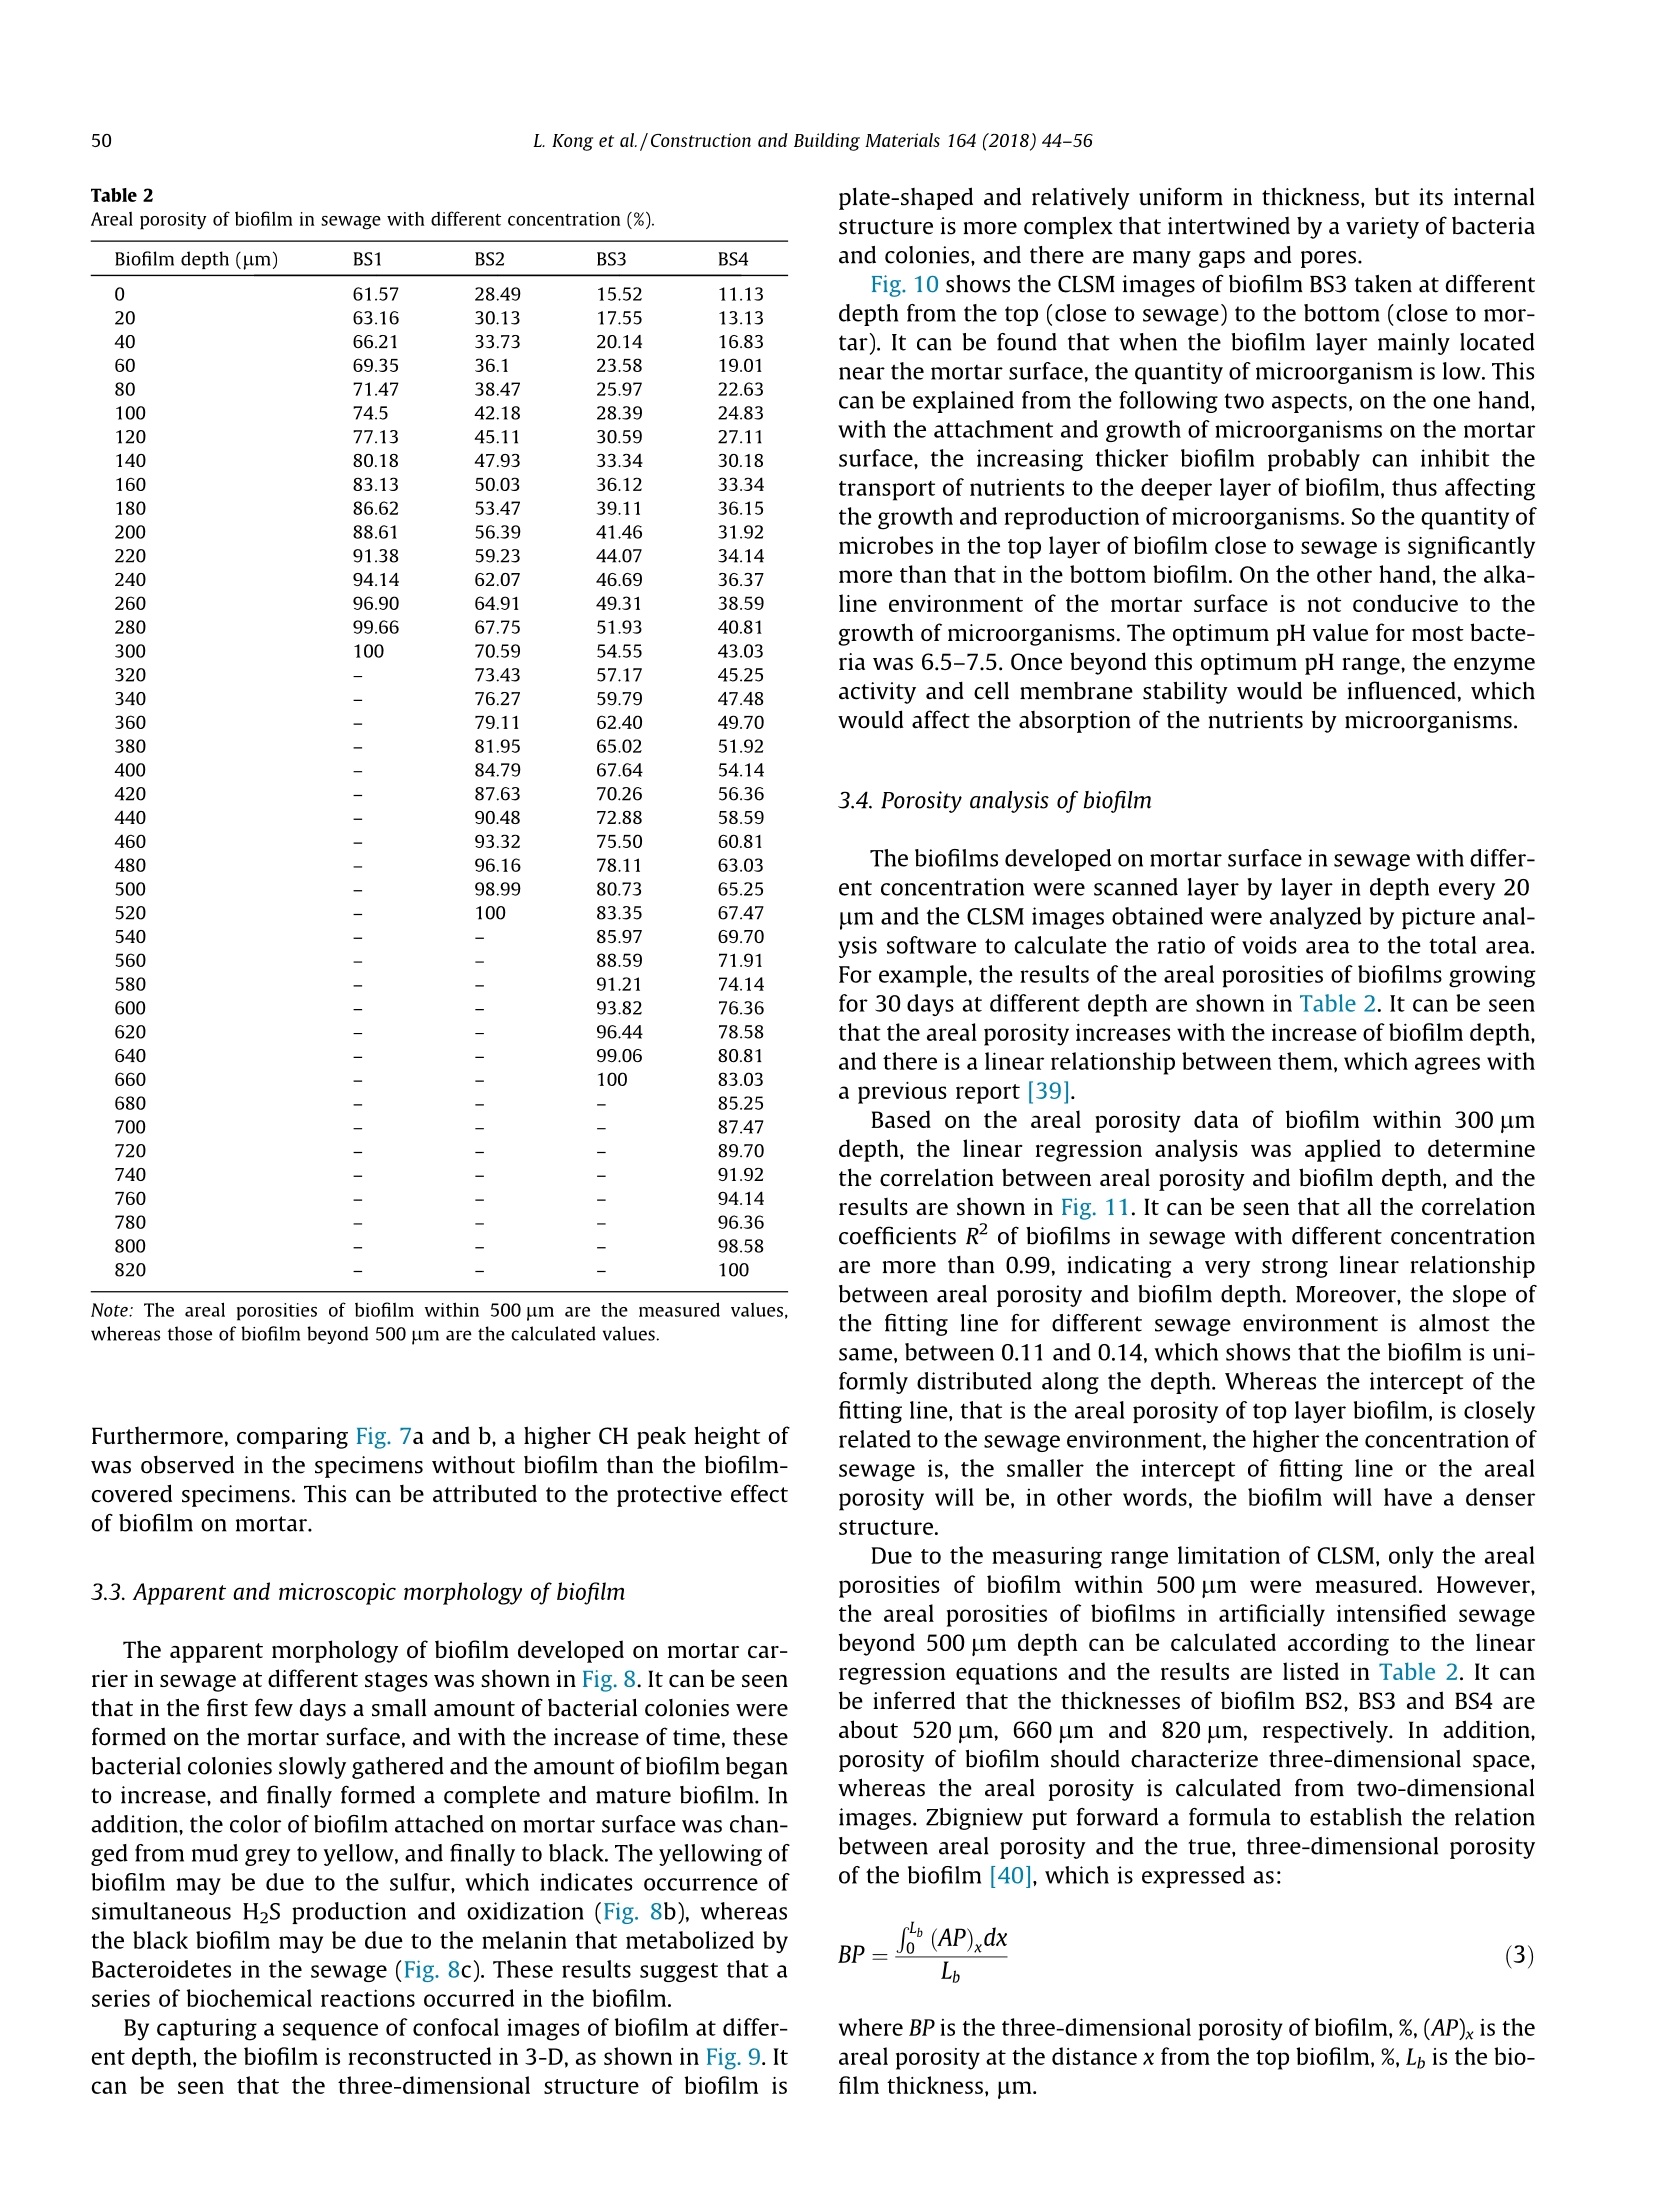
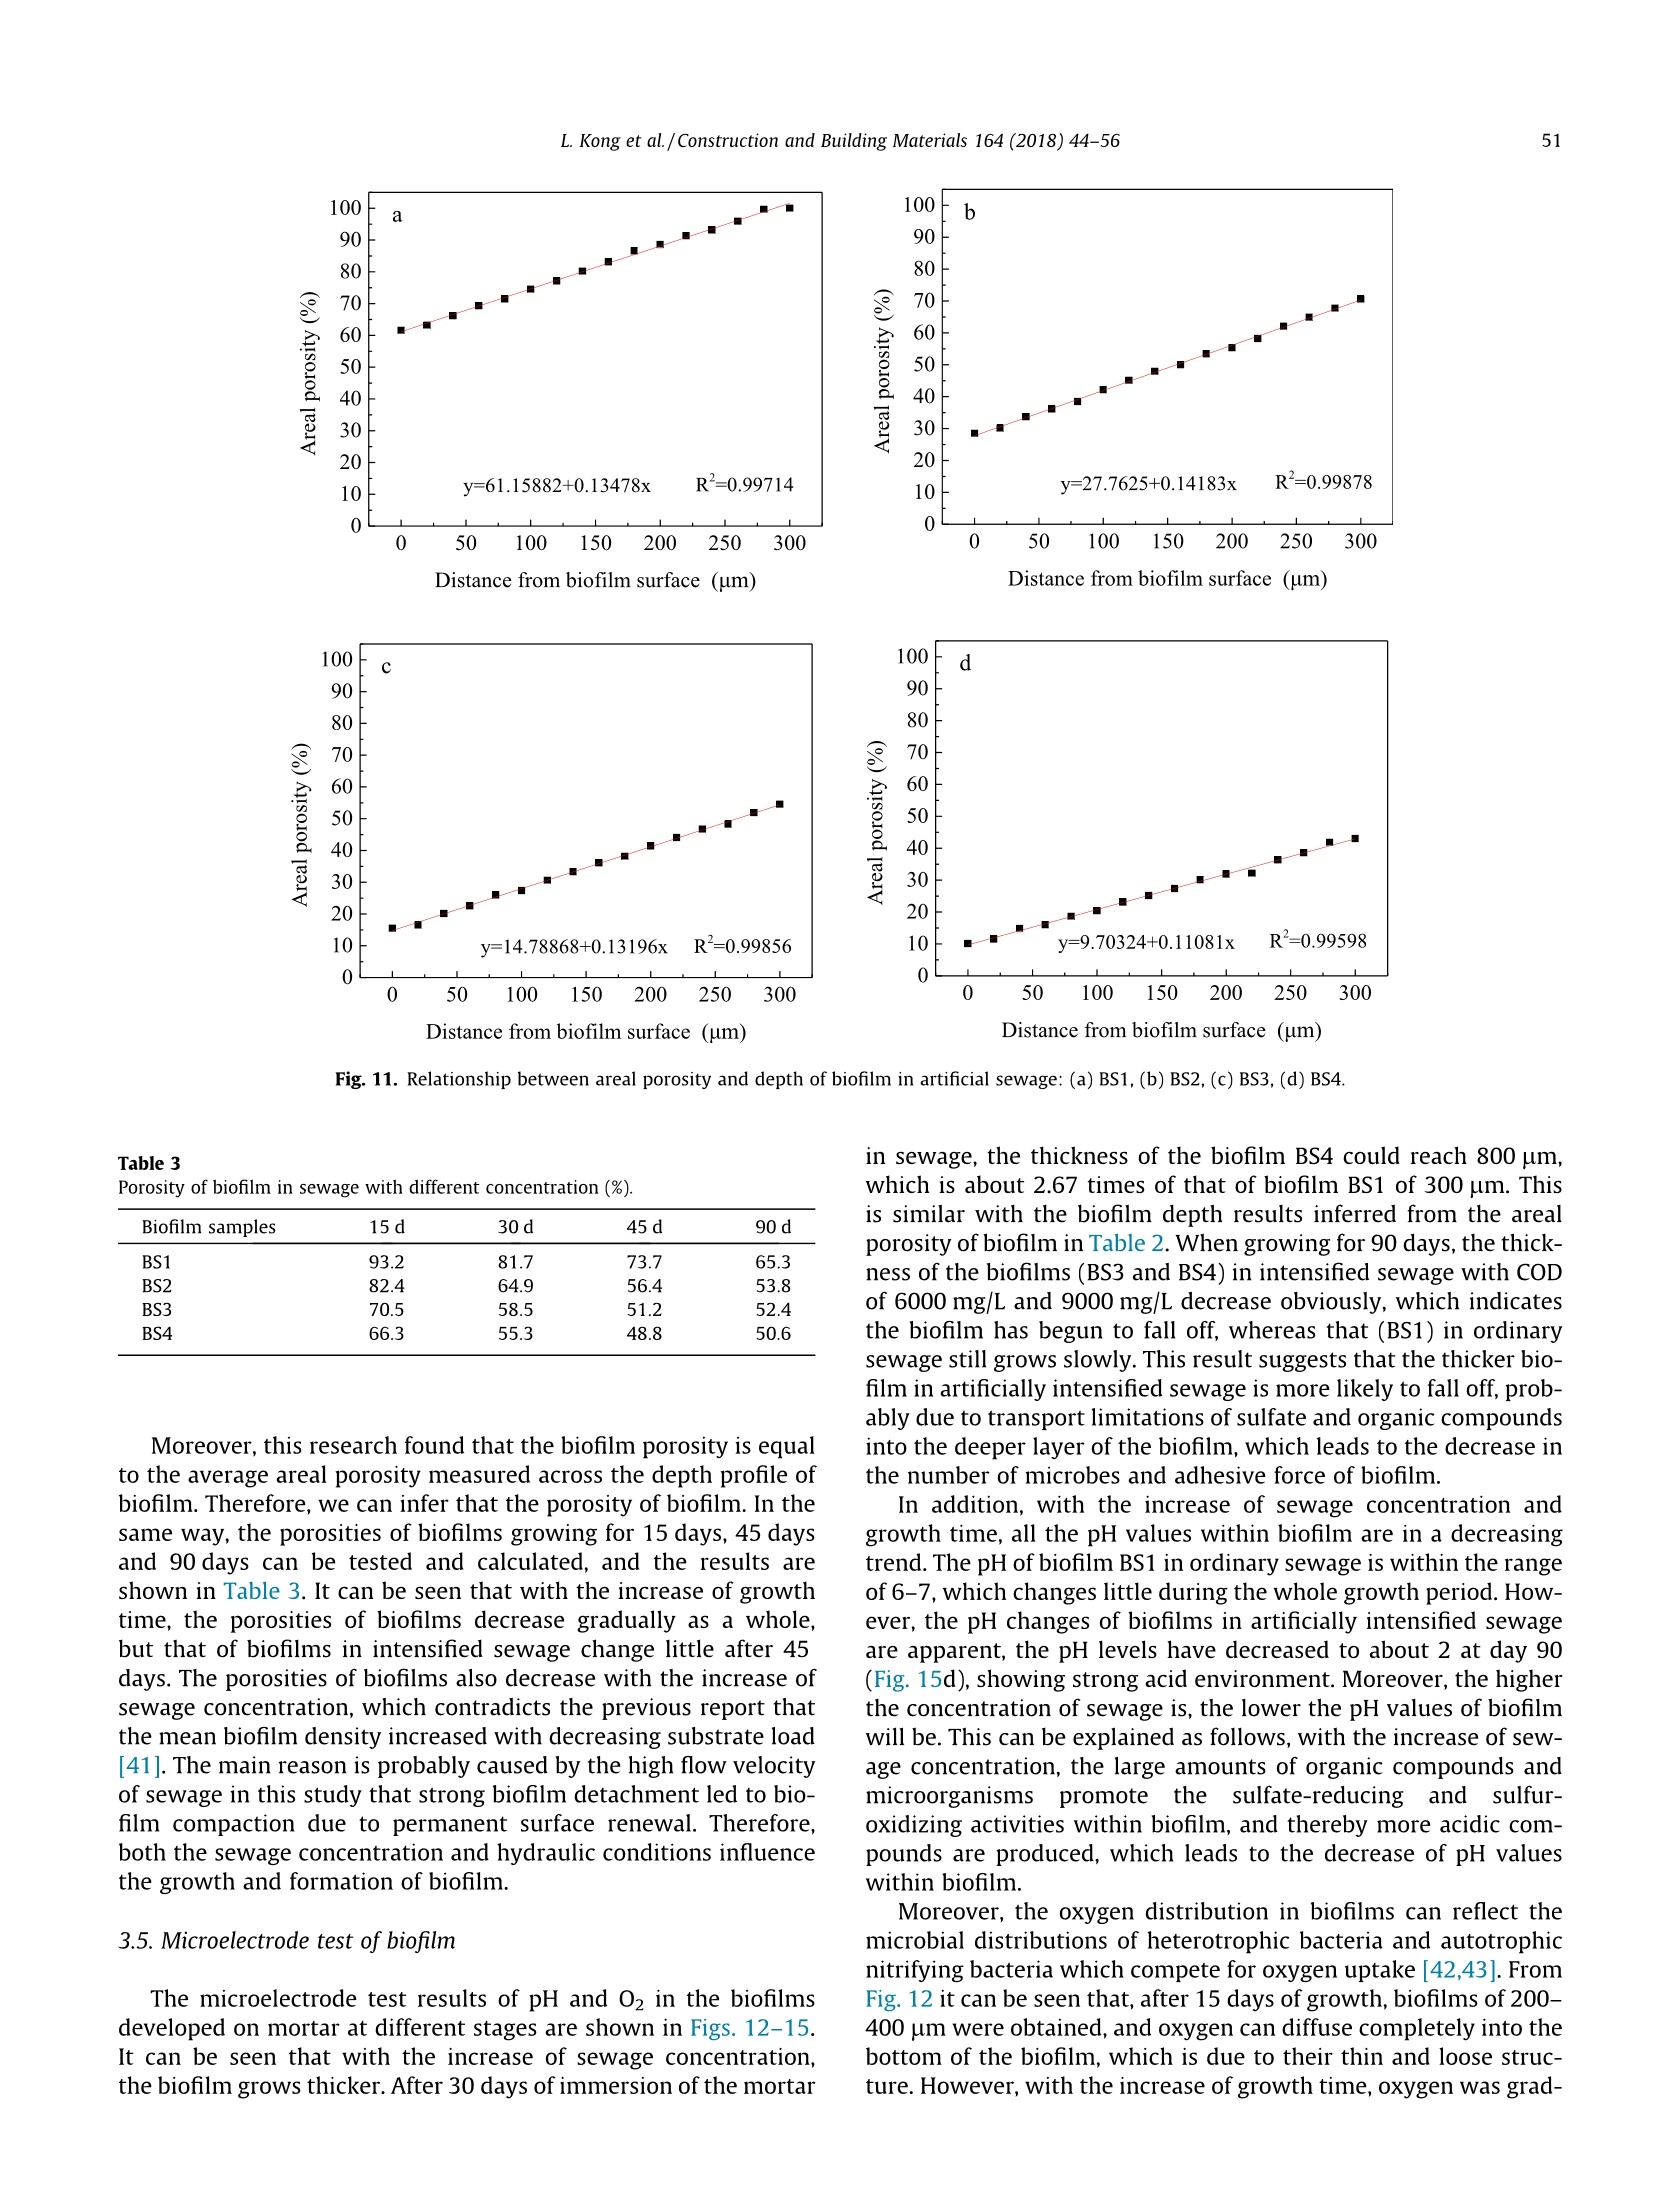
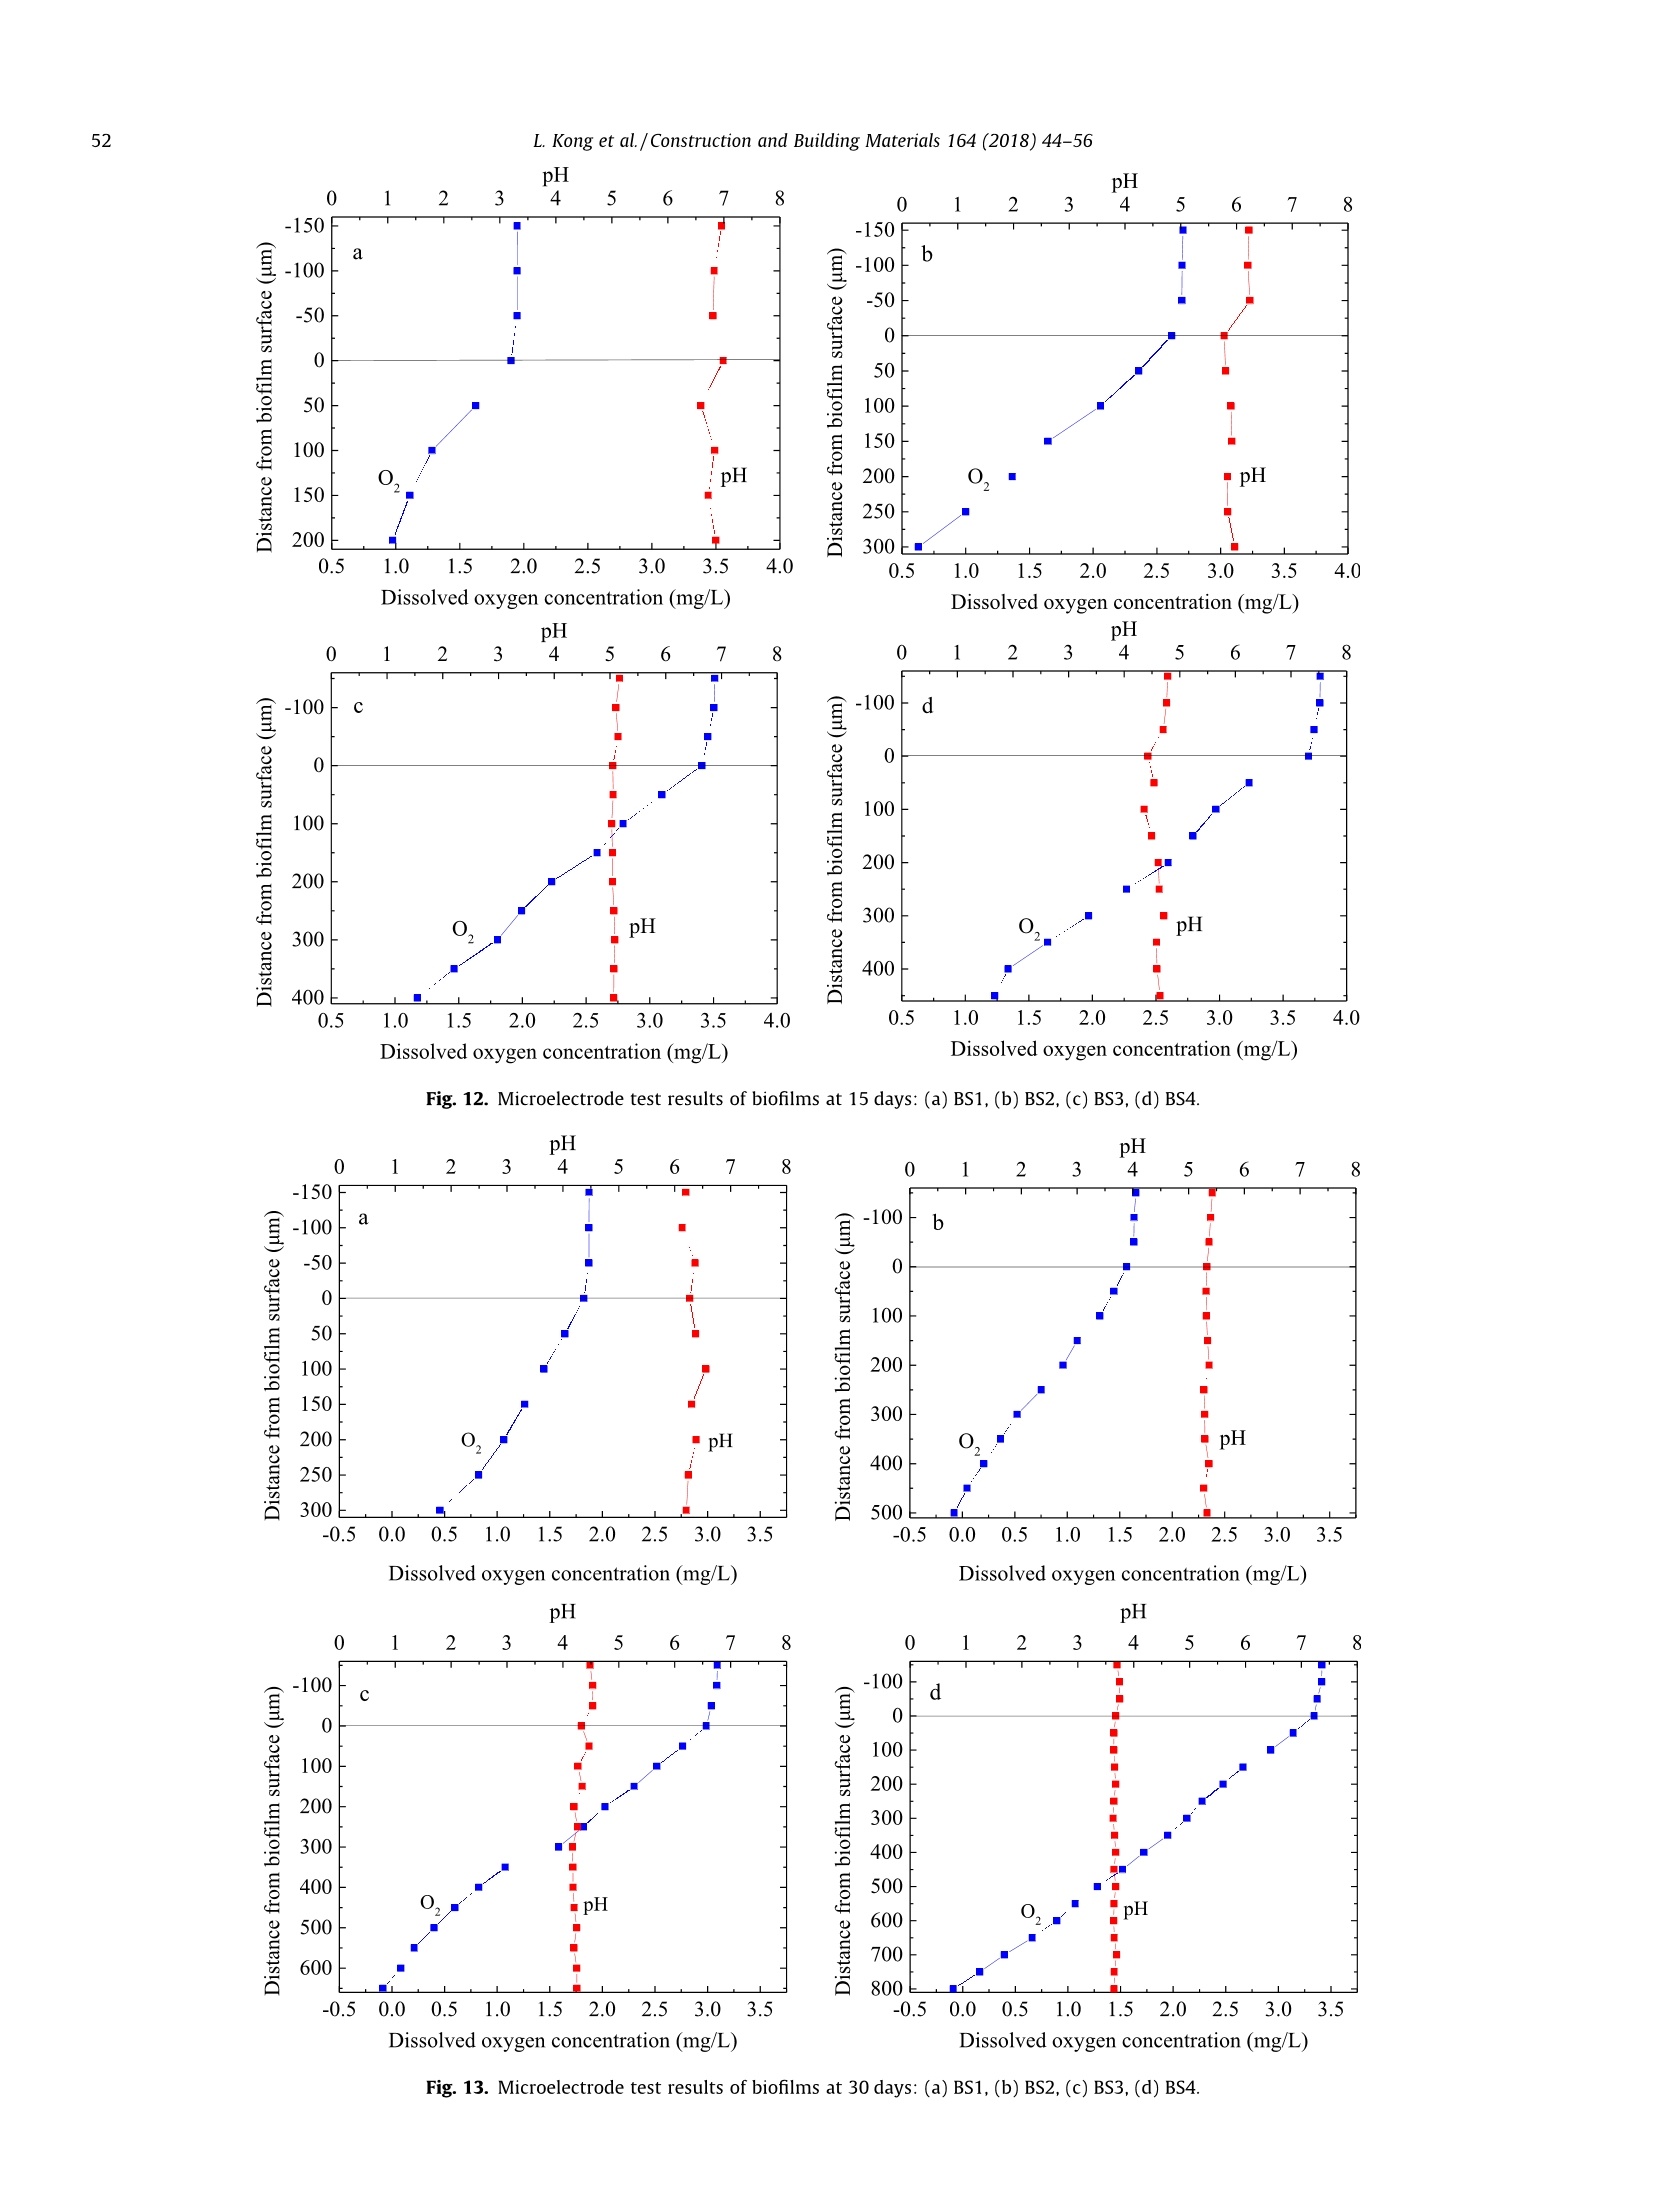
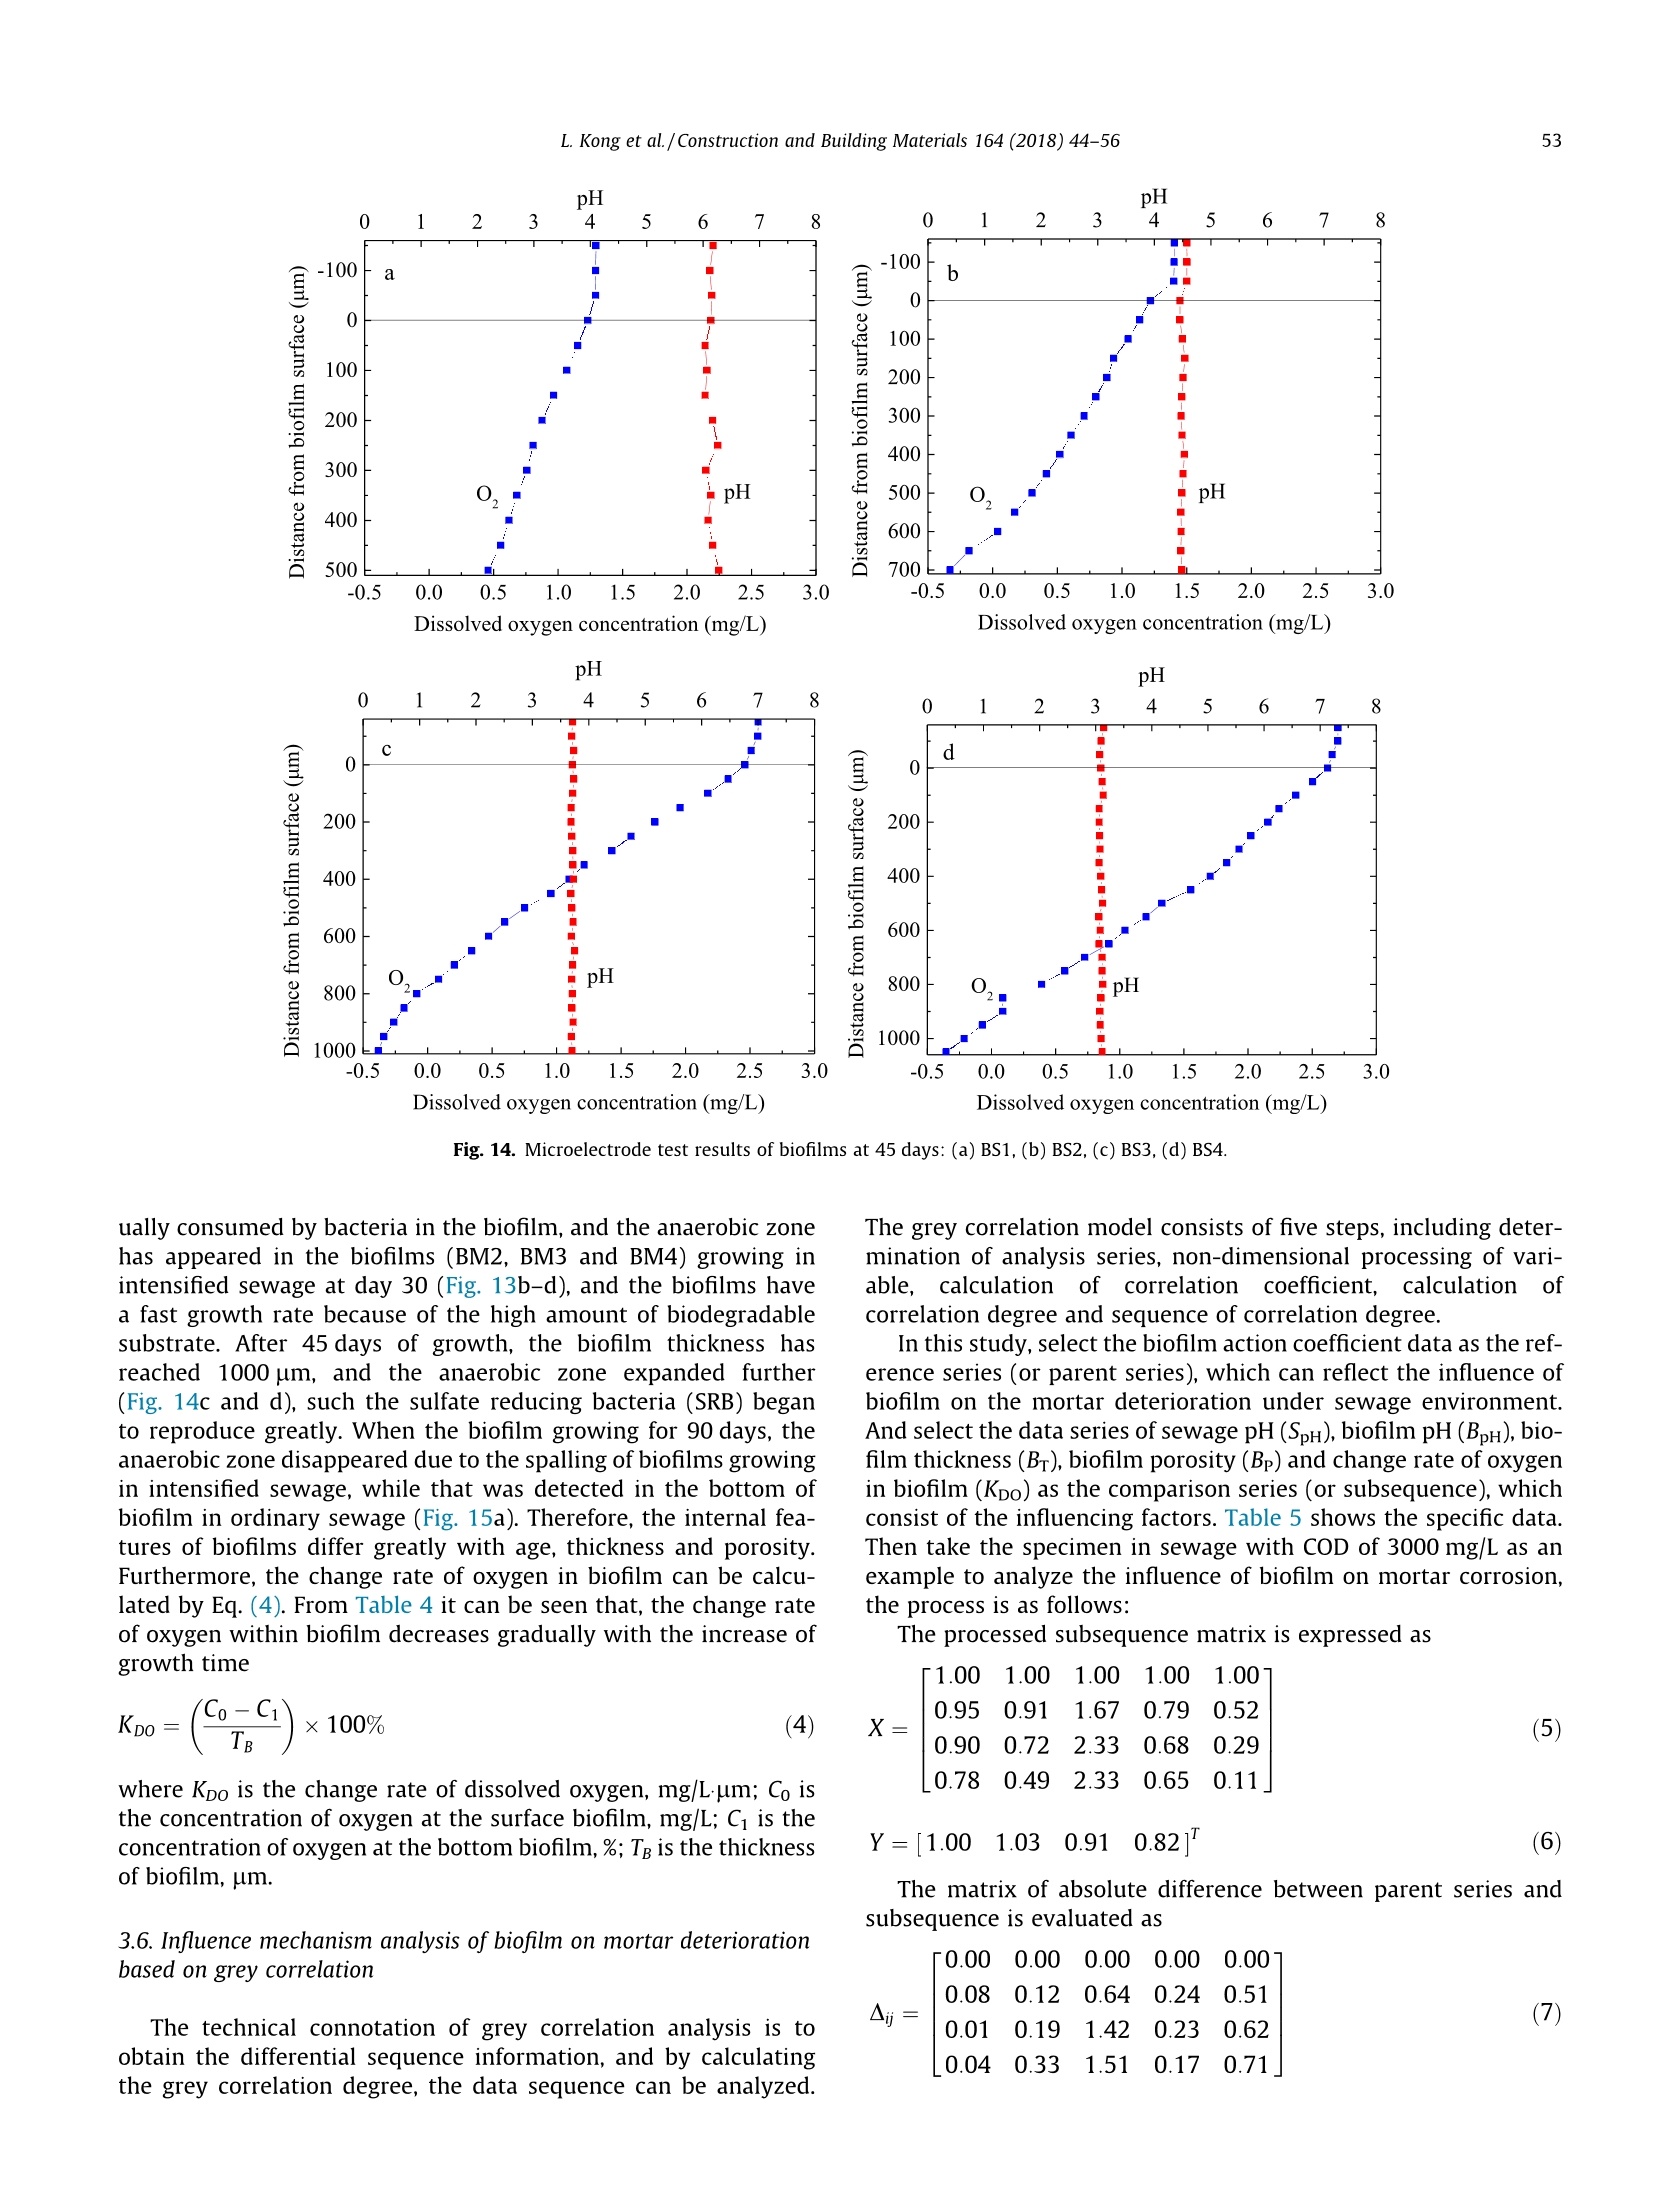
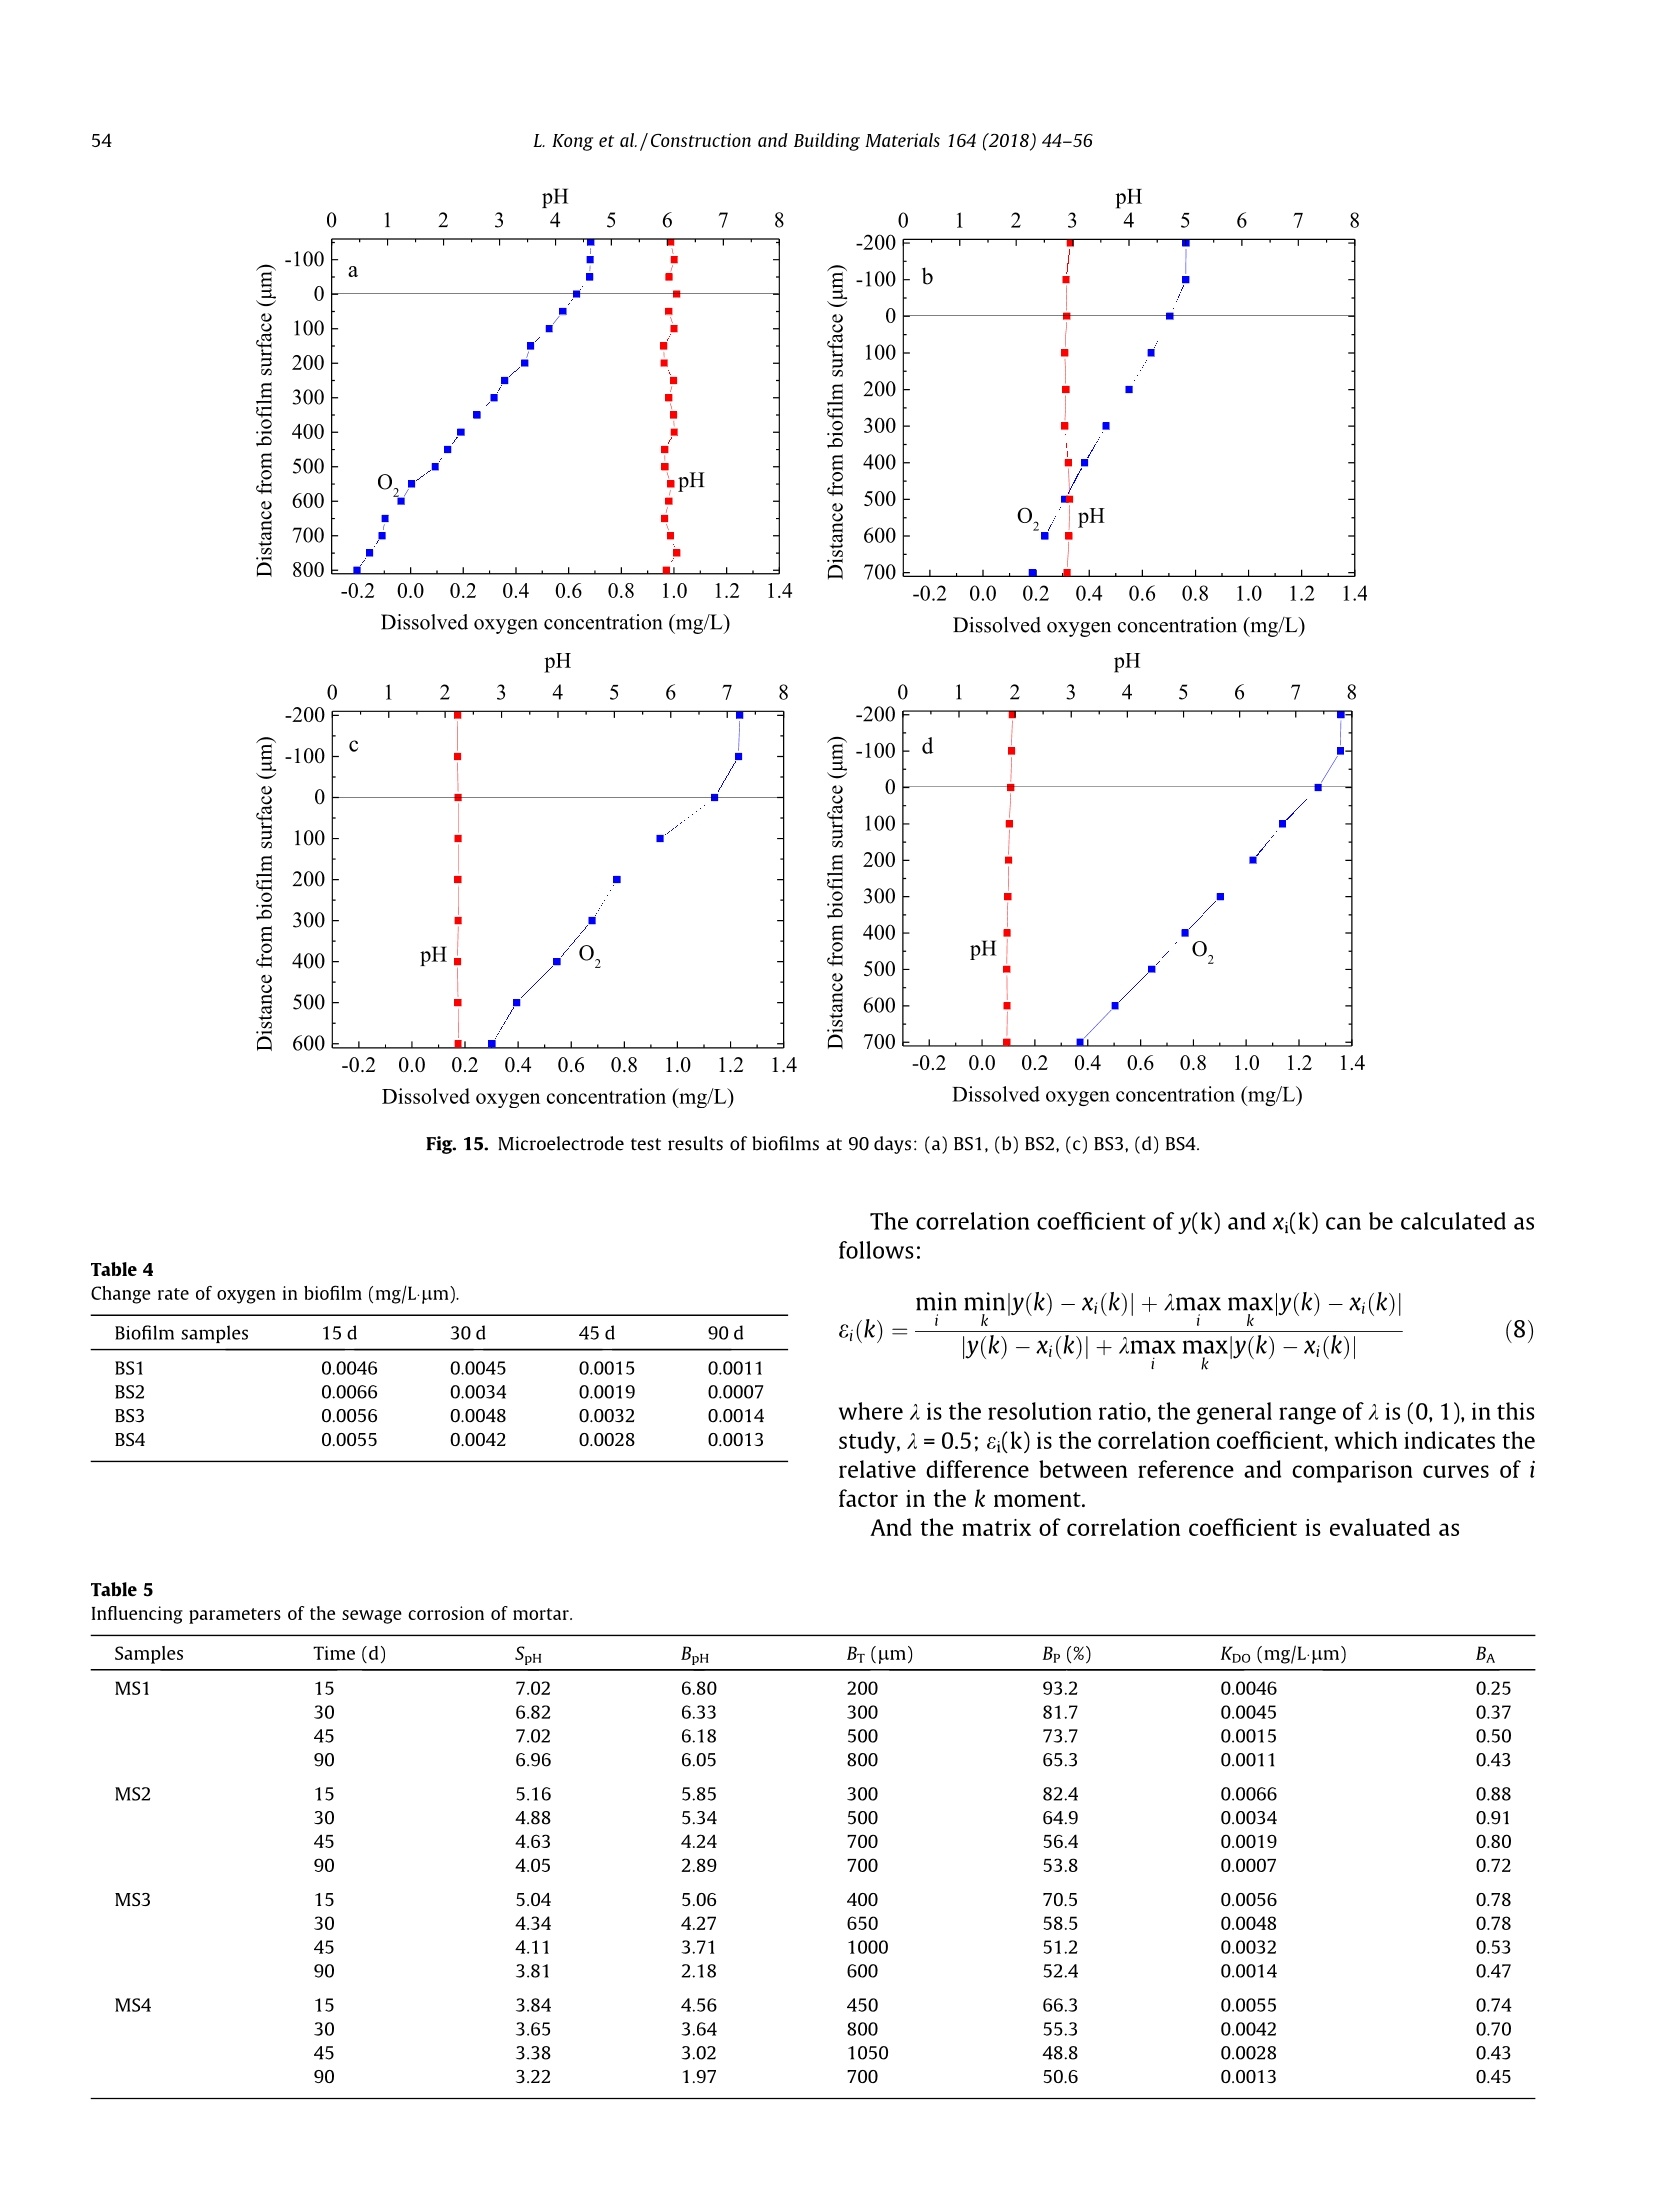
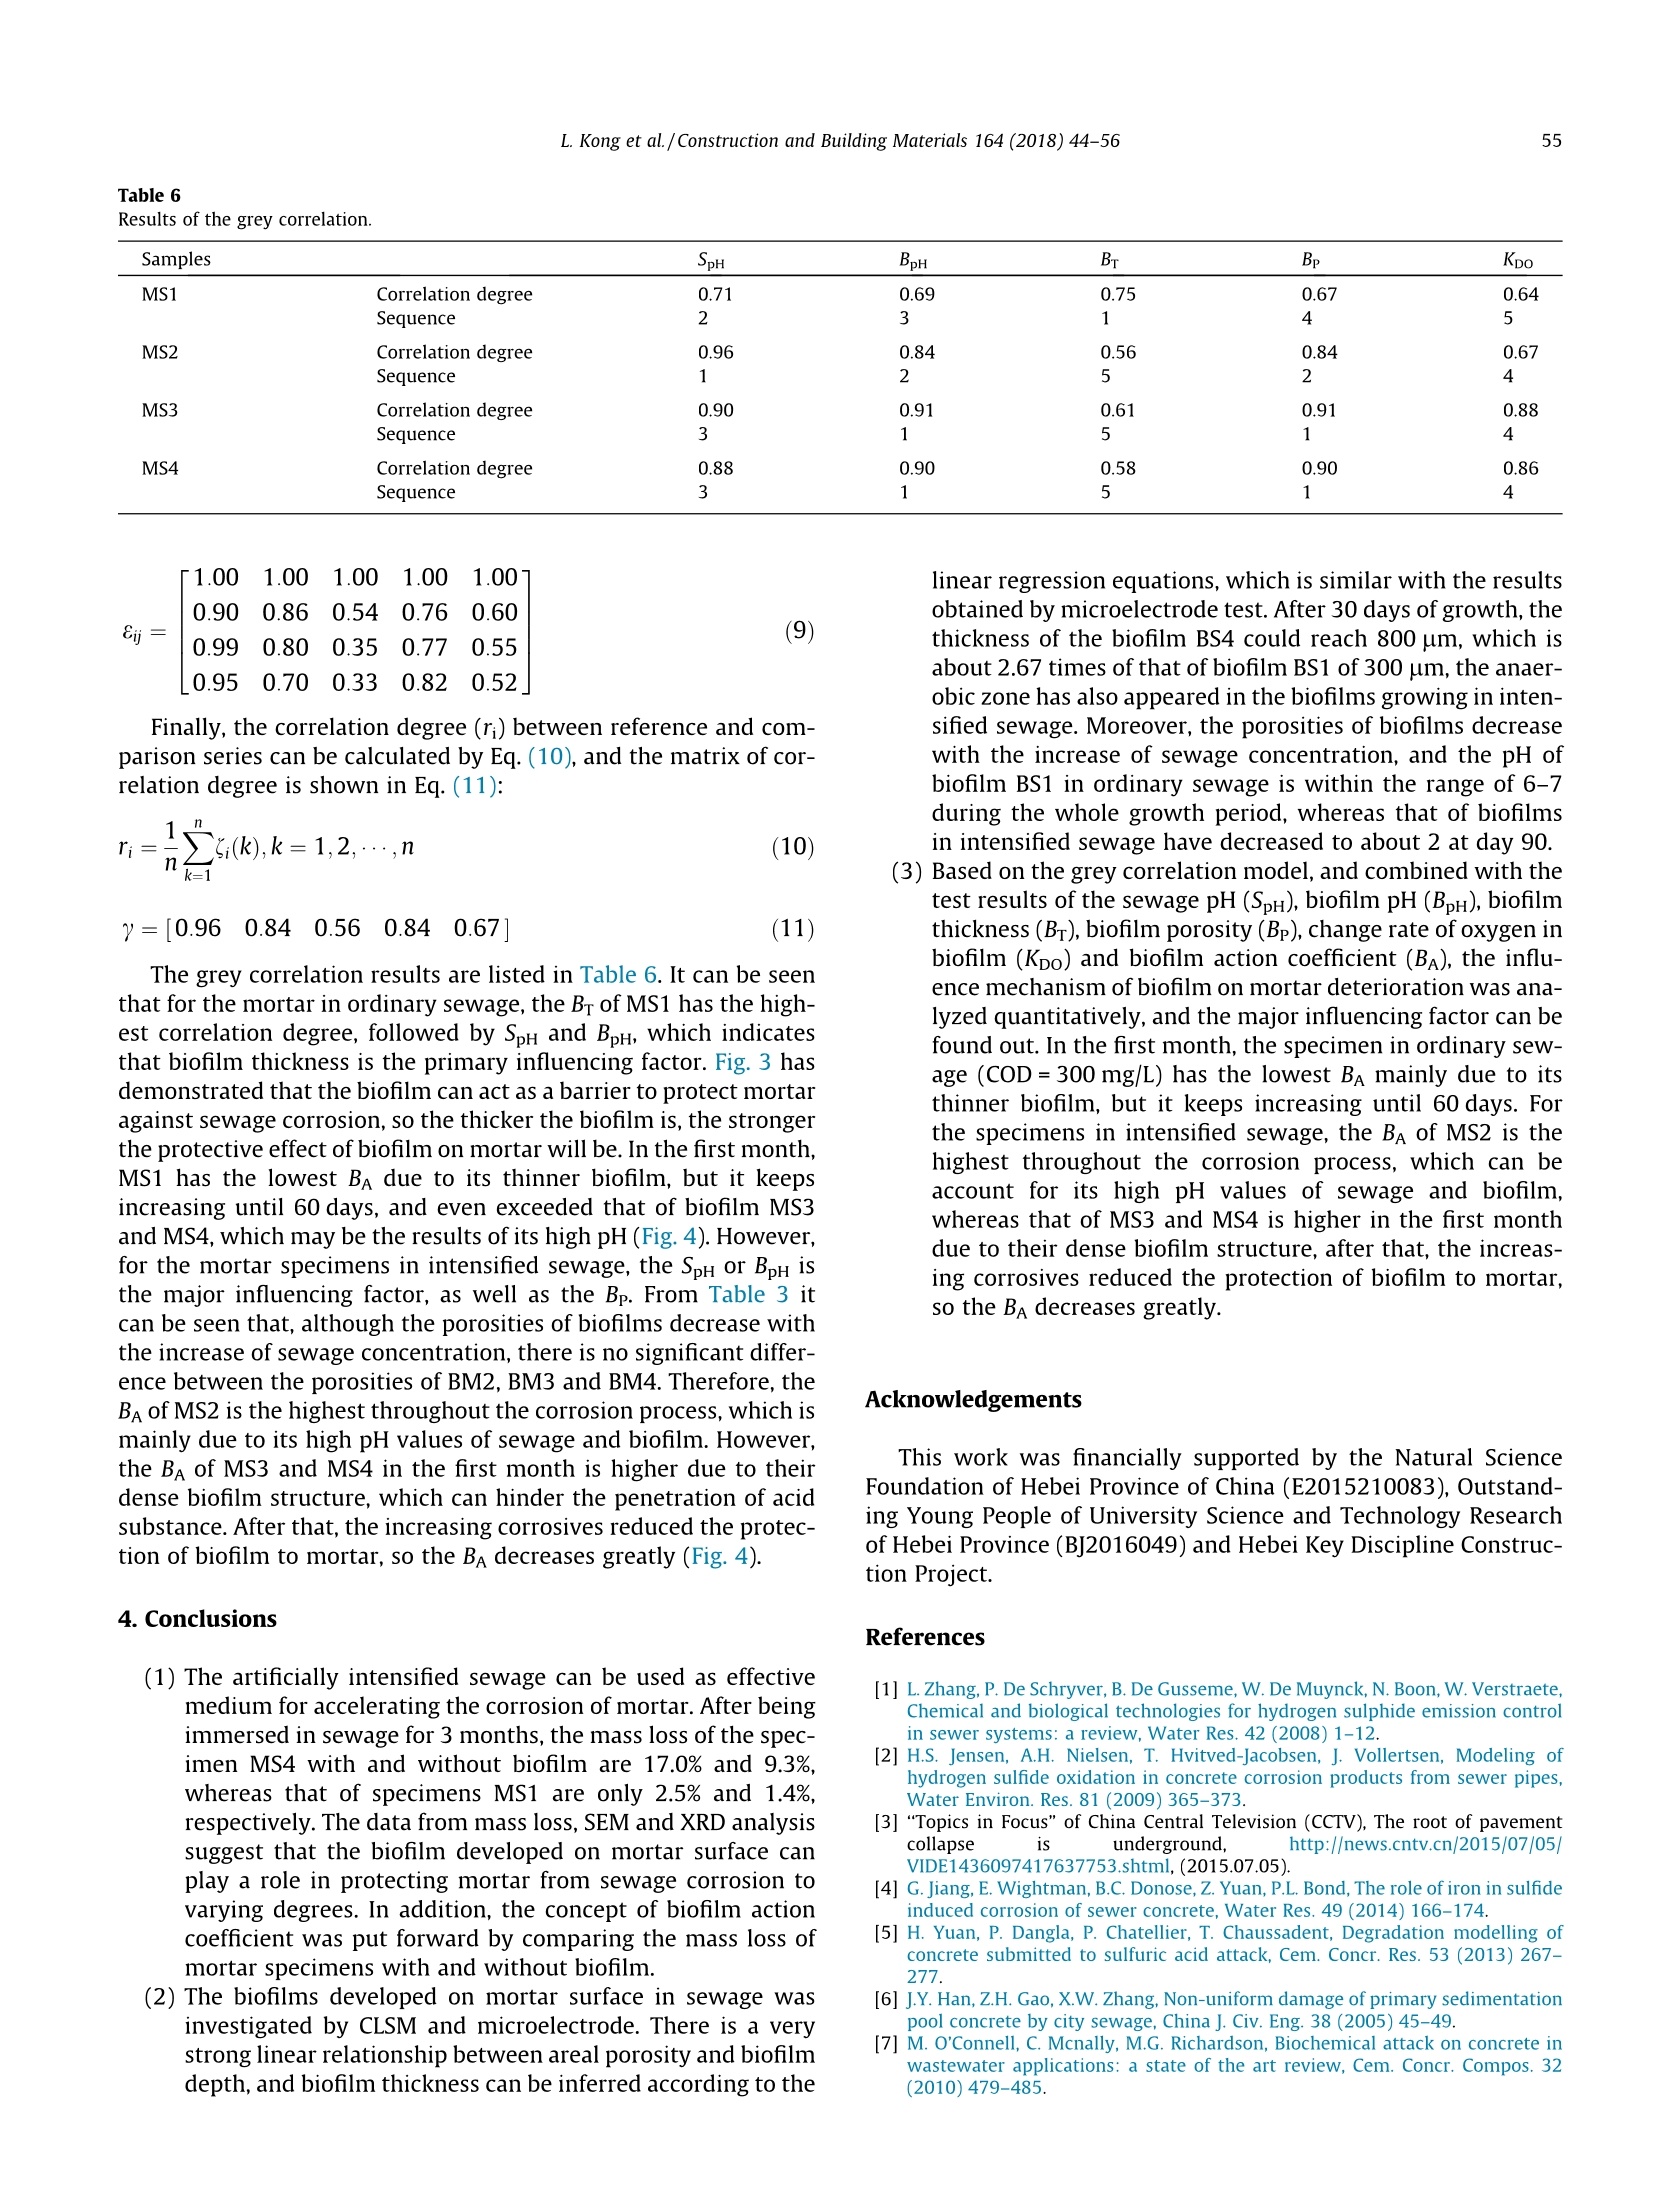
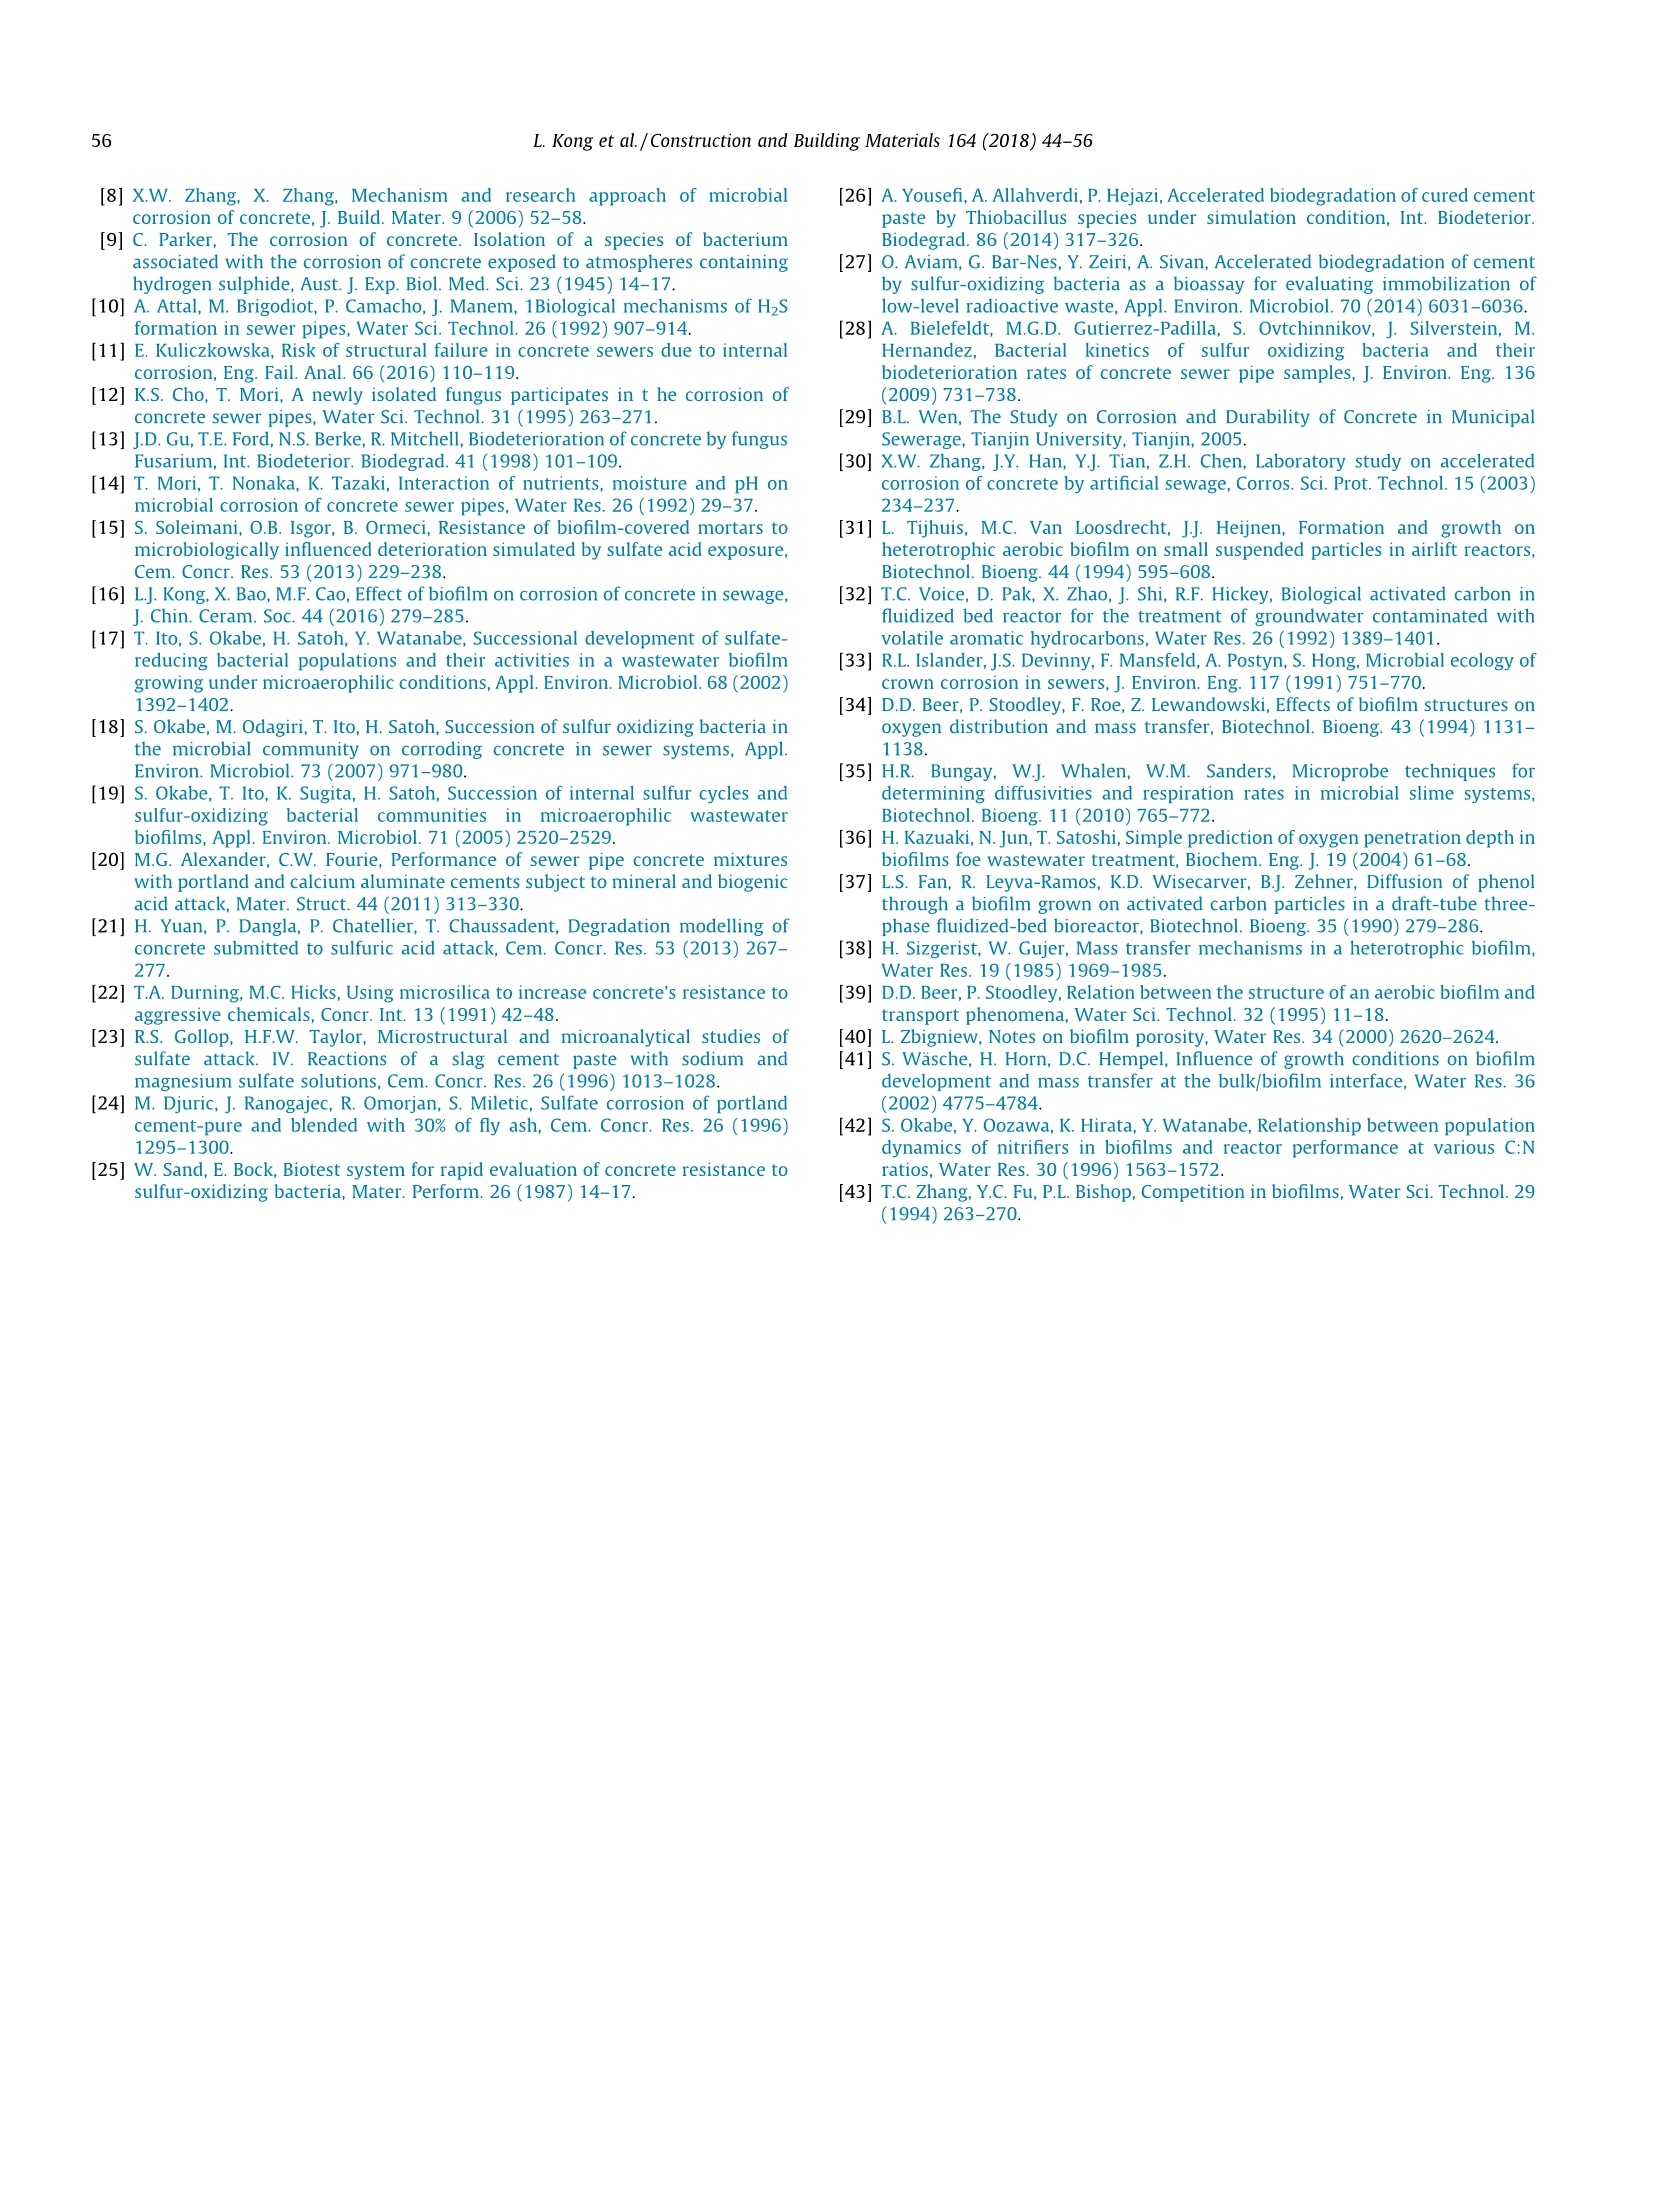
Construction and Building Materials 164 (2018)44-56 Contents lists available at ScienceDirect Construction and Building Materialsjournal homepage: www.elsevier.com/locate/conbuildmat Mechanism study of the role of biofilm played in sewage corrosion ofmortar Lijuan Kong a*, Chun Liu , Mengfan Cao, Jun Fang School of Materials Science and Engineering, Shijiazhuang Tiedao University, Shijiazhuang 050043, China School of Environmental Science and Engineering, Hebei University of Science and Technology, Shijiazhuang 050018, China HIGHLIGHTS ·The biofilm developed on mortar can act as a barrier against sewage corrosion. ·The porosities of biofilms decrease with the increase of sewage concentration. ·In ordinary sewage the thinner biofilm offers less protection on mortar corrosion. ·Dense biofilms play major role in protecting mortar from intensified sewage corrosion. ARTICLE:IN F O ABSTRACT Article history:Received 2October 2017Received in revised form 5 December 2017Accepted 27 December 2017 Available online 30 December 2017 Keywords: Artificially intensified sewage The artificially intensified sewage was prepared to simulate and accelerate the microbial corrosion ofconcrete in sewer, and the changes in weight of mortar with and without biofilm in sewage were inves-tigated comparatively, as well as the microbial structure and activities of biofilm developed on mortarsurface. Furthermore, the influence mechanism of biofilm on mortar deterioration was analyzed basedon grey correlation. The results show that the biofilm developed on mortar can act as a barrier againstsewage corrosion to varying degrees. The biofilm growing in sewage with chemical oxygen demand(COD) of 3000 mg/L has the most significant protective effect on mortar, which can be attributed to itshigh pH and dense structure. For specimens in ordinary sewage, the biofilm thickness plays the majorrole, especially in the first month, whereas that in sewage with too high concentration, the increasing cor-rosives reduced the protection of biofilm to mortar in later period. Mortar Biofilm Porosity Grey correlation 1. Introduction Worldwide, cement concrete has long been extensively used inthe municipal infrastructure due to its excellent durability. How-ever, the deterioration of concrete sewage pipelines, wastewatercollection and treatment facilities has been reported in manyplaces of the world, and millions of dollars are being spent in itsrepair and maintenance. The restoration of the overall damagedsewer systems in Germany is estimated to cost about e100 billionper year. In Los Angeles County, approximately 10% of the sewerpipes are subject to significant corrosion, and the rehabilitationcosts are as high as $400 million. It is estimated that, the UnitedStates will still need to invest $390 billion to repair existing sewagefacilities in the next 20 years [1,2]. In China, the collapse of roadfrequently occurred in recent years, which are mainly caused by ( * C orresponding author. E-mail address: klj@st d u.e d u.cn ( L. Kong). ) the aging of underground sewage pipe network. After more than40 years of service, the 5 cm of concrete pipe had only about 2cm left [3]. As the diameter of sewage pipes in China is small, soa lot of non-full flow designed pipes in the 1980s are now in fullflow operation with the continuous expansion of towns and therapid increase of population. The corrosion mechanism of sewage to concrete is very com-plex, in addition to the physical and chemical effect [4-6], themicrobiological attack has been identified as the most importantreason induced corrosion of concrete sewers [7,8]. As early as1945, Parker discovered that bacteria were involved in the deteri-oration of internal sewer concrete,and proposed the corrosionmechanism is a result of the sulfur cycle, which has also beenextensively accepted [9]. This is a complex process that involvingthe physical adsorption of gaseous H2S, chemical and biologicaloxidation of sulfide to various sulfur species, and reaction betweenthe sulfuric acid and the concrete [10]. The heaviest corrosion ofconcrete sewer pipes often occurred in the area at the crown andnear the sewage level [11]. Moreover, the nitric acid or organic acid Compositions of the nutrient solution (g/20 kg mother liquid). Sewage samples COD (mg/L) Starch Glucose Peptone Urea (NH4)2HPO4 MgSO4 NaCl AS1 300 12.0 6.0 6.0 4.0 1.8 1.3 0.6 AS2 3000 125.0 62.0 14.0 8.0 4.5 2.4 1.0 AS3 6000 200.0 110.0 28.5 12.0 6.7 3.6 1.2 AS4 9000 307.2 167.7 46.4 20.0 5.6 3.0 1.5 Fig. 1. Simulation chambers with different sewage concentration in test. produced by microbial metabolism can also lead to the corrosion ofconcrete in sewage[12,13]. It is noted that the microbial biofilmsare involved in the deterioration process of concrete under sewageenvironment. For example, the location near the sewage level canprovide a constant supply of nutrients, moisture and oxygen bysplashing and periodic immersion, which is good for the formationand growth of biofilm [14], thus the concrete corrosion is maxi-mized when the sulfate reduction and sulfur oxidation activitiesincreased in microbial community structures. However, Soleimaniet al. demonstrated that E. coli DH5o biofilm was able to provide aprotective and sustainable barrier on mortar surfaces against med-ium to strong sulfuric acid attack [15]. Kong used artificial sewageto study the effect of biofilm on concrete corrosion and also veri-fied that the biofilm can be acted as a physical barrier and reducethe permeability of sewage [16]. Thus it can be seen that, the bio-film has both positive and negative effects on the corrosion of con-crete. On the one hand, a layer of biofilm that is grown on concretesurface will provide a protective barrier reducing the transmissionofcorrosive substances. On the other hand, the production of sul-furic acid by sulfur oxidizing bacteria (SOB), which is the maincause of concrete corrosion, has been demonstrated occurring pri-marily in the biofilm [17-19]. Therefore, it is necessary to have adeeper understanding of the influence of biofilm on the corrosionof concrete in sewer system. Several methods have been developed to study the deteriora-tion of concrete in sewage. In situ exposure test can study the realprocess of corrosion directly, but it often takes a long test period[20]. In order to simulate the sewage corrosion quickly, someaggressive chemical medium [21-24] (e.g., sulfuric acid, sulfatesolution, etc.) and cultured bacteria [25-28](e.g.,Thiobacillus cul-ture medium) could be used as the corrosive medium. In China, theartificially intensified sewage with high concentration was pre-pared by adding some nutrients and controlling optimum temper- ature to promote bacterial growth, this is a good way to acceleratethe test and simulate the microbial corrosion as real as possible[29,30]. However, the effect of artificially intensified sewage ongrowth and structure of biofilm on concrete or mortar surfacehas not yet been investigated. Now, most of the studies on biofilmare focused on the biofilm formation and kinetics models in theprocess of wastewater treatment. The growth of biofilms involvesa great deal of influence factors, such as the hydraulic retentiontime, organic volume load, carrier properties and concentration,hydraulic conditions, etc. [31,32]. It should be noted that concreteis a kind of porous inhomogeneous composite material, which hasa rough and alkaline surface. The pH of a fresh concrete is about 12and most microbes cannot grow when directly exposed to suchsurface [33]. So the growth law of biofilm on concrete surfaceshould be different from that on the other carriers. In addition, the structure of biofilm also has significant influ-ence on the corrosion of concrete in sewage. The biofilm with ahigh porosity has better mass transfer characteristics, and themicrobes also have higher activity [34]. The organics and oxygenin sewage will enter into this biofilm layer and react with microor-ganisms, and the acid ion produced by microorganisms can reactwith alkaline compounds released from the concrete. Bungayet al. found that the concentration of dissolved oxygen at the bot-tom of the biofilm is very low in the continuous flowing substratewith high concentration, indicating the consumption of microbialrespiration [35]. The main mass transfer form in biofilm is diffu-sion, and the diffusion coefficient decreases with the increase ofboth biofilm thickness and density [36,37]. Moreover, the structureof biofilm is composed of a loose upper layer which is dominatedby eddy diffusion and a tight lower layer with molecular diffusion[38]. Obviously, both the thickness and pore structure of biofilmcan influence the transmission of oxygen and acid ion, which isvery important to the deterioration of concrete. In this study, the artificially intensified sewage with differentchemical oxygen demand (COD) values was prepared, and thechanges in weight of mortar specimens with and without biofilmin sewage were investigated comparatively. The deterioration ofspecimen was also evaluated by the techniques including scanningelectron microscopy (SEM) and X-ray diffraction (XRD). Moreover,the microbial structure and activities within biofilm developed onmortar surface were investigated by using confocal scanning lasermicroscopy (CSLM) and microelectrode, and the influence mecha-nism of biofilm on mortar deterioration was analyzed based ongrey correlation. The results obtained are expected to enrich ourunderstanding of the influence mechanism of biofilm on the corro-sion of concrete in sewer system. 2. Experimental program 2.1. Mortar specimens The materials used were Grade 42.5 Ordinary Portland Cement,and river sand with a fineness modulus of 2.8 and an apparent den-sity of 2.61 g/cm. The mortar mixture with a w/c of 0.5 was com-posed of 384 kg cement and 594 kg sand per cubic meter. Thedimension of mortar specimens was 70.7 mm×70.7 mm×70.7 Fig. 2. Unisense microelectrode testing system. isms for nutrients and consider the effect of pH value and osmoticpressure of medium on microbial growth. In this study, the artifi-cial sewage with high concentration was prepared as follows: first,took the activated sludge, which were obtained from the secondarysedimentation tank in Shijiazhuang Sewage Plant, as the parent,then added the nutrient solution, which were produced by addingright amount of carbon source, nitrogen source, mineral elements,growth factor, etc., to promote the reproduction of microbes. Gen-erally, the COD of the municipal sewage is about 300 mg/L. Andthere is a direct link between the COD value and the degree ofthe sewage induced corrosion of concrete. After a series of calcula-tion and adjustments, three types of intensified sewage were pre-pared, and their COD concentrations were as high as 10, 20 and 30times of ordinary sewage,respectively,the specific compositions ofnutrient solution are shown in Table 1. During the experiment, thenutrients should be added periodically (every 7 days) to maintainthe stability of sewage concentration.In addition, considering thatthe suitable temperature for most microbes to grow is 25-37 °℃, soin this study the temperature of the sewage is controlled at 30°C. mm. After curing (temperature was kept at 20 °C and the relativehumidity was higher than 95%) for 28 days, the mortar specimenswere placed in the artificially intensified sewage for corrosion andbiofilm growth. 2.3. Simulation chamber for sewage corrosion 2.2. Artificially intensified sewage The sewage is not only the corrosive medium for concrete spec-imens, but also the culture media for bacterium. Therefore, in thepreparation of artificial sewage to accelerate the corrosion, somebasic rules should be followed: meet the demand of microorgan- Fig. 1 shows the ongoing corrosion test, and the four simulationchambers were filled with different concentrations of sewage. Eachreactor was formed with a plexiglass cylindrical body (400 mminside diameter, 8 mm thick). A top cap and sealing ring were usedto keep the reactor air tight. Besides, an automatic heating rod isnecessary to keep the sewage at a constant temperature of 30℃,which is good for the growth and reproduction of microorganisms.Moreover, to prevent the sedimentation of sewage and maintain auniform and stabilized corrosive environment, a mixer was fixed Corrosion times (days) Fig. 3. Mass change of mortar specimens with and without biofilm in sewage: (a) MS1, (b)MS2, (c) MS3,(d) MS4. on the center of the device. The medium inside the chamber wasreplaced with the fresh nutrient solution every seven days by usinga pump. The total liquid volume removed per cycle was less than30% of the original volume of sewage. Mortar specimens wereplaced on the shelf that brushed with anticorrosive paint andimmersed in the sewage,thus each surface of the specimens couldbe corroded fully and evenly. 2.4. Mass change of mortar specimens The mass change of mortar specimens were determined bygravimetric method measured by a digital balance having a preci-sion of ±0.01. For the test of specimens without biofilm, the biofilmdeveloped on mortar surface should be brushed off every day, andone group of specimens was applied to the tracking test. For thetest of specimens with biofilm, the biofilm was allowed to growon the mortar surface, and six groups of specimens were appliedto record the mass after immersed in sewage for 15 d, 30 d, 45 d,60 d, 75 d and 90 d, respectively. Before weighing the specimensshould be washed and kept the condition of inside saturated andsurface dry. For each group three specimens were tested and thevalues were averaged. The mass change can be obtained accordingto Eq.(1). where M, is the mass loss of mortar,%; Ma is the mass of the mortarafter being immersed in sewage, g; M, is the mass of the mortarbefore being immersed in sewage,g. 2.5. Microscopic performance ofmortar specimens In order to deeply investigate the effect of biofilm on the dete-rioration of mortar microstructure in sewage, the SEM micrographsof the surface specimens with and without biofilm were obtainedcomparatively, and the image magnification used was 3000 times.Besides, some samples from the surface layer were grinded usingagate morear to take the XRD and TGA analysis. The XRD measure-ments were performed using a Bruker D8 diffractometer. Spectrawere obtained in the range of 4°<20<60°. For TGA measurementa sample of 150 mg was heated in a N2 atmosphere at a rate of 10C/min. 2.6. CLSM observation and porosity analysis of biofilm Mortar specimens with attached surface biofilm were removedfrom sewage and dipped in buffer solution, which consist of NaCl(137 mmol/L), KCl (2.7 mmol/L), NazHPO4 (4.3mmol/L) and KH2-PO4 (1.4 mmol/L), to rinse off the loose cells. The biofilm wasstained in the diluted rhodamine red fluorescent staining solutionand incubated for 1 h at room temperature. After rinsing again, themicrobial community structures of biofilm were visualized underFluoview FV-1000 CLSM. The wavelengths of excitation photonand emission photon are 543 nm and 591 nm, respectively. Basedon the CLSM images, the areal porosities of biofilm at differentdepth and grown in different sewage environment were analyzedby DT2000 picture analysis software. The analysis process mainlyincludes four steps: shadow correction, grey image conversion,image segmentation and target measurement. 2.7. Microelectrode measurement of biofilm For microelectrode measurement, the silk stocking with densemesh structure was put on the mortar surface to grow biofilm, sothat the biofilm can be easily removed from mortar surface and protect the tip of the microelectrode from being damaged. Thetip of the microelectrode was 5 um in diameter and its timeresponse of 90% (t90) was about 10 s. The position of the biofilmsurface was determined visually under a microscope. The biofilmswere fixed on agar and immersed in sewage obtained from thereactor, and then the in situ steady-state concentration profilesof pH and O2 within the biofilms were measured, using Unisensemicroelectrode testing system (Fig. 2). All measurements were per-formed at 20°C within several minutes. At least three concentra-tion profiles were measured for each biofilm specimens. 3. Results and discussion The mortar specimens, which were immersed in sewage withCOD concentrations of 300 mg/L, 3000 mg/L, 6000 mg/L and9000 mg/L, are designated as MS1, MS2, MS3 and MS4, respec-tively. Moreover, the biofilms that were developed on these mortarspecimens are correspondingly designated as BS1, BS2, BS3 andBS4. 3.1.Mass change of mortar The mass changes of mortar specimens with and without bio-film in sewage were tracking tested for 3 months. From the resultsshown in Fig. 3, it can be seen that with the increase of corrosiontime, the mass losses of all the specimens increase gradually,andthat of specimens without biofilm is significant higher than thatof specimens with biofilm, indicating that the biofilm can protectmortar against sewage corrosion to a certain extent. Moreover, Fig. 4. Effect of biofilm on the mass change of mortar specimens in sewage. Fig. 5. Change of pH values of sewage with different concentration. the sewage with a high COD concentration can accelerate the mor-tar corrosion significantly. After being immersed in sewage for 3months, the mass loss of the specimen MS4 with and without bio-film are 17.0% and 9.3% (Fig. 3d), whereas that of specimens MS1are only 2.5% and 1.4% (Fig. 3a), respectively. where BA is the action coefficient of biofilm; MLo is the mass loss ofthe mortar with biofilm,%; Mui is the mass loss of the mortar with-out biofilm,%. To further study the role of biofilm played in mortar deteriora-tion by sewage, the concept of biofilm action coefficient is put for-ward here, which can be calculated by Eq. (2). Fig. 4 shows the action coefficient of biofilm developed in sew-age with different concentrations at various times. The higher theaction coefficient of biofilm is, the stronger the protective effect ofbiofilm on mortar will be. Obviously, the biofilm action coefficientof MS1 is lower, especially in the first 30 days, but it keeps increas-ing until 60 days, and then has a slight fall. Although the biofilmaction coefficients of specimens in intensified sewage are higher,they begin to decrease just one month later, especially that ofMS3 and MS4 are even lower than MS1. The biofilm action coeffi- Fig. 6. SEM micrographs of biofilm-covered mortar specimens in sewage:(a)MS2, (b) MS3. Fig. 7. XRD curves of the specimens in sewage: (a) without biofilm, (b) with biofilm. a b C Fig. 8. Apparent morphology of biofilm on mortar carrier:(a) 5 d, (b) 15 d, (c) 30 d. cient of MS2 is the highest throughout the corrosion process, indi-cating that the biofilm grew in sewage with COD of 3000 mg/Lplayed the best protection role on mortar from corrosion. In addition, the pH values of sewage were tested before andafter nutrient addition every time. Fig. 5 shows the change law ofsewage pH over time. It can be seen that all the initial pH valuesof sewage with different concentration are about 7.3. For sampleAS1 with COD of 300 mg/L, the pH value presents a slightlyincrease fluctuation in the first ten cycles, and then decreases witha slow speed to 6.5. For intensified sewage samples, all their pH'asf 1values decrease rapidly during the first cycle, and then show awave go down trend as a whole. After 150 days, the final pH valuesof sewage AS2, AS3 and AS4 are reduced to 3.4, 2.5 and 2.3, respec-tively. This demonstrates that with the increase of COD concentra-tion, the sewage is stronger in acidity. 3.2. Microscopic performance of mortar After 90 days immersion, the SEM micrographs of biofilm-covered mortar specimens in sewage are shown in Fig. 6. Theimage magnification used was 5000 times. It can be seen that there are some worm-shaped and egg-like microorganisms on the sur-face of the hydration products. Moreover, the hydrated calcium sil-icate (CSH) gels become loose and porous, indicating the damage ofcement paste microstructure by sewage. For specimen in the sew-age with COD of 3000 mg/L, some flattened calcium hydroxide(CH) crystals can also be observed (Fig.6a), whereas that in sewagewith COD of 6000 mg/L, the microstructure of cement pastebecomes more porous, and less CH crystal can be found (Fig. 6b).This may be attributed to both the higher sewage concentrationand lower biofilm action coefficient for MS3. Furthermore, the mineral compositions of the specimens wereanalyzed, and the results are shown in Fig. 7, it can be seen thatthe major hydrate products in all specimens are CH and someunhydrated clinker of C3S and C2S. However, with the increase ofsewage concentration, the CH peak heights of the specimensdecrease gradually. For specimens without biofilm (Fig. 7a), theCH peaks of MS3 and MS4 are barely noticeable, and only somegypsum can be found in the hydrates apart from some unhydratedclinkers. This result indicates the chemical reaction between CHand metabolic acid substance by microbes, and with the increaseof sewage concentration, more corrosive compounds are produced. Fig. 9.Three-dimensional structure of biofilm: (a) front view, (b)side view. Fig. 10. CLSM images of biofilm taken at different depth from the top of biofilm (upper left corner) to the bottom of biofilm (lower right corner). Table 2Areal porosity of biofilm in sewage with different concentration (%). Note: The areal porosities of biofilm within 500 um are the measured values,whereas those of biofilm beyond 500 um are the calculated values. Furthermore, comparing Fig. 7a and b, a higher CH peak height ofwas observed in the specimens without biofilm than the biofilm-covered specimens. This can be attributed to the protective effectof biofilm on mortar. 3.3. Apparent and microscopic morphology of biofilm The apparent morphology of biofilm developed on mortar car-rier in sewage at different stages was shown in Fig. 8. It can be seenthat in the first few days a small amount of bacterial colonies wereformed on the mortar surface, and with the increase of time, thesebacterial colonies slowly gathered and the amount of biofilm beganto increase, and finally formed a complete and mature biofilm. Inaddition, the color of biofilm attached on mortar surface was chan-ged from mud grey to yellow, and finally to black. The yellowing ofbiofilm may be due to the sulfur, which indicates occurrence ofsimultaneous H2S production and oxidization (Fig. 8b), whereasthe black biofilm may be due to the melanin that metabolized byBacteroidetes in the sewage (Fig. 8c). These results suggest that aseries of biochemical reactions occurred in the biofilm. By capturing a sequence of confocal images of biofilm at differ-ent depth, the biofilm is reconstructed in 3-D, as shown in Fig. 9. Itcan be seen that the three-dimensional structure of biofilm is plate-shaped and relatively uniform in thickness, but its internalstructure is more complex that intertwined by a variety of bacteriaand colonies, and there are many gaps and pores. Fig. 10 shows the CLSM images of biofilm BS3 taken at differentdepth from the top (close to sewage) to the bottom (close to mor-tar). It can be found that when the biofilm layer mainly locatednear the mortar surface, the quantity of microorganism is low. Thiscan be explained from the following two aspects, on the one hand,with the attachment and growth of microorganisms on the mortarsurface, the increasing thicker biofilm probably can inhibit thetransport of nutrients to the deeper layer of biofilm, thus affectingthe growth and reproduction of microorganisms. So the quantity ofmicrobes in the top layer of biofilm close to sewage is significantlymore than that in the bottom biofilm. On the other hand, the alka-line environment of the mortar surface is not conducive to thegrowth of microorganisms. The optimum pH value for most bacte-ria was 6.5-7.5. Once beyond this optimum pH range, the enzymeactivity and cell membrane stability would be influenced, whichwould affect the absorption of the nutrients by microorganisms. 3.4. Porosity analysis of biofilm The biofilms developed on mortar surface in sewage with differ-ent concentration were scanned layer by layer in depth every 20um and the CLSM images obtained were analyzed by picture anal-ysis software to calculate the ratio of voids area to the total area.For example, the results of the areal porosities of biofilms growingfor 30 days at different depth are shown in Table 2. It can be seenthat the areal porosity increases with the increase of biofilm depth,and there is a linear relationship between them, which agrees witha previous report [39]. Based on the areal porosity data of biofilm within 300 umdepth, the linear regression analysis was applied to determinethe correlation between areal porosity and biofilm depth, and theresults are shown in Fig. 11. It can be seen that all the correlationcoefficients R2 of biofilms in sewage with different concentrationare more than 0.99, indicating a very strong linear relationshipbetween areal porosity and biofilm depth. Moreover, the slope ofthe fitting line for different sewage environment is almost thesame, between 0.11 and 0.14,which shows that the biofilm is uni-formly distributed along the depth. Whereas the intercept of thefitting line, that is the areal porosity of top layer biofilm, is closelyrelated to the sewage environment, the higher the concentration ofsewage is, the smaller the intercept of fitting line or the arealporosity will be, in other words, the biofilm will have a denserstructure. Due to the measuring range limitation of CLSM, only the arealporosities of biofilm within 500 um were measured. However,the areal porosities of biofilms in artificially intensified sewagebeyond 500 um depth can be calculated according to the linearregression equations and the results are listed in Table 2. It canbe inferred that the thicknesses of biofilm BS2, BS3 and BS4 areabout 520 um, 660 um and 820 um, respectively. In addition,porosity of biofilm should characterize three-dimensional space,whereas the areal porosity is calculated from two-dimensionalimages. Zbigniew put forward a formula to establish the relationbetween areal porosity and the true, three-dimensional porosityof the biofilm [40], which is expressed as: where BP is the three-dimensional porosity of biofilm,%, (AP)x is theareal porosity at the distance x from the top biofilm, %, L is the bio-film thickness, um. Table 3Porosity of biofilm in sewage with different concentration (%). Biofilm samples 15d 30d 45 d 90 d BS1 93.2 81.7 73.7 65.3 BS2 82.4 64.9 56.4 53.8 BS3 70.5 58.5 51.2 52.4 BS4 66.3 55.3 48.8 50.6 Moreover, this research found that the biofilm porosity is equalto the average areal porosity measured across the depth profile ofbiofilm. Therefore, we can infer that the porosity of biofilm. In thesame way, the porosities of biofilms growing for 15 days, 45 daysand 90 days can be tested and calculated, and the results areshown in Table 3. It can be seen that with the increase of growthtime, the porosities of biofilms decrease gradually as a whole,but that of biofilms in intensified sewage change little after 45days. The porosities of biofilms also decrease with the increase ofsewage concentration, which contradicts the previous report thatthe mean biofilm density increased with decreasing substrate load[41]. The main reason is probably caused by the high flow velocityof sewage in this study that strong biofilm detachment led to bio-film compaction due to permanent surface renewal. Therefore,both the sewage concentration and hydraulic conditions influencethe growth and formation of biofilm. 3.5. Microelectrode test of biofilm The microelectrode test results of pH and O2 in the biofilmsdeveloped on mortar at different stages are shown in Figs. 12-15.It can be seen that with the increase of sewage concentration,the biofilm grows thicker. After 30 days of immersion of the mortar Fig. 11. Relationship between areal porosity and depth of biofilm in artificial sewage: (a) BS1, (b) BS2, (c) BS3, (d) BS4. in sewage, the thickness of the biofilm BS4 could reach 800 um,which is about 2.67 times of that of biofilm BS1 of 300 um. Thisis similar with the biofilm depth results inferred from the arealporosity of biofilm in Table 2. When growing for 90 days, the thick-ness of the biofilms (BS3 and BS4) in intensified sewage with CODof 6000 mg/L and 9000 mg/L decrease obviously, which indicatesthe biofilm has begun to fall off, whereas that (BS1) in ordinarysewage still grows slowly. This result suggests that the thicker bio-film in artificially intensified sewage is more likely to fall off, prob-ably due to transport limitations of sulfate and organic compoundsinto the deeper layer of the biofilm, which leads to the decrease inthe number of microbes and adhesive force of biofilm. In addition, with the increase of sewage concentration andgrowth time, all the pH values within biofilm are in a decreasingtrend. The pH of biofilm BS1 in ordinary sewage is within the rangeof 6-7, which changes little during the whole growth period. How-ever, the pH changes of biofilms in artificially intensified sewageare apparent, the pH levels have decreased to about 2 at day 90(Fig. 15d), showing strong acid environment. Moreover, the higherthe concentration of sewage is, the lower the pH values of biofilmwill be. This can be explained as follows, with the increase of sew-age concentration, the large amounts of organic compounds andmicroorganismspromote thesulfate-reducinganddsulfur-oxidizing activities within biofilm, and thereby more acidic com-pounds are produced, which leads to the decrease of pH valueswithin biofilm. Moreover, the oxygen distribution in biofilms can reflect themicrobial distributions of heterotrophic bacteria and autotrophicnitrifying bacteria which compete for oxygen uptake [42,43]. FromFig. 12 it can be seen that, after 15 days of growth, biofilms of 200-400 pm were obtained, and oxygen can diffuse completely into thebottom of the biofilm, which is due to their thin and loose struc-ture. However, with the increase of growth time, oxygen was grad- pH pH pH Dissolved oxygen concentration (mg/L) Fig. 12. Microelectrode test results of biofilms at 15 days: (a) BS1, (b) BS2, (c) BS3, (d) BS4. pH Dissolved oxygen concentration (mg/L) Dissolved oxygen concentration (mg/L) pH pH Dissolved oxygen concentration (mg/L) Dissolved oxygen concentration (mg/L) Fig. 13. Microelectrode test results of biofilms at 30 days: (a) BS1, (b) BS2, (c) BS3, (d) BS4. Fig. 14. Microelectrode test results of biofilms at 45 days: (a) BS1, (b) BS2, (c) BS3, (d) BS4. ually consumed by bacteria in the biofilm, and the anaerobic zonehas appeared in the biofilms (BM2, BM3 and BM4) growing inintensified sewage at day 30 (Fig. 13b-d), and the biofilms havea fast growth rate because of the high amount of biodegradablesubstrate. After 45 days of growth, the biofilm thickness hasreached 1000 um, and the anaerobic zone expanded further(Fig. 14c and d), such the sulfate reducing bacteria (SRB) beganto reproduce greatly. When the biofilm growing for 90 days, theanaerobic zone disappeared due to the spalling of biofilms growingin intensified sewage, while that was detected in the bottom ofbiofilm in ordinary sewage (Fig.15a). Therefore, the internal fea-tures of biofilms differ greatly with age, thickness and porosity.Furthermore, the change rate of oxygen in biofilm can be calcu-lated by Eq. (4). From Table 4 it can be seen that, the change rateof oxygen within biofilm decreases gradually with the increase ofgrowth time where Kpo is the change rate of dissolved oxygen, mg/L.um; Co isthe concentration of oxygen at the surface biofilm, mg/L; C is theconcentration of oxygen at the bottom biofilm, %; TB is the thicknessof biofilm, um. 3.6. Influence mechanism analysis of biofilm on mortar deteriorationbased on grey correlation The technical connotation of grey correlation analysis is toobtain the differential sequence information, and by calculatingthe grey correlation degree, the data sequence can be analyzed. The grey correlation model consists of five steps, including deter-mination of analysis series, non-dimensional processing of vari-able, calculation of correlation coefficient, calculation ofcorrelation degree and sequence of correlation degree. In this study, select the biofilm action coefficient data as the ref-erence series (or parent series), which can reflect the influence ofbiofilm on the mortar deterioration under sewage environment.And select the data series of sewage pH (SpH), biofilm pH(BpH), bio-film thickness (Br), biofilm porosity (Bp) and change rate of oxygenin biofilm (Kpo) as the comparison series (or subsequence), whichconsist of the influencing factors. Table 5 shows the specific data.Then take the specimen in sewage with COD of 3000 mg/L as anexample to analyze the influence of biofilm on mortar corrosion,the process is as follows: The processed subsequence matrix is expressed as The matrix of absolute difference between parent series andsubsequence is evaluated as pH pH 0 1 2 3 4 5 6 7 8 0 1 2 3 4 5 6 7 8 -200 -200 -100 C -100 d 0 0 100 100 200 200 300 300 400 pH, pH 400 500 500 600 600 700 -0.2 0.0 0.2 0.4 0.6 0.8 1.0 1.2 1.4 -0.2 0.0 0.2 0.4 0.6 0.8 1.0 1.2 1.4 Dissolved oxygen concentration (mg/L) Dissolved oxygen concentration (mg/L) Fig. 15. Microelectrode test results of biofilms at 90 days: (a) BS1, (b) BS2, (c) BS3, (d) BS4. The correlation coefficient of y(k) and x(k) can be calculated asfollows: Table 4Change rate of oxygen in biofilm (mg/Lum). Biofilm samples 15 d 30d 45d 90d BS1 0.0046 0.0045 0.0015 0.0011 BS2 0.0066 0.0034 0.0019 0.0007 BS3 0.0056 0.0048 0.0032 0.0014 BS4 0.0055 0.0042 0.0028 0.0013 where A is the resolution ratio, the general range ofA is (0, 1), in thisstudy, 1=0.5; (k) is the correlation coefficient, which indicates therelative difference between reference and comparison curves of ifactor in the k moment. And the matrix of correlation coefficient is evaluated as Table 5Influencing parameters of the sewage corrosion of mortar. Samples Time (d) SpH BpH Br (um) Bp(%) Kpo (mg/Lum) BA MS1 15 7.02 6.80 200 93.2 0.0046 0.25 30 6.82 6.33 300 81.7 0.0045 0.37 45 7.02 6.18 500 73.7 0.0015 0.50 90 6.96 6.05 800 65.3 0.0011 0.43 MS2 15 5.16 5.85 300 82.4 0.0066 0.88 30 4.88 5.34 500 64.9 0.0034 0.91 45 4.63 4.24 700 56.4 0.0019 0.80 90 4.05 2.89 700 53.8 0.0007 0.72 MS3 15 5.04 5.06 400 70.5 0.0056 0.78 4.34 4.27 650 58.5 0.0048 0.78 4.11 3.71 1000 51.2 0.0032 0.53 3.81 2.18 600 52.4 0.0014 0.47 MS4 3.84 4.56 450 66.3 0.0055 0.74 3.65 3.64 800 55.3 0.0042 0.70 3.38 3.02 1050 48.8 0.0028 0.43 3.22 1.97 700 50.6 0.0013 0.45 Finally, the correlation degree (r) between reference and com-parison series can be calculated by Eq.(10), and the matrix of cor-relation degree is shown in Eq. (11): The grey correlation results are listed in Table 6. It can be seenthat for the mortar in ordinary sewage, the Br of MS1 has the high-est correlation degree, followed by Sph and BpH, which indicatesthat biofilm thickness is the primary influencing factor. Fig. 3 hasdemonstrated that the biofilm can act as a barrier to protect mortaragainst sewage corrosion, so the thicker the biofilm is, the strongerthe protective effect of biofilm on mortar will be. In the first month,MS1 has the lowest BA due to its thinner biofilm, but it keepsincreasing until 60 days, and even exceeded that of biofilm MS3and MS4, which may be the results of its high pH(Fig.4). However,for the mortar specimens in intensified sewage, the SpH or BpH isthe major influencing factor, as well as the Bp. From Table 3 itcan be seen that, although the porosities of biofilms decrease withthe increase of sewage concentration, there is no significant differ-ence between the porosities of BM2, BM3 and BM4. Therefore, theBA of MS2 is the highest throughout the corrosion process, which ismainly due to its high pH values of sewage and biofilm.However,the BA of MS3 and MS4 in the first month is higher due to theirdense biofilm structure, which can hinder the penetration of acidsubstance. After that, the increasing corrosives reduced the protec-tion of biofilm to mortar, so the BA decreases greatly (Fig. 4). 4. Conclusions (1) The artificially intensified sewage can be used as effectivemedium for accelerating the corrosion of mortar. After beingimmersed in sewage for 3 months, the mass loss of the spec-imen MS4 with and without biofilm are 17.0% and 9.3%,whereas that of specimens MS1 are only 2.5% and 1.4%,respectively. The data from mass loss, SEM and XRD analysissuggest that the biofilm developed on mortar surface canplay a role in protecting mortar from sewage corrosion tovarying degrees. In addition, the concept of biofilm actioncoefficient was put forward by comparing the mass loss ofmortar specimens with and without biofilm. (2) The biofilms developed on mortar surface in sewage wasinvestigated by CLSM and microelectrode. There is a verystrong linear relationship between areal porosity and biofilmdepth, and biofilm thickness can be inferred according to the Table 6 Results of the grey correlation. Samples SpH BpH Br Bp Kpo MS1 Correlation degree 0.71 0.69 0.75 0.67 0.64 Sequence 2 3 1 4 5 MS2 Correlation degree 0.96 0.84 0.56 0.84 0.67 Sequence 1 2 5 2 4 MS3 Correlation degree 0.90 0.91 0.61 0.91 0.88 Sequence 3 1 5 1 4 MS4 Correlation degree 0.88 0.90 0.58 0.90 0.86 Sequence 3 1 5 1 4 linear regression equations, which is similar with the resultsobtained by microelectrode test. After 30 days of growth, thethickness of the biofilm BS4 could reach 800 um, which isabout 2.67 times of that of biofilm BS1 of 300 um, the anaer-obic zone has also appeared in the biofilms growing in inten-sified sewage. Moreover, the porosities of biofilms decreasewith the increase of sewage concentration, and the pH ofbiofilm BS1 in ordinary sewage is within the range of 6-7during the whole growth period, whereas that of biofilmsin intensified sewage have decreased to about 2 at day 90. (3) Based on the grey correlation model, and combined with thetest results of the sewage pH (SpH), biofilm pH (BpH), biofilmthickness (Br), biofilm porosity(Bp), change rate of oxygen inbiofilm (Kpo) and biofilm action coefficient (BA), the influ-ence mechanism of biofilm on mortar deterioration was ana-lyzed quantitatively, and the major influencing factor can befound out. In the first month, the specimen in ordinary sew-age (COD=300 mg/L) has the lowest BA mainly due to itsthinner biofilm, but it keeps increasing until 60 days. Forthe specimens in intensified sewage, the BA of MS2 is thehighest throughout the corrosion process, which can beaccount for its high pH values of sewage and biofilm,whereas that of MS and MS4 is higher in the first monthdue to their dense biofilm structure, after that, the increas-ing corrosives reduced the protection of biofilm to mortar,so the BA decreases greatly. Acknowledgements This work was financially supported by the Natural ScienceFoundation of Hebei Province of China (E2015210083), Outstand-ing Young People of University Science and Technology Researchof Hebei Province (BJ2016049) and Hebei Key Discipline Construc-tion Project. References [1] L. Zhang, P. De Schryver, B. De Gusseme, W.De Muynck,N. Boon, W. Verstraete,Chemical and biological technologies for hydrogen sulphide emission controlin sewer systems: a review, Water Res. 42 (2008)1-12. +A[2]H.S. Jensen, A.H. Nielsen, T. Hvitved-jacobsen, J. Vollertsen, Modeling ofhydrogen sulfide oxidation in concrete corrosion products from sewer pipes,Water Environ. Res. 81 (2009)365-373. [3] “Topics in Focus” of China Central Television (CCTV), The root of pavementcollapse is underground, http://news.cntv.cn/2015/07/05/VIDE1436097417637753.shtml,(2015.07.05). [4]G. Jiang, E. Wightman, B.C. Donose,Z. Yuan, P.L. Bond, The role of iron in sulfideinduced corrosion of sewer concrete, Water Res. 49 (2014)166-174. [5] H. Yuan, P. Dangla, P. Chatellier, T. Chaussadent, Degradation modelling ofconcrete submitted to sulfuric acid attack, Cem. Concr. Res. 53 (2013)267-277. [6] J.Y. Han, Z.H. Gao,X.W. Zhang, Non-uniform damage of primary sedimentationpool concrete by city sewage, China J. Civ. Eng. 38 (2005) 45-49. 7]]M. O'Connell, C. Mcnally, M.G. Richardson, Biochemicmail( attack on concrete in4dts 0ncwastewater applications: a state of the art review, Cem. Concr. Compos. 32(2010)479-485. ( [8] X.W. Z h ang, X. Zha n g, M echanism a n d re s earch a p proach of mi c robial c orrosion o f c oncr e te, J . Build. Mater . 9(2006) 5 2-58. ) [9] C. Parker, The corrosion of concrete. Isolation of a species of bacteriumassociated with the corrosion of concrete exposed to atmospheres containinghydrogen sulphide, Aust. J. Exp. Biol. Med. Sci. 23 (1945)14-17. ( [10]A . Attal, M. Br i godiot, P . C a macho , J. Man e m, 1 B io logical m echanisms of Hz S f or m ation in sewer p i pes, W ater S c i.Technol. 2 6 (19 9 2) 90 7 -914 . ) ( [ 1 1] E . K ul i czkowska, Risk of struc t ural f a ilure i n conc re te sewers due to i nt e rnal c orrosion, Eng. Fail. An a l. 66 (2016 ) 110- 1 1 9 . ) ( [ 1 2] K .S. C h o, T. Mori, A n e wly i s olat e d fu n gus p a rt i cipates i n t he c o rrosion o f concrete s ewer pip e s, W ater S c i. T echn o l. 3 1 ( 1 995) 263-271. [131 J . D . G u , T.E. Ford , N . S. Be r ke, R. Mitchel l , Biod e t e rioration of concrete by fu n gus ) Fusarium, Int. Biodeterior. Biodegrad. 41 (1998) 101-109. ( [14] T . Mori, T . Nonaka, K. T azaki, Interact i on of nutri e nts, m oisture a n d p H on m icrobial c orrosion of concre t e s e wer p ipe s , Wate r R es. 26 (1992) 29- 3 7. ) ( [ 1 5] S . S oleima n i , O.B. I s gor , B. Ormeci , R esi s tanc e o f b iofilm-covered m ortars t o m icrobiologically i n fluenced d eterioration simul a ted b y sulfate acid exposure, Cem. C on c r. Res. 53 (2013)229-238. ) ( [16] L . J . Kong, X . Bao, M.F. C ao, Effect o f b iof i lm on corrosion o f c oncrete i n s e wage, J . Chin. Ceram. Soc. 44 (2016)279-285. ) ( [ 1 7] T . Ito , S. Okabe , H. S a t o h, Y . Watanab e , Su c cess i ona l develo p men t o f s ulfate-reducing b acterial p opulations and t h eir a c ti v it i es i n a w astewater bi o film g rowing u n der m i croaerophil ic condi t ions, Appl. E n viron. M i crobiol. 68 (2002) 1392- 1 402. ) ( [18] S . O kab e , M . O d agiri, T. It o , H. Sato h , S u ccession of sulfur ox i dizing bac t eria in the m icrobial c ommunity on co r ro d ing concrete in s e wer sys t ems, App l . En v iron. M i crobio l . 73 (2007)971-980. ) [19] S. Okabe, T. Ito, K. Sugita, H. Satoh, Succession of internal sulfur cycles andsulfur-oxidizing bacterial communities in microaerophilic wastewaterbiofilms, Appl. Environ. Microbiol. 71 (2005)2520-2529. ( [20] M.G. Alexan d er, C.W. F ouri e , P erf o rmance of sewer pipe concret e mixtu re s w ith port l and and calcium aluminate cements subject to min e ral an d b i o genic a cid a ttack, Mater. S t ruct. 44 (2011) 3 13-330. ) ( [21] H . Y uan, P. D angla, P. C hatel l ier, T. C h aussadent, D egrad a tion m o delling o f c oncrete submitted to sulfuric acid at t ack, C em. C oncr. R e s. 53 ( 2 0 13) 2 6 7-277 . ) ( [22] T . A . D ur n ing,M. C . Hi c k s , Us i ng mic r osilica t o i ncrease concrete's resistance to aggressive chemicals, Concr . Int. 13 (1991)42- 4 8. ) ( [23] R.S . Gollop, H.F.W. Taylor , Micros t ruct u ral and microanalytical studies o f sul f ate attack. I V . Reactio n s o f a sl a g ceme n t paste wit h sod i um and m a gn e s ium s u lf a te solutions, Cem . Concr . Res. 26 (1996)1013 - 1028. ) [24] M. Djuric, J. Ranogajec,R. Omorjan, S. Miletic, Sulfate corrosion of portlandcement-pure and blended with 30% of fly ash, Cem. Concr. Res. 26 (1996)1295-1300. ( [25] W . Sand, E . B o ck, Biotest system for r a pid evaluation of concrete re s istanc e to s ulfur-ox i diz i ng b ac t e r ia, Ma ter . Perfor m . 26 (1987) 1 4- 1 7 . ) [26] A. Yousefi, A. Allahverdi, P. Hejazi, Accelerated biodegradation of cured cementpaste by Thiobacillus species under simulation condition, Int. Biodeterior.BDiodegrad. 86 (2014)317-326. [27]O.Aviam, G. Bar-Nes, Y. Zeiri, A. Sivan, Accelerated biodegradation of cementby sulfur-oxidizing bacteria as a bioassay for evaluating immobilization oflow-level radioactive waste, Appl. Environ. Microbiol. 70 (2014) 6031-6036. [28] A. Bielefeldt, M.G.D. Gutierrez-Padilla, S. Ovtchinnikov, J. Silverstein, M.Hernandez, Bacterial kinetics of sulfur oxidizing bacteria and theirbiodeterioration rates of concrete sewer pipe samples, J. Environ. Eng. 136(2009)731-738. mh[29]B.L. Wen, The Study on Corrosion and Durability of Concrete in MunicipalSewerage, Tianjin University, Tianjin, 2005. [30] X.W. Zhang, J.Y. Han, Y.J. Tian, Z.H. Chen, Laboratory study on acceleratedcorrosion of concrete by artificial sewage, Corros. Sci. Prot. Technol. 15 (2003)234-237. [31]L. Tijhuis, M.C. Van Loosdrecht, J.J. Heijnen, Formation and growth onheterotrophic aerobic biofilm on small suspended particles in airlift reactors,Biotechnol. Bioeng. 44 (1994) 595-608. [32] T.C. Voice, D. Pak, X. Zhao, J. Shi, R.F. Hickey, Biological activated carbon influidized bed reactor for the treatment of groundwater contaminated withvolatile aromatic hydrocarbons, Water Res. 26 (1992) 1389-1401. ( [33] R .L. Islander , J .S. Devinny, F.M a nsfeld, A . Po s tyn, S . Ho n g, Mic r ob i al ecology of c rown c o rrosion i n sewers, J . Envi r on. Eng. 1 1 7 ( 1 991) 75 1-77 0 . ) [34]1D.D. Beer, P. Stoodley, F. Roe, Z. Lewandowski,Effects of biofilm structures onoxygen distribution and mass transfer, Biotechnol. Bioeng. 43 (1994) 1131-1138. [35] H.R. Bungay, W.J. Whalen, W.M. Sanders, Microprobe techniques fordetermining diffusivities and respiration rates in microbial slime systems,Biotechnol. Bioeng. 11 (2010) 765-772. [36]H. Kazuaki,N. Jun, T. Satoshi, Simple prediction of oxygen penetration depth inbiofilms foe wastewater treatment, Biochem. Eng. J. 19 (2004)61-68. [37]L1.S. Fan, R. Leyva-Ramos, K.D. Wisecarver, B.J. Zehner, Diffusion of phenolthrough a biofilm grown on activated carbon particles in a draft-tube three-phase fluidized-bed bioreactor, Biotechnol. Bioeng. 35 (1990) 279-286. [38]1H.Sizgerist, W. Gujer, Mass transfer mechanisms in a heterotrophic biofilm,Water Res. 19 (1985) 1969-1985. [39]D.D. Beer, P. Stoodley, Relation between the structure of an aerobic biofilm andtransport phenomena, Water Sci. Technol. 32 (1995)11-18. [40]L. Zbigniew, Notes on biofilm porosity, Water Res. 34 (2000) 2620-2624. [41] S. Wasche, H. Horn, D.C. Hempel, Influence of growth conditions on biofilmdevelopment and mass transfer at the bulk/biofilm interface, Water Res. 36(2002)4775-4784. [42] S. Okabe, Y. Oozawa, K. Hirata,Y. Watanabe, Relationship between populationdynamics of nitrifiers in biofilms and reactor performance at various C:Nratios, Water Res. 30 (1996) 1563-1572. [43] T.C. Zhang, Y.C. Fu, P.L. Bishop, Competition in biofilms, Water Sci. Technol.29(1994)263-270. 在世界范围内,水泥混凝土以其优异的耐久性在市政基础设施中得到了广泛的应用。然而据报道,世界上许多地方的混凝土污水管道、废水收集和处理设施都在恶化,在维修和保养方面正花费数百万美元。污水对混凝土的腐蚀机理十分复杂,除物理化学作用外,微生物的侵袭已被确定为引起混凝土污水管道腐蚀的最重要原因。早期的研究就发现细菌参与了下水道内部混凝土的劣化,并提出腐蚀机理是硫循环的结果。为了更好的了解生物膜在污水对混凝土的腐蚀机制,本论文研究人员制备了不同化学需氧量(COD)值的人工强化污水,并对污水中添加和不添加生物膜的砂浆试样的重量变化进行了对比研究。采用扫描电镜(SEM)和微电极(unisense)研究系统对试样的变质程度进行了评价。 图1、unisense微电极测试系统应用与污水生物膜的测试实验装置图 采用了人工强化处理污水的方法,模拟和加速了污水中微生物的腐蚀,研究了污水中掺加生物膜和不掺生物膜砂浆的重量变化规律。应用unisen微电极系统(图1所示)对比研究了砂浆上生物膜的微生物结构和活性表面。在此基础上,分析了生物膜对砂浆老化的影响机理。结果表明,在砂浆上形成的生物膜有污水导致的不同程度的腐蚀具有一定的阻隔作用。图2、生长在不同污水 (a) BS1, (b) BS2, (c) BS3, (d) BS4)的生物膜30天后应用unisense微电极穿刺生物膜表面的氧浓度剖面及pH值剖面 为了弄清楚矿浆表面生物膜对于抵扣污水腐蚀的作用机理,研究人员还应用了激光共聚焦显微镜(CLSM)和微电极(unisense)技术相结合研究了生活污水中砂浆表面形成的生物膜。面积孔隙度与生物膜厚度之间存在很强的线性关系,根据线性回归方程可以推断出生物膜厚度,这与微电极(unisense)试验结果相似。经过30天的生长,生物膜BS4的厚度可达800um,约为300um生物膜BS1的2.67倍,在强化污水中生长的生物膜中也出现了厌氧区。此外,生物膜的孔隙度随着污水浓度的增加而减小,在整个生长期,普通污水中生物膜BS1的pH值在6-7范围内,而强化污水中生物膜的pH值在90 天时下降到2左右(图2所示)。 综合上述的研究结果,发现生物膜对砂浆恶化的影响机制可进行定量分析,可以发现和主要影响因素。在第1个月,普通污水(COD = 300 mg/L)中的样品生物膜作用系数(BA)最低,主要是由于其生物膜较薄,但一直增加到60天。对于强化污水中的试样,在整个腐蚀过程中,MS2的BA值最高,这可以解释为其污水和生物膜的pH值较高,而MS3和MS4由于其生物膜结构致密,在第一个月的BA值较高,在此之后,不断增加的腐蚀性降低了生物膜对砂浆的保护作用,使得BA值大大降低。这也说明对于普通污水中的样品,生物膜的厚度起着主要作用,尤其是在第一个月,而在污水浓度过高的情况下,污水的腐蚀性增加对后期生物膜对砂浆的防护作用会明显降低。
确定
还剩11页未读,是否继续阅读?

产品配置单
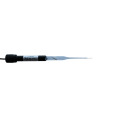
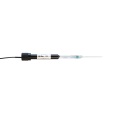
上海谓载科技有限公司为您提供《废水中pH,氧气检测方案(PH计)》,该方案主要用于废水中物理指标检测,参考标准--,《废水中pH,氧气检测方案(PH计)》用到的仪器有丹麦unisense pH测量仪、丹麦Unisense溶氧仪
推荐专场


相关方案
更多