


方案详情
文
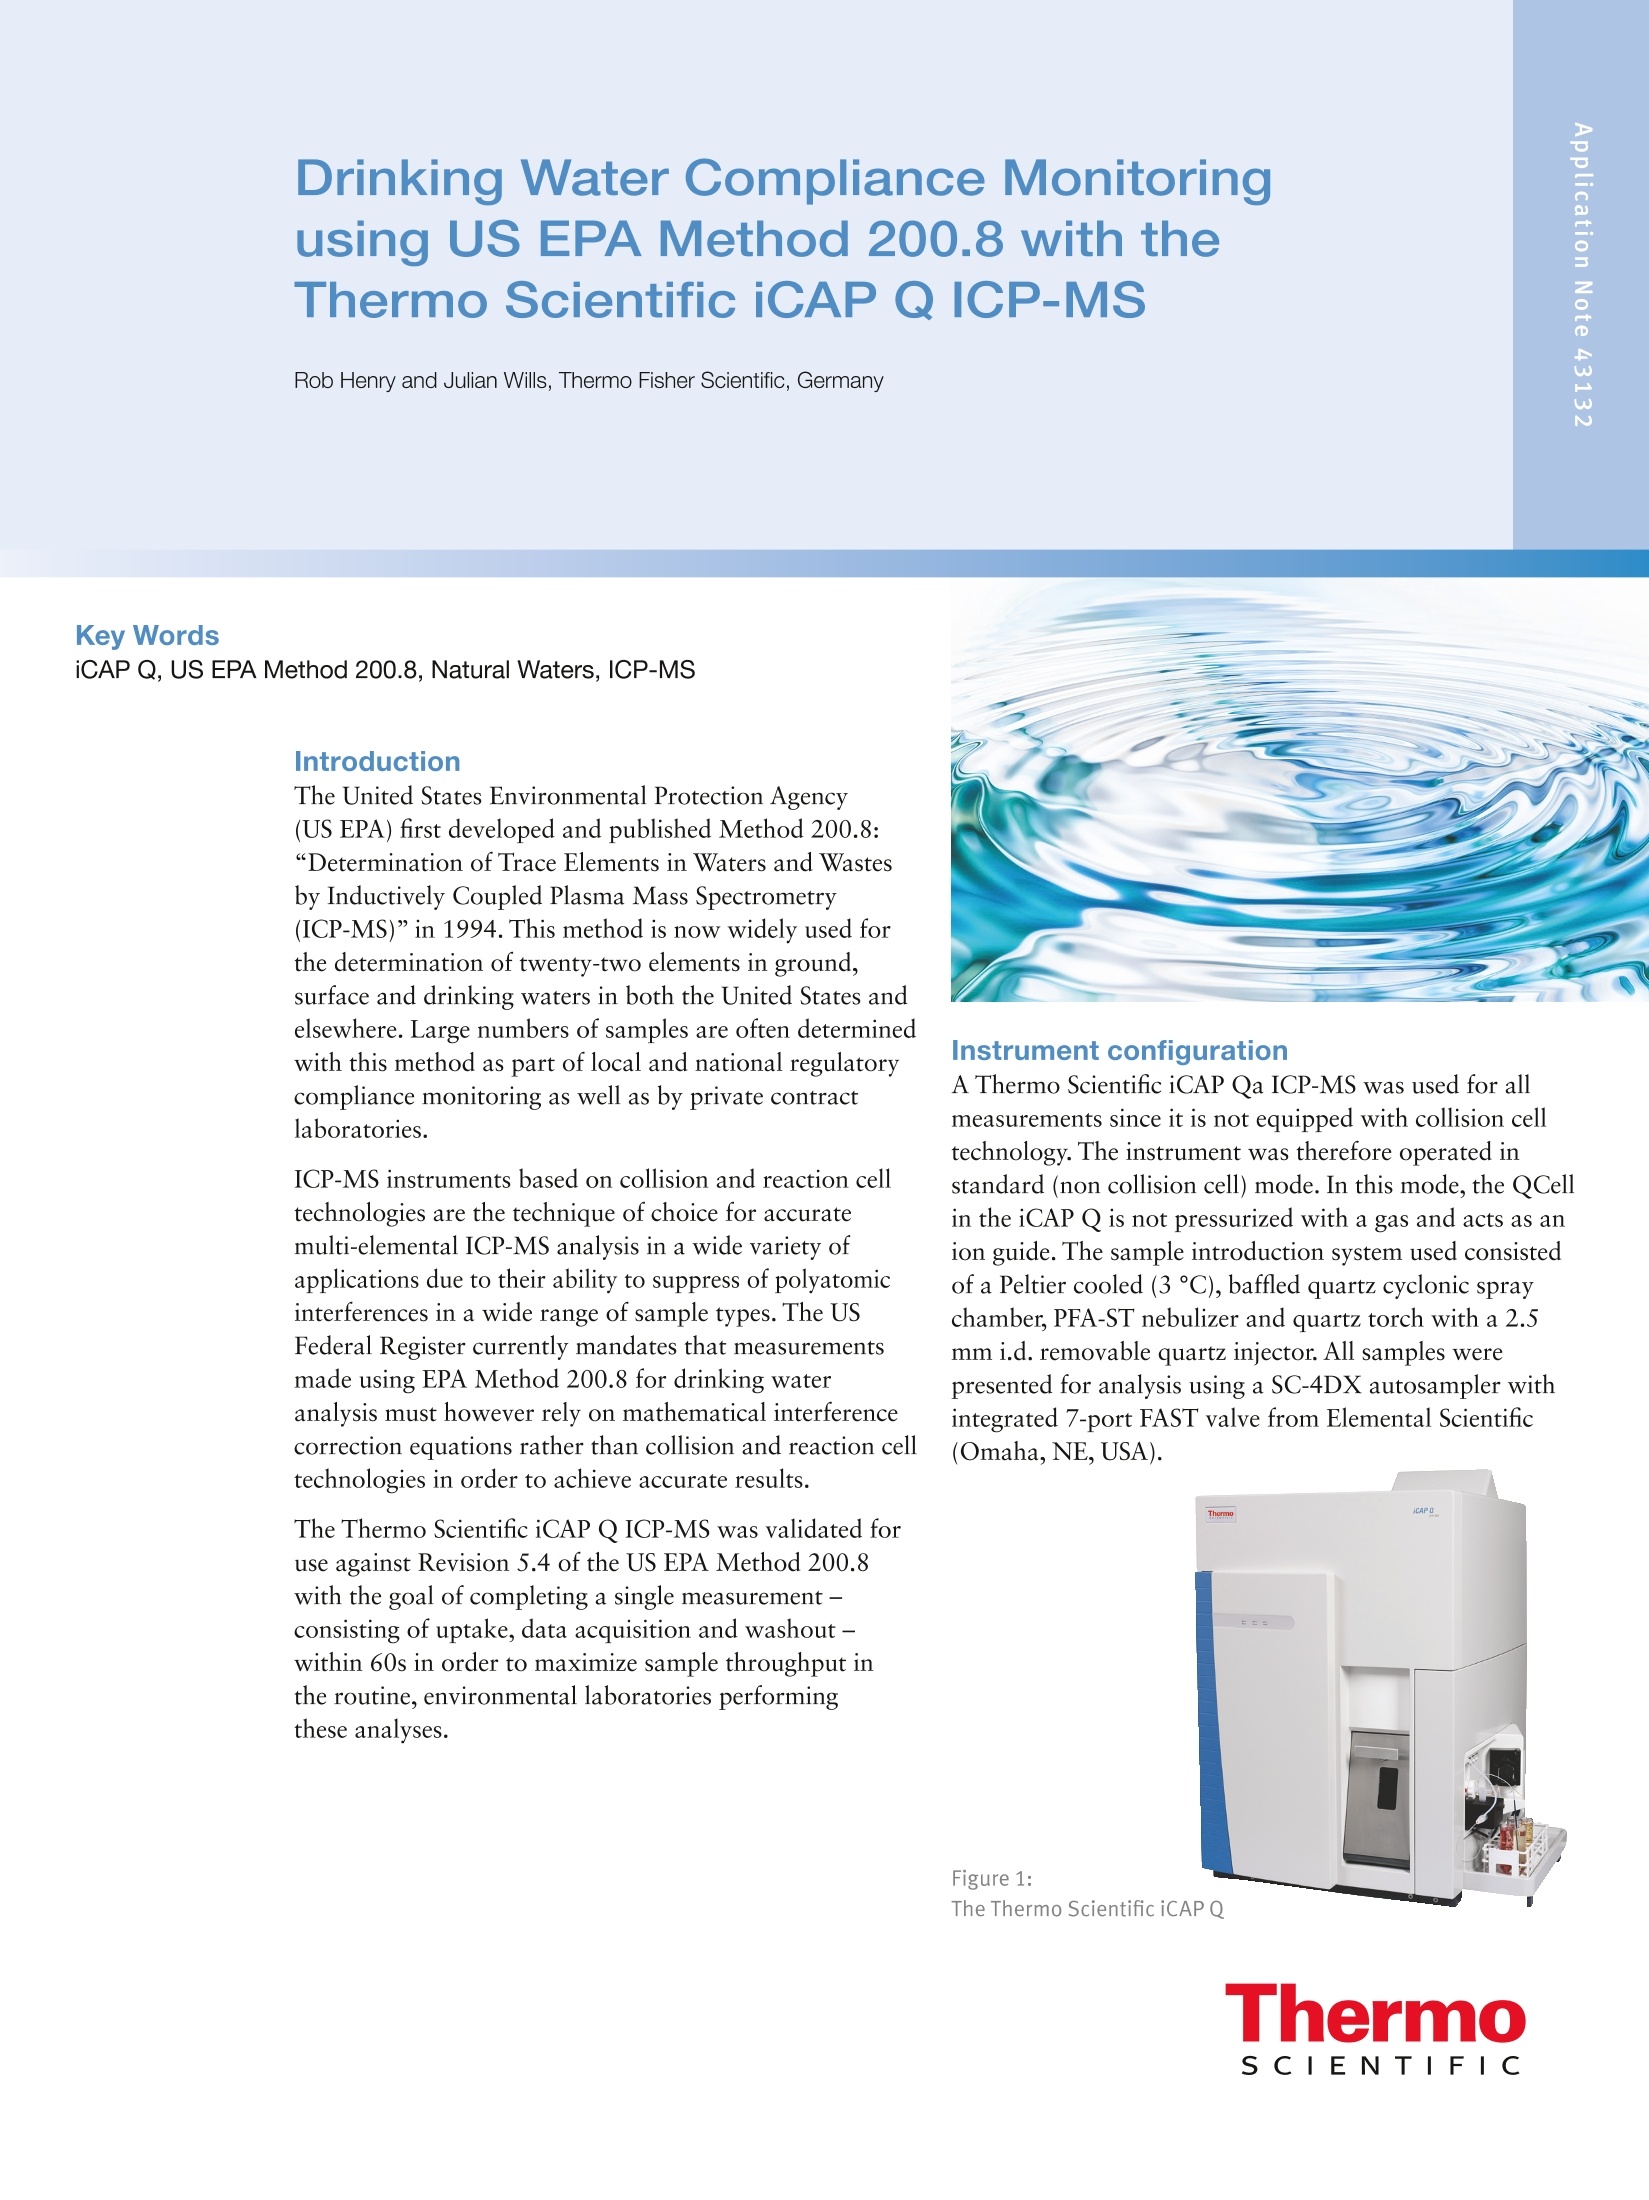
The Thermo Scientific iCAP Qa equipped with an ESI Autosampler and FAST sample introduction system was validated for use with US EPA Method 200.8. After optimising the FAST uptake and washout parameters, the high sensitivity and stability of the iCAP Qa, with its automatic resolution switching and accurate detector cross calibration, achieved the goal of 60 analyses per hour working against US EPA Method 200.8.
方案详情

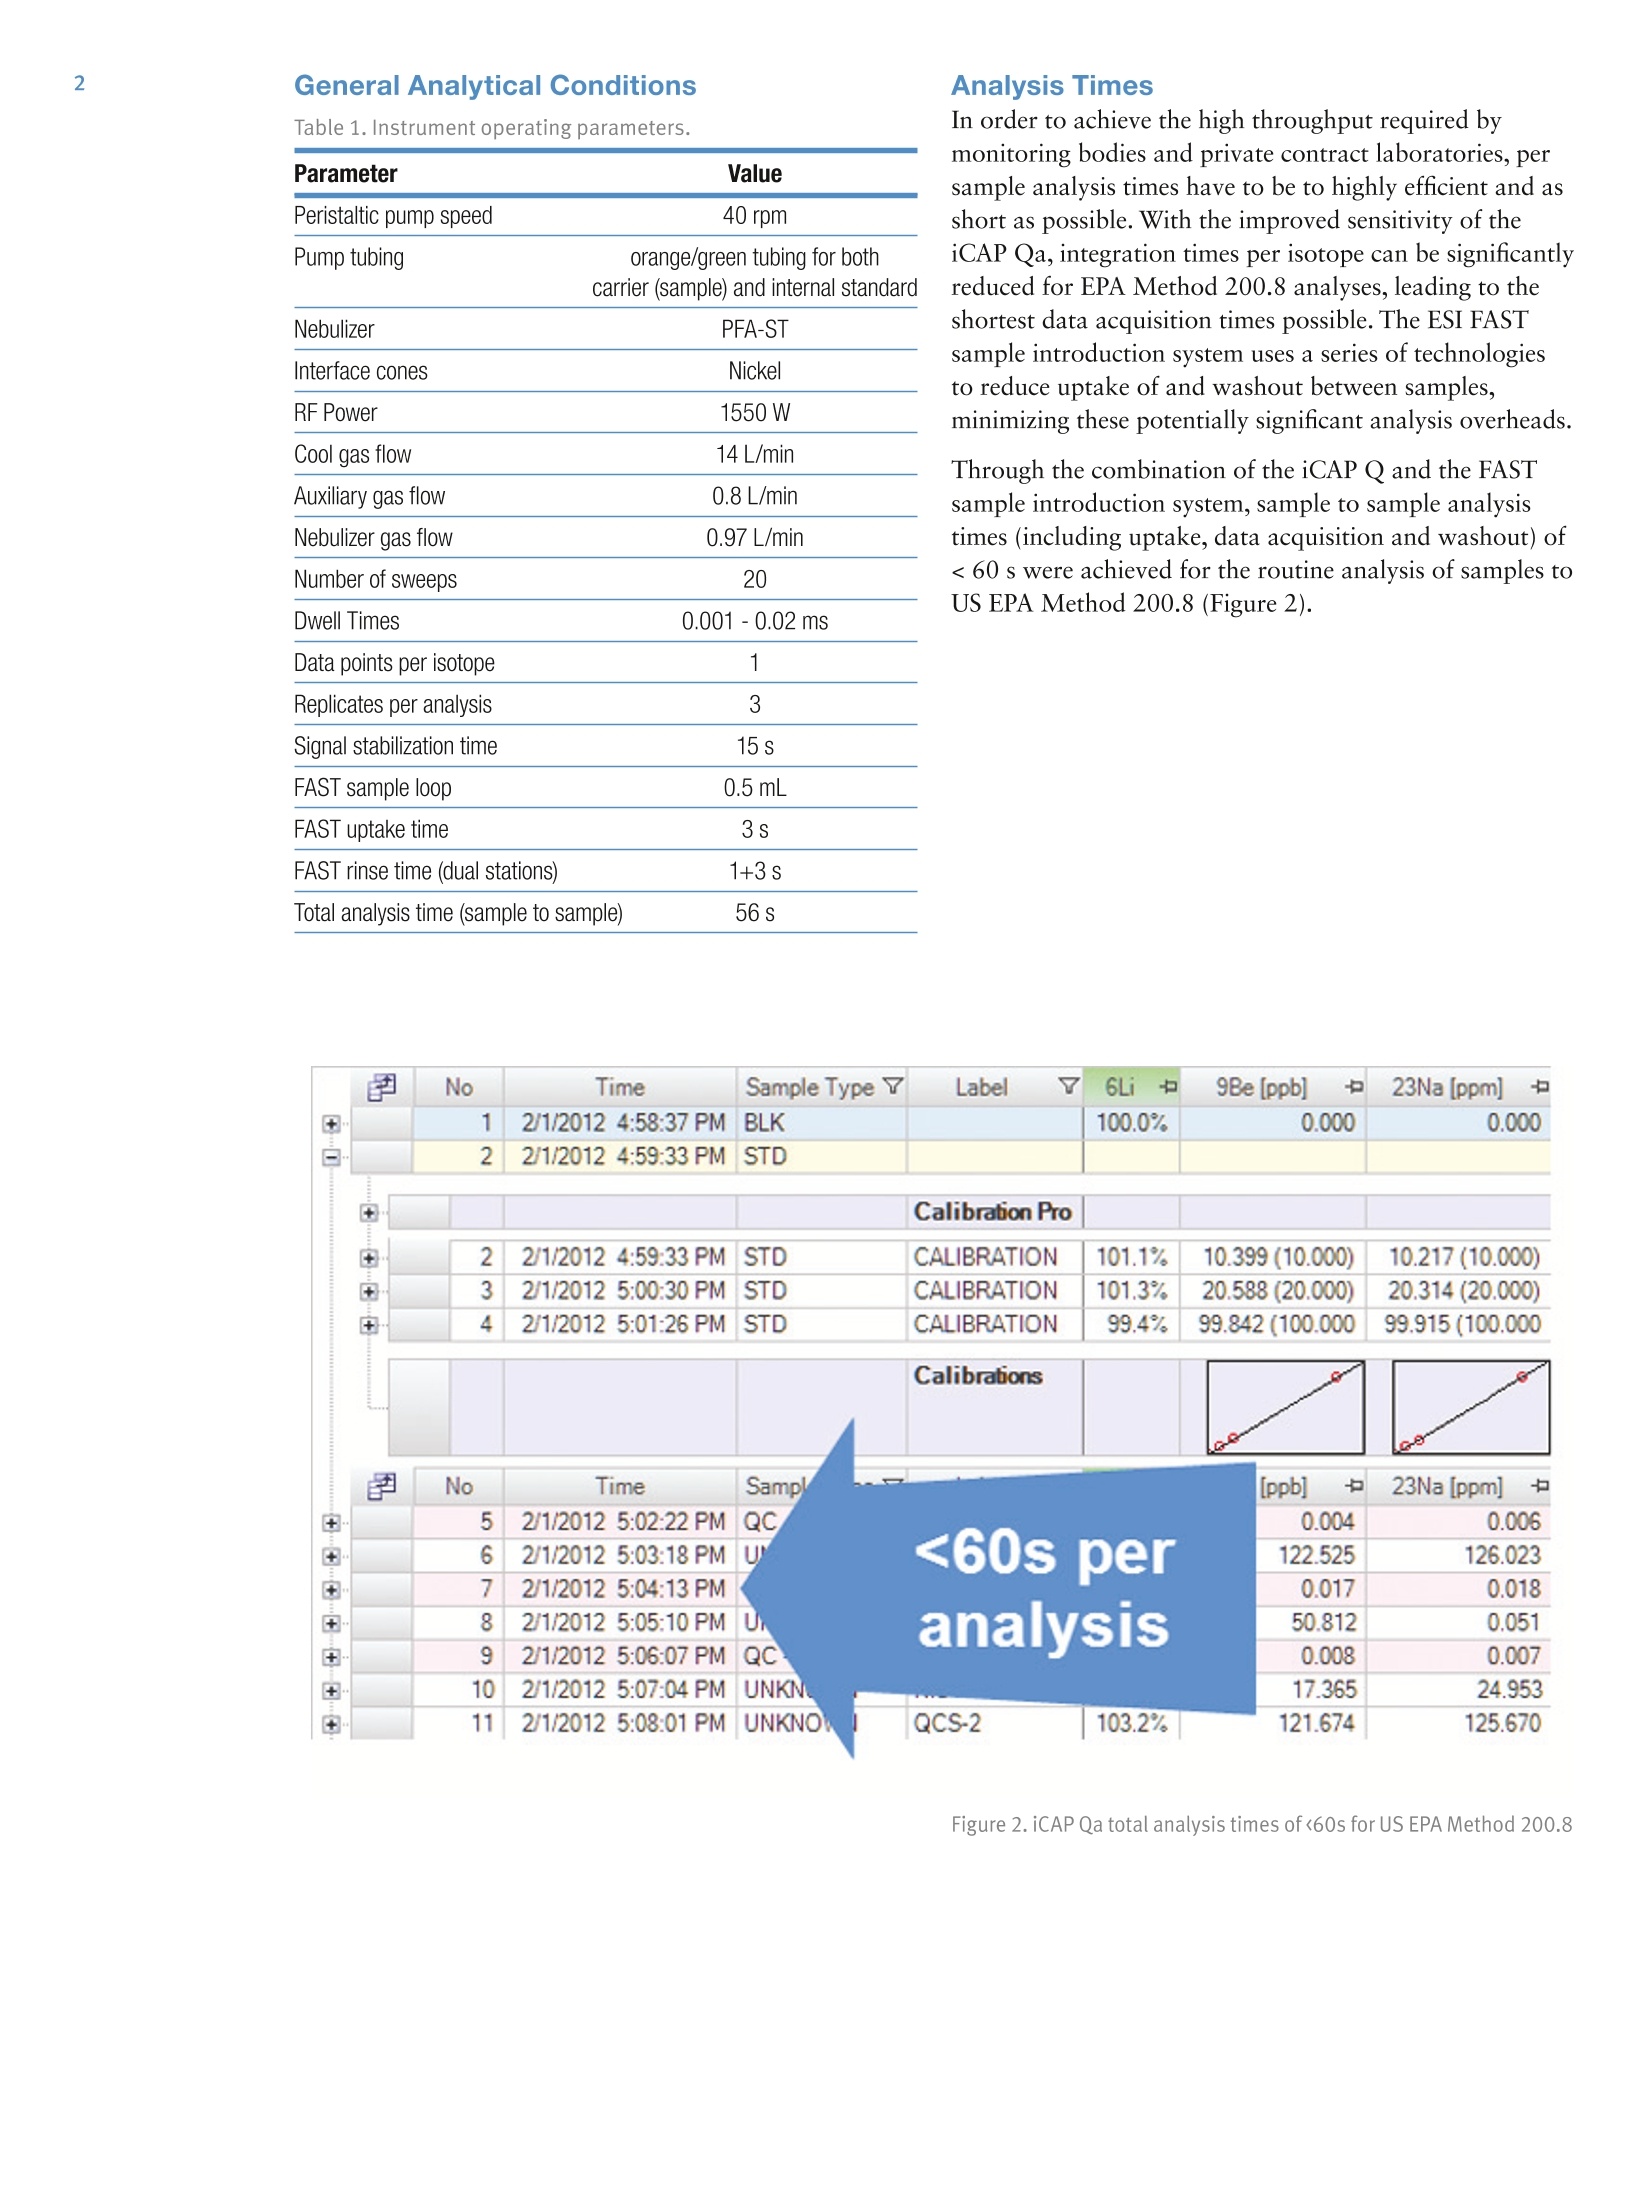
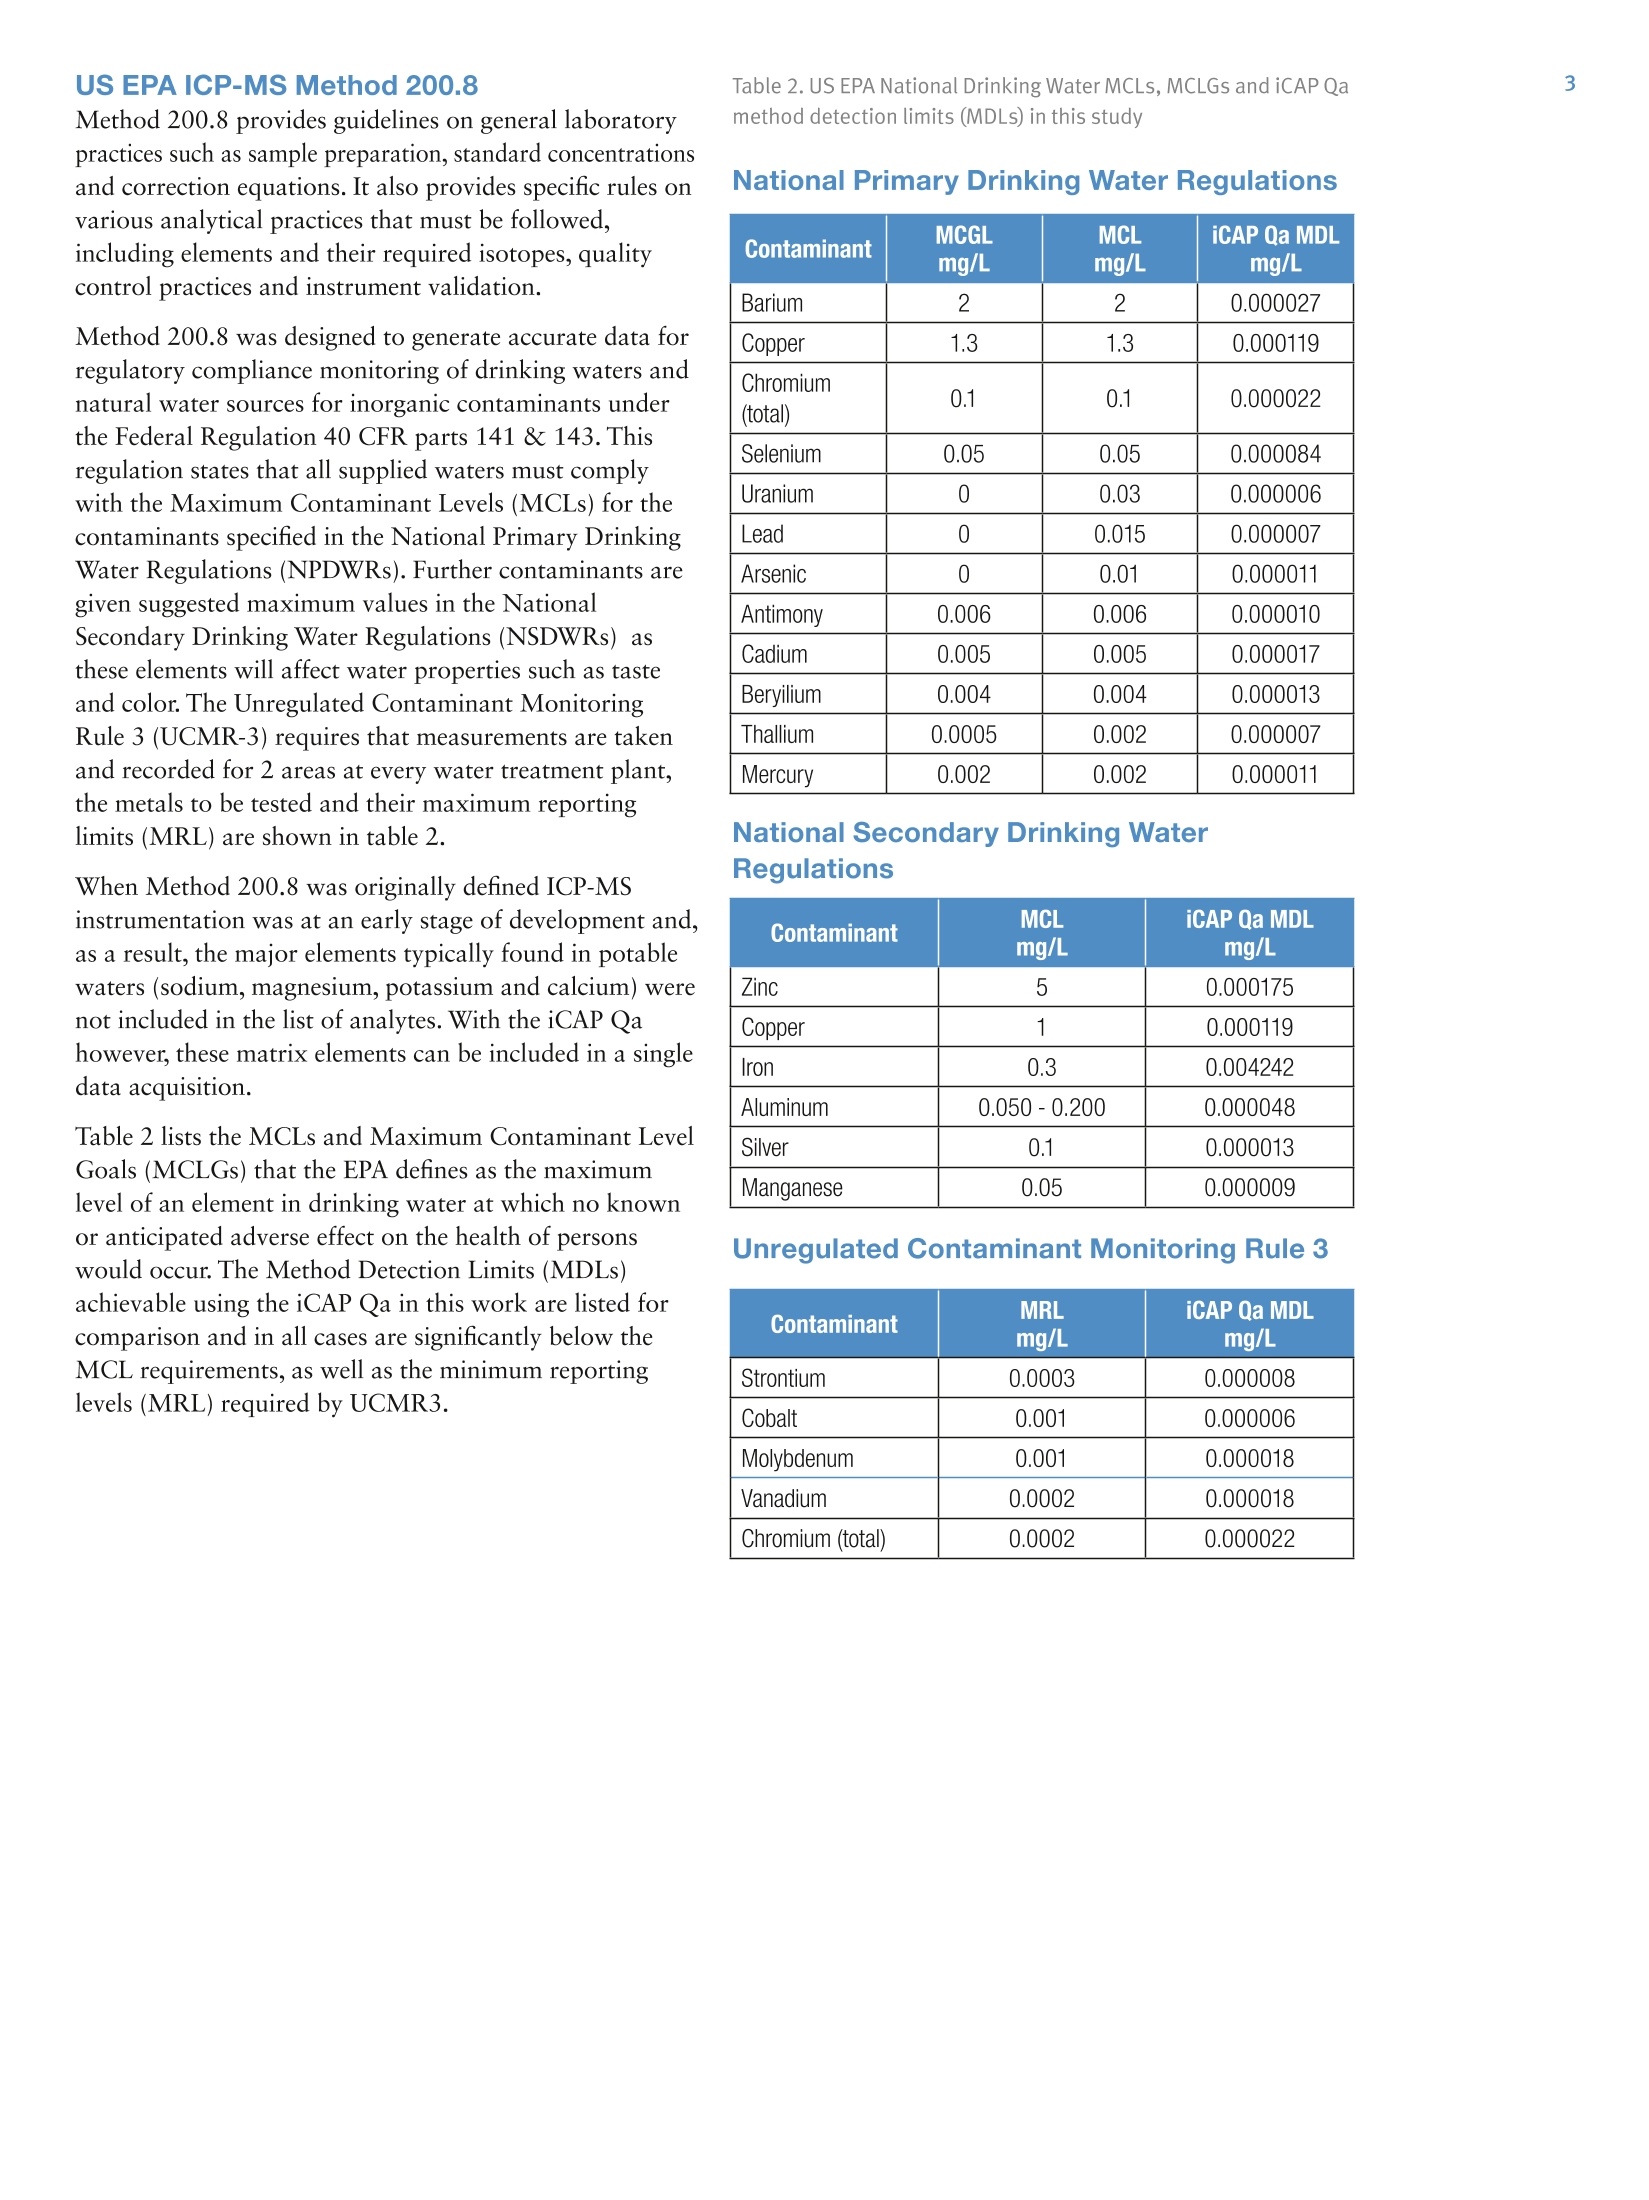
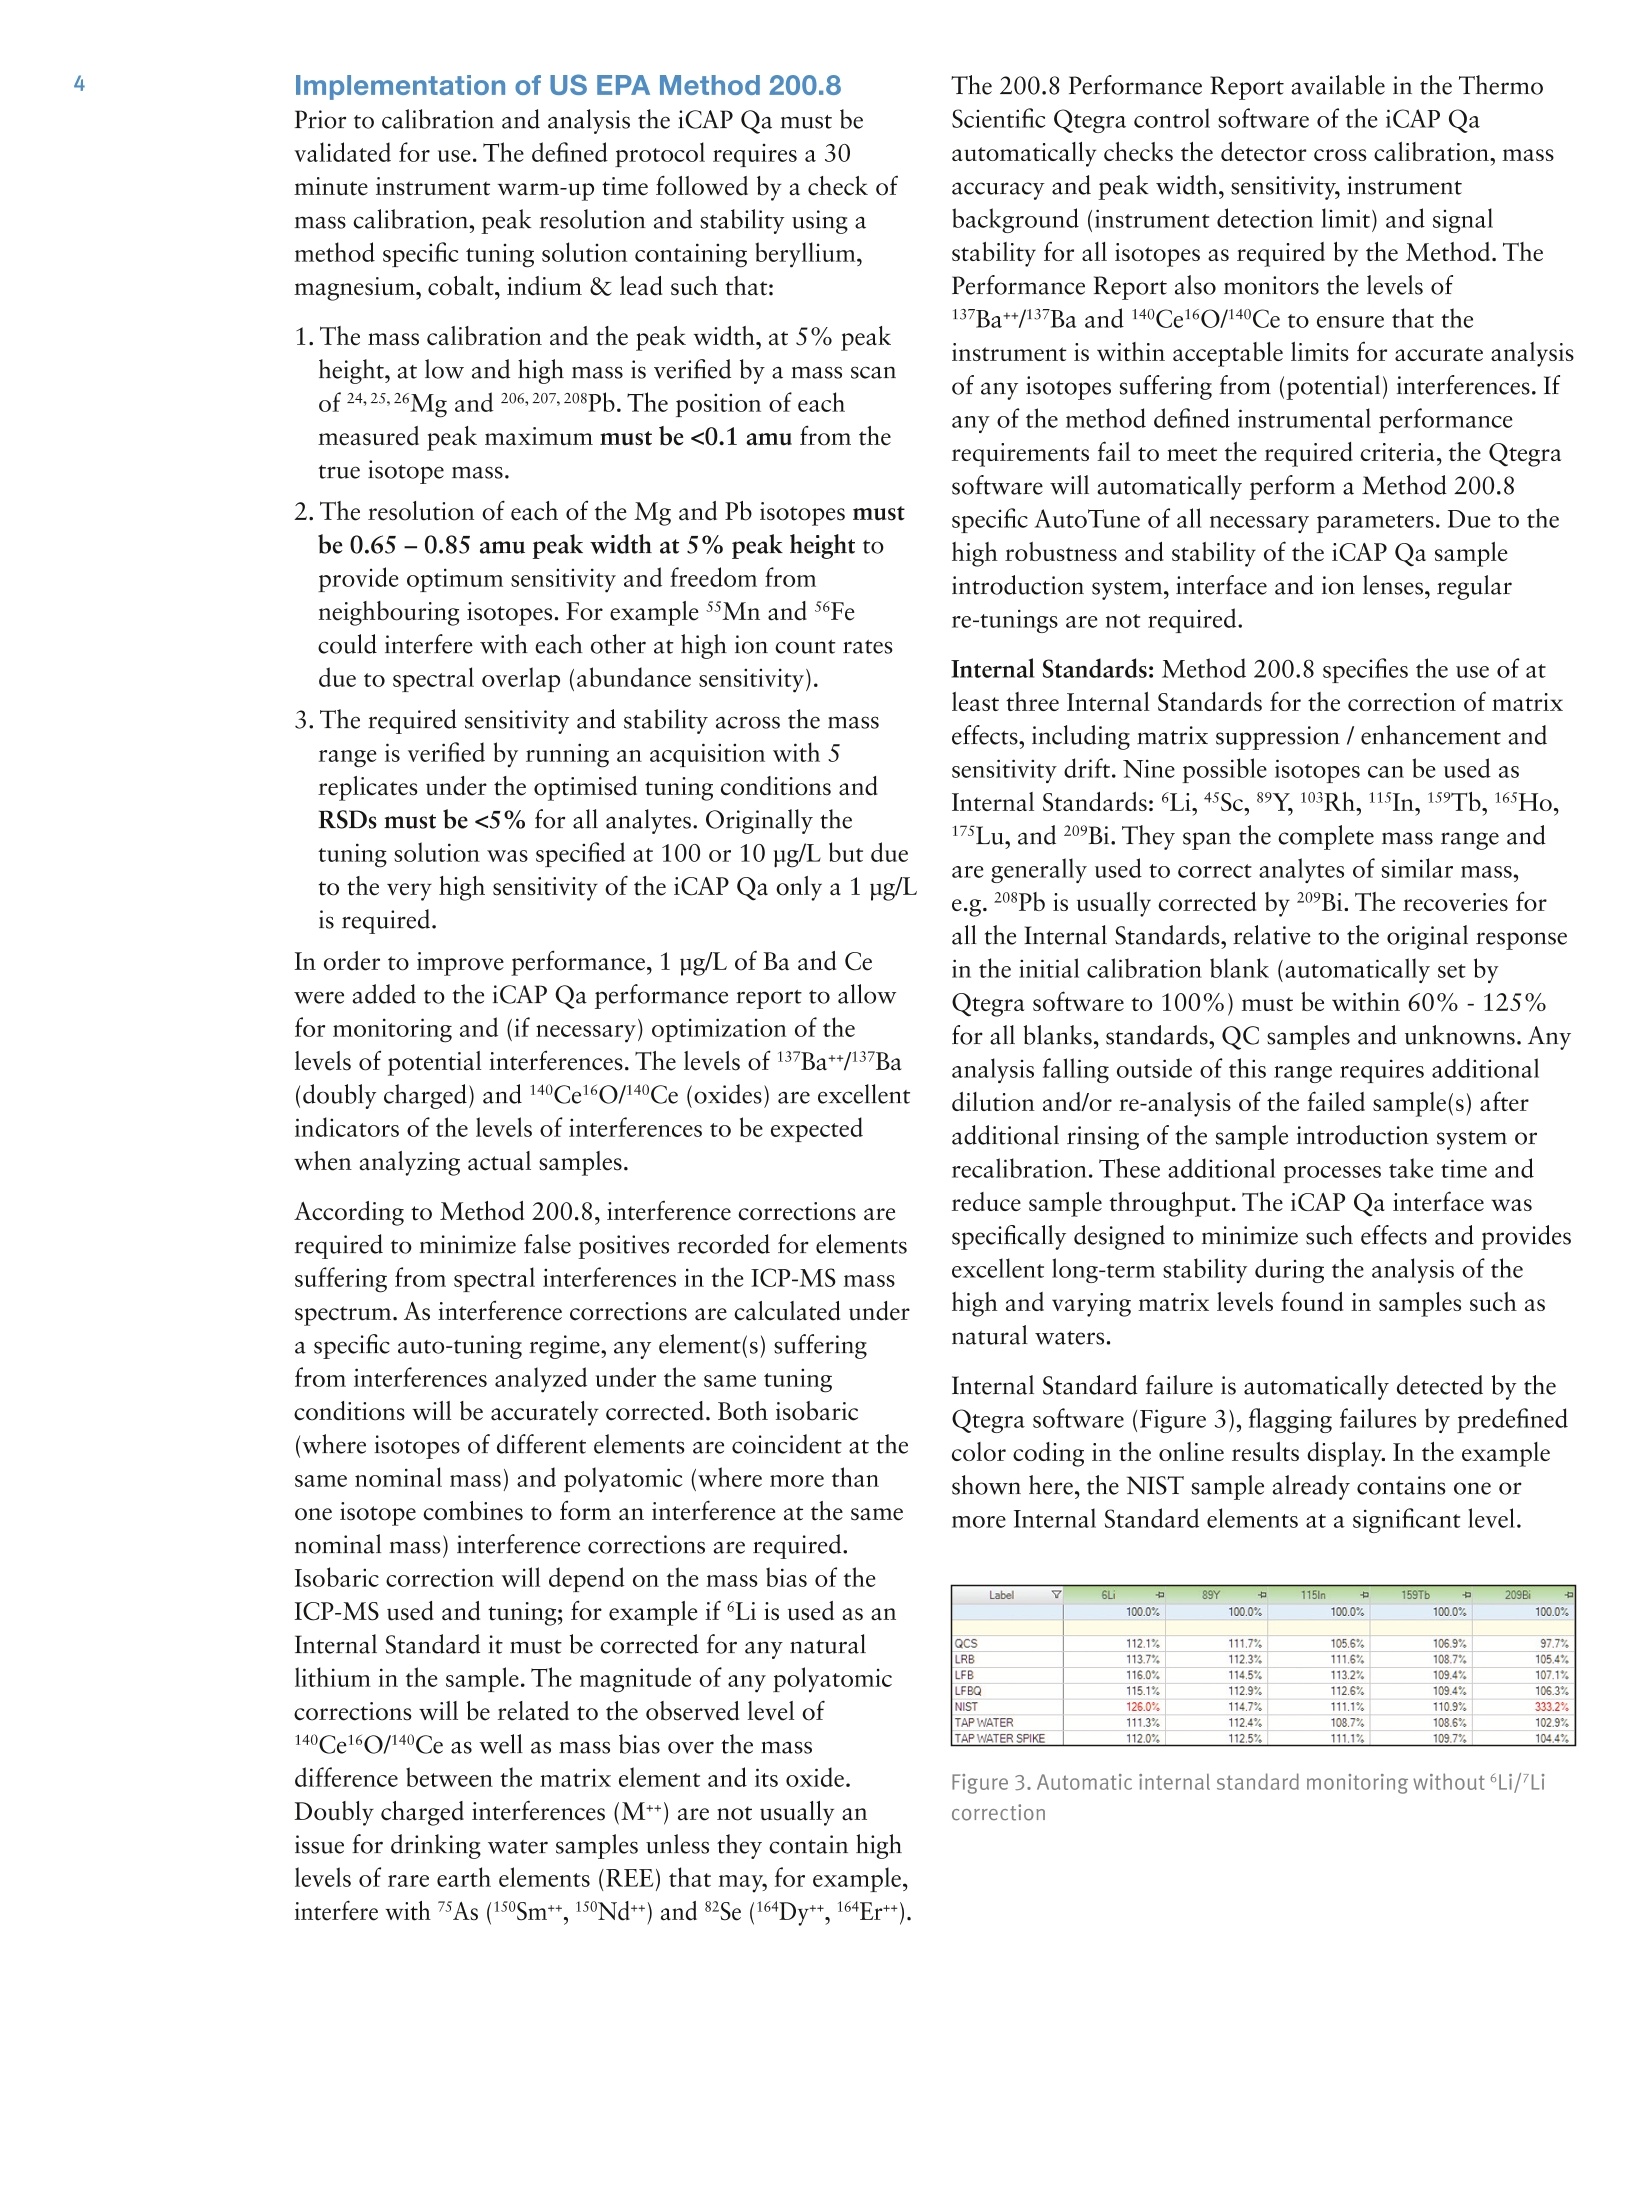
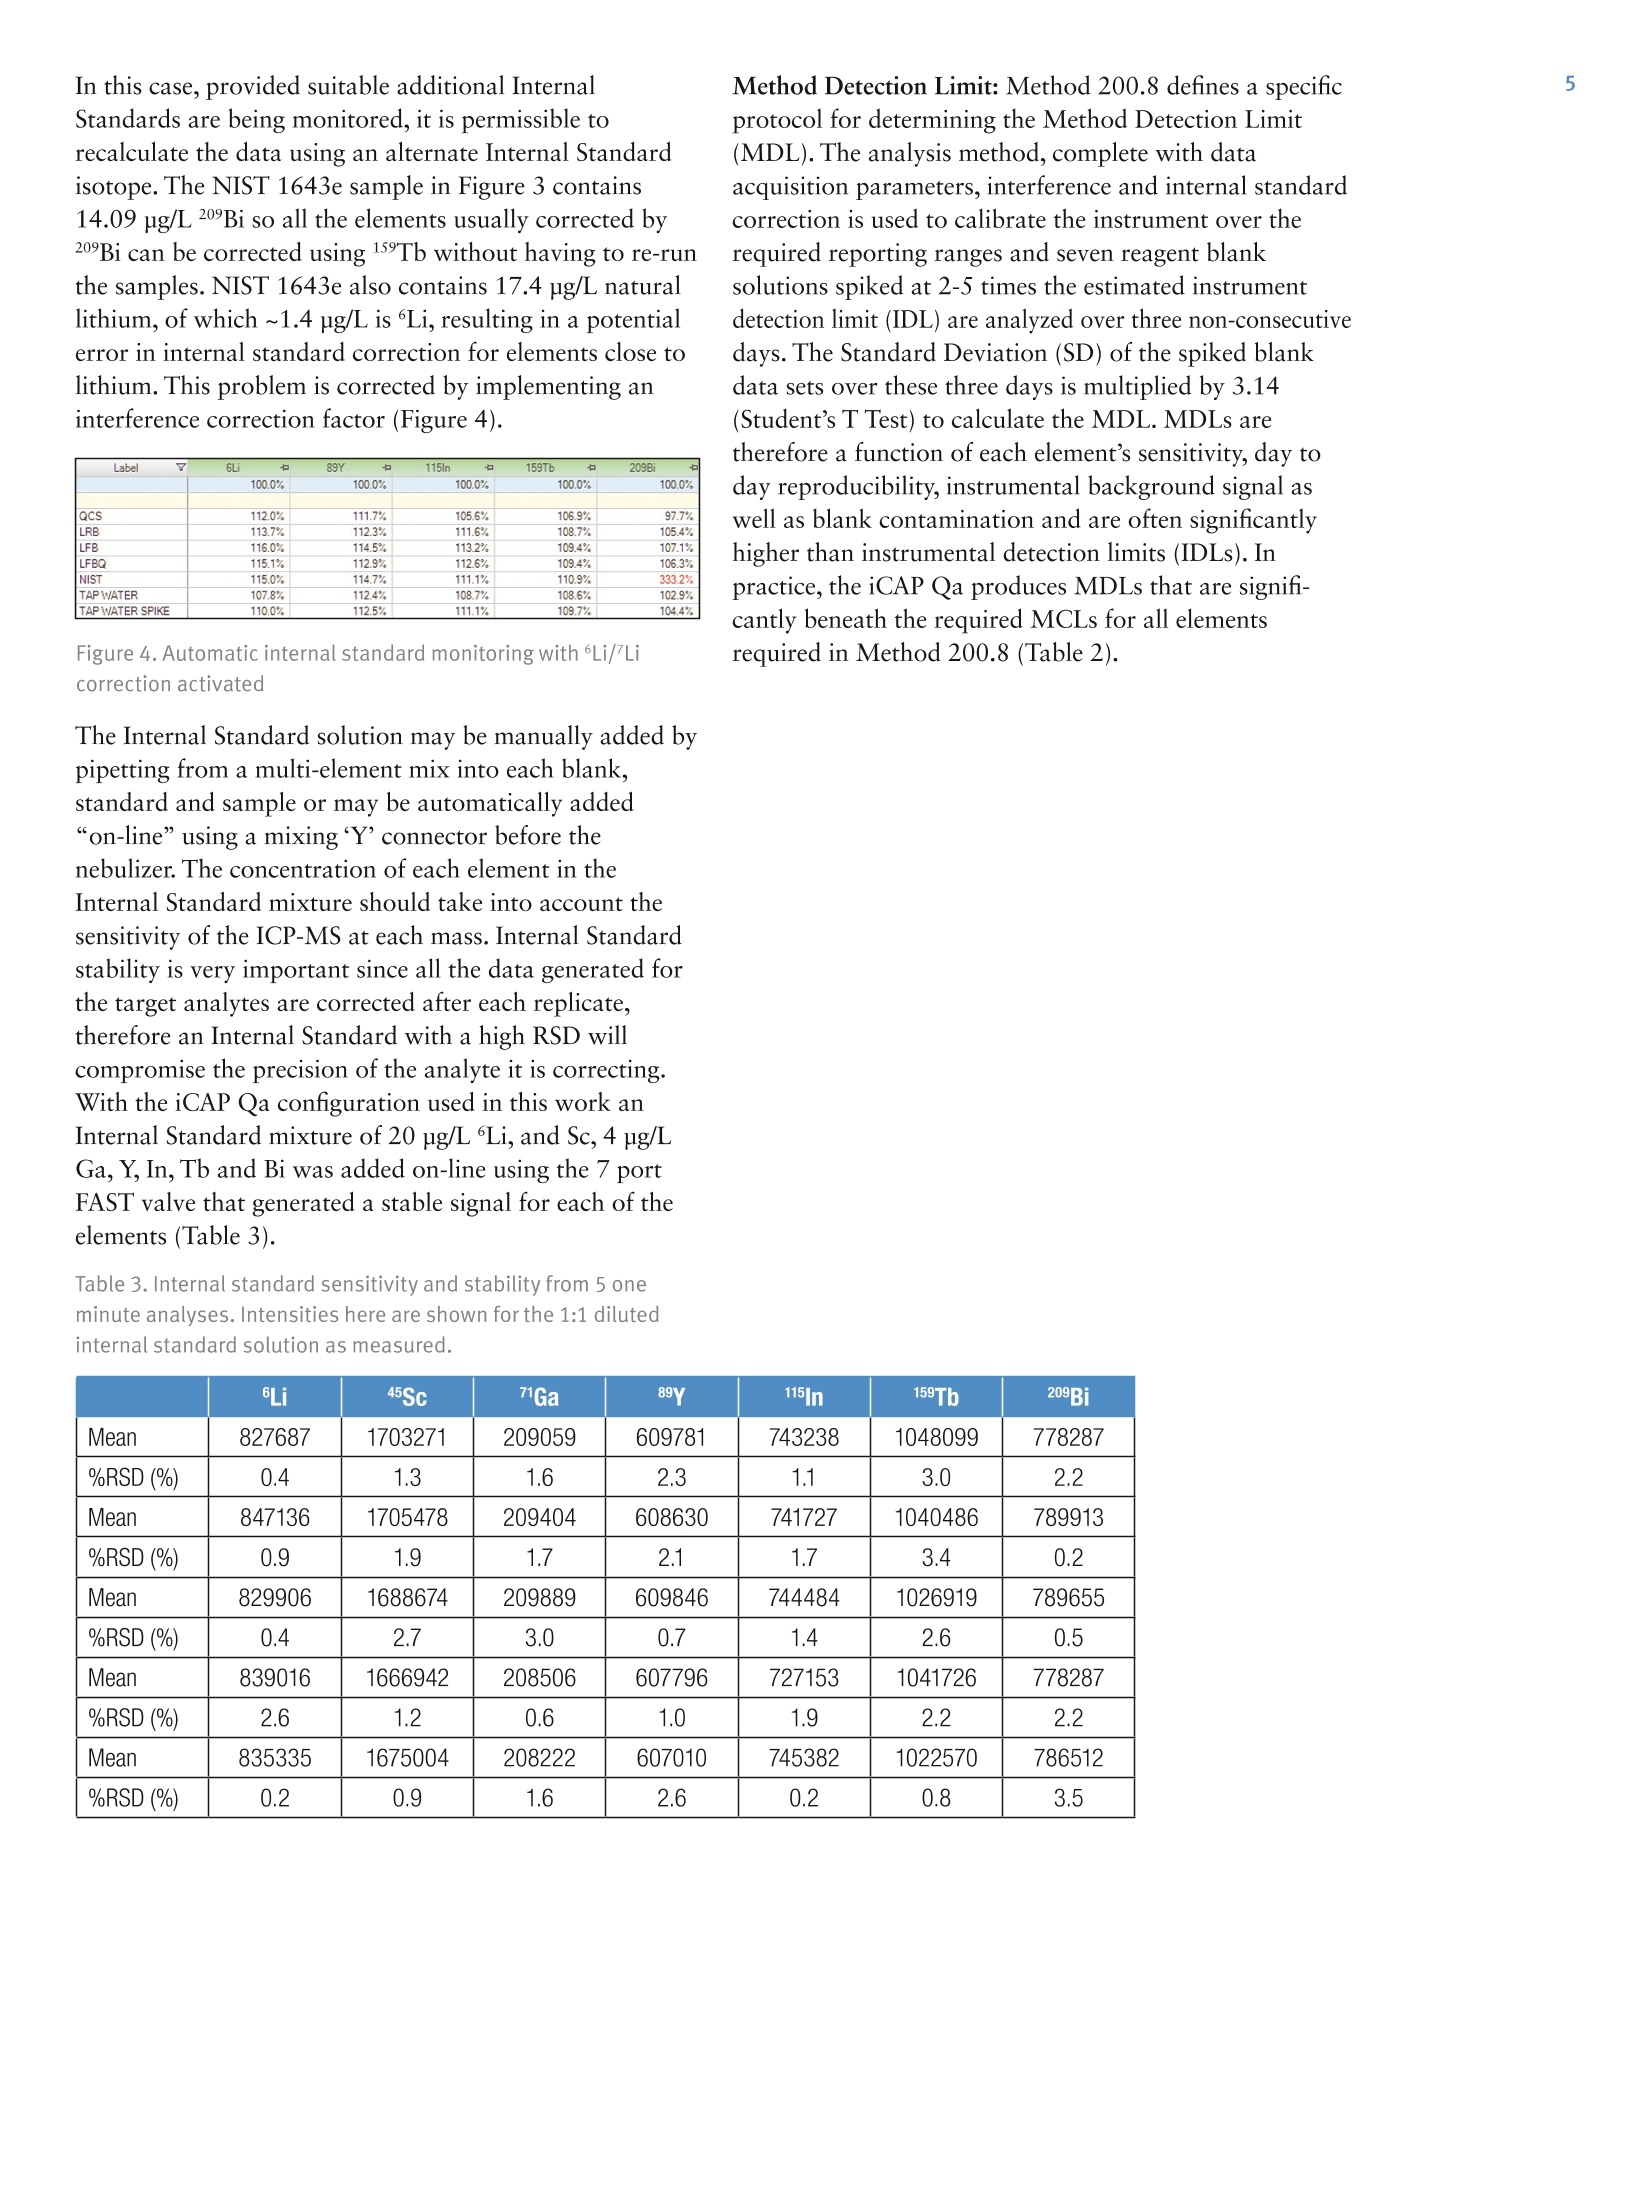
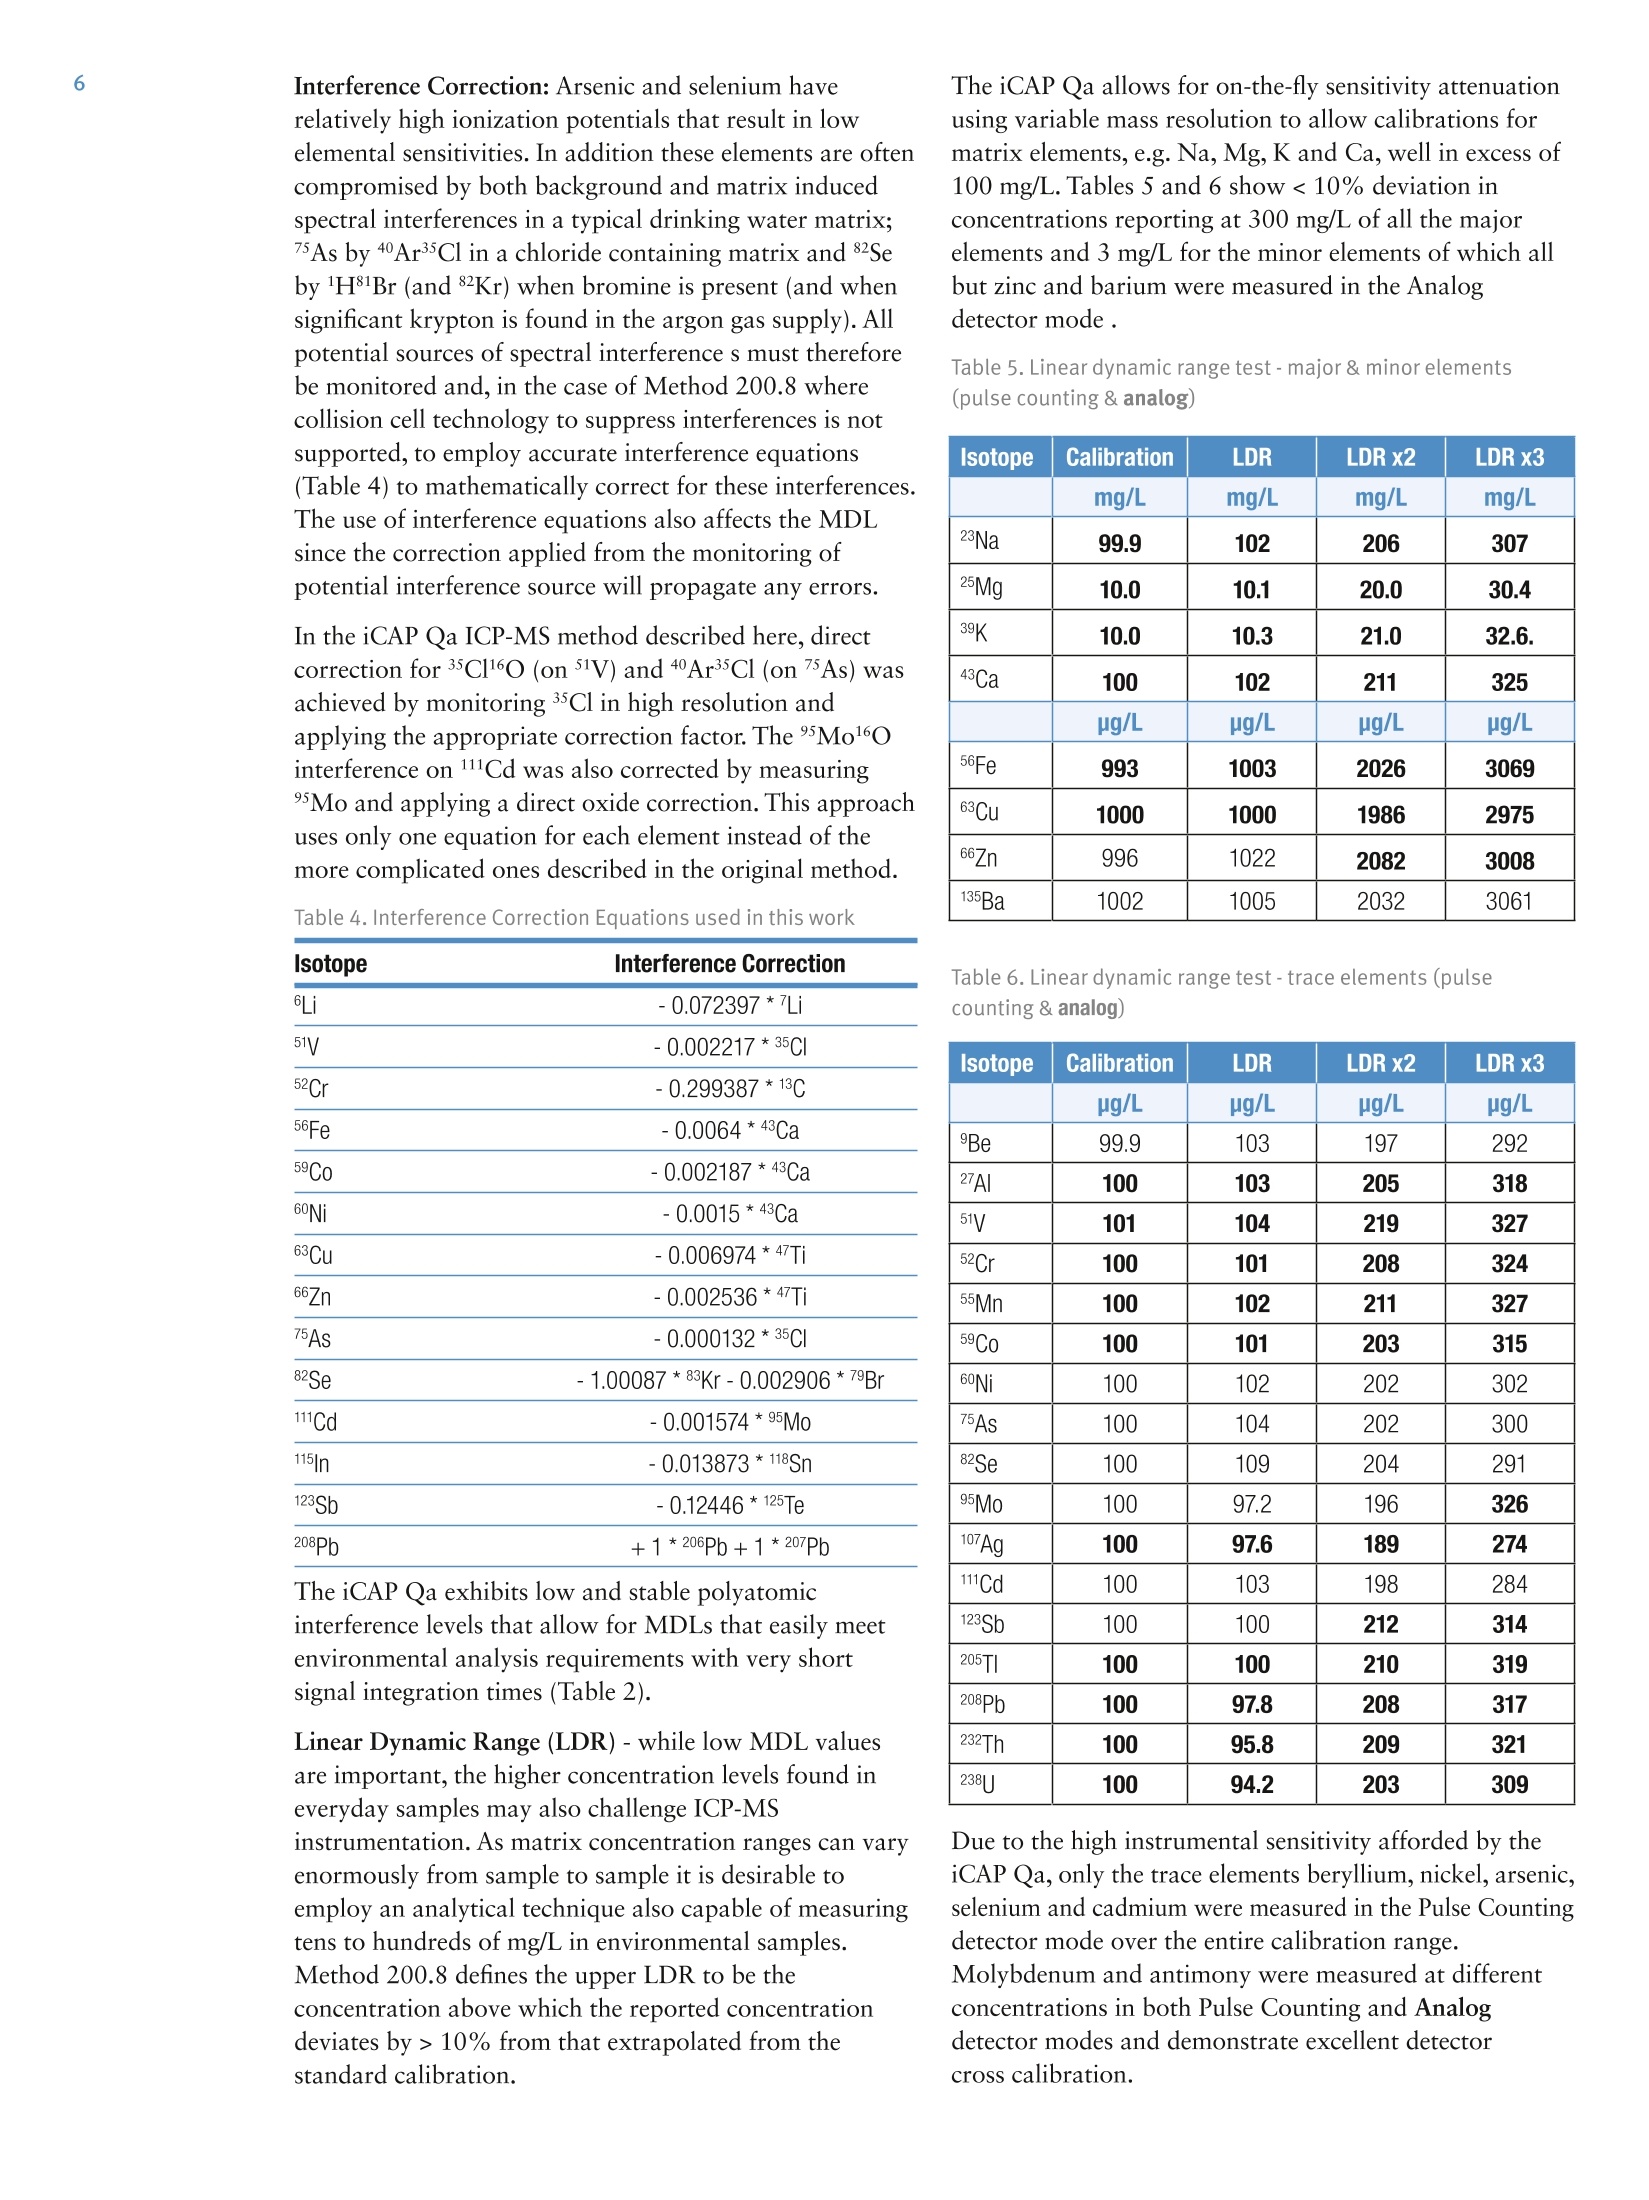
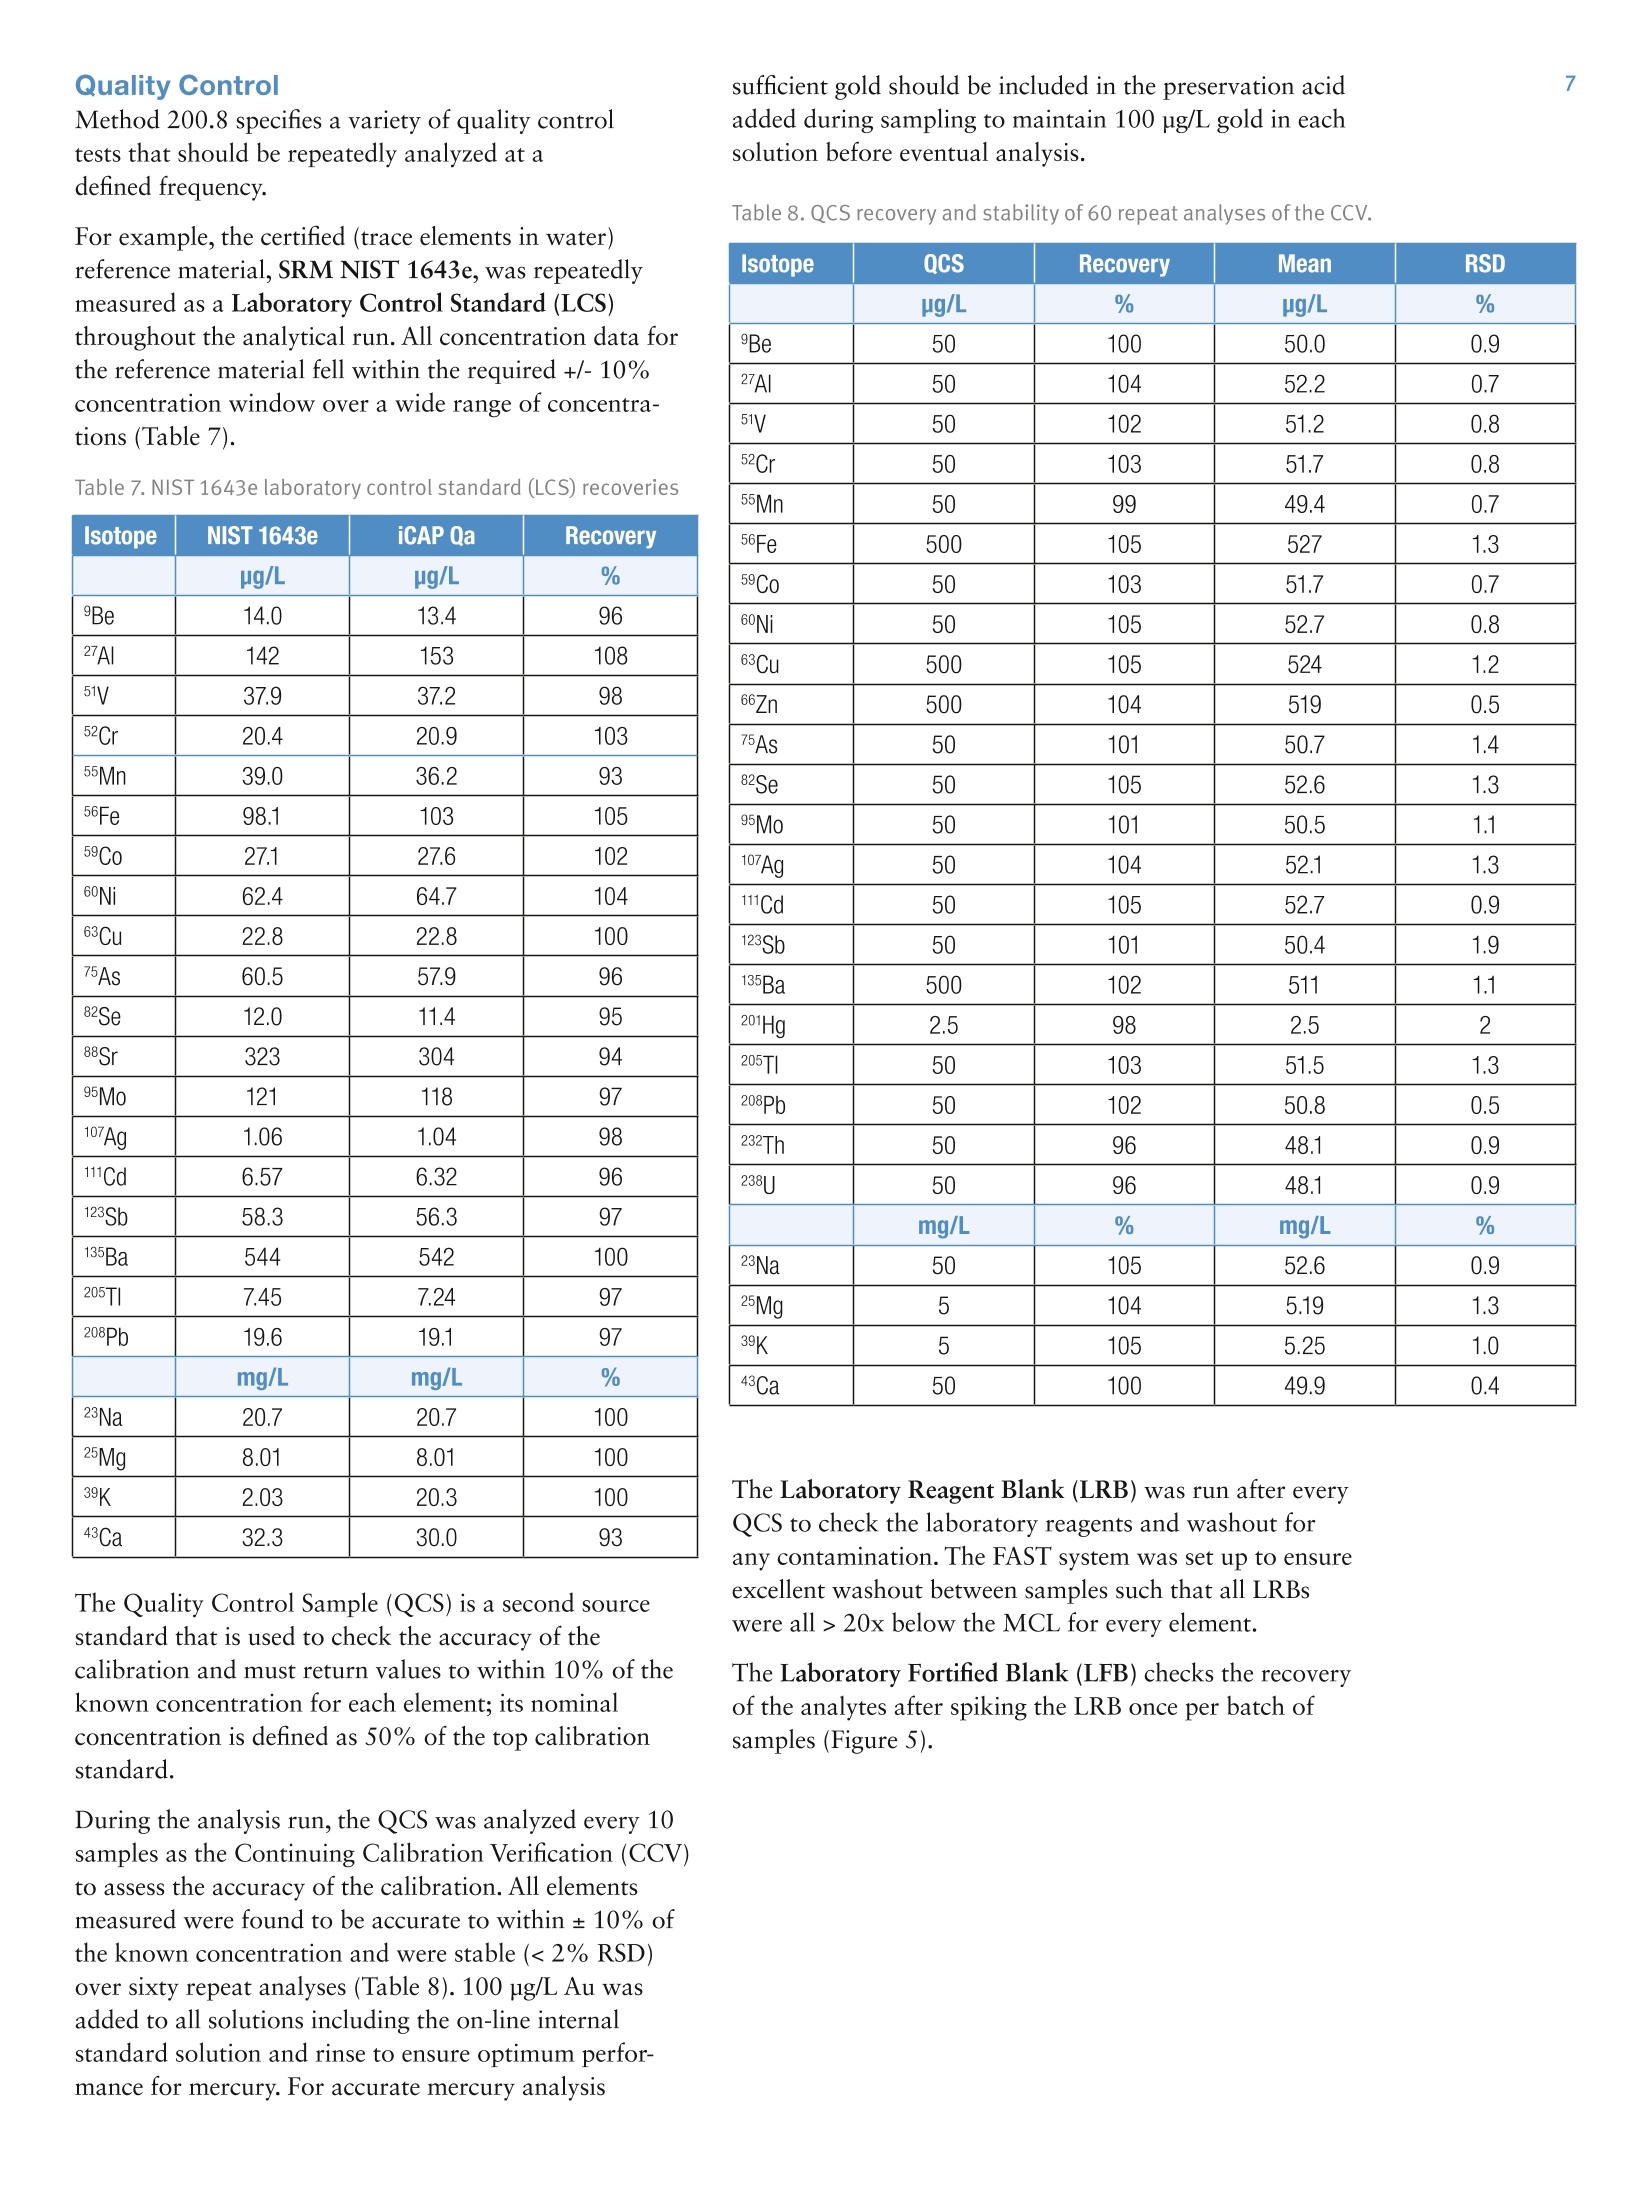
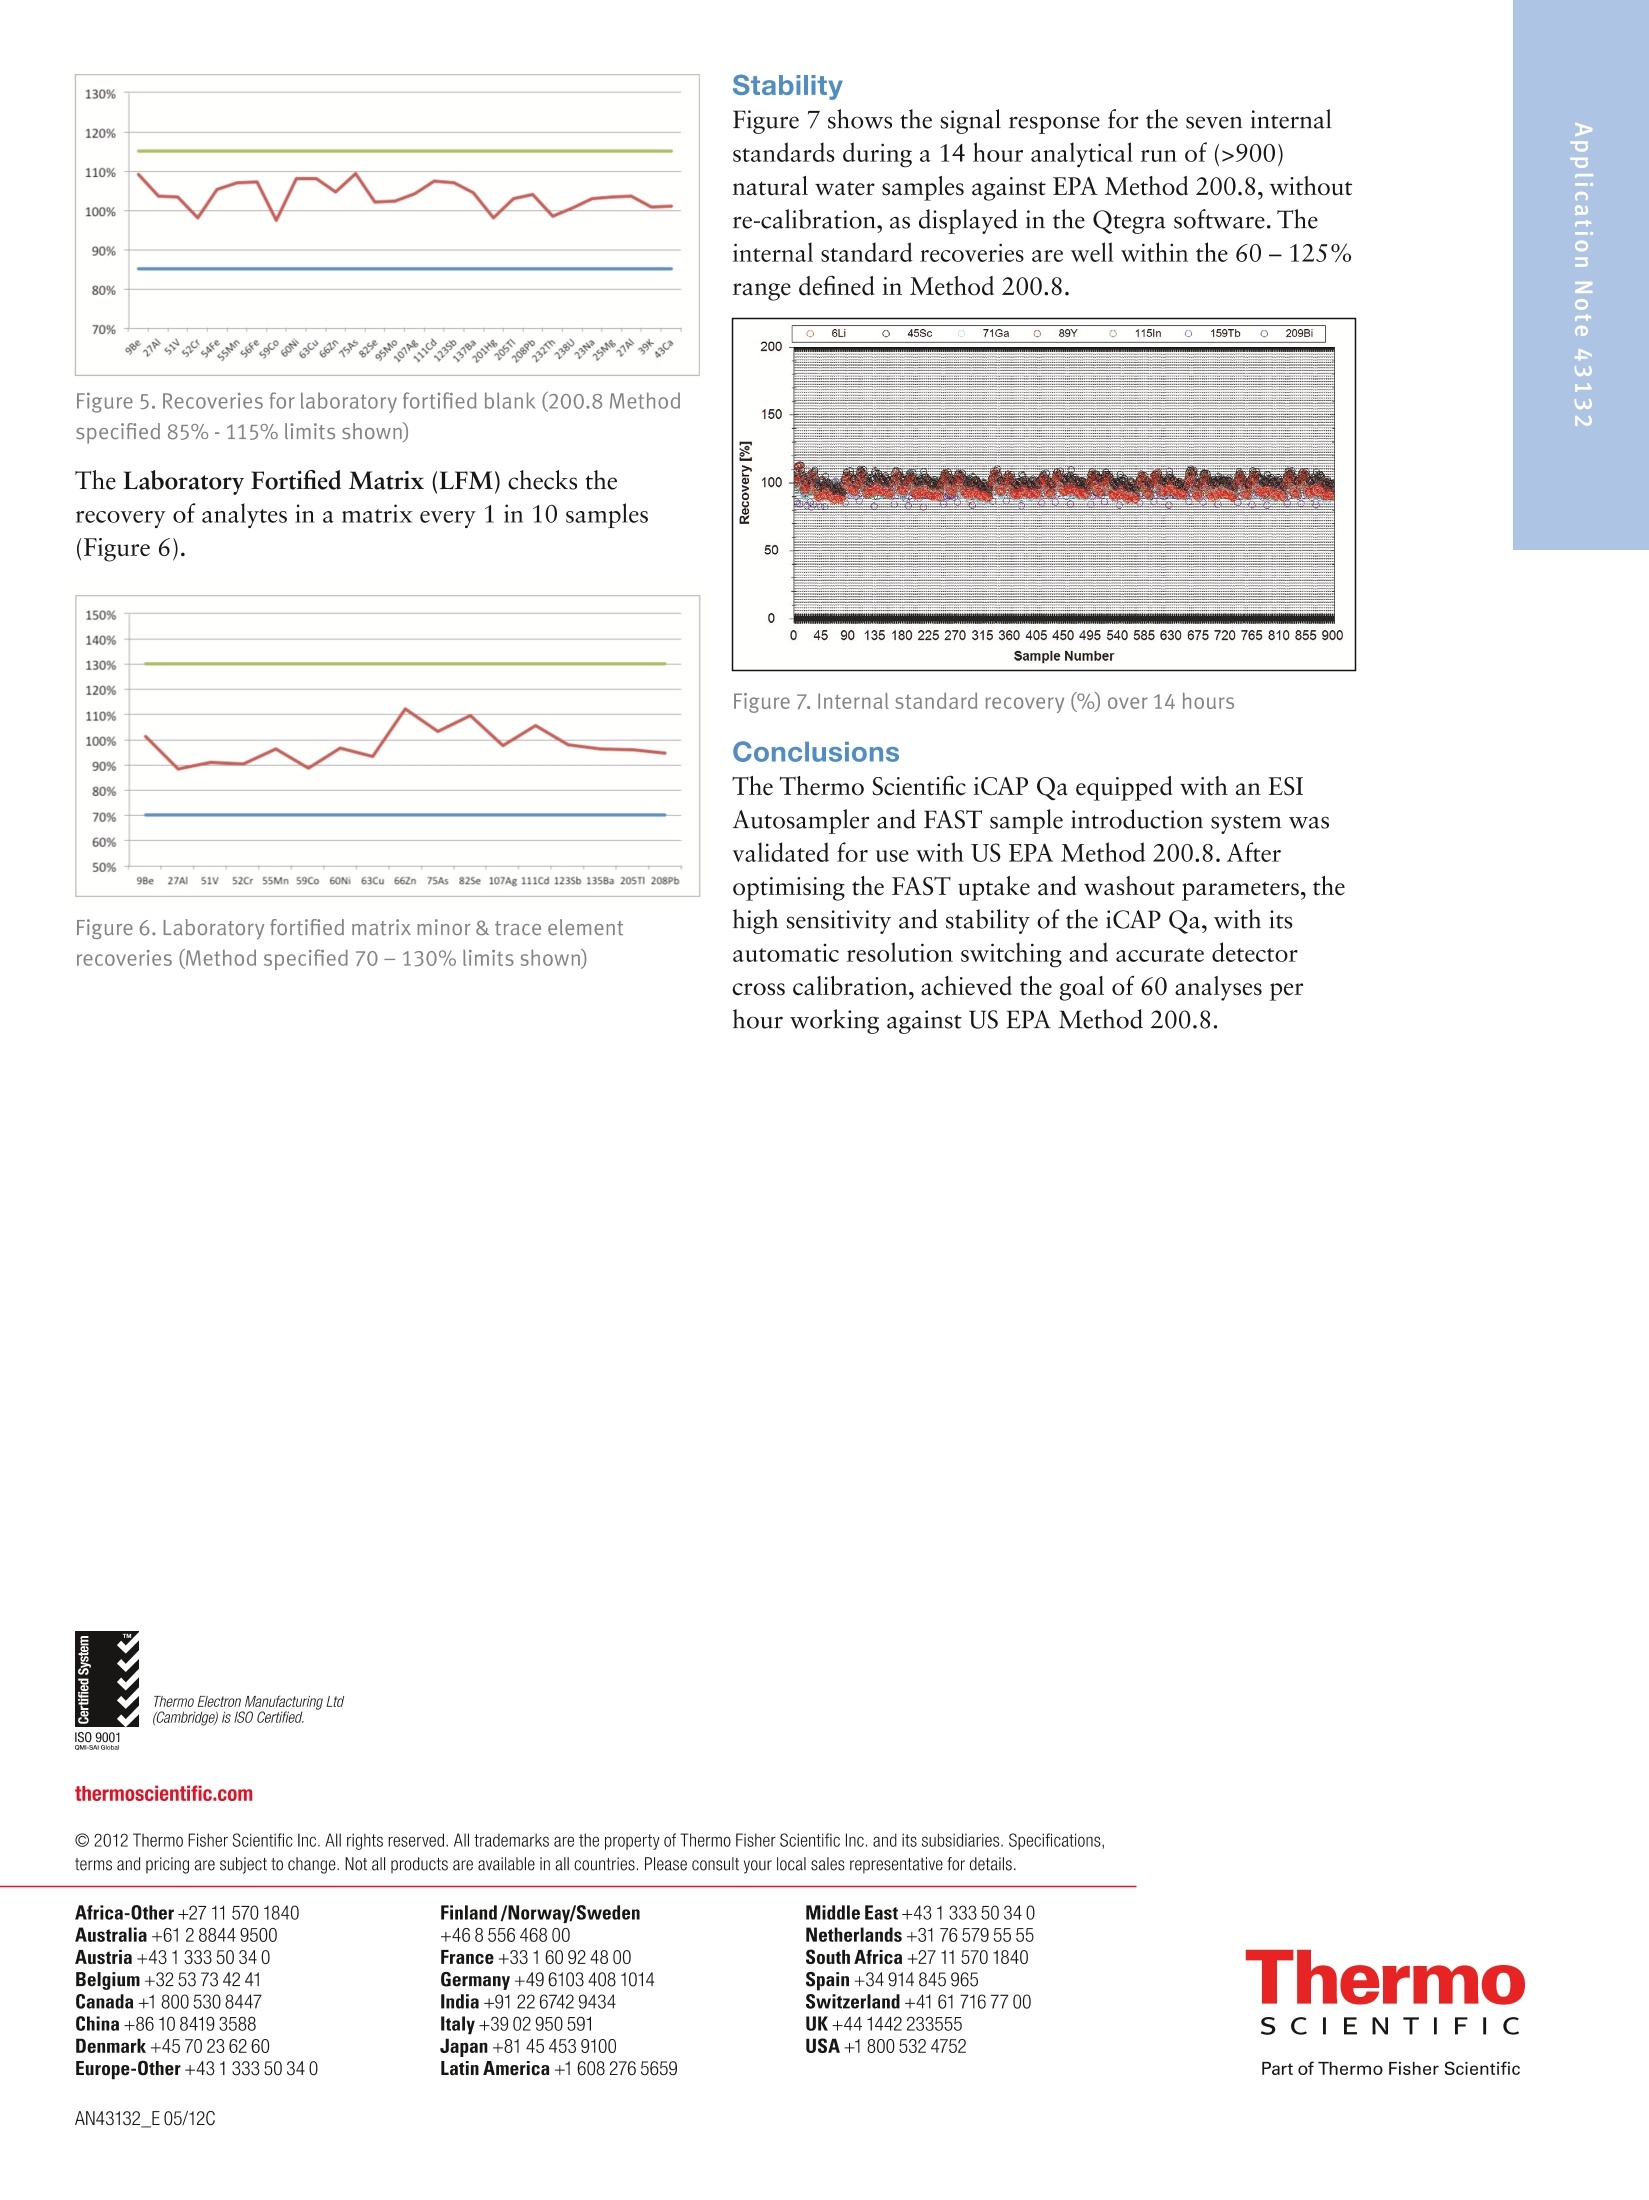
2 .3 Rob Henry and Julian Wills, Thermo Fisher Scientific, Germany Introduction The United States Environmental Protection Agency(US EPA) first developed and published Method 200.8:“Determination of Trace Elements in Waters and Wastesby Inductively Coupled Plasma Mass Spectrometry(ICP-MS)”in 1994. This method is now widely used forthe determination of twenty-two elements in ground,surface and drinking waters in both the United States andelsewhere. Large numbers of samples are often determinedwith this method as part of local and national regulatorycompliance monitoring as well as by private contractlaboratories. ICP-MS instruments based on collision and reaction celltechnologies are the technique of choice for accuratemulti-elemental ICP-MS analysis in a wide variety ofapplications due to their ability to suppress of polyatomicinterferences in a wide range of sample types. The USFederal Register currently mandates that measurementsmade using EPA Method 200.8 for drinking wateranalysis must however rely on mathematical interferencecorrection equations rather than collision and reaction celltechnologies in order to achieve accurate results. The Thermo Scientific iCAP Q ICP-MS was validated foruse against Revision 5.4 of the US EPA Method 200.8with the goal of completing a single measurement-consisting of uptake, data acquisition and washout-within 60s in order to maximize sample throughput inthe routine,environmental laboratories performingthese analyses. General Analytical ConditionsTable 1. Instrument operating parameters. Parameter Value Peristaltic pump speed 40 rpm Pump tubing orange/green tubing for both carrier (sample) and internal standard Nebulizer PFA-ST Interface cones Nickel RF Power 1550 W Cool gas flow 14 L/min Auxiliary gas flow 0.8 L/min Nebulizer gas flow 0.97 L/min Number of sweeps 20 Dwell Times 0.001-0.02 ms Data points per isotope 1 Replicates per analysis 3 Signal stabilization time 15 s FAST sample loop 0.5 mL FAST uptake time 3s FAST rinse time (dual stations) 1+3 s Total analysis time (sample to sample) 56 s Analysis Times In order to achieve the high throughput required bymonitoring bodies and private contract laboratories, persample analysis times have to be to highly efficient and asshort as possible. With the improved sensitivity of theiCAP Qa, integration times per isotope can be significantlyreduced for EPA Method 200.8 analyses, leading to theshortest data acquisition times possible.The ESI FASTsample introduction system uses a series of technologiesto reduce uptake of and washout between samples,minimizing these potentially significant analysis overheads. Through the combination of the iCAP Q and the FASTsample introduction system, sample to sample analysistimes (including uptake, data acquisition and washout) of< 60 s were achieved for the routine analysis of samples toUS EPA Method 200.8 (Figure 2). US EPA ICP-MS Method 200.8 Method 200.8 provides guidelines on general laboratorypractices such as sample preparation, standard concentrationsand correction equations. It also provides specific rules onvarious analytical practices that must be followed,including elements and their required isotopes, qualitycontrol practices and instrument validation. Method 200.8 was designed to generate accurate data forregulatory compliance monitoring of drinking waters andnatural water sources for inorganic contaminants underthe Federal Regulation 40 CFR parts 141 & 143. Thisregulation states that all supplied waters must complywith the Maximum Contaminant Levels (MCLs) for thecontaminants specified in the National Primary DrinkingWater Regulations (NPDWRs). Further contaminants aregiven suggested maximum values in the NationalSecondary Drinking Water Regulations (NSDWRs) asthese elements will affect water properties such as tasteand color. The Unregulated Contaminant MonitoringRule 3 (UCMR-3) requires that measurements are takenand recorded for 2 areas at every water treatment plant,the metals to be tested and their maximum reportinglimits (MRL) are shown in table 2. When Method 200.8 was originally defined ICP-MSinstrumentation was at an early stage of development and,as a result, the major elements typically found in potablewaters (sodium, magnesium, potassium and calcium) werenot included in the list of analytes. With the iCAP Qahowever, these matrix elements can be included in a singledata acquisition Table 2 lists the MCLs and Maximum Contaminant LevelGoals (MCLGs) that the EPA defines as the maximumlevel of an element in drinking water at which no knownor anticipated adverse effect on the health of personswould occur. The Method Detection Limits (MDLs)achievable using the iCAP Qa in this work are listed forcomparison and in all cases are significantly below theMCL requirements, as well as the minimum reportinglevels (MRL) required by UCMR3. Table 2. US EPA National Drinking Water MCLs, MCLGs and iCAP Qamethod detection limits (MDLs) in this study National Primary Drinking Water Regulations Contaminant MCGL mg/L MCL mg/L iCAP Qa MDLmg/L Barium 2 2 0.000027 Copper 1.3 1.3 0.000119 Chromium (total) 0.1 0.1 0.000022 Selenium 0.05 0.05 0.000084 Uranium 0 0.03 0.000006 Lead 0 0.015 0.000007 Arsenic 0 0.01 0.000011 Antimony 0.006 0.006 0.000010 Cadium 0.005 0.005 0.000017 Beryilium 0.004 0.004 0.000013 Thallium 0.0005 0.002 0.000007 Mercury 0.002 0.002 0.000011 Contaminant MCL mg/L iCAP Qa MDLmg/L Zinc 5 0.000175 Copper 1 0.000119 Iron 0.3 0.004242 Aluminum 0.050-0.200 0.000048 Silver 0.1 0.000013 Manganese 0.05 0.000009 Unregulated Contaminant Monitoring Rule 3 Contaminant MRLmg/L iCAP Qa MDLmg/L Strontium 0.0003 0.000008 Cobalt 0.001 0.000006 Molybdenum 0.001 0.000018 Vanadium 0.0002 0.000018 Chromium (total) 0.0002 0.000022 Implementation of US EPA Method 200.8Prior to calibration and analysis the iCAP Qa must bevalidated for use. The defined protocol requires a 30minute instrument warm-up time followed by a check ofmass calibration, peak resolution and stability using amethod specific tuning solution containing beryllium,magnesium, cobalt, indium & lead such that: 1. The mass calibration and the peak width, at 5% peakheight, at low and high mass is verified by a mass scanof 24, 25,26Mg and 206,207,208Pb. The position of eachmeasured peak maximum must be <0.1 amu from thetrue isotope mass. 2. The resolution of each of the Mg and Pb isotopes mustbe 0.65-0.85 amu peak width at 5% peak height toprovide optimum sensitivity and freedom fromneighbouring isotopes. For example 5Mn and 56Fecould interfere with each other at high ion count ratesdue to spectral overlap (abundance sensitivity). 3.The required sensitivity and stability across the massrange is verified by running an acquisition with 5replicates under the optimised tuning conditions andRSDs must be <5% for all analytes. Originally thetuning solution was specified at 100 or 10 pg/L but dueto the very high sensitivity of the iCAP Qa only a 1 ug/Lis required. In order to improve performance, 1 ug/L of Ba and Cewere added to the iCAP Qa performance report to allowfor monitoring and (if necessary) optimization of thelevels of potential interferences. The levels of 137Ba*+/137Ba(doubly charged)and 140Ce16O/140Ce (oxides) are excellentindicators of the levels of interferences to be expectedwhen analyzing actual samples. According to Method 200.8, interference corrections arerequired to minimize false positives recorded for elementssuffering from spectral interferences in the ICP-MS massspectrum. As interference corrections are calculated undera specific auto-tuning regime, any element(s) sufferingfrom interferences analyzed under the same tuningconditions will be accurately corrected. Both isobaric(where isotopes of different elements are coincident at thesame nominal mass) and polyatomic (where more thanone isotope combines to form an interference at the samenominal mass) interference corrections are required.Isobaric correction will depend on the mass bias of theICP-MS used and tuning; for example if Li is used as anInternal Standard it must be corrected for any naturallithium in the sample. The magnitude of any polyatomiccorrections will be related to the observed level of140Ce16O/140Ce as well as mass bias over the massdifference between the matrix element and its oxide.Doubly charged interferences (M*) are not usually anissue for drinking water samples unless they contain highlevels of rare earth elements (REE) that may, for example,interfere with 7As (150Sm*,150Nd**) and 82Se (164Dy*t, 164Er*). The 200.8 Performance Report available in the ThermoScientific Qtegra control software of the iCAP Qaautomatically checks the detector cross calibration, massaccuracy and peak width, sensitivity, instrumentbackground (instrument detection limit) and signalstability for all isotopes as required by the Method. ThePerformance Report also monitors the levels of137Ba*+/137Ba and 140Ce16O/140Ce to ensure that theinstrument is within acceptable limits for accurate analysisof any isotopes suffering from (potential) interferences. Ifany of the method defined instrumental performancerequirements fail to meet the required criteria, the Qtegrasoftware will automatically perform a Method 200.8specific AutoTune of all necessary parameters. Due to thehigh robustness and stability of the iCAP Qa sampleintroduction system, interface and ion lenses, regularre-tunings are not required. Internal Standards: Method 200.8 specifies the use of atleast three Internal Standards for the correction of matrixeffects, including matrix suppression / enhancement andsensitivity drift. Nine possible isotopes can be used asInternal Standards: Li,45Sc,89Y,103Rh, 115In, 159Tb,165Ho,175Lu, and 209Bi. They span the complete mass range andare generally used to correct analytes of similar mass,e.g. 208Pb is usually corrected by 209Bi. The recoveries forall the Internal Standards, relative to the original responsein the initial calibration blank (automatically set byQtegra software to 100%) must be within 60%-125%for all blanks, standards, QC samples and unknowns. Anyanalysis falling outside of this range requires additionaldilution and/or re-analysis of the failed sample(s) afteradditional rinsing of the sample introduction system orrecalibration. These additional processes take time andreduce sample throughput. The iCAP Qa interface wasspecifically designed to minimize such effects and providesexcellent long-term stability during the analysis of thehigh and varying matrix levels found in samples such asnatural waters. Internal Standard failure is automatically detected by theQtegra software (Figure 3), flagging failures by predefinedcolor coding in the online results display. In the exampleshown here, the NIST sample already contains one ormore Internal Standard elements at a significant level. Label 6L 89Y 115In 159Tb 209Bi 100.0% 100.0% 100.0% 100.0% 100.0% QCS 112.1% 111.7% 105.6% 106.9% 97.7% LRB 113.7% 112.3% 111.6% 108.7% 105.4% LFB 116.0% 114.5% 113.2% 109.4% 107.1% LFBQ 115.1% 112.9% 112.6% 109.4% 106.3% NIST 126.0% 114.7% 111.1% 110.9% 333.2% 111.3% 112.4% 108.7% 108.6% 102.9% TAP WATER SPIKE 112.0% 112.5% 111.1% 109.7% 104.4% Figure 3. Automatic internal standard monitoring without 6Li/Licorrection In this case, provided suitable additional InternalStandards are being monitored, it is permissible torecalculate the data using an alternate Internal Standardisotope. The NIST 1643e sample in Figure 3 contains14.09 pg/L 209Bi so all the elements usually corrected by209Bi can be corrected using 159Tb without having to re-runthe samples. NIST 1643e also contains 17.4 pg/L naturallithium, of which ~1.4 ug/L is Li, resulting in a potentialerror in internal standard correction for elements close tolithium. This problem is corrected by implementing aninterference correction factor (Figure 4). Label 6Li 89Y 115In 口 159Tb 口 100.0% 100.0% 100.0% 100.0% 100.0% QCS 112.0% 111.7% 105.6% 106.9% 97.7% LRB 113.7% 112.3% 111.6% 108.7% 105.4% LFB 116.0% 114.5% 113.2% 109.4% 107.1% LFBQ 115.1% 112.9% 112.6% 109.4% 106.3% NIST 115.0%107.8% 114.7% 112.4% 111.1% 108.7% 110.9% 108.6% 333.2% TAPWATERTAP WATER SPIKE 110.0% 112.5% 111.1% 109.7% 102.9% 104.4% Figure 4. Automatic internal standard monitoring with 6Li/Licorrection activated The Internal Standard solution may be manually added bypipetting from a multi-element mix into each blank,standard and sample or may be automatically added“on-line”using a mixing ‘Y'connector before thenebulizer. The concentration of each element in theInternal Standard mixture should take into account thesensitivity of the ICP-MS at each mass. Internal Standardstability is very important since all the data generated forthe target analytes are corrected after each replicate,therefore an Internal Standard with a high RSD willcompromise the precision of the analyte it is correcting.With the iCAP Qa configuration used in this work anInternal Standard mixture of 20 pg/L Li, and Sc, 4 pg/LGa,Y, In, Tb and Bi was added on-line using the 7portFAST valve that generated a stable signal for each of theelements (Table 3). Table 3. Internal standard sensitivity and stability from 5 oneminute analyses. Intensities here are shown for the 1:1 dilutedinternal standard solution as measured. Method Detection Limit: Method 200.8 defines a specificprotocol for determining the Method Detection Limit(MDL). The analysis method, complete with dataacquisition parameters, interference and internal standardcorrection is used to calibrate the instrument over therr(equired reporting ranges and seven reagent blanksolutions spiked at 2-5 times the estimated instrumentdetection limit (IDL) are analyzed over three non-consecutivedays. The Standard Deviation (SD) of the spiked blankdata sets over these three days is multiplied by 3.14(Student’s T Test) to calculate the MDL.MDLs aretherefore a function of each element’s sensitivity, day today reproducibility, instrumental background signal aswell as blank contamination and are often significantlyhigher than instrumental detection limits (IDLs). Inpractice, the iCAP Qa produces MDLs that are signifi-cantly beneath the required MCLs for all elementsrequired in Method 200.8 (Table 2). Interference Correction: Arsenic and selenium haverelatively high ionization potentials that result in lowelemental sensitivities. In addition these elements are oftencompromised by both background and matrix inducedspectral interferences in a typical drinking water matrix;75As by 40Ar35Cl in a chloride containing matrix and 82Seby 1HBr (and 82Kr) when bromine is present (and whensignificant krypton is found in the argon gas supply). Allpotential sources of spectral interference s must thereforebe monitored and, in the case of Method 200.8 wherecollision cell technology to suppress interferences is notsupported, to employ accurate interference equations(Table 4) to mathematically correct for these interferences.The use of interference equations also affects the MDLsince the correction applied from the monitoring ofpotential interference source will propagate any errors. In the iCAP Qa ICP-MS method described here, directcorrection for 35Cl160 (on 51V) and 40Ar35Cl (on 75As) wasachieved by monitoring 35Cl in high resolution andapplying the appropriate correction factor. The Mo160interference on 111Cd was also corrected by measuring°Mo and applying a direct oxide correction. This approachuses only one equation for each element instead of themore complicated ones described in the original method. Table 4. Interference Correction Equations used in this work Isotope 6Li -0.072397*/Li 51V -0.002217*35CI 52Cr -0.299387*13C 56Fe -0.0064*43Ca 59Co -0.002187*43Ca 60Ni -0.0015*43Ca 63Cu -0.006974*47Ti 66Zn -0.002536*47Ti 75As -0.000132*35CI 82Se -1.00087*83Kr-0.002906*79Br 111Cd -0.001574*95M0 115In -0.013873*118Sn 123Sb -0.12446*125Te 208Pb +1*206Pb+1*207Pb The iCAP Qa exhibits low and stable polyatomicinterference levels that allow for MDLs that easily meetenvironmental analysis requirements with very shortsignal integration times (Table 2). Linear Dynamic Range (LDR)-while low MDL valuesare important, the higher concentration levels found ineveryday samples may also challenge ICP-MSinstrumentation. As matrix concentration ranges can varyenormously from sample to sample it is desirable toemploy an analytical technique also capable of measuringtens to hundreds of mg/L in environmental samples.Method 200.8 defines the upper LDR to be theconcentration above which the reported concentrationdeviates by > 10% from that extrapolated from thestandard calibration. The iCAP Qa allows for on-the-fly sensitivity attenuationusing variable mass resolution to allow calibrations formatrix elements, e.g. Na, Mg, K and Ca, well in excess of100 mg/L. Tables 5 and 6 show <10% deviation inconcentrations reporting at 300 mg/L of all the majorelements and 3 mg/L for the minor elements of which allbut zinc and barium were measured in the Analogdetector mode . Table 5. Linear dynamic range test- major & minor elements(pulse counting & analog) Isotope Calibration LDR LDR x2 LDRx3 mg/L mg/L mg/L mg/L 23Na 99.9 102 206 307 25Mg 10.0 10.1 20.0 30.4 39K 10.0 10.3 21.0 32.6. 43Ca 100 102 211 325 ug/L ug/L pg/L ug/L 56Fe 993 1003 2026 3069 63Cu 1000 1000 1986 2975 66Zn 996 1022 2082 3008 135Ba 1002 1005 2032 3061 Table 6. Linear dynamic range test -trace elements (pulsecounting & analog) Isotope Calibration LDR LDR x2 LDR x3 ug/L ug/L ug/L pg/L 9Be 99.9 103 197 292 27AI 100 103 205 318 51V 101 104 219 327 52Cr 100 101 208 324 55Mn 100 102 211 327 59Co 100 101 203 315 60Ni 100 102 202 302 75As 100 104 202 300 82Se 100 109 204 291 95Mo 100 97.2 196 326 107Ag 100 97.6 189 274 111Cd 100 103 198 284 123Sb 100 100 212 314 205TI 100 100 210 319 208Pb 100 97.8 208 317 232Th 100 95.8 209 321 238U 100 94.2 203 309 Due to the high instrumental sensitivity afforded by theiCAP Qa, only the trace elements beryllium, nickel, arsenic,selenium and cadmium were measured in the Pulse Countingdetector mode over the entire calibration range.Molybdenum and antimony were measured at differentconcentrations in both Pulse Counting and Analogdetector modes and demonstrate excellent detectorcross calibration. Method 200.8 specifies a variety of quality controltests that should be repeatedly analyzed at adefined frequency. For example, the certified (trace elements in water)reference material, SRM NIST 1643e, was repeatedlymeasured as a Laboratory Control Standard (LCS)throughout the analytical run. All concentration data forthe reference material fell within the required +/-10%concentration window over a wide range of concentra-tions (Table 7). Table 7. NIST 1643e laboratory control standard (LCS) recoveries Isotope NIST 1643e iCAP Qa Recovery ug/L ug/L % Be 14.0 13.4 96 27AI 142 153 108 51V 37.9 37.2 98 52Cr 20.4 20.9 103 55Mn 39.0 36.2 93 56Fe 98.1 103 105 59Co 27.1 27.6 102 60Ni 62.4 64.7 104 63Cu 22.8 22.8 100 75As 60.5 57.9 96 82Se 12.0 11.4 95 88Sr 323 304 94 95Mo 121 118 97 107Ag 1.06 1.04 98 111Cd 6.57 6.32 96 123Sb 58.3 56.3 97 135Ba 544 542 100 205TI 7.45 7.24 97 208Pb 19.6 19.1 97 mg/L mg/L % 23Na 20.7 20.7 100 25Mg 8.01 8.01 100 39K 2.03 20.3 100 43Ca 32.3 30.0 93 The Quality Control Sample (QCS) is a second sourcestandard that is used to check the accuracy of thecalibration and must return values to within 10% of theknown concentration for each element; its nominalconcentration is defined as 50% of the top calibrationstandard. During the analysis run, the QCS was analyzed every 10samples as the Continuing Calibration Verification (CCV)to assess the accuracy of the calibration. All elementsmeasured were found to be accurate to within ±10% ofthe known concentration and were stable (<2% RSD)over sixty repeat analyses (Table 8). 100 ug/L Au wasadded to all solutions including the on-line internalstandard solution and rinse to ensure optimum perfor-mance for mercury. For accurate mercury analysis sufficient gold should be included in the preservation acidadded during sampling to maintain 100 pg/L gold in eachsolution before eventual analysis. Table 8. QCS recovery and stability of 60 repeat analyses of the CCV. Isotope QCS Recovery Mean RSD ug/L % ug/L % Be 50 100 50.0 0.9 27AI 50 104 52.2 0.7 51V 50 102 51.2 0.8 52Cr 50 103 51.7 0.8 55Mn 50 99 49.4 0.7 56Fe 500 105 527 1.3 59Co 50 103 51.7 0.7 60Ni 50 105 52.7 0.8 63Cu 500 105 524 1.2 66Zn 500 104 519 0.5 75As 50 101 50.7 1.4 82Se 50 105 52.6 1.3 95Mo 50 101 50.5 1.1 107Ag 50 104 52.1 1.3 111Cd 50 105 52.7 0.9 123Sb 50 101 50.4 1.9 135Ba 500 102 511 1.1 201Hg 2.5 98 2.5 2 205TI 50 103 51.5 1.3 208Pb 50 102 50.8 0.5 232Th 50 96 48.1 0.9 238U 50 96 48.1 0.9 mg/L % mg/L % 23Na 50 105 52.6 0.9 Mg 5 104 5.19 1.3 39K 5 105 5.25 1.0 43Ca 50 100 49.9 0.4 The Laboratory Reagent Blank (LRB) was run after everyQCS to check the laboratory reagents and washout forany contamination. The FAST system was set up to ensureexcellent washout between samples such that all LRBswere all>20x below the MCL for every element. The Laboratory Fortified Blank (LFB) checks the recoveryof the analytes after spiking the LRB once per batch ofsamples (Figure 5). Figure 5. Recoveries for laboratory fortified blank (200.8Methodspecified 85%-115% limits shown) The Laboratory Fortified Matrix (LFM) checks therecovery of analytes in a matrix every 1 in 10 samples(Figure 6). Figure 6. Laboratory fortified matrix minor & trace elementrecoveries (Method specified 70-130% limits shown) Stability Figure 7 shows the signal response for the seven internalstandards during a 14 hour analytical run of (>900)natural water samples against EPA Method 200.8, withoutre-calibration, as displayed in the Qtegra software. Theinternal standard recoveries are well within the 60-125%range defined in Method 200.8. Figure 7. Internal standard recovery (%) over 14 hours Conclusions The Thermo Scientific iCAP Qa equipped with an ESIAutosampler and FAST sample introduction system wasvalidated for use with US EPA Method 200.8. Afteroptimising the FAST uptake and washout parameters, thehigh sensitivity and stability of the iCAP Qa, with itsautomatic resolution switching and accurate detectorcross calibration, achieved the goal of 60 analyses perhour working against US EPA Method 200.8. ISO 9001QMI-SAIGI thermoscientific.com C 2012 Thermo Fisher Scientific Inc. All rights reserved. All trademarks are the property of Thermo Fisher Scientific Inc. and its subsidiaries. Specifications,terms and pricing are subject to change. Not all products are available in all countries. Please consult your local sales representative for details. Africa-Other+27 11 570 1840 Australia +61 2 8844 9500 Austria +43133350340 Belgium +32 53 73 4241 Canada +1 800 530 8447 China +86 10 8419 3588 Denmark+45 70 23 6260 Europe-Other+431 333 50340 AN43132_E05/12C Finland/Norway/Sweden+468556468 00France+33 1 60 92 48 00Germany+49 6103 408 1014India+91 22 6742 9434Italy+39 02 950 591Japan +81 45 453 9100Latin America +1 608 276 5659 SCIENTIF I C Figure . iCAP Qa total analysis times of< for US EPA Method The United States Environmental Protection Agency (US EPA) first developed and published Method 200.8: “Determination of Trace Elements in Waters and Wastes by Inductively Coupled Plasma Mass Spectrometry (ICP-MS)” in 1994. This method is now widely used for the determination of twenty-two elements in ground, surface and drinking waters in both the United States and elsewhere. Large numbers of samples are often determined with this method as part of local and national regulatory compliance monitoring as well as by private contract laboratories. The Thermo Scientific iCAP Qa equipped with an ESI Autosampler and FAST sample introduction system was validated for use with US EPA Method 200.8. After optimising the FAST uptake and washout parameters, the high sensitivity and stability of the iCAP Qa, with its automatic resolution switching and accurate detector cross calibration, achieved the goal of 60 analyses per hour working against US EPA Method 200.8.
确定
还剩6页未读,是否继续阅读?

产品配置单

赛默飞色谱与质谱为您提供《Drinking Water中Drinking Water Compliance检测方案(等离子体质谱)》,该方案主要用于饮用水中综合检测,参考标准--,《Drinking Water中Drinking Water Compliance检测方案(等离子体质谱)》用到的仪器有赛默飞iCAP TQ电感耦合等离子体质谱仪
推荐专场
相关方案
更多
该厂商其他方案
更多