


一种快速、简便的微流控毛细管电泳—质谱联用方法,英文简称ZipChip CE-MS,用于直接检测从细胞培养上清液中获得的单克隆抗体蛋白的品质特性。同时,利用单一的微流控芯片ZipChip并采用相同的方法监测蛋白表达和产品品质,消耗的样品体积仅为10-15微升的细胞培养上清液,每个样品的分析时间在3分钟内即可完成。
方案详情

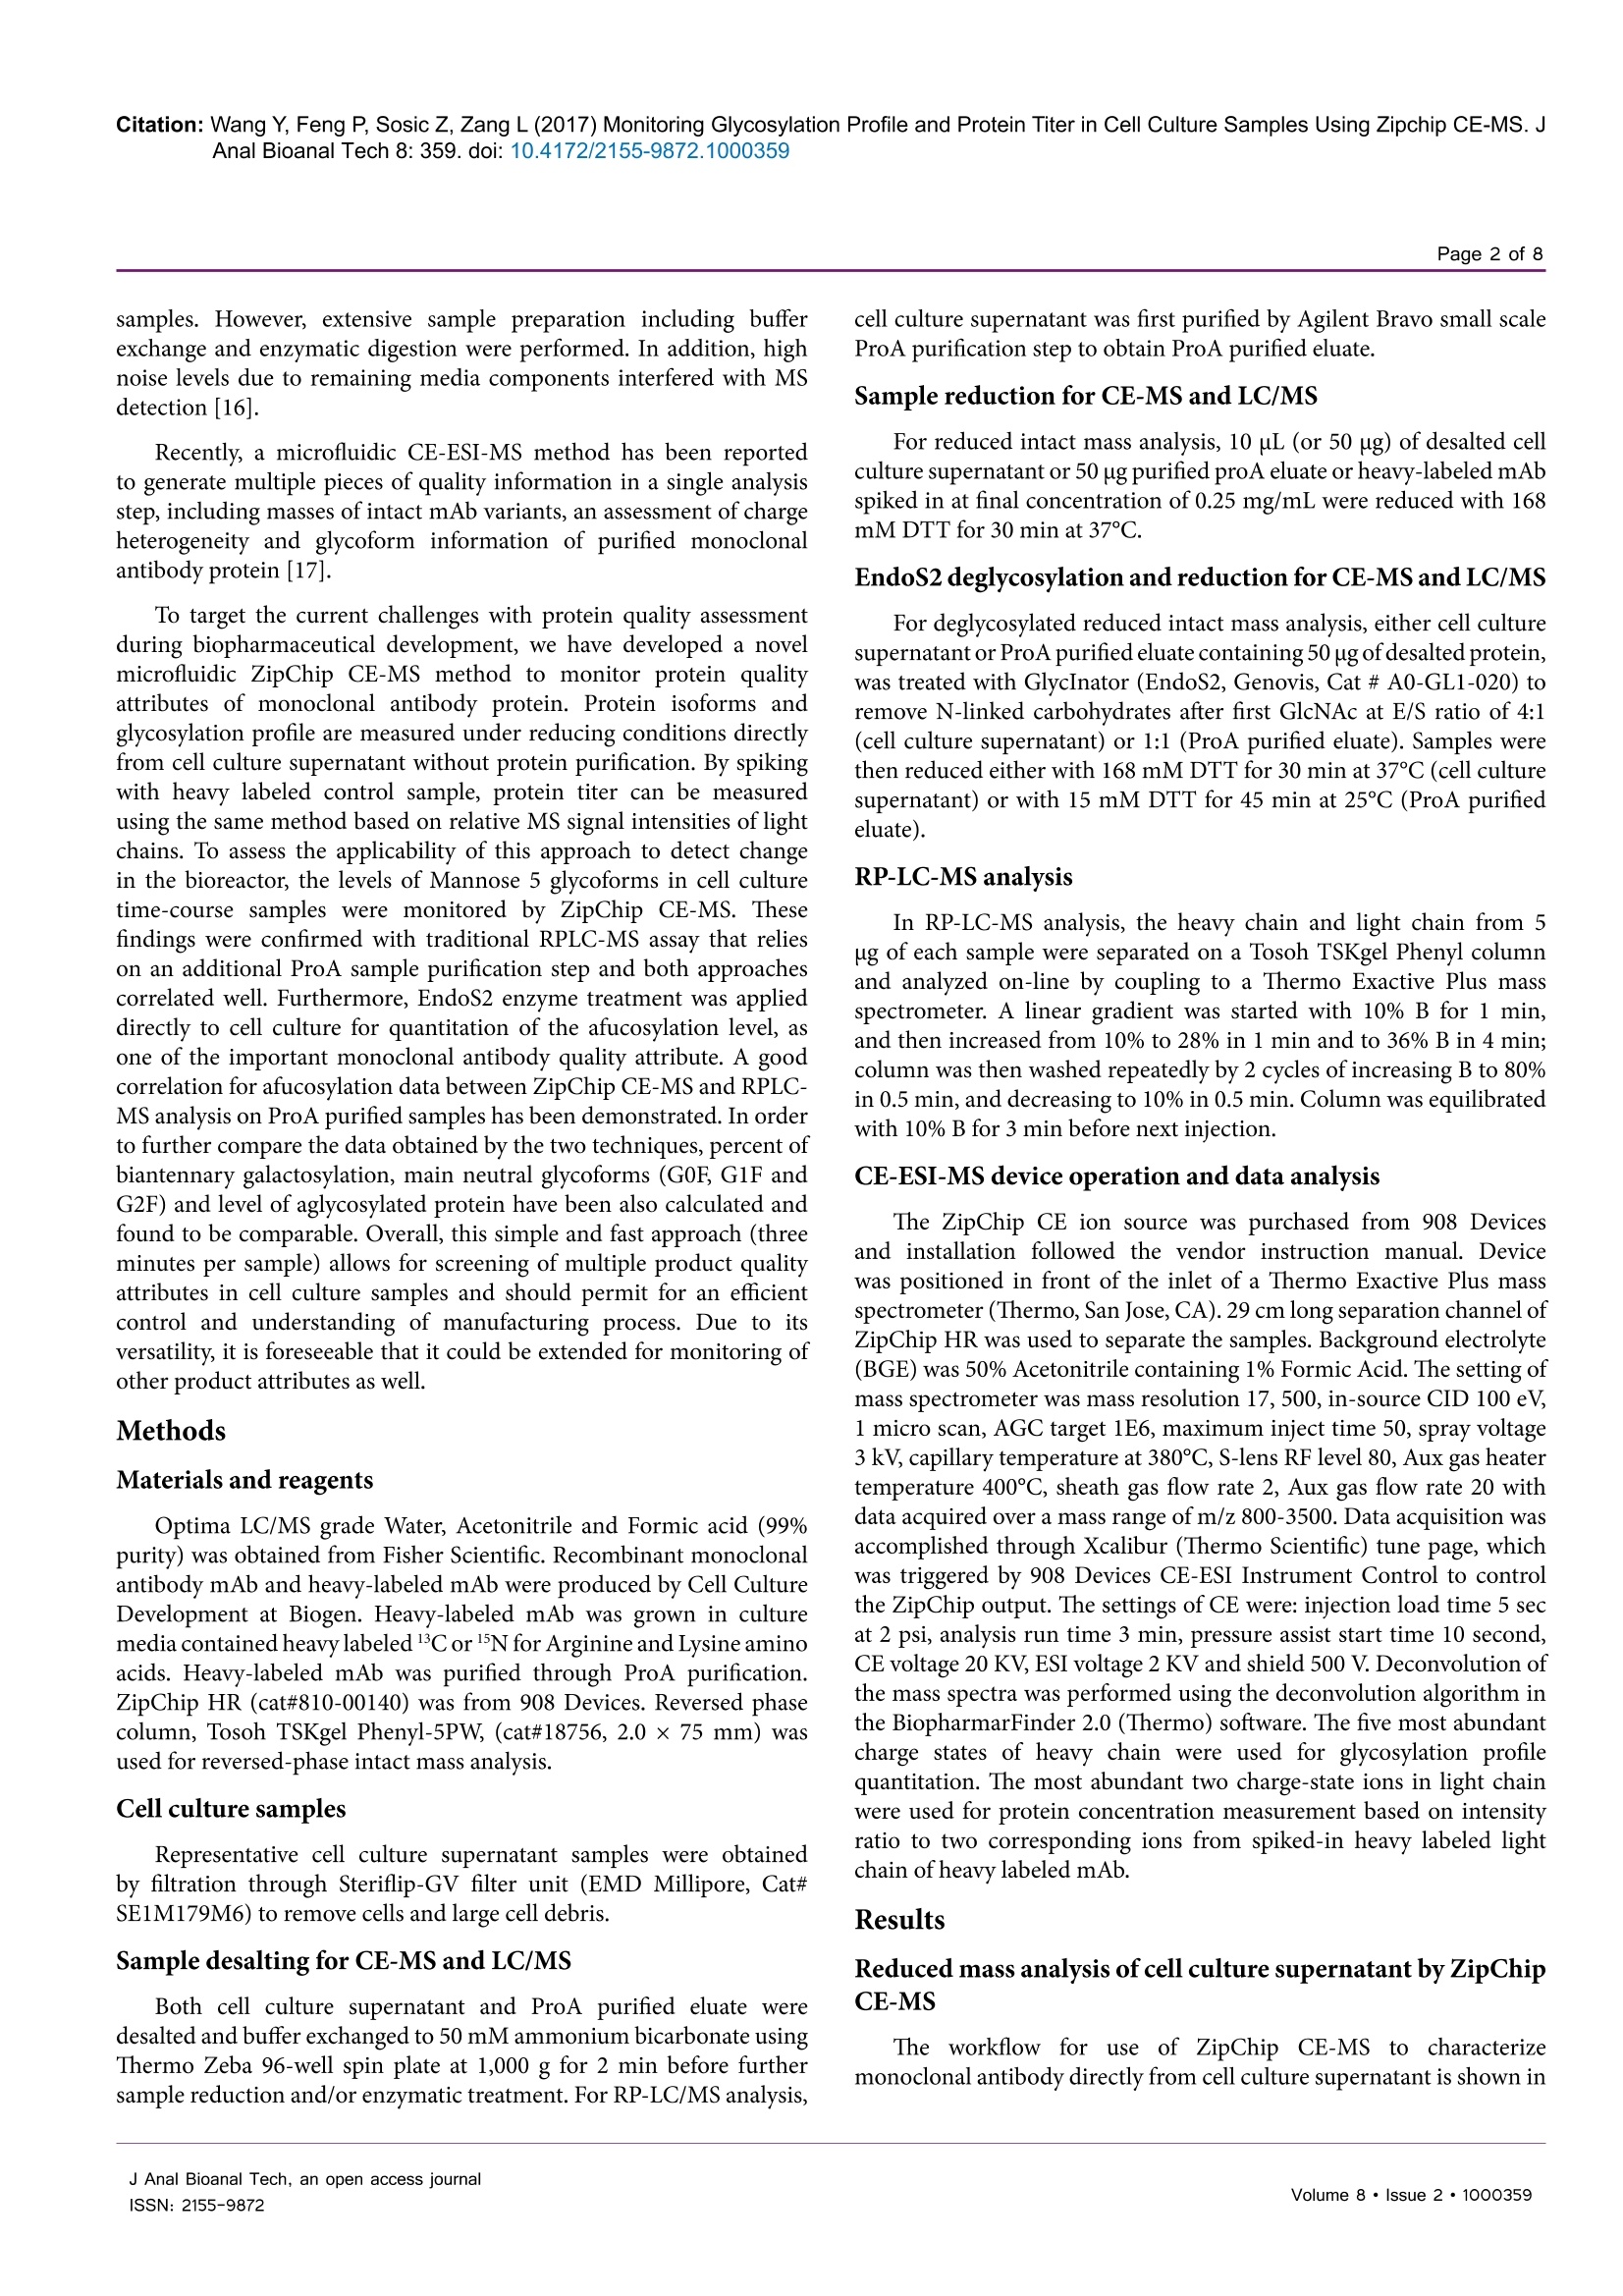
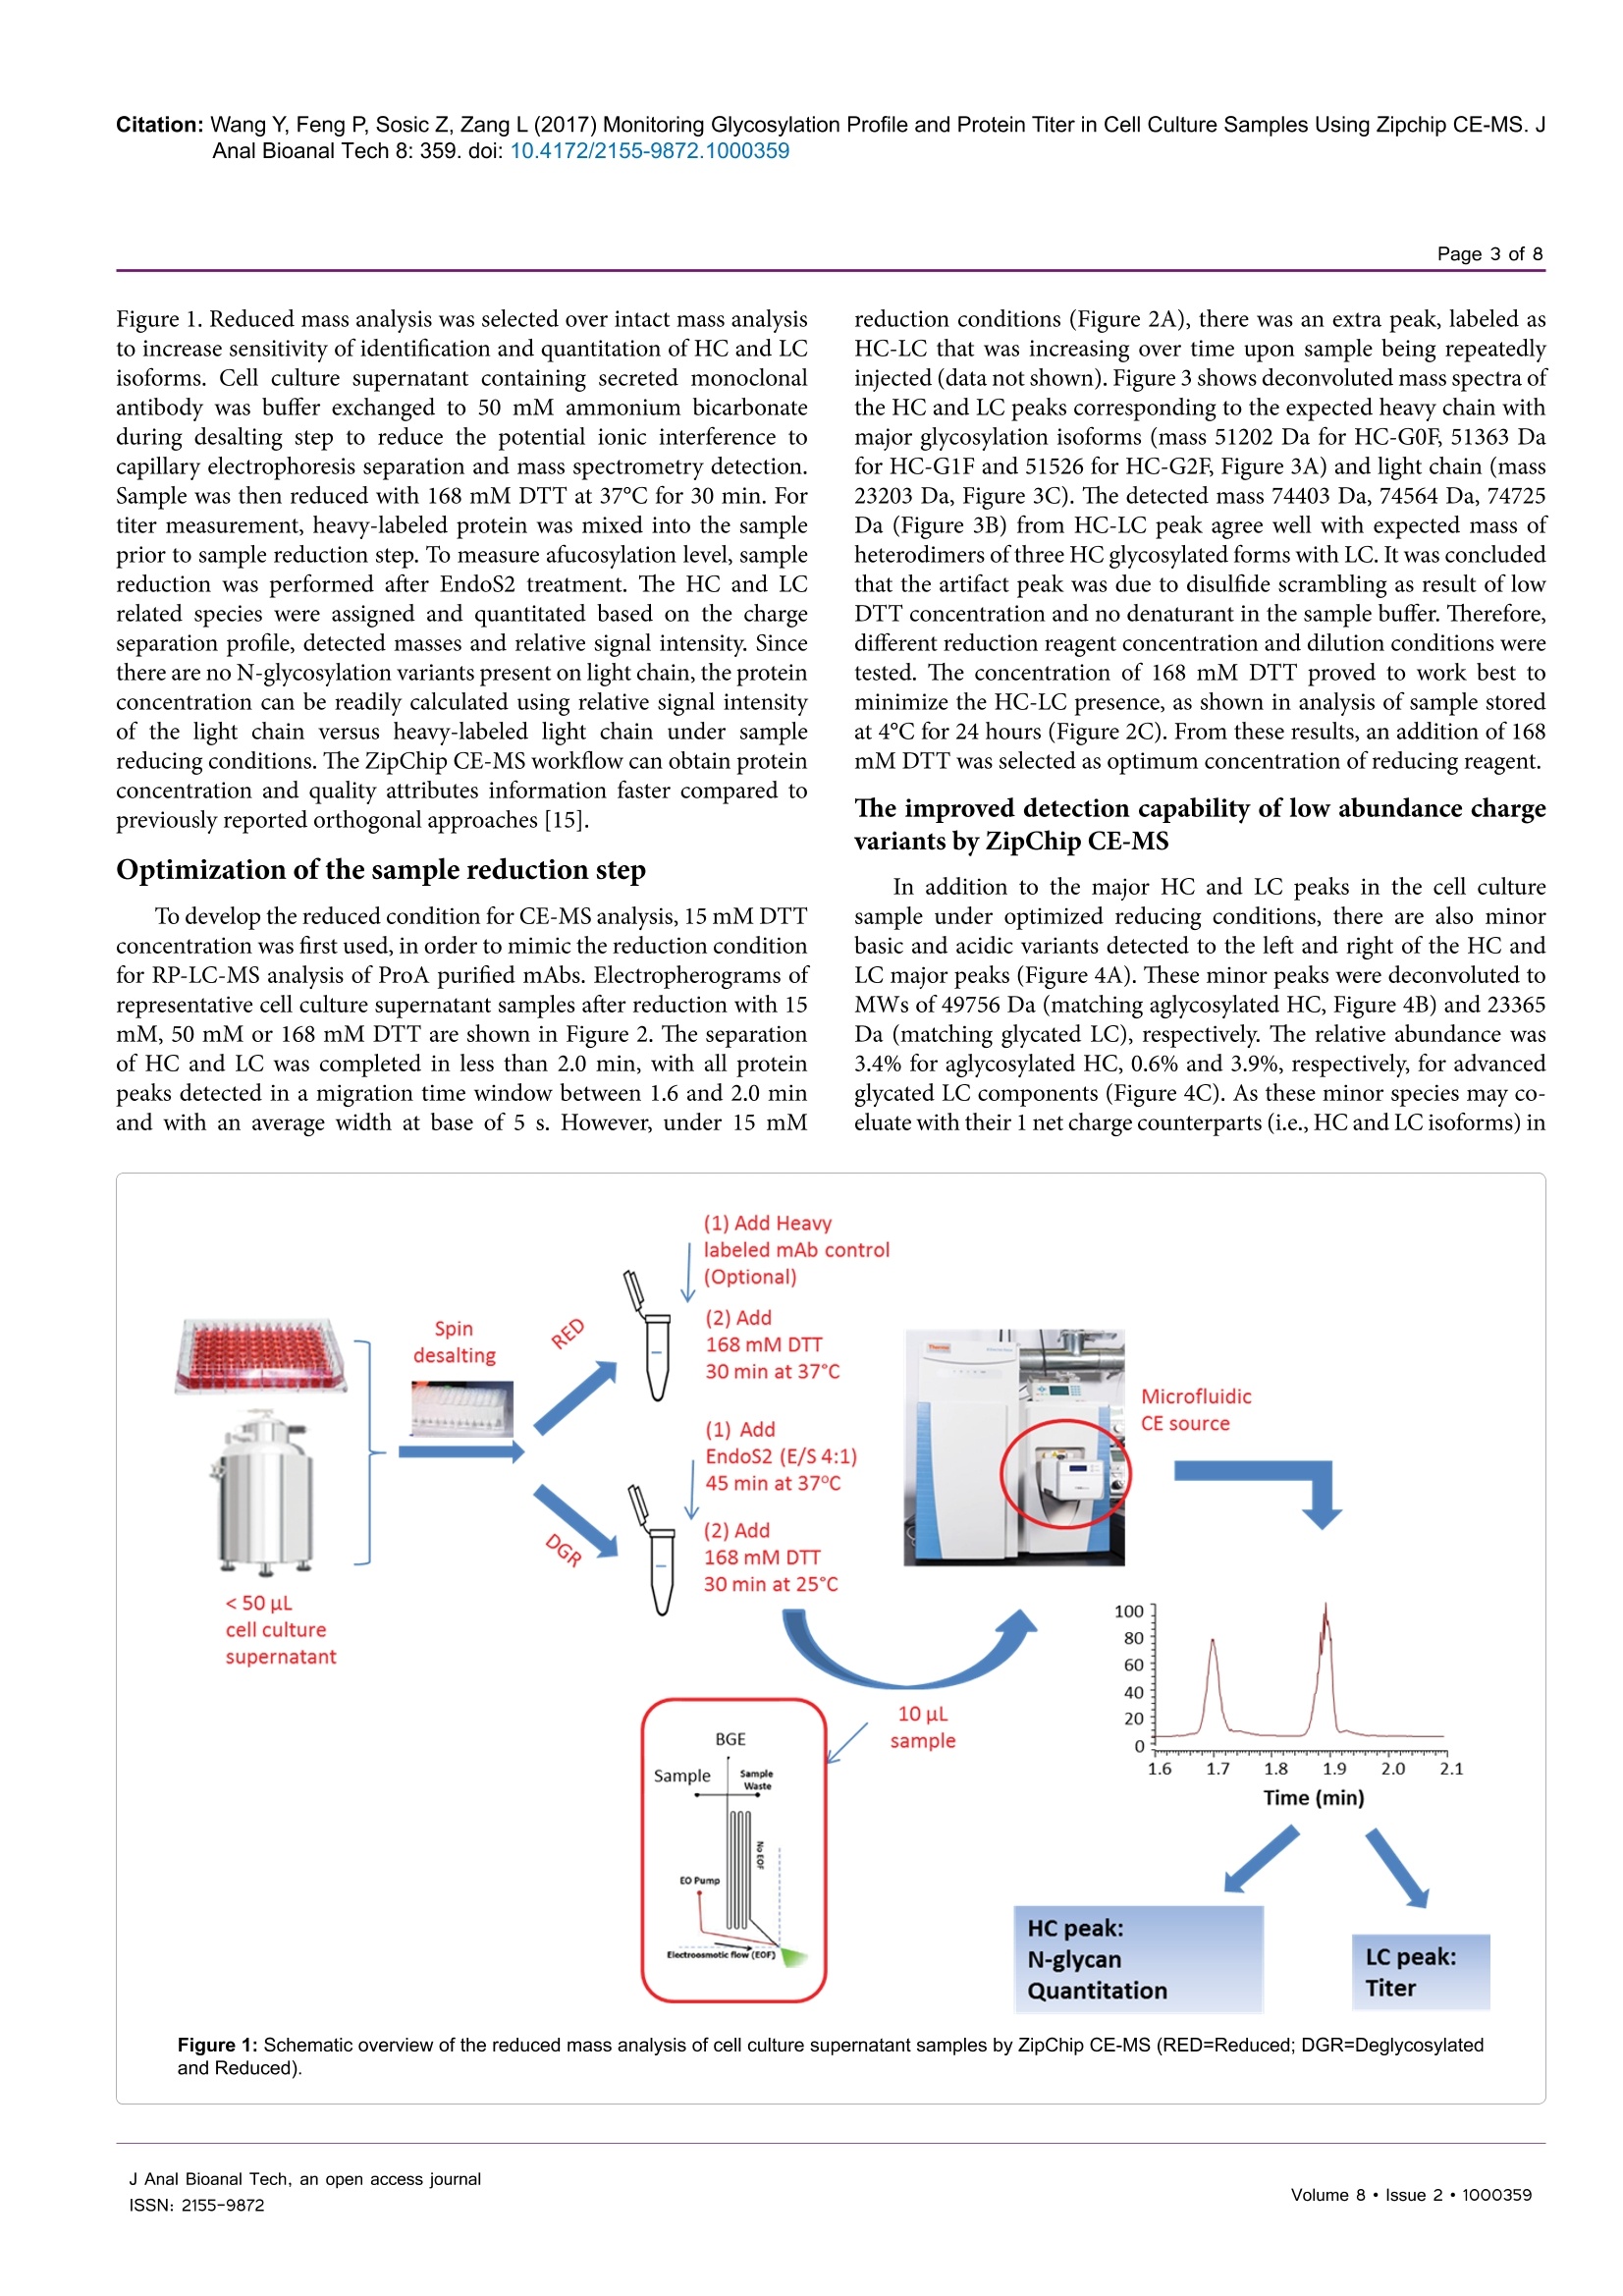
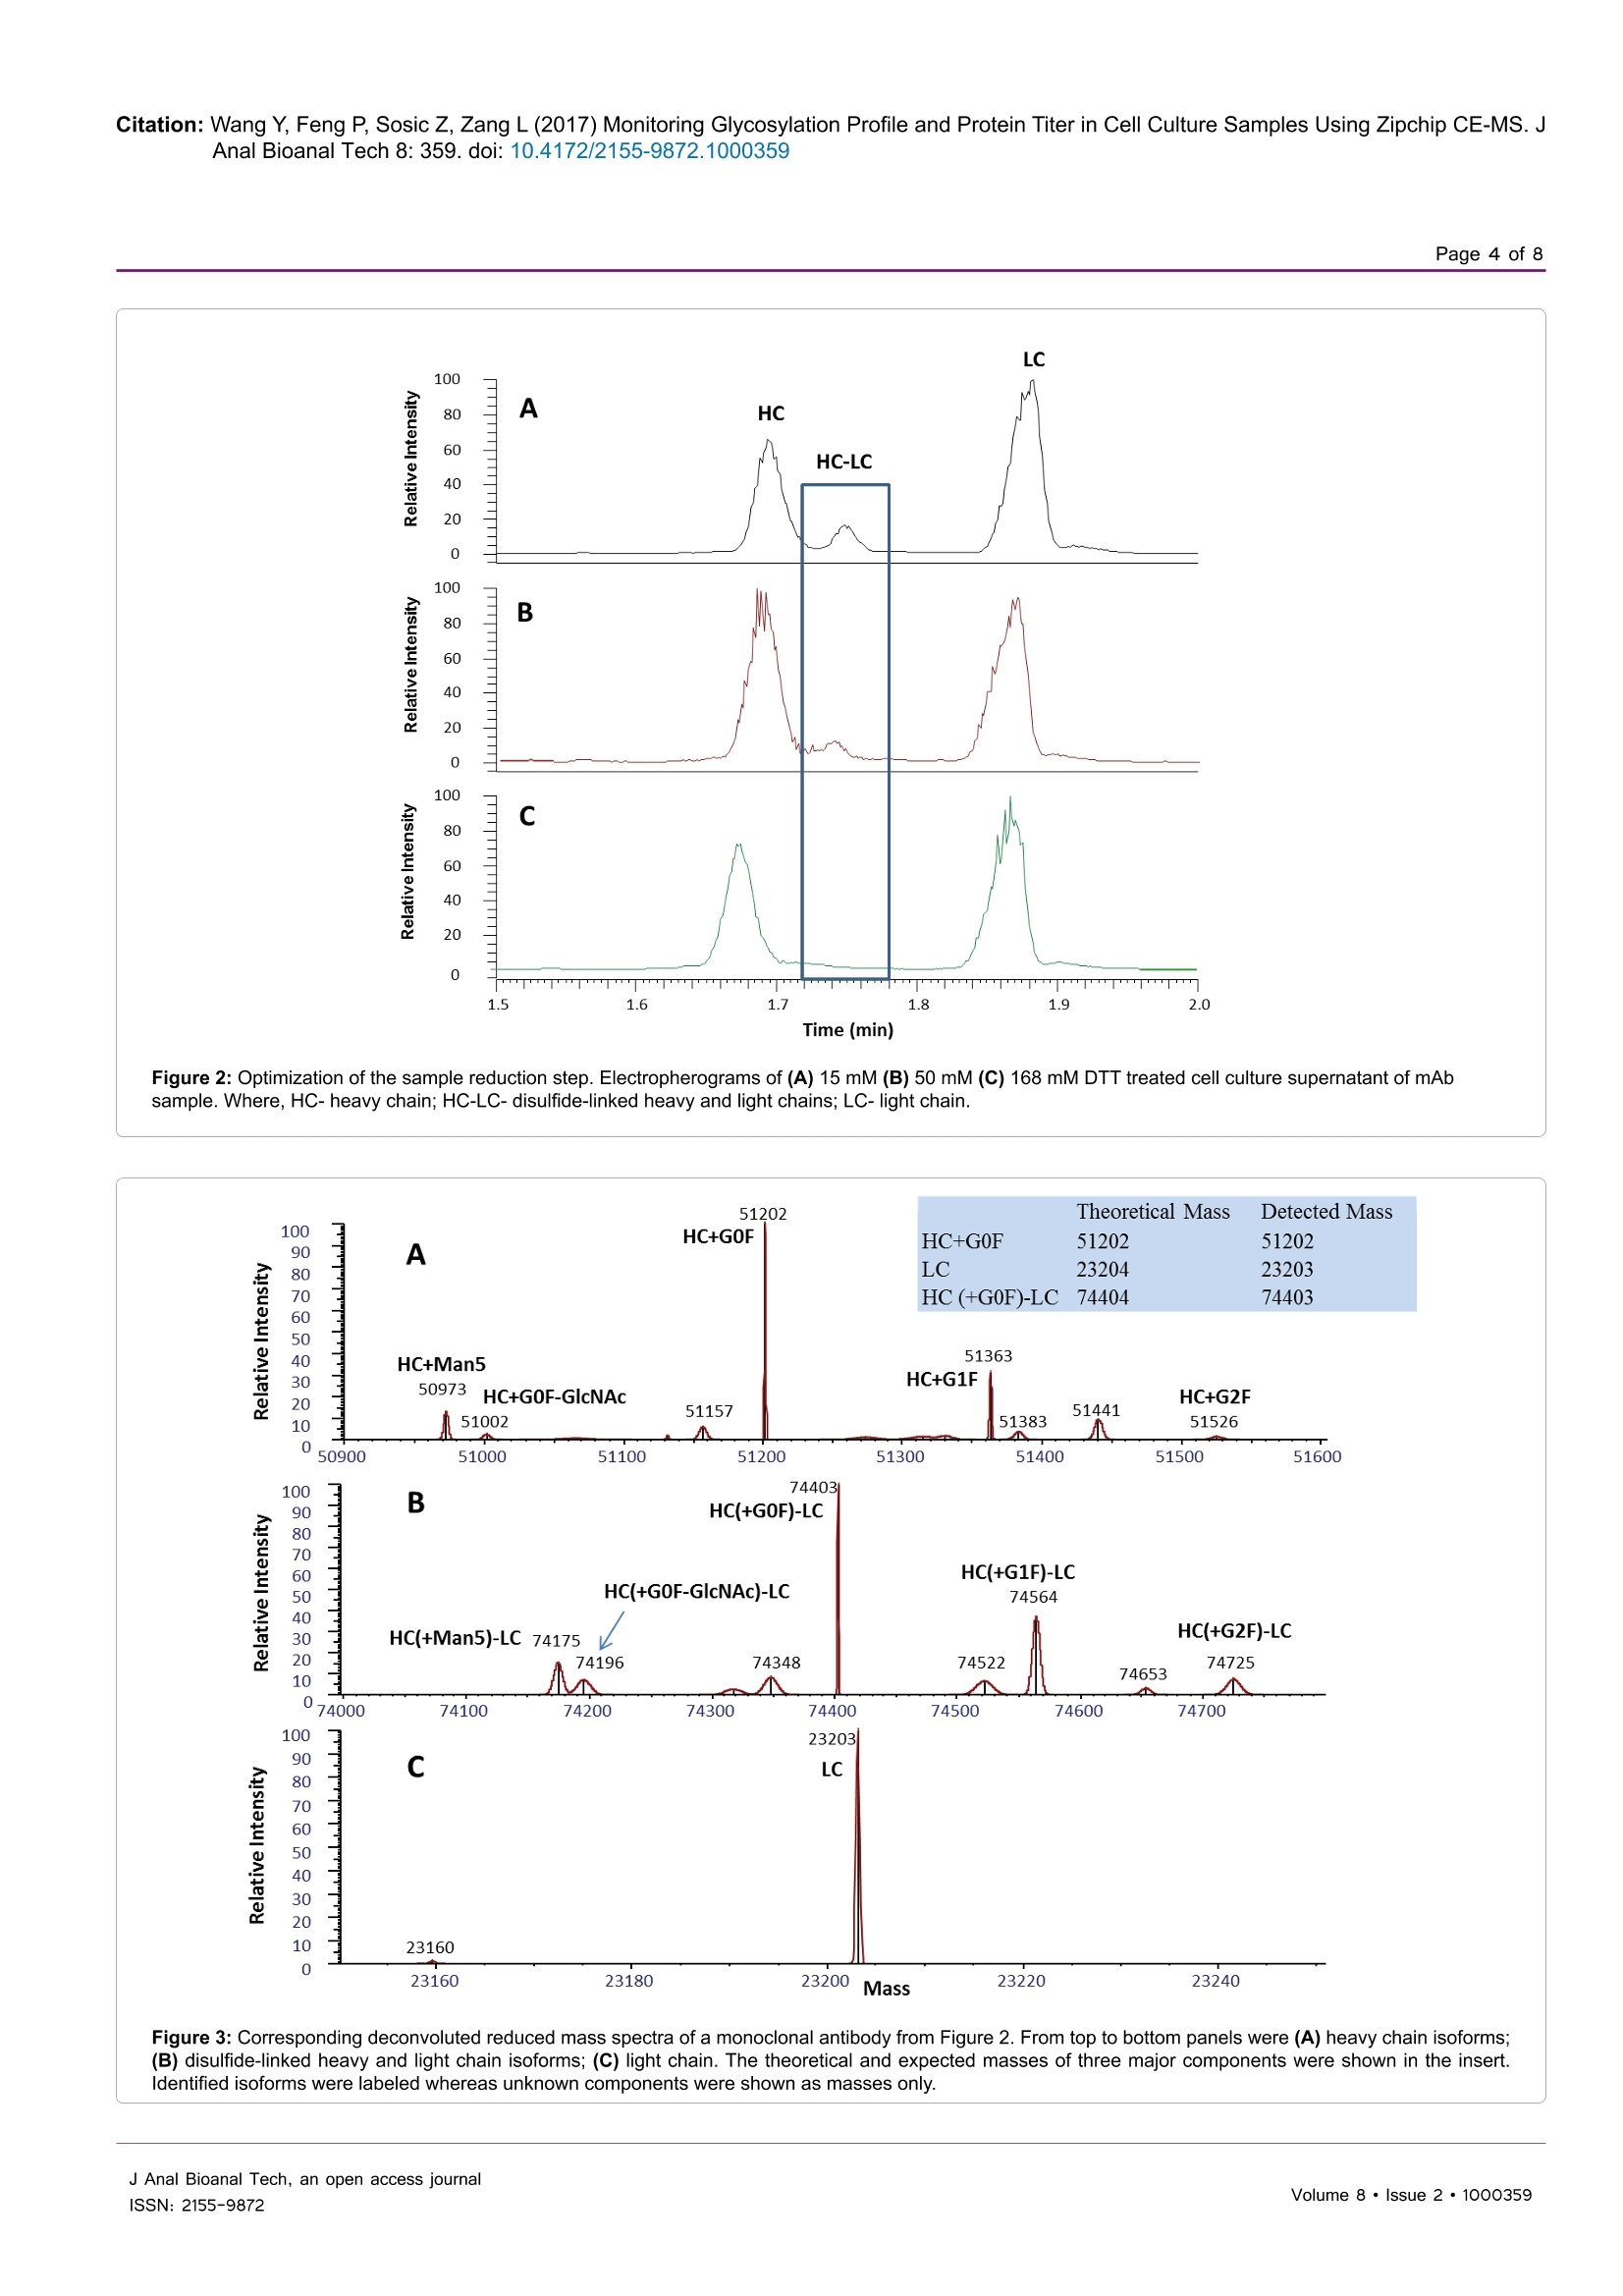
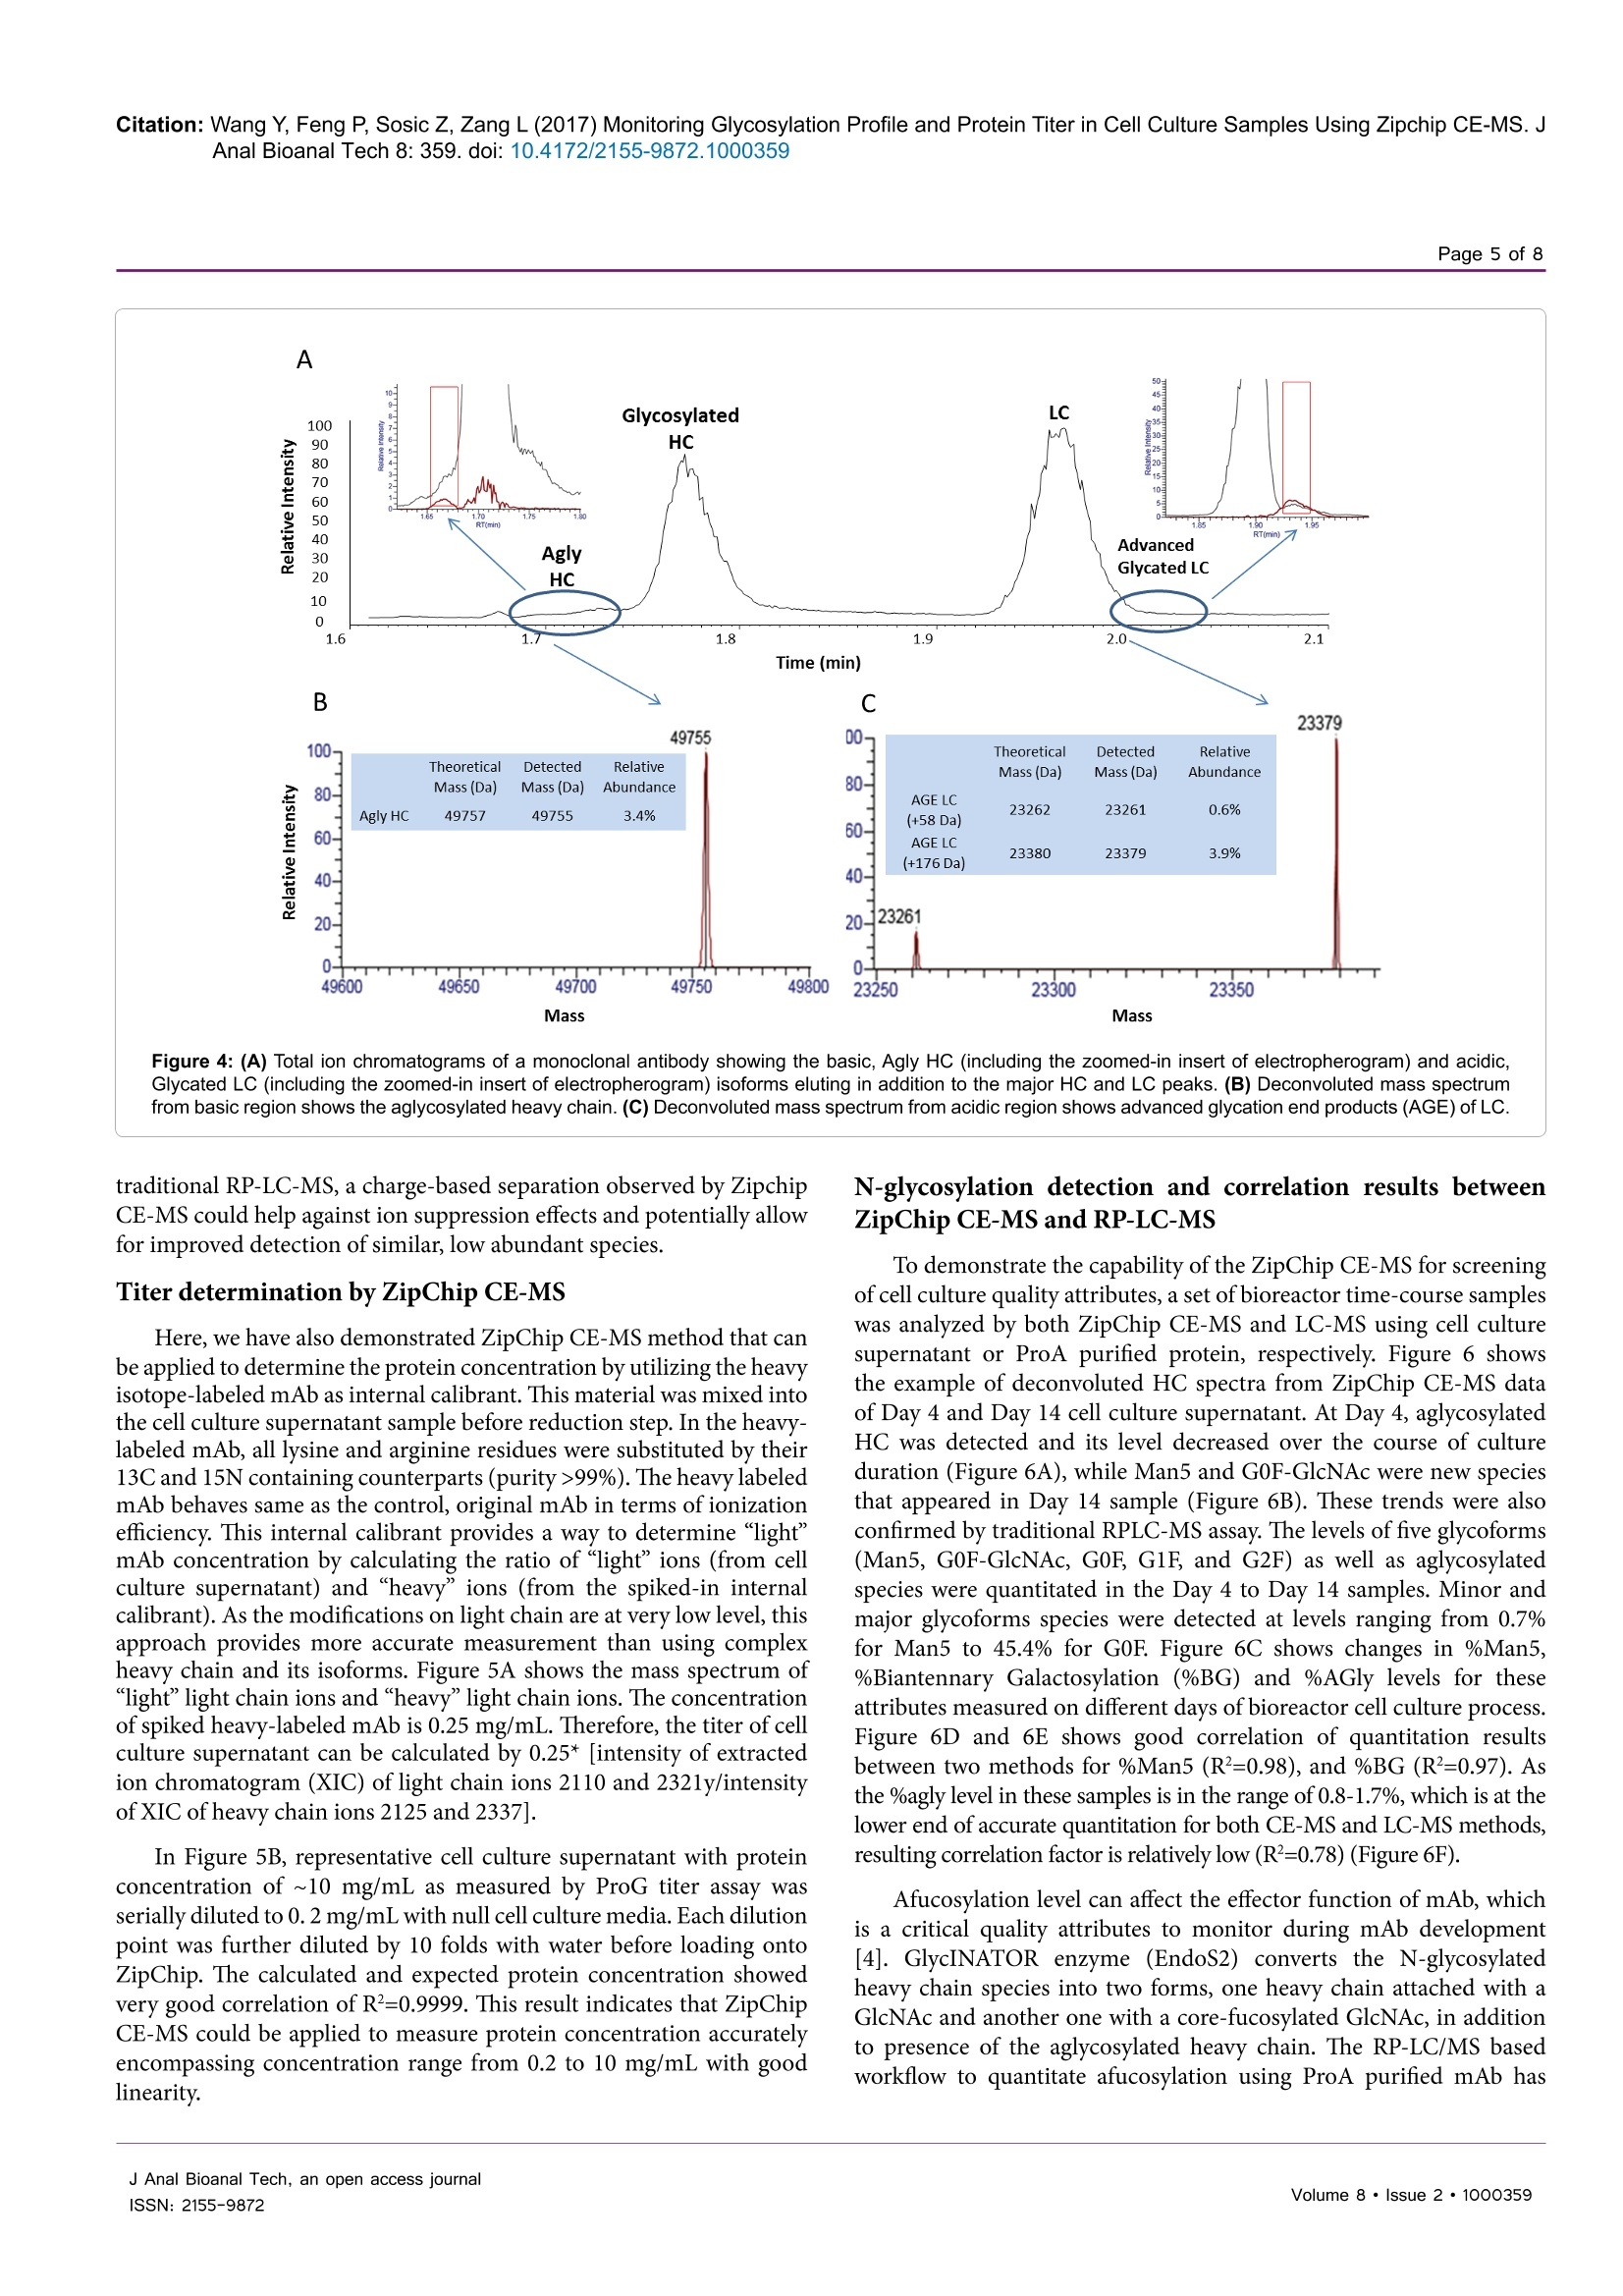
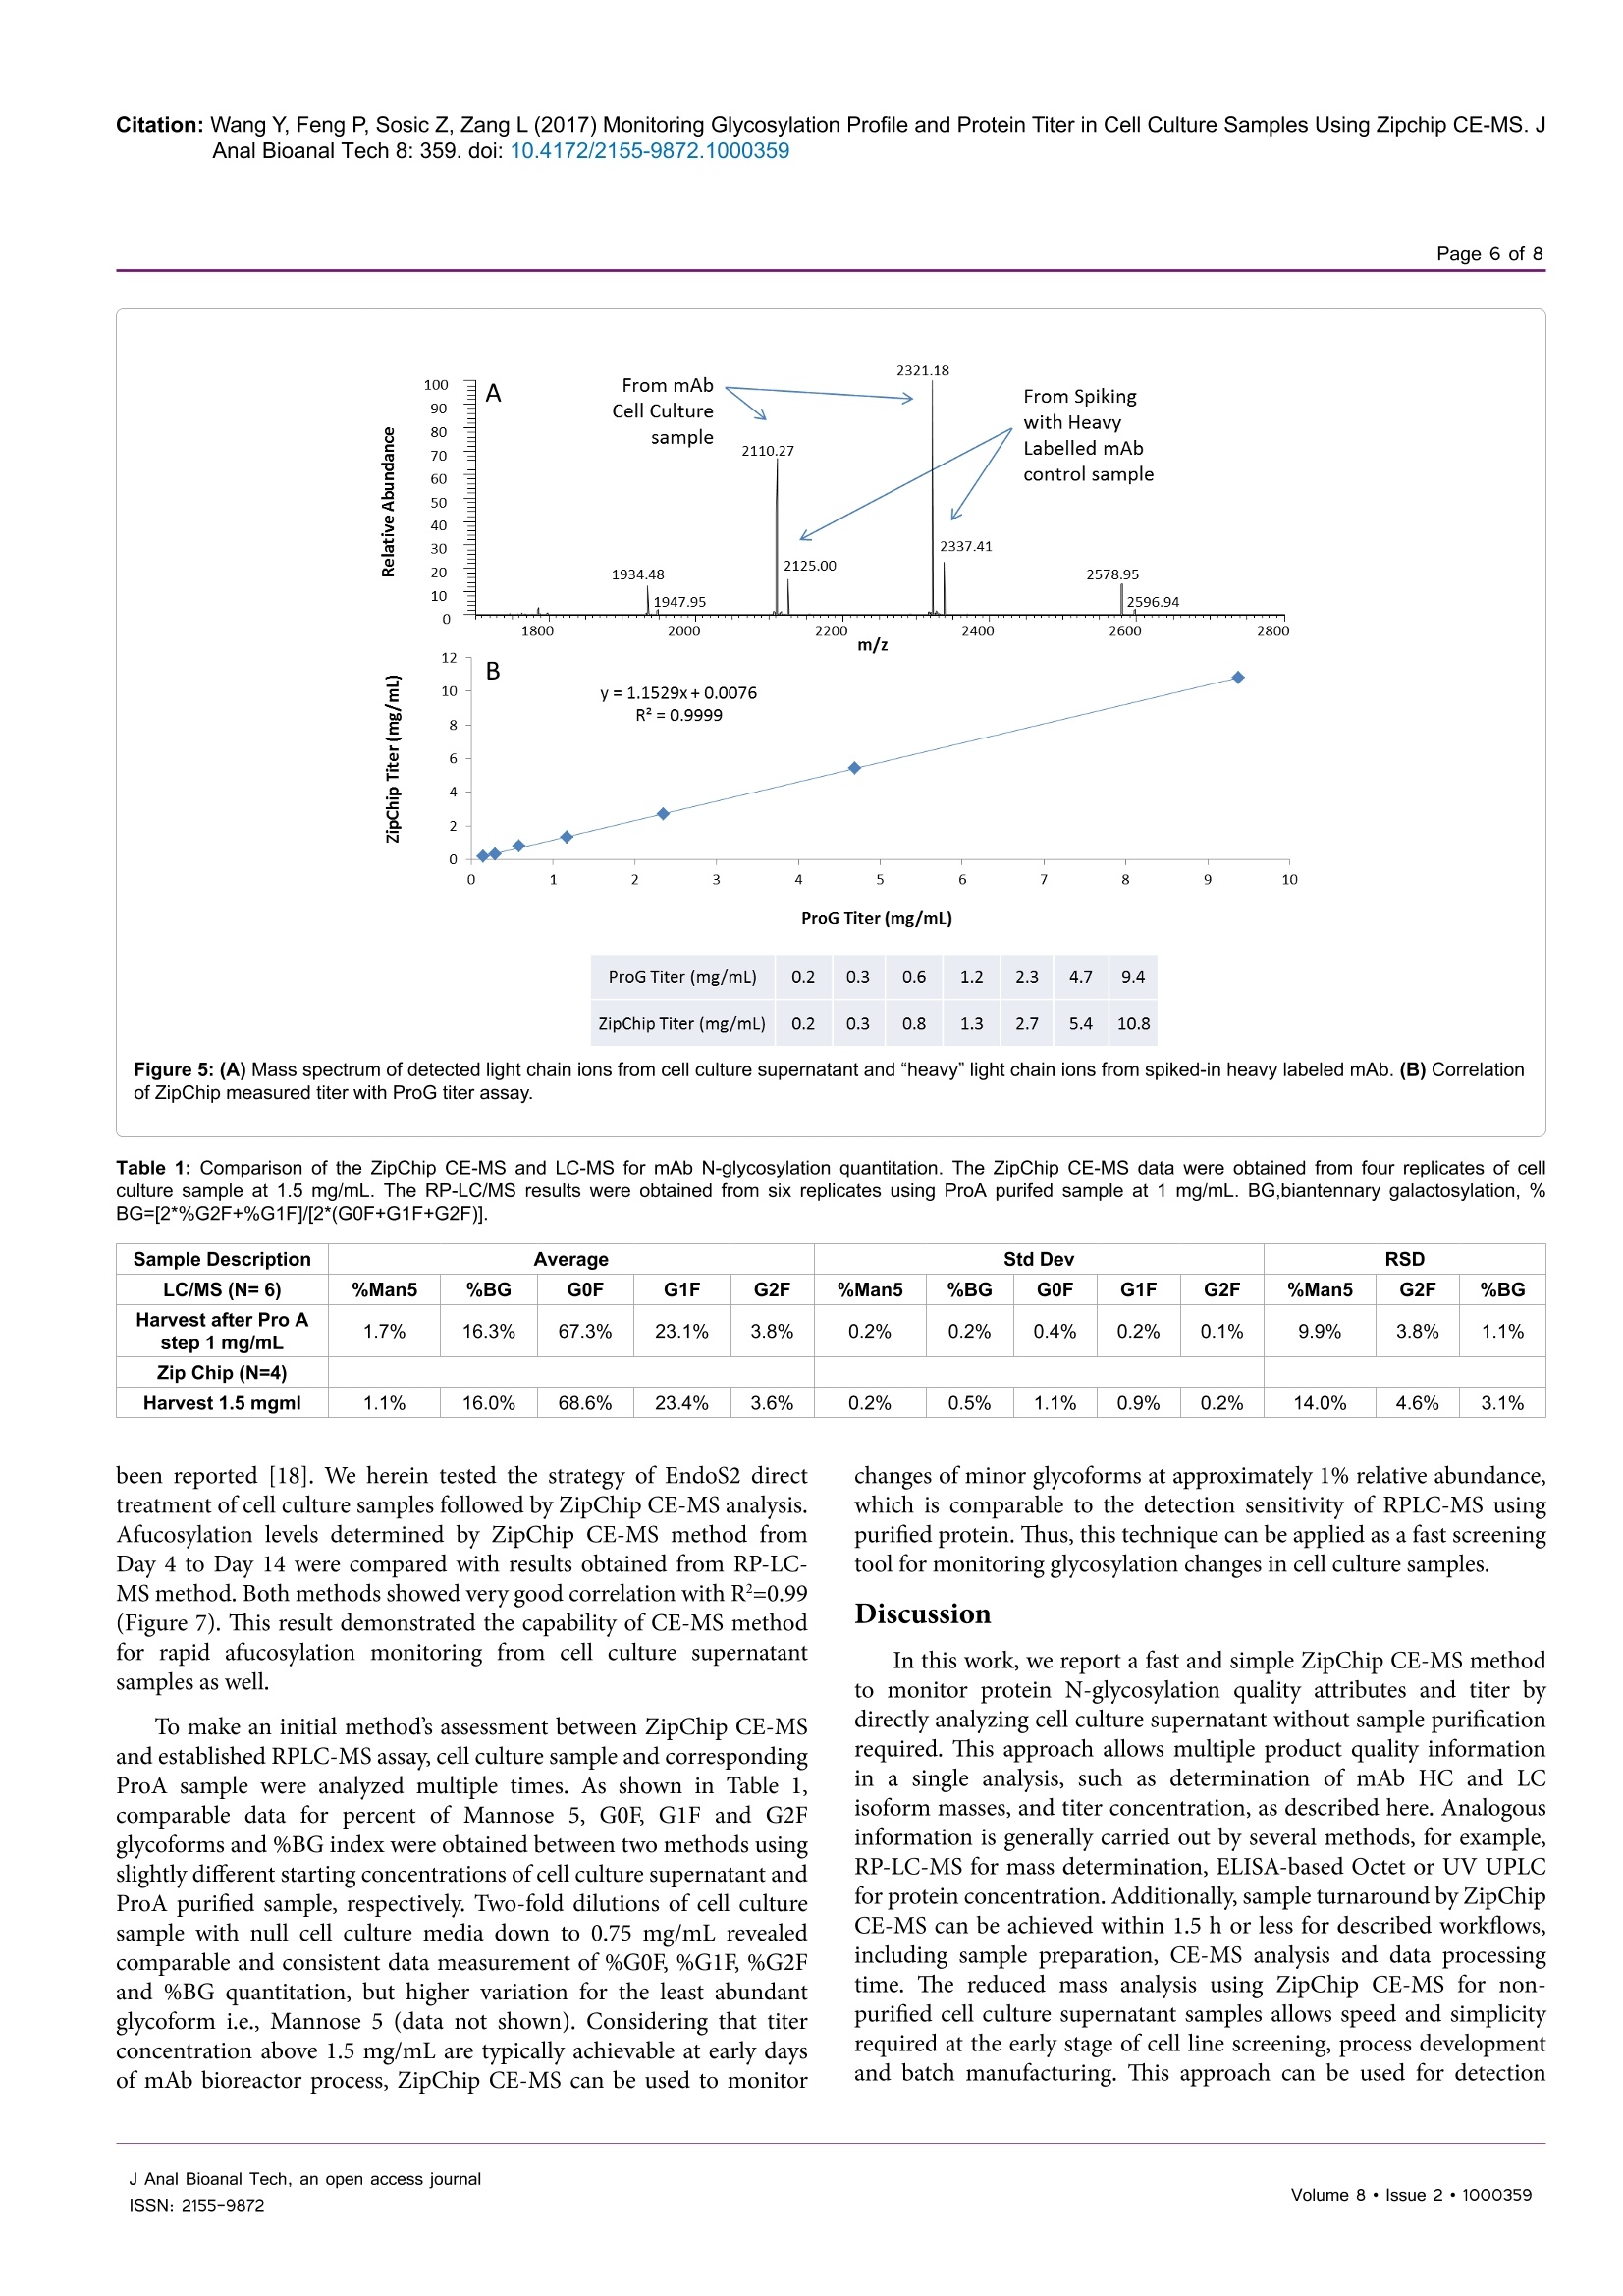
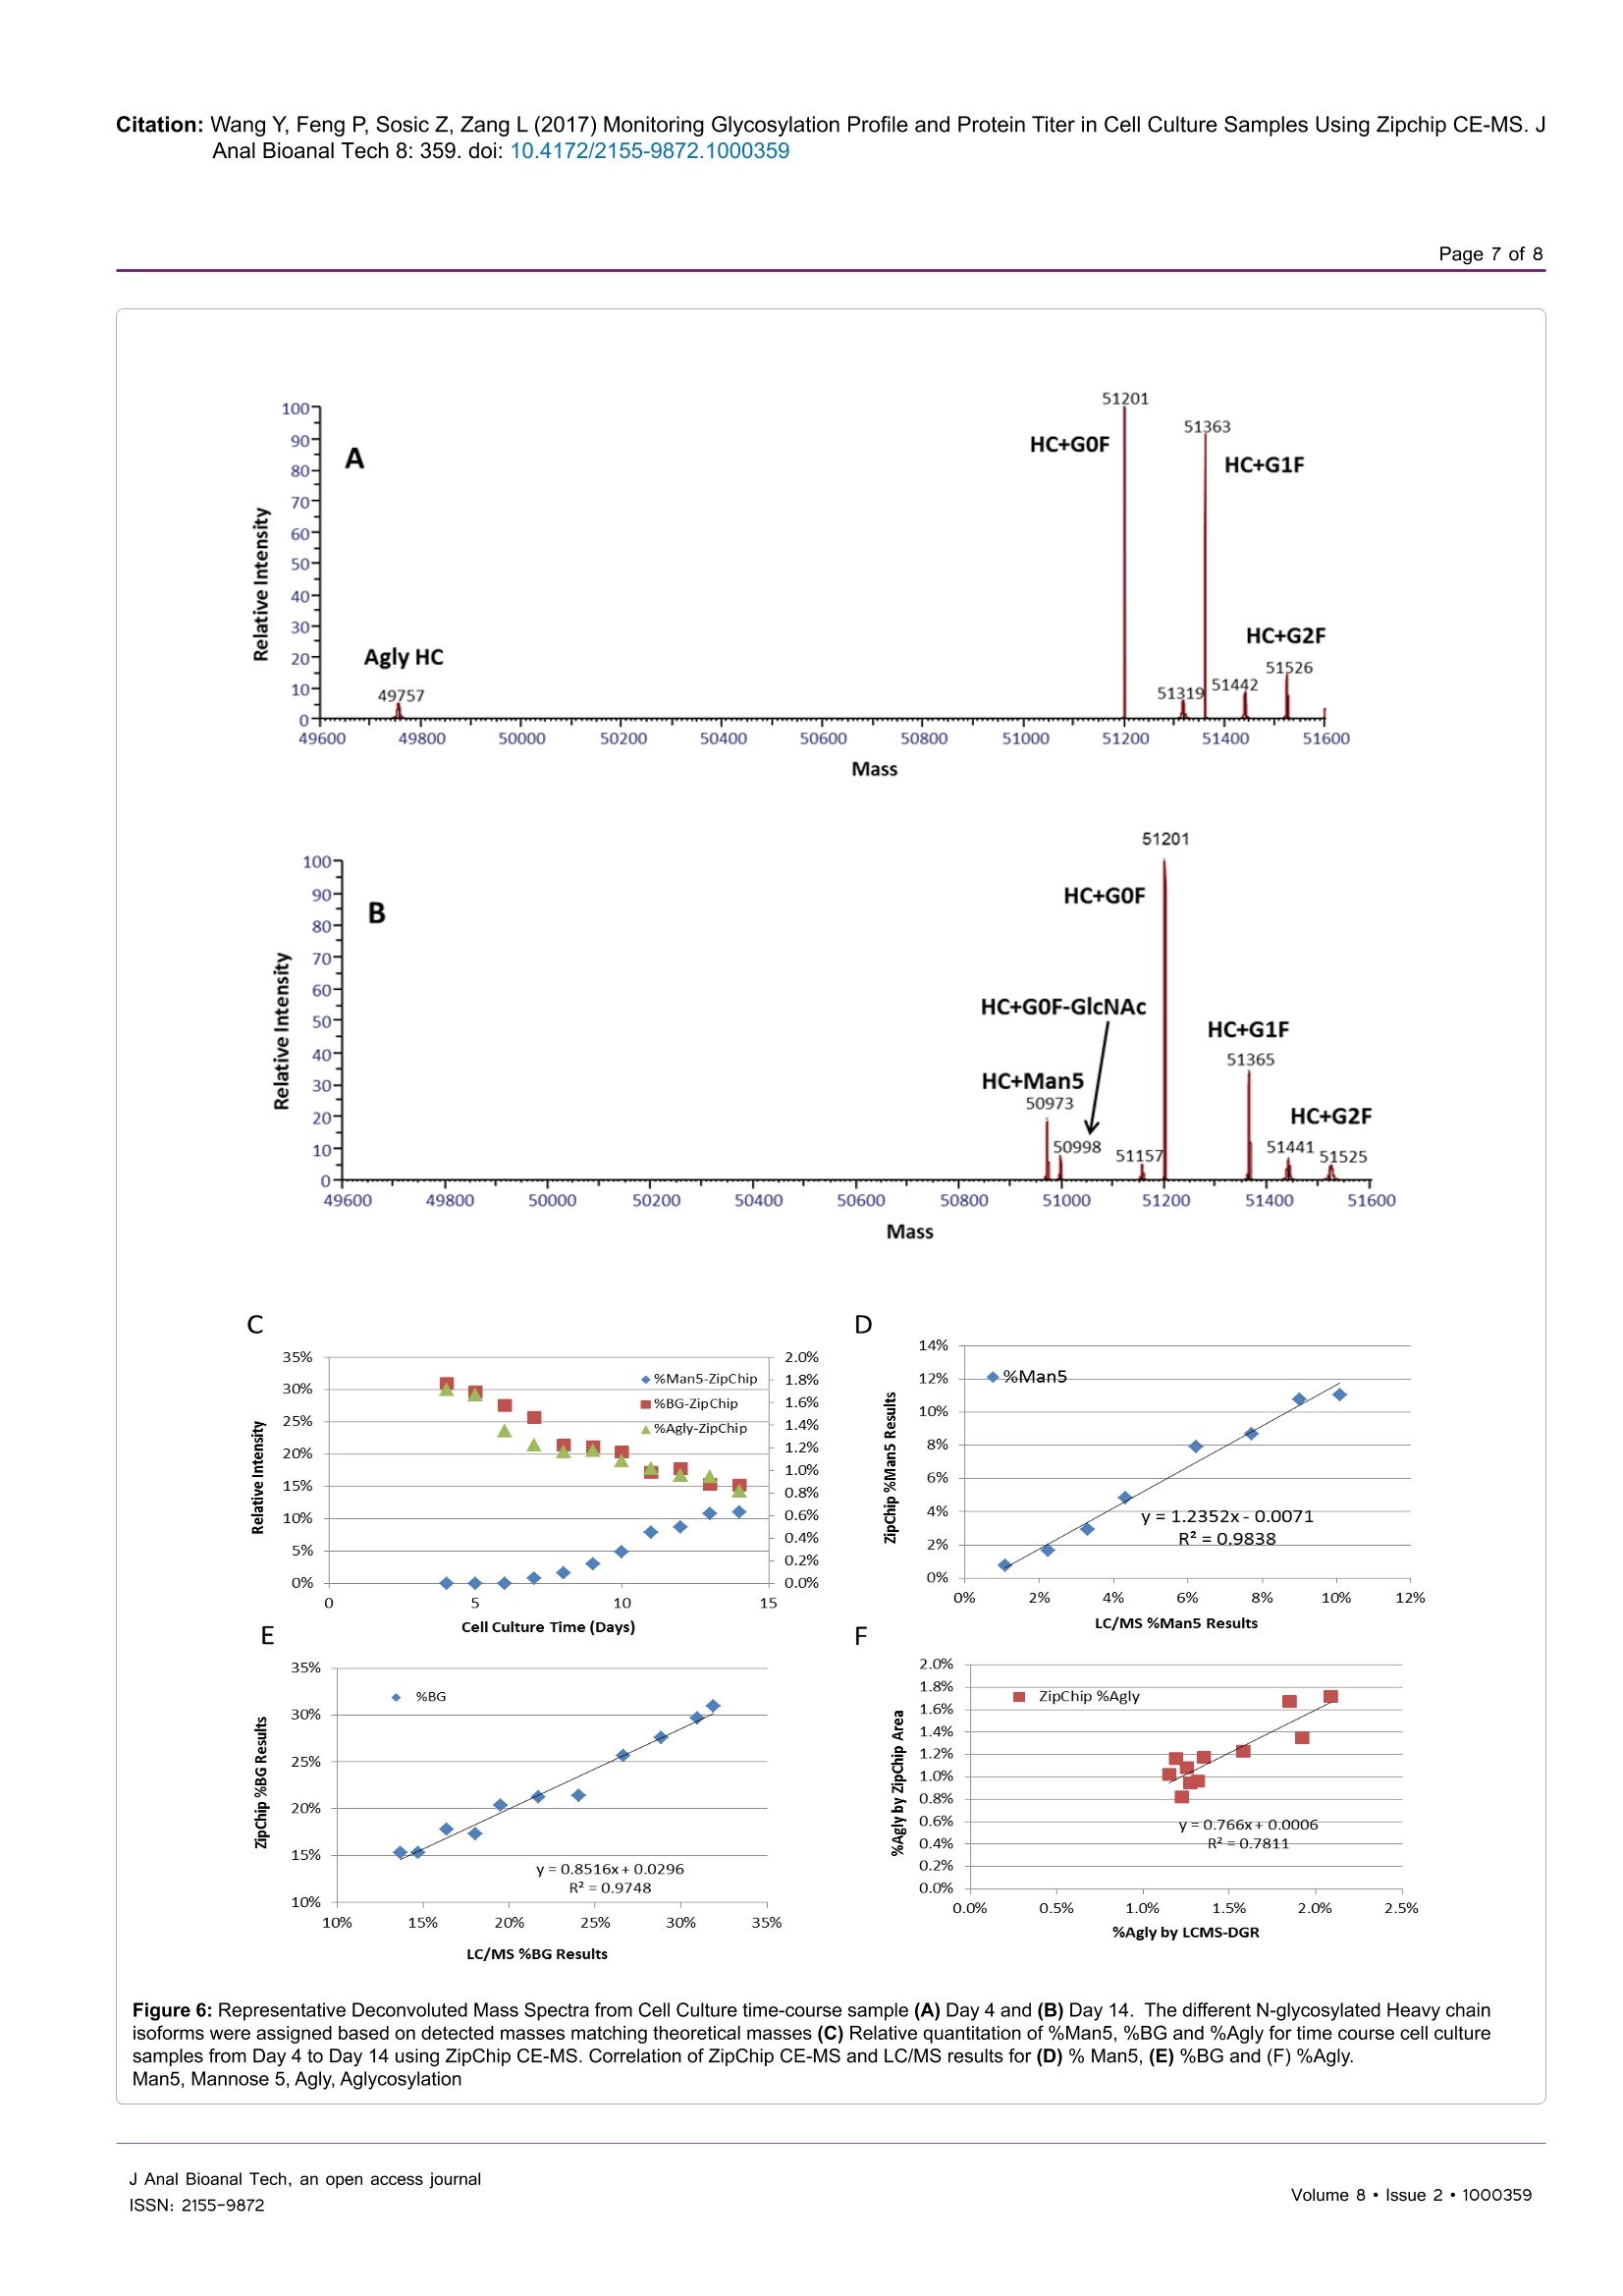
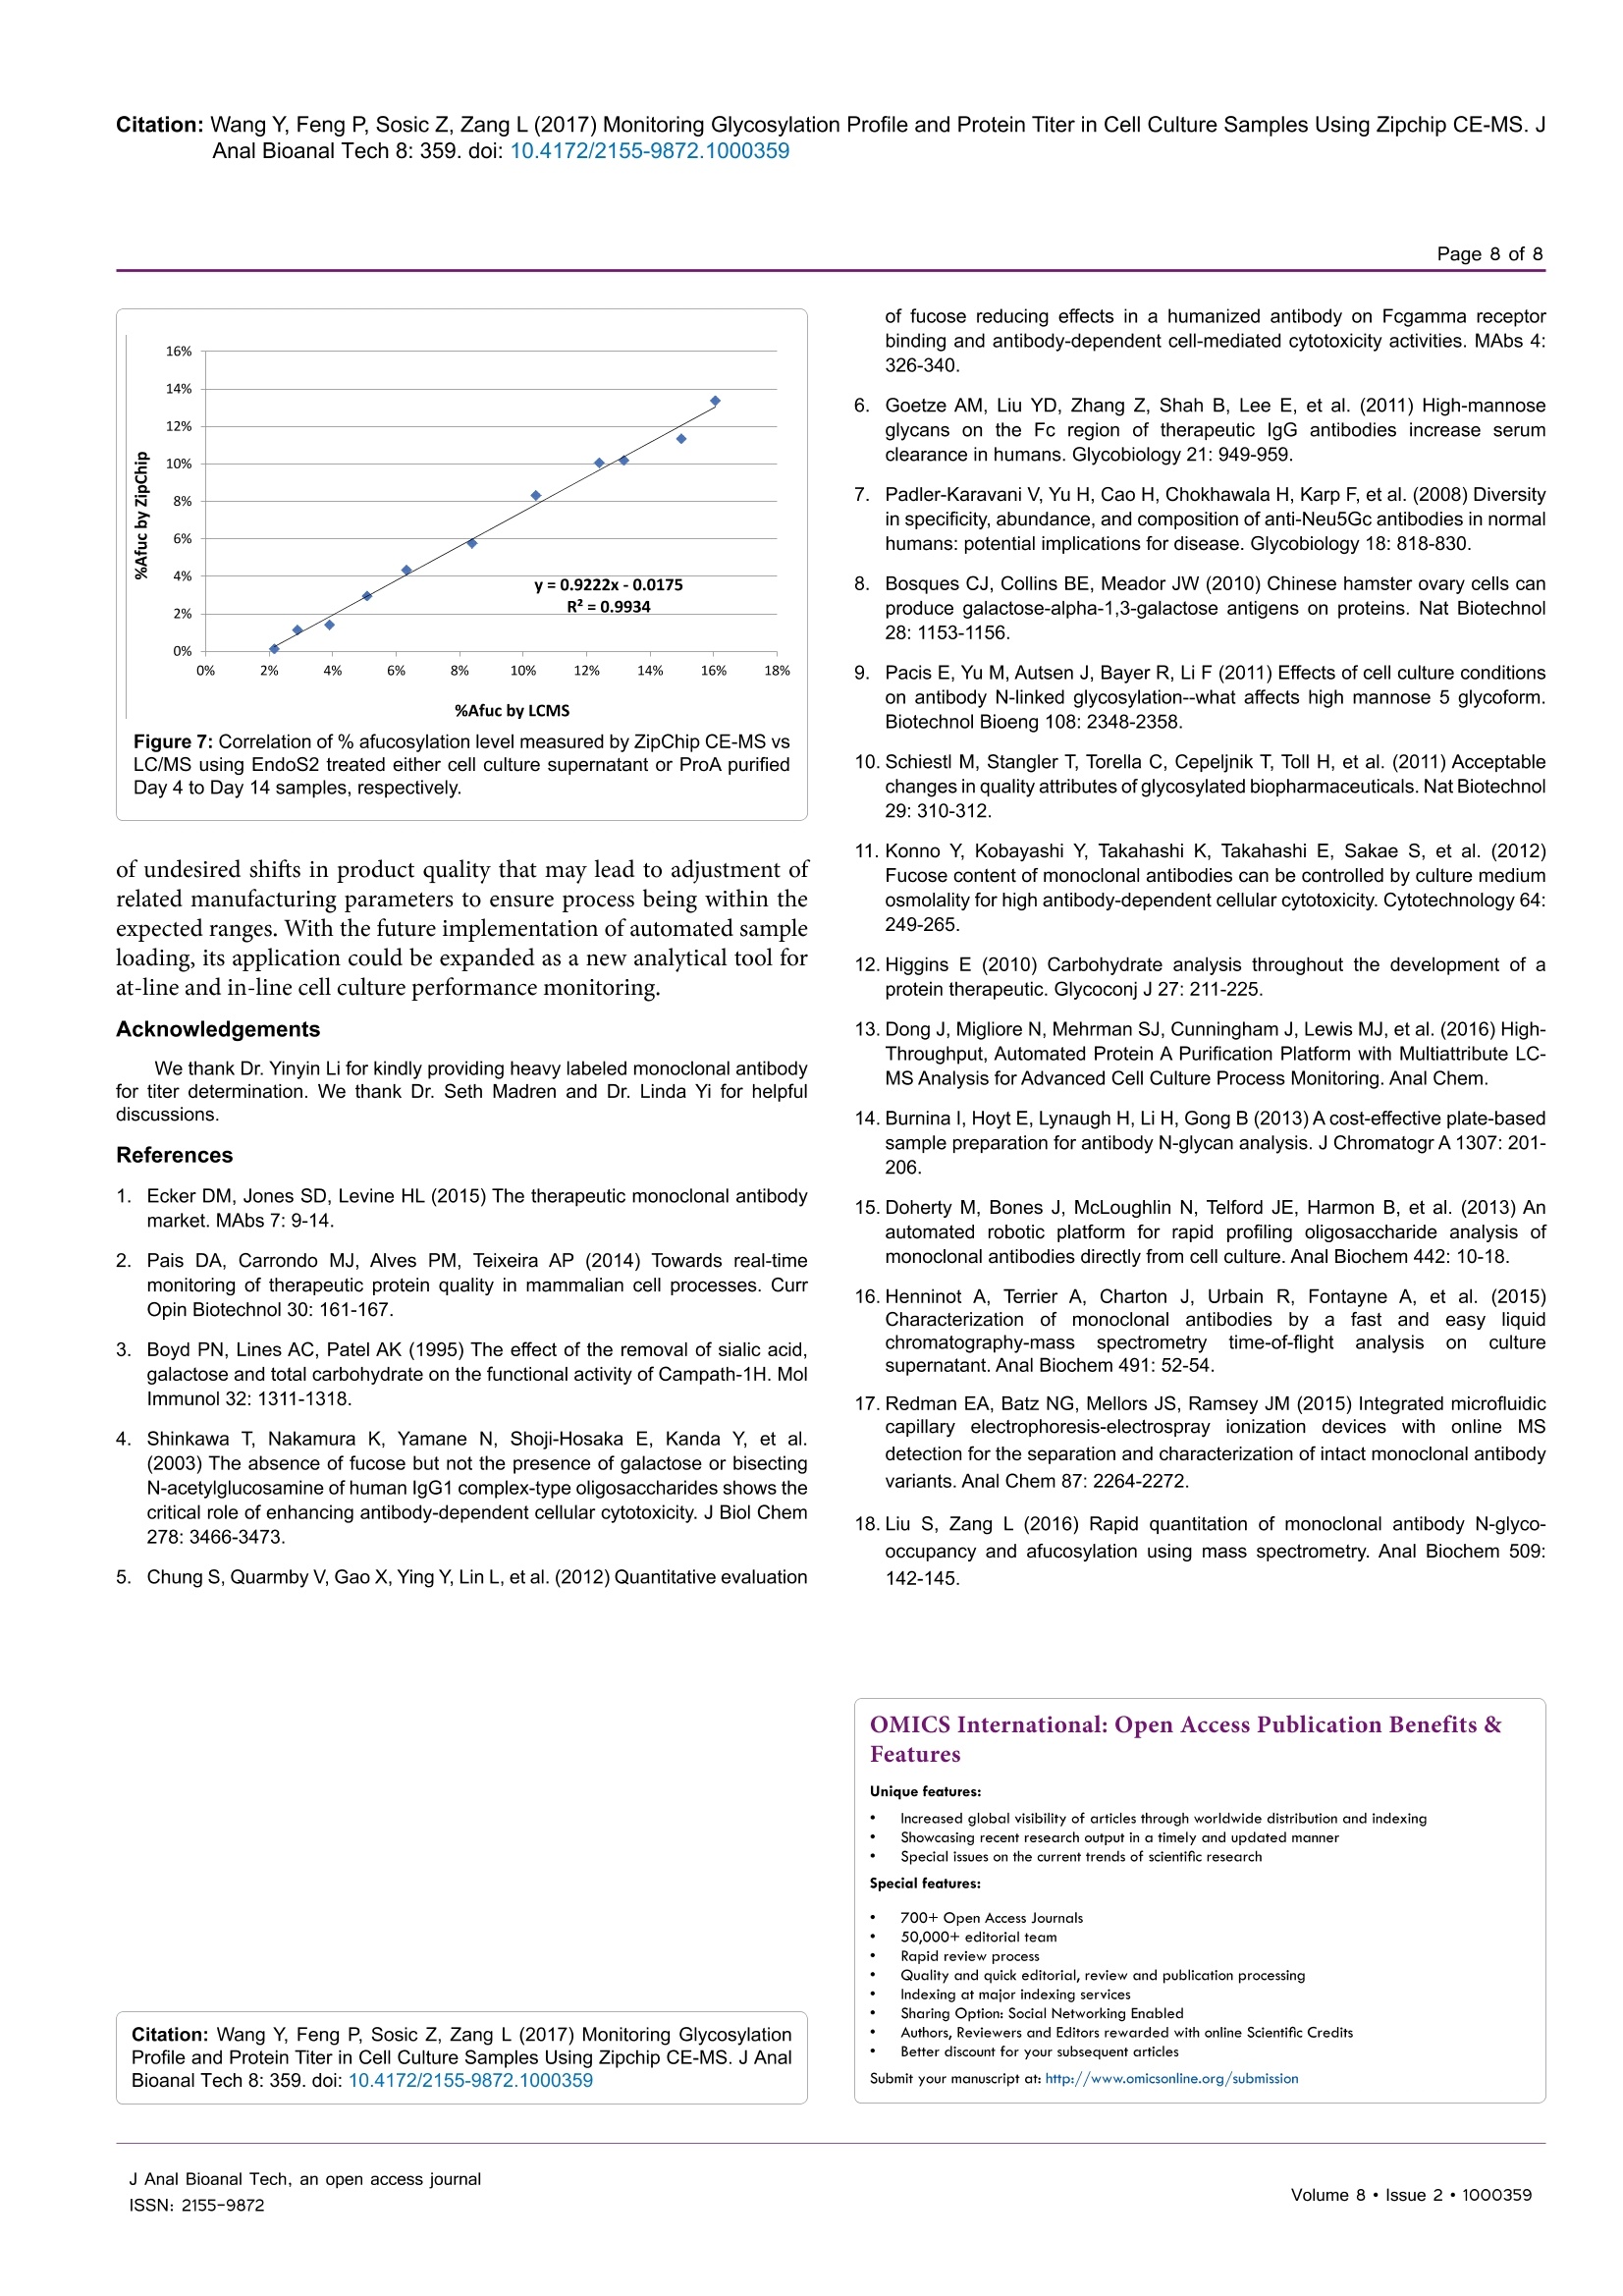
Wang et al., J Anal Bioanal Tech 2017, 8:2Journal ofDOI: 10.4172/2155-9872.1000359Analytical & Bioanalytical TechniquesResearch ArticleOMICS International Citation: Wang Y, Feng P, Sosic Z, Zang L (2017) Monitoring Glycosylation Profile and Protein Titer in Cell Culture Samples Using Zipchip CE-MS. JAnal Bioanal Tech 8: 359.doi: 10.4172/2155-9872.1000359Page 2 of 8 Monitoring Glycosylation Profile and Protein Titer in Cell Culture Samples UsingZipChip CE-MS Yan Wang#, Peng Feng*, Zoran Sosic* and Li Zang Analytical Development, Biogen Inc., Cambridge, MA, USA #Contributed equally Abstract Rapid and sensitive product quality analysis is important for real-time monitoring during biopharmaceuticaldevelopment and manufacturing. However, low level of protein concentration and complex cell culture matrix posechallenges for product quality characterization at early stages of cell line selection and process development. Here,we describe a fast and simple microfluidic ZipChip CE-MS method to measure quality attributes of monoclonalantibody protein directly from cell culture supernatant. Cell culture supernatant samples were characterizedwith charge-based separation using microfluidic capillary electrophoresis coupled to a high-resolution massspectrometer. Under sample reducing conditions, multiple protein glycosylation attributes were determined on theheavy chain, whereas titer information was obtained from comparison of light chain signal intensity following samplespiking-in with heavy labeled mAb. Therefore, the protein expression and product quality can be monitored usingthe same method with a single microfluidic device. A total volume of ten to fifty microliter of cell culture supernatantis needed, whereas analysis time is within three minutes per sample. In addition, comparison of new method withtraditional RP-LC-MS method using a set of time-course bioreactor cell culture samples has been performed. Agood correlation of the levels of N-glycosylation attributes between ZipChip CE-MS of crude samples and RPLC-MS analysis following Protein A (ProA) purification step has been demonstrated. Keywords: ZipChip CE-MS; RP-LC-MS; Protein quality attribute;Titer; Recombinant monoclonal antibody;N-glycosylation; Cell culturesupernatant Abbreviations: mAb: Recombinant Monoclonal Antibody; CE:Capillary Electrophoresis; MS: Mass Spectrometry; HC: Heavy Chain;LC: Light Chain; RP-LC: Reversed Phase Liquid Chromatography;RT,Room Temperature; E/S: Enzyme to Substrate ratio; AGE: AdvancedGlycation End Product; BG: Biantennary Galactosylation. Introduction Recombinant monoclonal antibody(mAb) production representsthe fastest growing sector of approved and in pipeline developingbiopharmaceutical drugs [1]. With an emphasis on the control ofmanufacturing process, there is increased demand for advanced productanalytics to report protein quality attributes early in order to allow forpotential adjustment to the manufacturing process. However, methodsfor at-line or in-line monitoring of protein quality attributes are stillin development and only few of them have been reported [2]. Processanalytical technology (PAT) tools, such as on-line Raman spectra,refractive index, pH, temperature and various gas probes are importantfor process control, yet they don’t offer a direct measurement of productquality attributes. In particular, the early stages of mAb development,such as clone selection and process optimization, require analyticalscreening approaches for intermediate samples where protein titer can below and sample matrix is complex. Similarly, there is also need for real-time analytical methods to enable feed-back or feed-forward controlsduring the manufacturing of mAb batches, as opposed to traditionalprocess that takes weeks prior to the final drug substance productquality measurement. Hence, rapid and sensitive analytical methodsthat potentially enable real-time quality attribute characterization arehighlydesirable. Post-translational modifications, such as N- and C-terminalmodifications, deamidation, oxidation, glycation and glycosylationresult in a remarkable heterogeneity of mAb products. Glycosylation is one of very important post-translational modifications because itcan have significant impact on antibody-dependent cell-mediatedcytotoxicity (ADCC) activity [3,4], complement-dependent cytotoxicity(CDCC) activity [5], clearance [6] and immunogenicity [7,8]. Proteinglycosylation can be significantly impacted by the host cell line, clone,media composition, feeding strategy and downstream processingconditions [9-11]. Therefore, N-glycosylation analysis of monoclonalantibody is widely performed in the biopharmaceutical development,and in some cases is used as release assay when glycosylation isestablished as a critical quality attribute [12]. To date, only a fewapproaches have been developed targeting at-line or in-line control ofprotein glycosylation during protein production. For example, high-throughput ProA purification combined with rapid subunit LC-MSanalysis allowed simultaneous quantitation of multiple product qualityattributes from cell culture harvest, including antibody glycosylationand glycation [13]. Another method for profiling N-glycosylation basedon release of glycans, their fluorescent labelling and ultra-performanceliquid chromatography (UPLC) was developed for the analysis of glycancomposition of mAbs from the cell culture supernatant, [14,15]. Thedisadvantage of above approaches is protein purification step requiredprior to analysis as well as relatively lengthy analysis time. SubunitLC-MS analysis has been reported to confirm antibody identity anddetermine isoform glycan content directly from cell culture supernatant ( *Corresponding author: Zoran Sosic, An a lytical Development, Bi o gen Inc.,Cambridge,MA, USA, Tel: 7814642000;E-mail: z o ran.sosic@b i o g en.co m ) ( R eceived M a rch 30, 2017; A c cepted April 04, 2 0 17;Published April 08, 2017 ) ( Copyright: C 2017 W ang Y,et a l.This is an open-access article distributed underthe terms of the Creative Commons Attribution L icense, w hich p ermits u nrestricteduse, d istribution, and reproduction i n any m edium, provided the or i ginal author and source are credited. ) samples. However, extensive sample preparation including bufferexchange and enzymatic digestion were performed.In addition, highnoise levels due to remaining media components interfered with MSdetection [16]. Recently, a microfluidic CE-ESI-MS method has been reportedto generate multiple pieces of quality information in a single analysisstep, including masses of intact mAb variants, an assessment of chargeheterogeneity and glycoform information of purified monoclonalantibody protein [17]. To target the current challenges with protein quality assessmentduring biopharmaceutical development, we have developed a novelmicrofluidic ZipChip CE-MS method to monitor protein qualityattributes of monoclonal antibody protein. Protein isoforms andglycosylation profile are measured under reducing conditions directlyfrom cell culture supernatant without protein purification. By spikingwith heavy labeled control sample, protein titer can be measuredusing the same method based on relative MS signal intensities of lightchains. To assess the applicability of this approach to detect changein the bioreactor, the levels of Mannose 5 glycoforms in cell culturetime-course samples were monitored by ZipChip CE-MS. Thesefindings were confirmed with traditional RPLC-MS assay that relieson an additional ProA sample purification step and both approachescorrelated well. Furthermore, EndoS2 enzyme treatment was applieddirectly to cell culture for quantitation of the afucosylation level, asone of the important monoclonal antibody quality attribute. A goodcorrelation for afucosylation data between ZipChip CE-MS and RPLC-MS analysis on ProA purified samples has been demonstrated.In orderto further compare the data obtained by the two techniques,percent ofbiantennary galactosylation, main neutral glycoforms (G0F, G1F andG2F) and level of aglycosylated protein have been also calculated andfound to be comparable. Overall, this simple and fast approach (threeminutes per sample) allows for screening of multiple product qualityattributes in cell culture samples and should permit for an efficientcontrol and understanding of manufacturing process. Due to itsversatility, it is foreseeable that it could be extended for monitoring ofother product attributes as well. Methods Materials and reagents Optima LC/MS grade Water, Acetonitrile and Formic acid (99%purity) was obtained from Fisher Scientific. Recombinant monoclonalantibody mAb and heavy-labeled mAb were produced by Cell CultureDevelopment at Biogen. Heavy-labeled mAb was grown in culturemedia contained heavy labeled 13C or 1N for Arginine and Lysine aminoacids. Heavy-labeled mAb was purified through ProA purification.ZipChip HR (cat#810-00140) was from 908 Devices. Reversed phasecolumn, Tosoh TSKgel Phenyl-5PW, (cat#18756, 2.0×75 mm) wasused for reversed-phase intact mass analysis. Cell culture samples Representative cell culture supernatant samples were obtainedby filtration through Steriflip-GV filter unit (EMD Millipore, Cat#SE1M179M6) to remove cells and large cell debris. Sample desalting for CE-MS and LC/MS Both cell culture supernatant and ProA purified eluate weredesalted and buffer exchanged to 50 mM ammonium bicarbonate usingThermo Zeba 96-well spin plate at 1,000 g for 2 min before furthersample reduction and/or enzymatic treatment. For RP-LC/MS analysis, cell culture supernatant was first purified by Agilent Bravo small scaleProA purification step to obtain ProA purified eluate. Sample reduction for CE-MS and LC/MS For reduced intact mass analysis, 10 uL (or 50 ug) of desalted cellculture supernatant or 50 ug purified proA eluate or heavy-labeled mAbspiked in at final concentration of 0.25 mg/mL were reduced with 168mM DTT for 30 min at 37°C. EndoS2deglycosylation and reduction for CE-MS and LC/MS For deglycosylated reduced intact mass analysis, either cell culturesupernatant or ProA purified eluate containing 50 ug of desalted protein,was treated with GlycInator (EndoS2, Genovis, Cat # A0-GL1-020) toremove N-linked carbohydrates after first GlcNAc at E/S ratio of 4:1(cell culture supernatant) or 1:1 (ProA purified eluate). Samples werethen reduced either with 168 mM DTT for 30 min at 37°℃ (cell culturesupernatant) or with 15 mM DTT for 45 min at 25℃ (ProA purifiedeluate). RP-LC-MS analysis In RP-LC-MS analysis, the heavy chain and light chain from 5ug of each sample were separated on a Tosoh TSKgel Phenyl columnand analyzed on-line by coupling to a Thermo Exactive Plus massspectrometer. A linear gradient was started with 10% B for 1 min,and then increased from 10% to 28% in 1 min and to 36% B in 4 min;column was then washed repeatedly by 2 cycles of increasing B to 80%in 0.5 min, and decreasing to 10% in 0.5 min. Column was equilibratedwith 10% B for 3 min before next injection. CE-ESI-MS device operation and data analysis The ZipChip CE ion source was purchased from 908 Devicesand installation followed the vendor instruction manual. Devicewas positioned in front of the inlet of a Thermo Exactive Plus massspectrometer (Thermo, San Jose, CA). 29 cm long separation channel ofZipChip HR was used to separate the samples. Background electrolyte(BGE) was 50% Acetonitrile containing 1% Formic Acid. The setting ofmass spectrometer was mass resolution 17, 500, in-source CID 100 eV,1 micro scan, AGC target 1E6, maximum inject time 50, spray voltage3 kV, capillary temperature at 380°℃, S-lens RF level 80, Aux gas heatertemperature 400℃, sheath gas flow rate 2, Aux gas flow rate 20 withdata acquired over a mass range of m/z 800-3500. Data acquisition wasaccomplished through Xcalibur (Thermo Scientific) tune page, whichwas triggered by 908 Devices CE-ESI Instrument Control to controlthe ZipChip output. The settings of CE were: injection load time 5 secat 2 psi, analysis run time 3 min, pressure assist start time 10 second,CE voltage 20 KV, ESI voltage 2 KV and shield 500 V.Deconvolution ofthe mass spectra was performed using the deconvolution algorithm inthe BiopharmarFinder 2.0 (Thermo) software. The five most abundantcharge states of heavy chain were used for glycosylation profilequantitation. The most abundant two charge-state ions in light chainwere used for protein concentration measurement based on intensityratio to two corresponding ions from spiked-in heavy labeled lightchain of heavy labeled mAb. Results Reduced mass analysis of cell culture supernatant by ZipChipCE-MS The workflow for use of ZipChip CE-MS to characterizemonoclonal antibody directly from cell culture supernatant is shown in Figure 1. Reduced mass analysis was selected over intact mass analysisto increase sensitivity of identification and quantitation of HC and LCisoforms. Cell culture supernatant containing secreted monoclonalantibody was buffer exchanged to 50 mM ammonium bicarbonateduring desalting step to reduce the potential ionic interference tocapillary electrophoresis separation and mass spectrometry detection.Sample was then reduced with 168 mM DTT at 37°C for 30 min. Fortiter measurement, heavy-labeled protein was mixed into the sampleprior to sample reduction step. To measure afucosylation level, samplereduction was performed after EndoS2 treatment. The HC and LCrelated species were assigned and quantitated based on the chargeseparation profile, detected masses and relative signal intensity. Sincethere are no N-glycosylation variants present on light chain, the proteinconcentration can be readily calculated using relative signal intensityof the light chain versus heavy-labeled light chain under samplereducing conditions. The ZipChip CE-MS workflow can obtain proteinconcentration and quality attributes information faster compared topreviously reported orthogonal approaches [15]. Optimization of the sample reduction step To develop the reduced condition for CE-MS analysis, 15 mM DTTconcentration was first used, in order to mimic the reduction conditionfor RP-LC-MS analysis of ProA purified mAbs. Electropherograms ofrepresentative cell culture supernatant samples after reduction with 15mM, 50 mM or 168 mM DTT are shown in Figure 2. The separationof HC and LC was completed in less than 2.0 min, with all proteinpeaks detected in a migration time window between 1.6 and 2.0 minand with an average width at base of 5 s. However, under 15 mM reduction conditions (Figure 2A), there was an extra peak, labeled asHC-LC that was increasing over time upon sample being repeatedlyinjected (data not shown). Figure 3 shows deconvoluted mass spectra ofthe HC and LC peaks corresponding to the expected heavy chain withmajor glycosylation isoforms (mass 51202 Da for HC-G0F, 51363 Dafor HC-G1F and 51526 for HC-G2F, Figure 3A) and light chain (mass23203 Da, Figure 3C). The detected mass 74403 Da, 74564 Da, 74725Da (Figure 3B) from HC-LC peak agree well with expected mass ofheterodimers of three HC glycosylated forms with LC. It was concludedthat the artifact peak was due to disulfide scrambling as result of lowDTT concentration and no denaturant in the sample buffer. Therefore,different reduction reagent concentration and dilution conditions weretested. The concentration of 168 mM DTT proved to work best tominimize the HC-LC presence, as shown in analysis of sample storedat 4°C for 24 hours (Figure 2C). From these results, an addition of 168mM DTT was selected as optimum concentration of reducing reagent. The improved detection capability of low abundance chargevariants by ZipChip CE-MS In addition to the major HC and LC peaks in the cell culturesample under optimized reducing conditions, there are also minorbasic and acidic variants detected to the left and right of the HC andLC major peaks (Figure 4A). These minor peaks were deconvoluted toMWs of 49756 Da (matching aglycosylated HC, Figure 4B) and 23365Da (matching glycated LC), respectively. The relative abundance was3.4% for aglycosylated HC, 0.6% and 3.9%, respectively, for advancedglycated LC components (Figure 4C). As these minor species may co-eluate with their 1 net charge counterparts (i.e., HC and LC isoforms) in Figure 1: Schematic overview of the reduced mass analysis of cell culture supernatant samples by ZipChip CE-MS (RED=Reduced; DGR=Deglycosylatedand Reduced). Figure 2: Optimization of the sample reduction step. Electropherograms of (A) 15 mM (B)50 mM (C) 168 mM DTT treated cell culture supernatant of mAbsample.Where, HC-heavy chain; HC-LC-disulfide-linked heavy and light chains; LC-light chain. Figure 3: Corresponding deconvoluted reduced mass spectra of a monoclonal antibody from Figure 2. From top to bottom panels were (A) heavy chain isoforms;(B) disulfide-linked heavy and light chain isoforms; (C) light chain. The theoretical and expected masses of three major components were shown in the insert.Identified isoforms were labeled whereas unknown components were shown as masses only. Figure 4: (A) Total ion chromatograms of a monoclonal antibody showing the basic, Agly HC (including the zoomed-in insert of electropherogram) and acidic,Glycated LC (including the zoomed-in insert of electropherogram) isoforms eluting in addition to the major HC and LC peaks. (B) Deconvoluted mass spectrumfrom basic region shows the aglycosylated heavy chain. (C) Deconvoluted mass spectrum from acidic region shows advanced glycation end products (AGE) of LC. traditional RP-LC-MS, a charge-based separation observed by ZipchipCE-MS could help against ion suppression effects and potentially allowfor improved detection of similar, low abundant species. Titer determination by ZipChip CE-MS Here, we have also demonstrated ZipChip CE-MS method that canbe applied to determine the protein concentration by utilizing the heavyisotope-labeled mAb as internal calibrant. This material was mixed into1t0the cell culture supernatant sample before reduction step. In the heavy-labeled mAb, all lysine and arginine residues were substituted by their13C and 15N containing counterparts (purity>99%). The heavy labeledmAb behaves same as the control, original mAb in terms ofionizationefficiency. This internal calibrant provides a way to determine “light”mAb concentration by calculating the ratio of “light"ions (from cellculture supernatant) and "heavy"ions (from the spiked-in internalcalibrant). As the modifications on light chain are at very low level, thisapproach provides more accurate measurement than using complexheavy chain and its isoforms. Figure 5A shows the mass spectrum of“light"light chain ions and"heavy”light chain ions. The concentrationof spiked heavy-labeled mAb is 0.25 mg/mL. Therefore, the titer of cellculture supernatant can be calculated by 0.25* [intensity of extractedion chromatogram (XIC) of light chain ions 2110 and 232ly/intensityof XIC of heavy chain ions 2125 and 2337]. In Figure 5B, representative cell culture supernatant with proteinconcentration of ~10 mg/mL as measured by ProG titer assay wasserially diluted to 0.2 mg/mL with null cell culture media. Each dilutionpoint was further diluted by 10 folds with water before loading ontoZipChip. The calculated and expected protein concentration showedvery good correlation ofR=0.9999. This result indicates that ZipChipCE-MS could be applied to measure protein concentration accuratelyencompassing concentration range from 0.2 to 10 mg/mL with goodlinearity. N-glycosylation detection and correlation results betweenZipChip CE-MS and RP-LC-MS To demonstrate the capability of the ZipChip CE-MS for screeningof cell culture quality attributes, a set of bioreactor time-course sampleswas analyzed by both ZipChip CE-MS and LC-MS using cell culturesupernatant or ProA purified protein, respectively. Figure 6 showsthe example of deconvoluted HC spectra from ZipChip CE-MS dataof Day 4 and Day 14 cell culture supernatant. At Day 4, aglycosylatedHC was detected and its level decreased over the course of cultureduration (Figure 6A), while Man5 and G0F-GlcNAc were new speciesthat appeared in Day 14 sample (Figure 6B). These trends were alsoconfirmed by traditional RPLC-MS assay. The levels of five glycoforms(Man5, G0F-GlcNAc, G0F, G1F, and G2F) as well as aglycosylatedspecies were quantitated in the Day 4 to Day 14 samples. Minor andmajor glycoforms species were detected at levels ranging from 0.7%for Man5 to 45.4% for G0F. Figure 6C shows changes in %Man5,%Biantennary Galactosylation (%BG) and %AGly levels for theseattributes measured on different days of bioreactor cell culture process.Figure 6D and 6E shows good correlation of quantitation resultsbetween two methods for %Man5 (R²=0.98), and %BG (R²=0.97). Asthe %agly level in these samples is in the range of 0.8-1.7%, which is at thelower end of accurate quantitation for both CE-MS and LC-MS methods,resulting correlation factor is relatively low (R²=0.78)(Figure 6F). Afucosylation level can affect the effector function of mAb, whichis a critical quality attributes to monitor during mAb development[4]. GlycINATOR enzyme (EndoS2) converts the N-glycosylatedheavy chain species into two forms, one heavy chain attached with aGlcNAc and another one with a core-fucosylated GlcNAc, in additionto presence of the aglycosylated heavy chain. The RP-LC/MS basedworkflow to quantitate afucosylation using ProA purified mAb has Figure 5: (A) Mass spectrum of detected light chain ions from cell culture supernatant and“heavy"light chain ions from spiked-in heavy labeled mAb. (B) Correlationof ZipChip measured titer with ProG titer assay. Table 1: Comparison of the ZipChip CE-MS and LC-MS for mAb N-glycosylation quantitation. The ZipChip CE-MS data were obtained from four replicates of cellculture sample at 1.5 mg/mL. The RP-LC/MS results were obtained from six replicates using ProA purifed sample at 1 mg/mL. BG,biantennary galactosylation, %BG=[2*%G2F+%G1F]/[2*(G0F+G1F+G2F)]. Sample Description LC/MS (N=6) Average Std Dev RSD %Man5 %BG GOF G1F G2F %Man5 %BG GOF G1F G2F %Man5 G2F %BG Harvest after Pro A step 1 mg/mL 1.7% 16.3% 67.3% 23.1% 3.8% 0.2% 0.2% 0.4% 0.2% 0.1% 9.9% 3.8% 1.1% Zip Chip (N=4) Harvest 1.5 mgml 1.1% 16.0% 68.6% 23.4% 3.6% 0.2% 0.5% 1.1% 0.9% 0.2% 14.0% 4.6% 3.1% been reported [18]. We herein tested the strategy of EndoS2 directtreatment of cell culture samples followed by ZipChip CE-MS analysis.Afucosylation levels determined by ZipChip CE-MS method fromDay 4 to Day 14 were compared with results obtained from RP-LC-MS method. Both methods showed very good correlation with R=0.99(Figure 7). This result demonstrated the capability of CE-MS methodfor rapid afucosylation monitoring from cell culture supernatantsamples as well. To make an initial method’s assessment between ZipChip CE-MSand established RPLC-MS assay, cell culture sample and correspondingProA sample were analyzed multiple times. As shown in Table 1,comparable data for percent of Mannose 5, G0F, G1F and G2Fglycoforms and %BG index were obtained between two methods usingslightly different starting concentrations of cell culture supernatant andProA purified sample, respectively. Two-fold dilutions of cell culturesample with null cell culture media down to 0.75 mg/mL revealedcomparable and consistent data measurement of %G0F,%G1F, %G2Fand %BG quantitation, but higher variation for the least abundantglycoform i.e., Mannose 5 (data not shown). Considering that titerconcentration above 1.5 mg/mL are typically achievable at early daysof mAb bioreactor process, ZipChip CE-MS can be used to monitor changes of minor glycoforms at approximately 1% relative abundance,which is comparable to the detection sensitivity of RPLC-MS usingpurified protein. Thus, this technique can be applied as a fast screeningtool for monitoring glycosylation changes in cell culture samples. Discussion In this work, we report a fast and simple ZipChip CE-MS methodto monitor protein N-glycosylation quality attributes and titer bydirectly analyzing cell culture supernatant without sample purificationrequired. This approach allows multiple product quality informationin a single analysis, such as determination of mAb HC and LCisoform masses, and titer concentration, as described here. Analogousinformation is generally carried out by several methods, for example,RP-LC-MS for mass determination, ELISA-based Octet or UV UPLCfor protein concentration. Additionally, sample turnaround by ZipChipCE-MS can be achieved within 1.5 h or less for described workflows,including sample preparation, CE-MS analysis and data processingtime. The reduced mass analysis using ZipChip CE-MS for non-purified cell culture supernatant samples allows speed and simplicityrequired at the early stage of cell line screening, process developmentand batch manufacturing. This approach can be used for detection Figure 6: Representative Deconvoluted Mass Spectra from Cell Culture time-course sample (A) Day 4 and (B) Day 14. The different N-glycosylated Heavy chainisoforms were assigned based on detected masses matching theoretical masses (C) Relative quantitation of %Man5, %BG and %Agly for time course cell culturesamples from Day 4 to Day 14 using ZipChip CE-MS. Correlation of ZipChip CE-MS and LC/MS results for (D)% Man5,(E)%BG and (F)%Agly.~ocvMan5, Mannose 5, Agly, Aglycosylation Figure 7: Correlation of % afucosylation level measured by ZipChip CE-MS vsLC/MS using EndoS2 treated either cell culture supernatant or ProA purifiedDay 4 to Day 14 samples, respectively. of undesired shifts in product quality that may lead to adjustment ofrelated manufacturing parameters to ensure process being within theexpected ranges. With the future implementation of automated sampleloading, its application could be expanded as a new analytical tool forat-line and in-line cell culture performance monitoring. Acknowledgements ( W e thank Dr. Yinyin L i for kindly providing heavy labeled monoclonal antibody for tite r determination . We thank D r. Seth M adren and Dr . Li n da Yi fo r he l pfuldiscussions. ) ( References ) ( 1 . E cker DM, Jones SD, Levine HL (2015) Th e therapeutic monoclonal antibody market. MAbs 7: 9-14. ) ( 2. P 1 ais D A, C arrondo MJ, A l ves P M , Teixeira AP (2014) Towards real-timemonitoring o f t herapeutic p rotein q uality in mammalian ce l l processes. Cu r rOpin Biotechnol 30: 161-167. ) ( 3. B oyd PN, Li n es AC, Patel AK (1995) The effect of the rem o val of s i alic acid,galactose and total carbohydrate on the functional activity of Campath-1H. Mol Immunol 32: 1311-1318. ) ( 4. T. Shinkawa T , Nakamura K, Yamane N, Shoji-Hosaka E, K a nda Y, e t a l . (2003) The absence of fucose but not the p resence of galactose o r bisecting N -acetylglucosamine of human IgG1 complex-type oligosaccharides shows the c ritical rol e of enhancing antibody-dependent cellular cytotoxicity. J Biol Chem 278: 3466-3473. ) ( 5 . C hung S, Quarmby V, Gao X, Ying Y, Lin L, et al. (2012) Quantitative evaluation ) ( Citation: Wang Y, Feng P , S o sic Z, Z a ng L (2 0 17) Mo n itoring GlycosylationProfile and Protein Tite r in Ce l l Cultu r e Samples Using Zipchip CE-MS. J Anal Bioanal Tech 8: 359. doi : 10 . 4172/21 5 5-9872 .1 000359 ) of fucose reducing effects in a humanized antibody on Fcgamma receptorbinding and antibody-dependent cell-mediated cytotoxicity activities. MAbs 4:326-340. 6.Goetze AM, Liu YD, Zhang Z, Shah B, Lee E, et al. (2011) High-mannoseglycans on the Fc region of therapeutic IgG antibodies increase serumclearance in humans. Glycobiology 21:949-959. 7.Padler-Karavani V, Yu H, Cao H, Chokhawala H, Karp F, et al.(2008) Diversityin specificity, abundance, and composition of anti-Neu5Gc antibodies in normalhumans: potential implications for disease. Glycobiology 18: 818-830. 8.Bosques CJ, Collins BE, Meador JW (2010) Chinese hamster ovary cells canproduce galactose-alpha-1,3-galactose antigens on proteins. Nat Biotechnol28:1153-1156. 9. Pacis E, Yu M, Autsen J, BayerR, Li F (2011) Effects of cell culture conditionson antibody N-linked glycosylation--what affects high mannose 5 glycoform.Biotechnol Bioeng 108:2348-2358. 10. Schiestl M, Stangler T, Torella C, Cepeljnik T, Toll H, et al. (2011) Acceptablechanges in quality attributes of glycosylated biopharmaceuticals. Nat Biotechnol29: 310-312. 11. Konno Y, Kobayashi Y, Takahashi K, Takahashi E, Sakae S, et al. (2012)Fucose content of monoclonal antibodies can be controlled by culture mediumosmolality for high antibody-dependent cellular cytotoxicity. Cytotechnology 64:249-265. 12. Higgins E (2010) Carbohydrate analysis throughout the development of aprotein therapeutic. GlycoconjJ 27:211-225. 13. Dong J, Migliore N, Mehrman SJ, Cunningham J, Lewis MJ, et al.(2016) High-Throughput, Automated Protein A Purification Platform with Multiattribute LC-MS Analysis for Advanced Cell Culture Process Monitoring. Anal Chem. ( 14. Burnina l, Hoyt E, L ynaugh H, Li H, Gong B (2013) A cost-effective plate-basedsample preparation for antibody N-glycan analysis. J ChromatogrA 1307:201- 206. ) ( 15. Doherty M, B ones J, M cLoughlin N , Telford JE, H a rmon B, et al . ( 2 013) A n automated robotic pl a tform fo r ra p id pro f iling ol i gosaccharide ana l ysis of m onoclonal antibodies directly from cell c ulture. Anal Biochem 442: 1 0 -18. ) ( 1 6. Henninot A, Terrier A, Charton J, Urbain R , F ontayne A , e t a l . ( 2 015)Characterizatio n of monoclonal antibodies by a f ast a nd e a sy li q uid chromatography-mass s pectrometr y t ime-of-flightanalysis 0 on culture supernatant. Anal Biochem 491: 52-54. ) ( 17. Redman EA, B a tz NG, Mellors JS, R a msey JM (2015) Integrated microfluidiccapillary electrophoresis-electrospray ionization devices wit h onlin e MSdetection f or the separation a nd characterization o f intact monoclonal antibody variants. Anal Chem 87:2264-2272. ) ( 18. Liu S, Zang L (2016) R a pid qu a ntitation o f m o noclonal an t ibody N-glyco-occupancy and afucosylation using mass spectrometry. Anal Biochem 509: 142-145. ) OMICS International: Open Access Publication Benefits & Features Unique features: Increased global visibility of articles through worldwide distribution and indexing Showcasing recent research output in a timely and updated manner Special issues on the current trends of scientific research Special features: 700+Open Access Journals 50,000+ editorial team Rapid review process Quality and quick editorial, review and publication processing Indexing at major indexing servicesSharing Option: Social Networking Enabled Authors, Reviewers and Editors rewarded with online Scientific Credits Better discount for your subsequent articles Submit your manuscript at: http://www.omicsonline.org/submission J Anal Bioanal Tech, an open access journalVolume · Issue ·SSN: 快速和灵敏的产品品质分析对于生物药的开发和生产过程中的实时监测十分重要。然而,由于蛋白质浓度低、细胞培养基质复杂,对于早期细胞系选择和工艺发展中的产品品质控制提出了挑战。在这里我们提出了一种快速、简便的微流控毛细管电泳—质谱联用方法,英文简称ZipChip CE-MS,用于直接检测从细胞培养上清液中获得的单克隆抗体蛋白的品质特性。细胞培养上清液样品可采用微流控毛细管电泳与高分离度质谱仪联用法以电荷差异性为基础进行分离。在样品还原条件下,可以确定重链上的多个蛋白糖基化属性,而滴度信息可以通过与样品中加入同位素标记的抗体轻链的信号强度的比较获得。因此,利用单一的微流控芯片ZipChip并采用相同的方法监测蛋白表达和产品品质,消耗的样品体积仅为10-15微升的细胞培养上清液,每个样品的分析时间在3分钟内即可完成。此外,用一组time-course生物反应器细胞培养样品对ZipChip CE-MS方法和传统的 RPLC-MS 方法进行了比较,结果表明,直接提取原始样品通过 ZipChip CE-MS 分析与经过蛋白纯化(ProA)处理后再进行的 RPLC-MS 分析结果间,两种方法对N-糖基化属性的表征水平相一致。
确定
还剩6页未读,是否继续阅读?

产品配置单


908 Devices为您提供《细胞培养上清液样品中生物药品质特性检测方案(毛细管电泳仪)》,该方案主要用于其他中生物药品质特性检测,参考标准--,《细胞培养上清液样品中生物药品质特性检测方案(毛细管电泳仪)》用到的仪器有908Devices ZipChip AS 毛细管电泳质谱联用系统 (自动进样款)、ZipChip 肽段分析试剂盒、ZipChip 完整抗体分析试剂盒、ZipChip native 原态分析试剂盒
推荐专场
相关方案
更多