


方案详情
文
采用立陶宛Ekspla公司的皮秒Nd:YVO4激光器,进行皮秒激光烧蚀四极质谱法深度分辨分析探测W7-X石墨组分中的氢成分的实验研究
方案详情

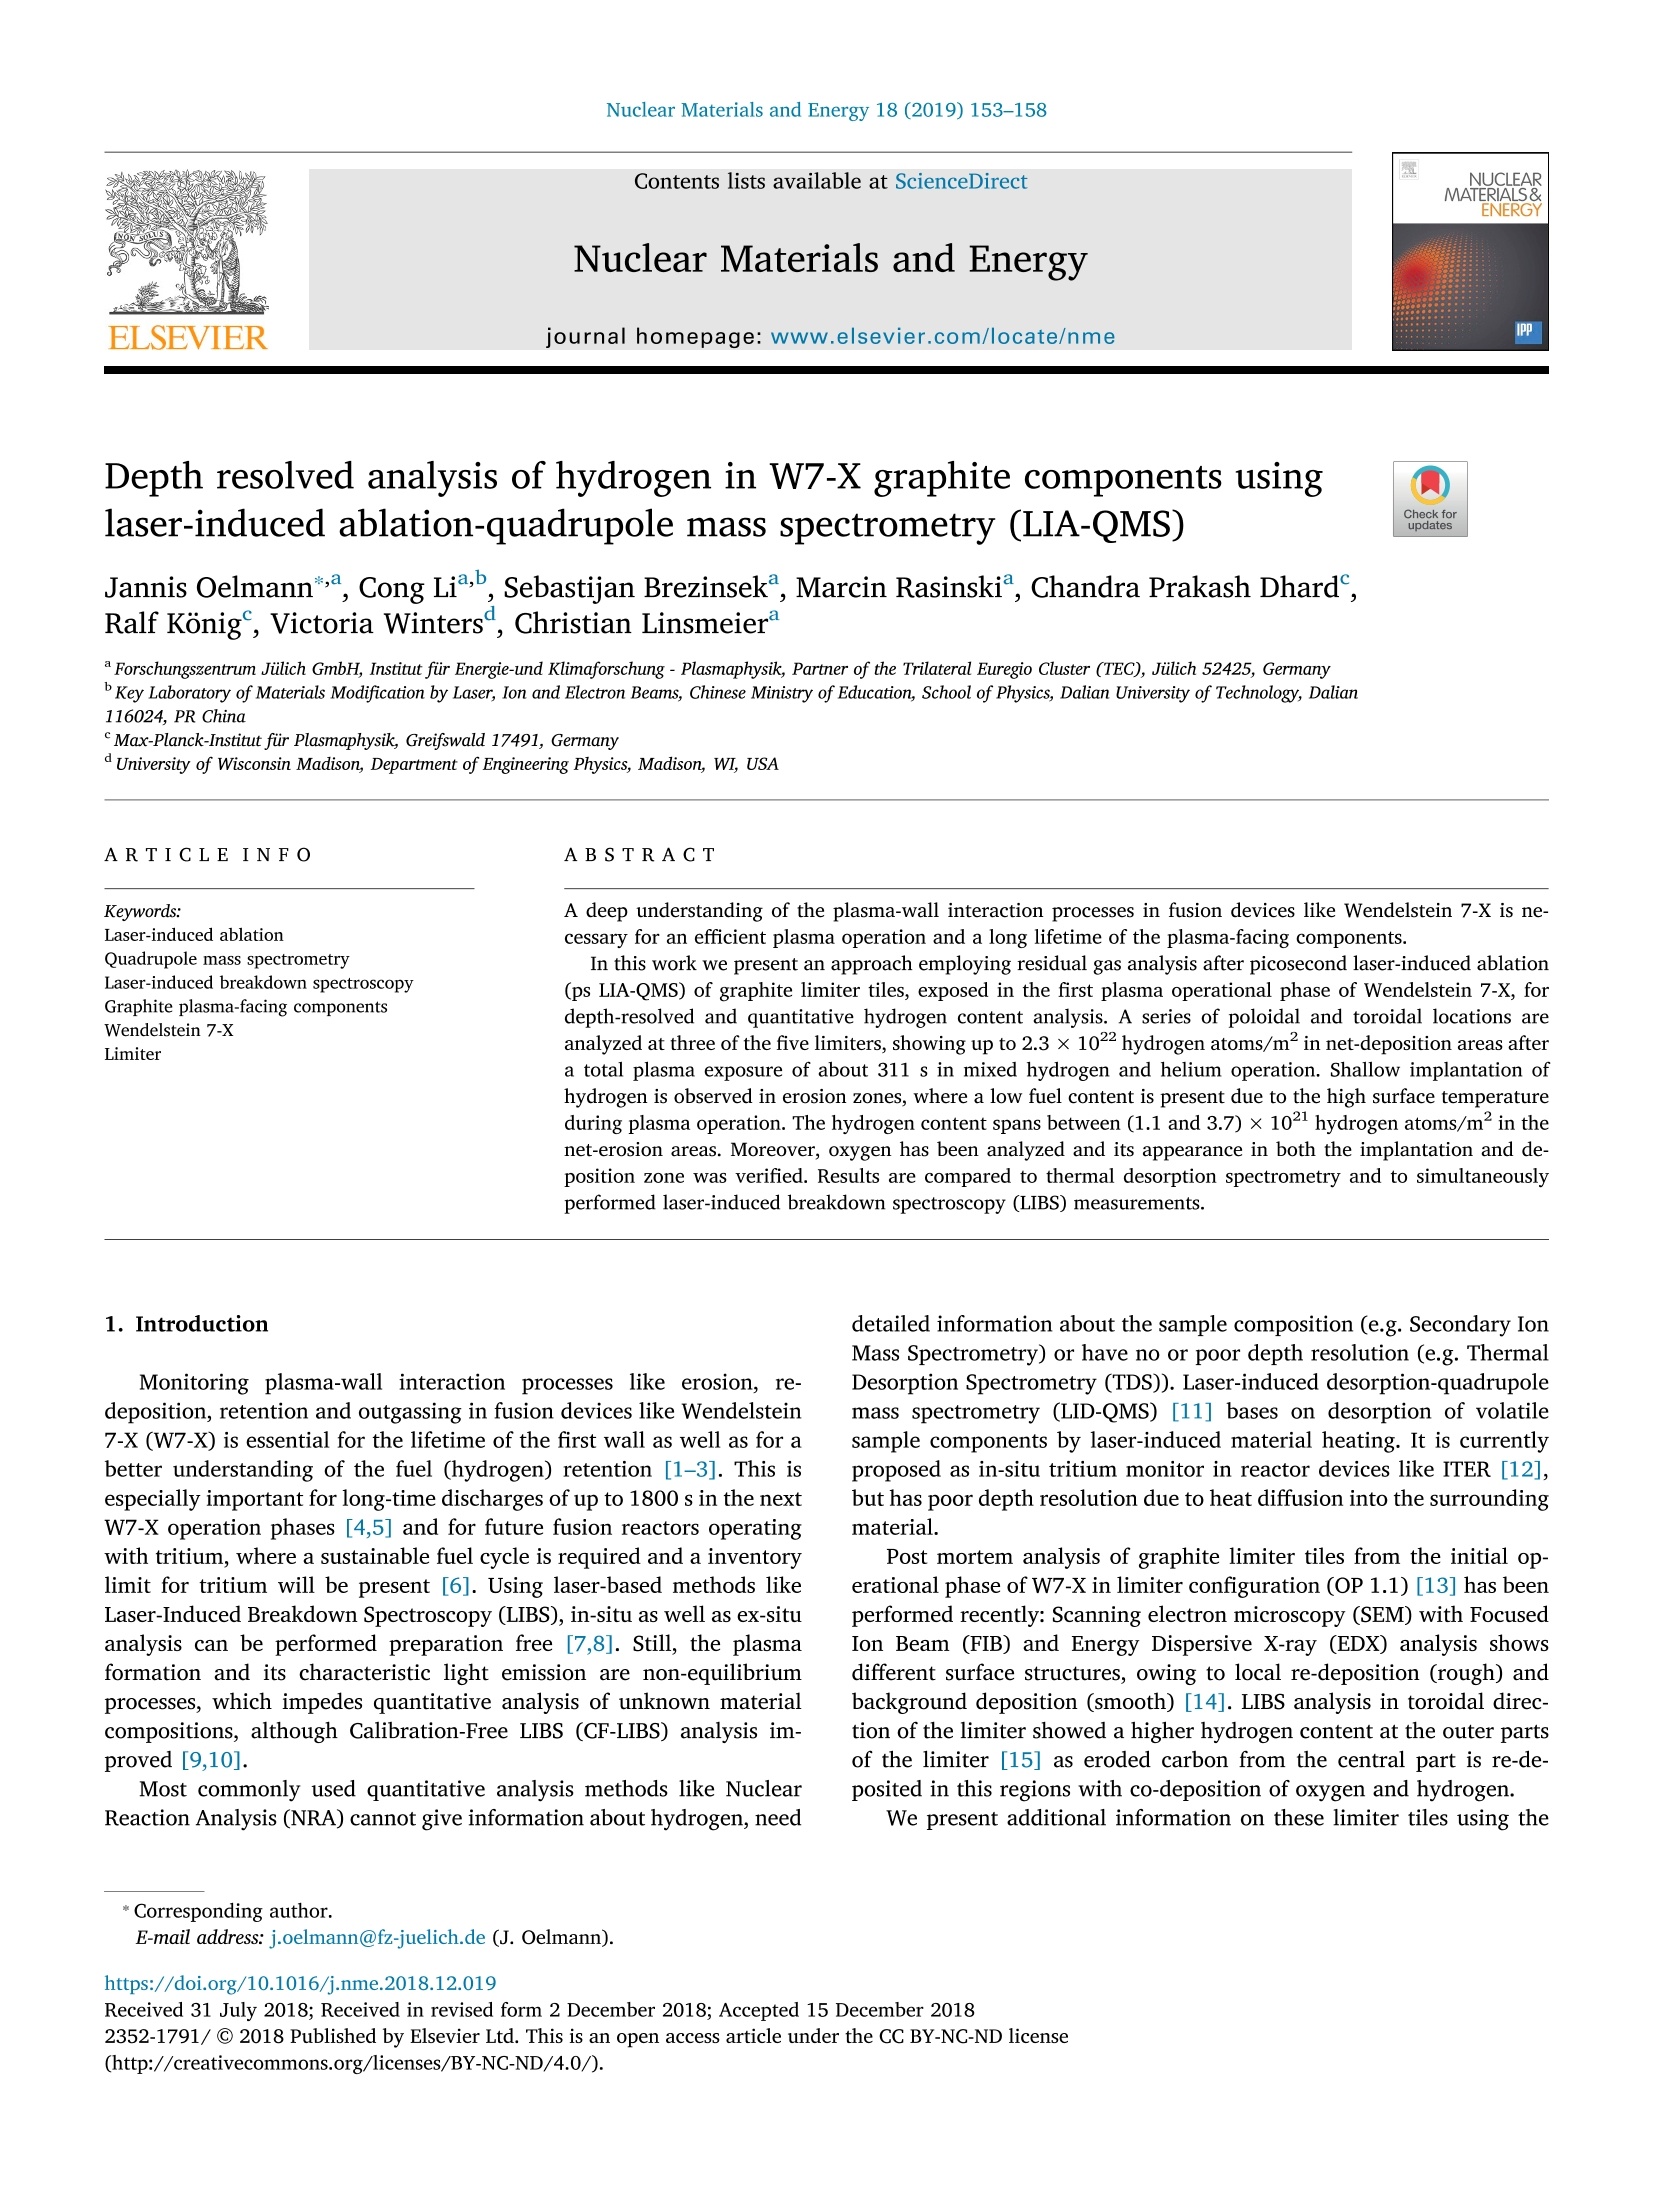
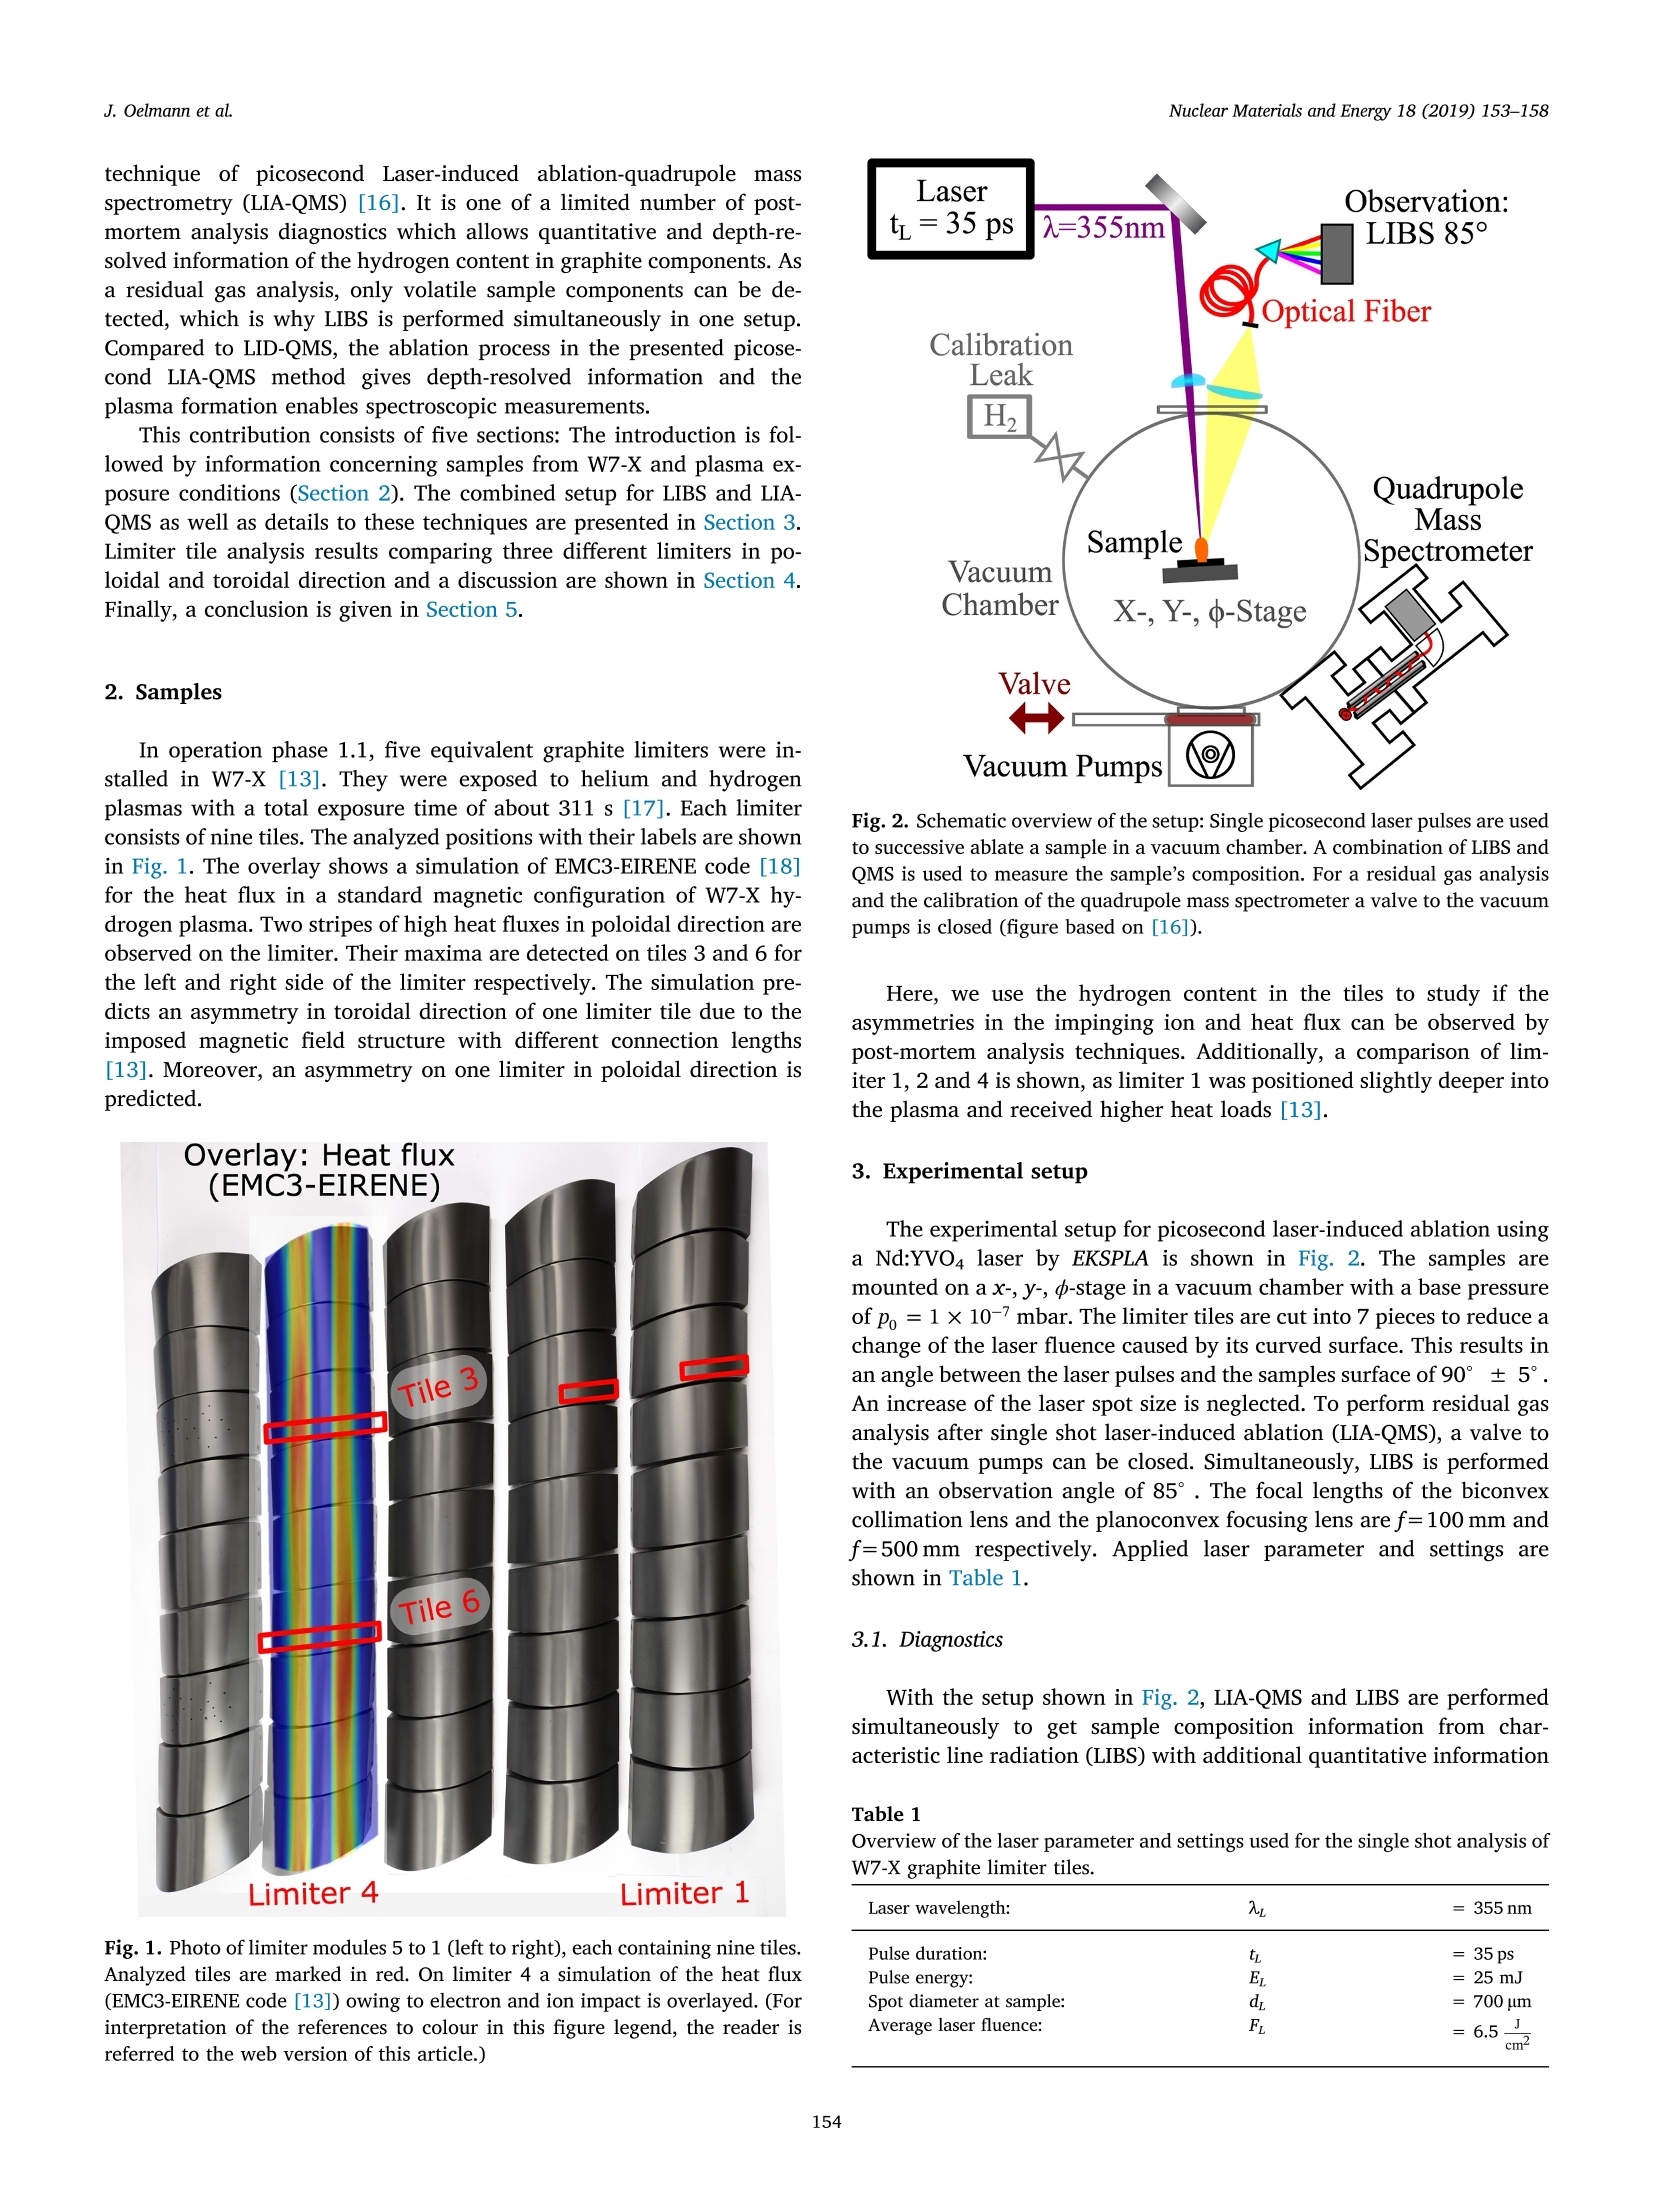
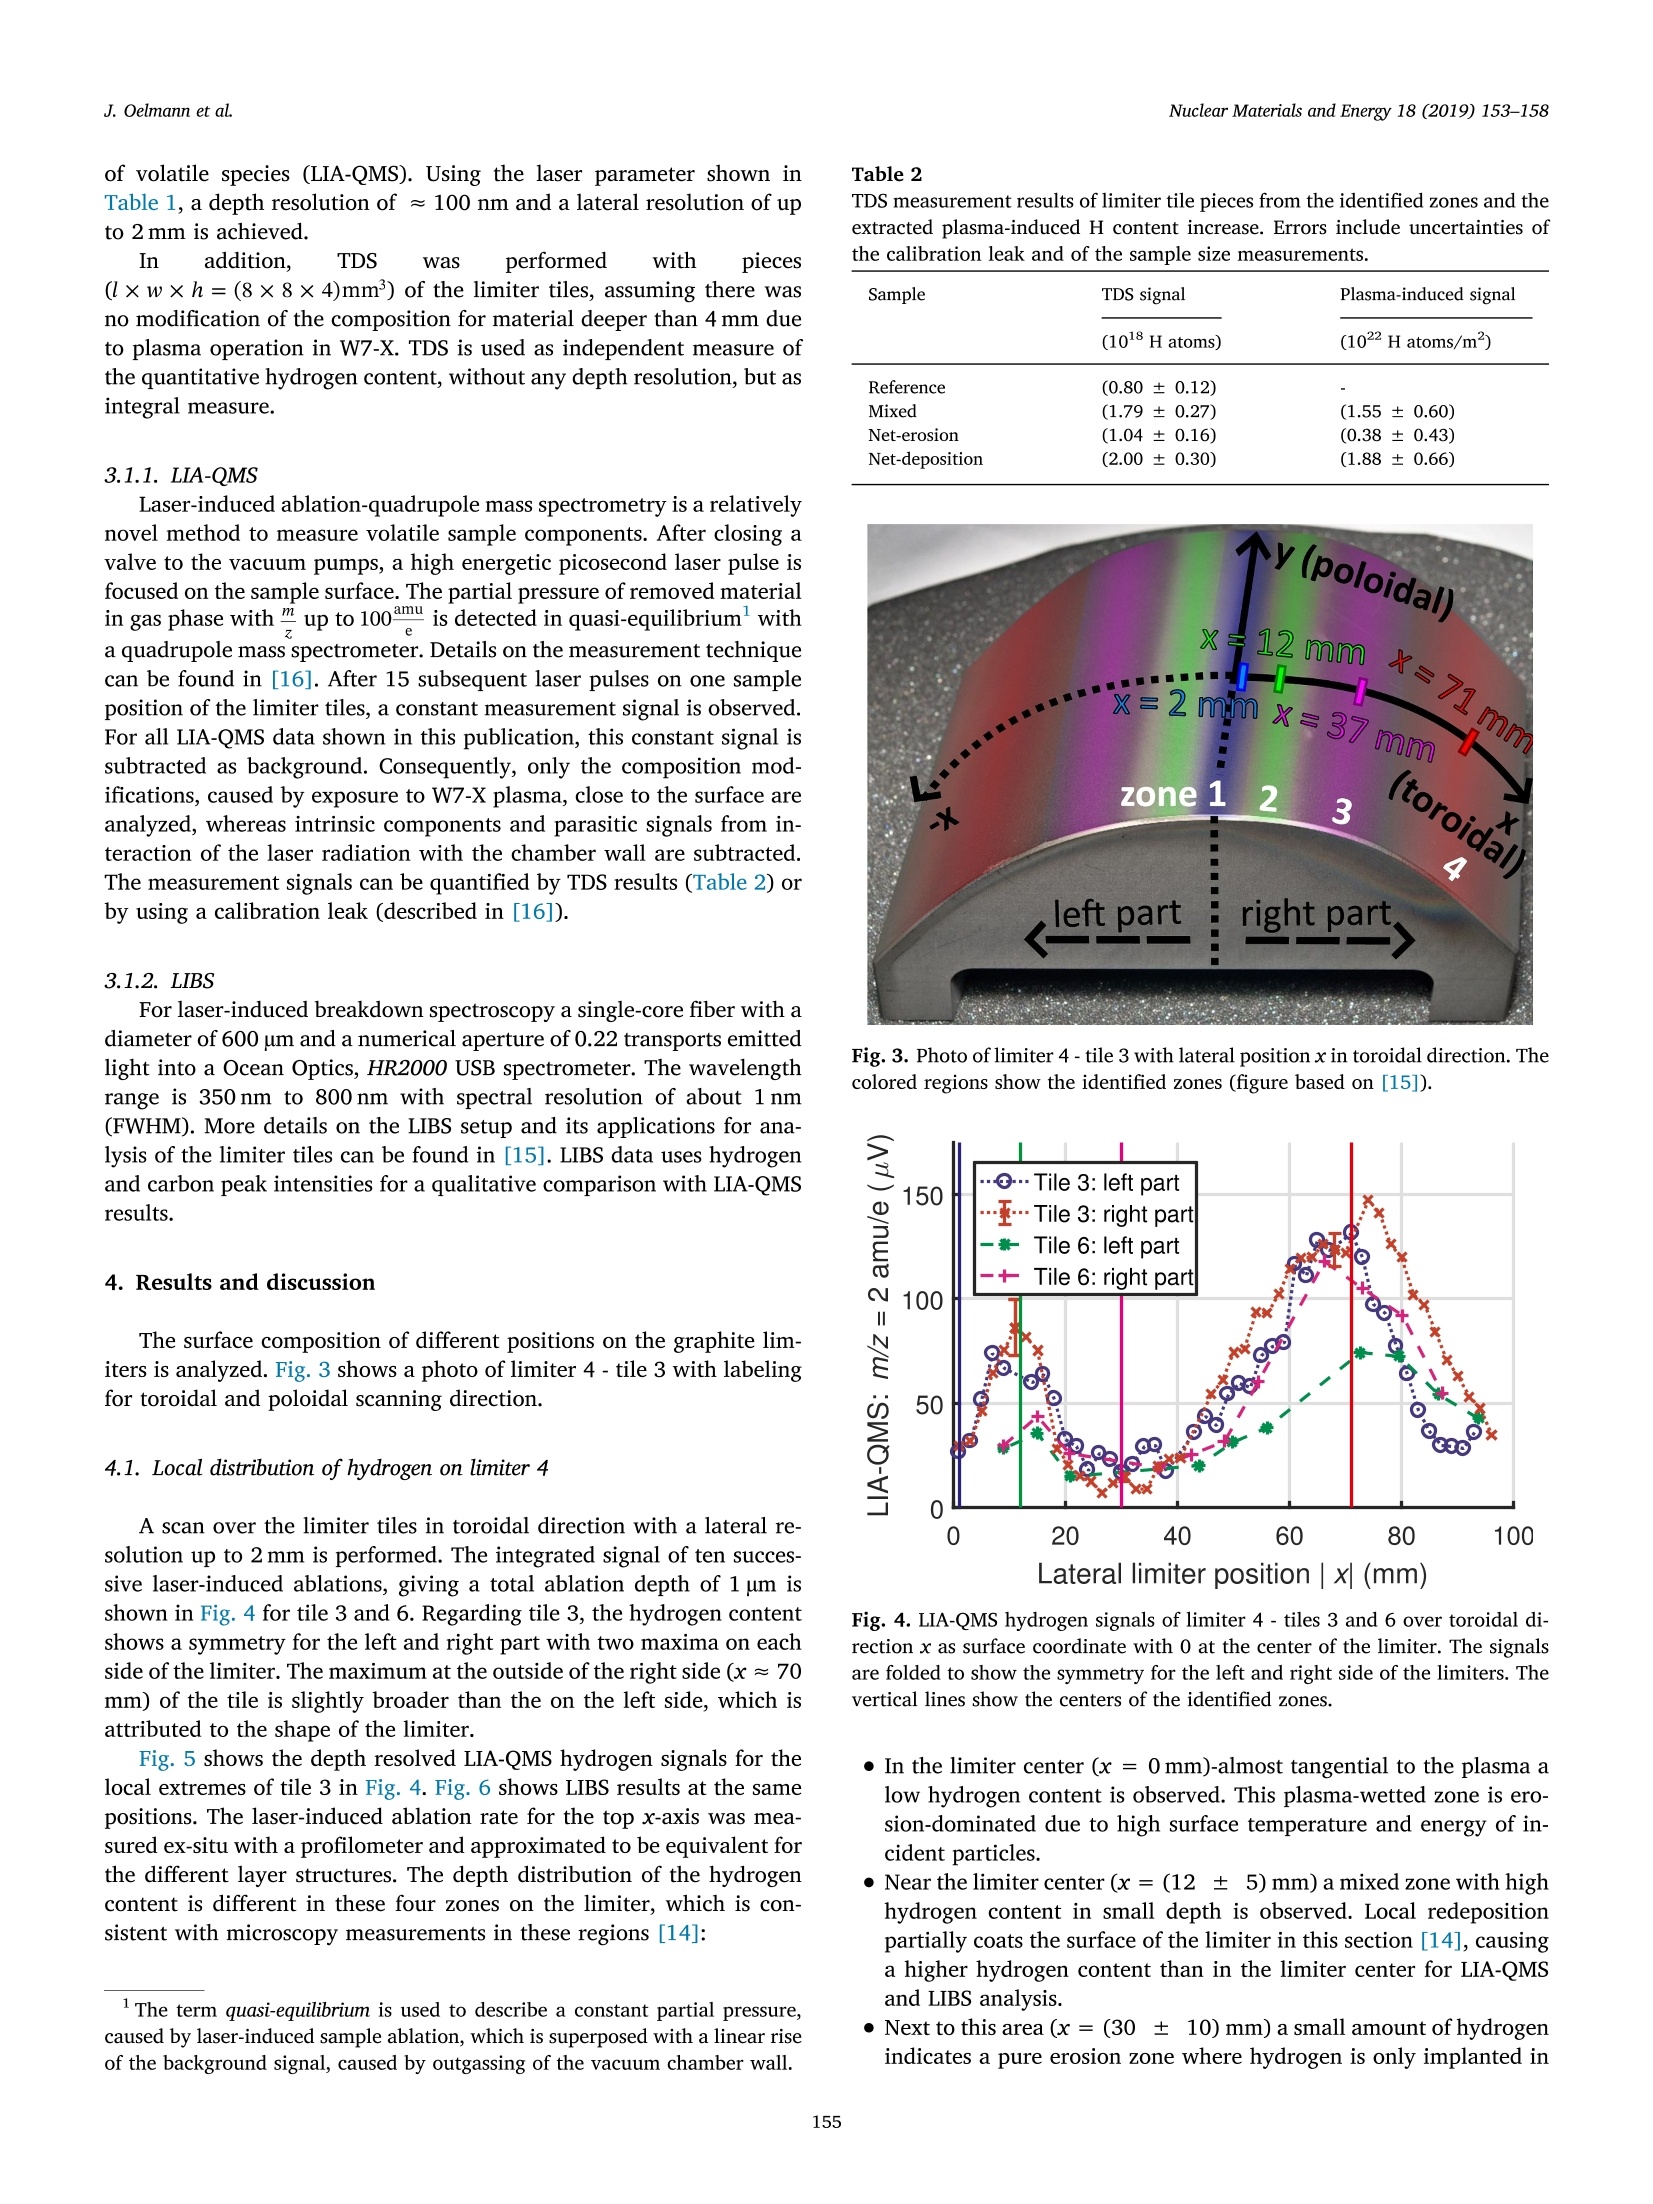
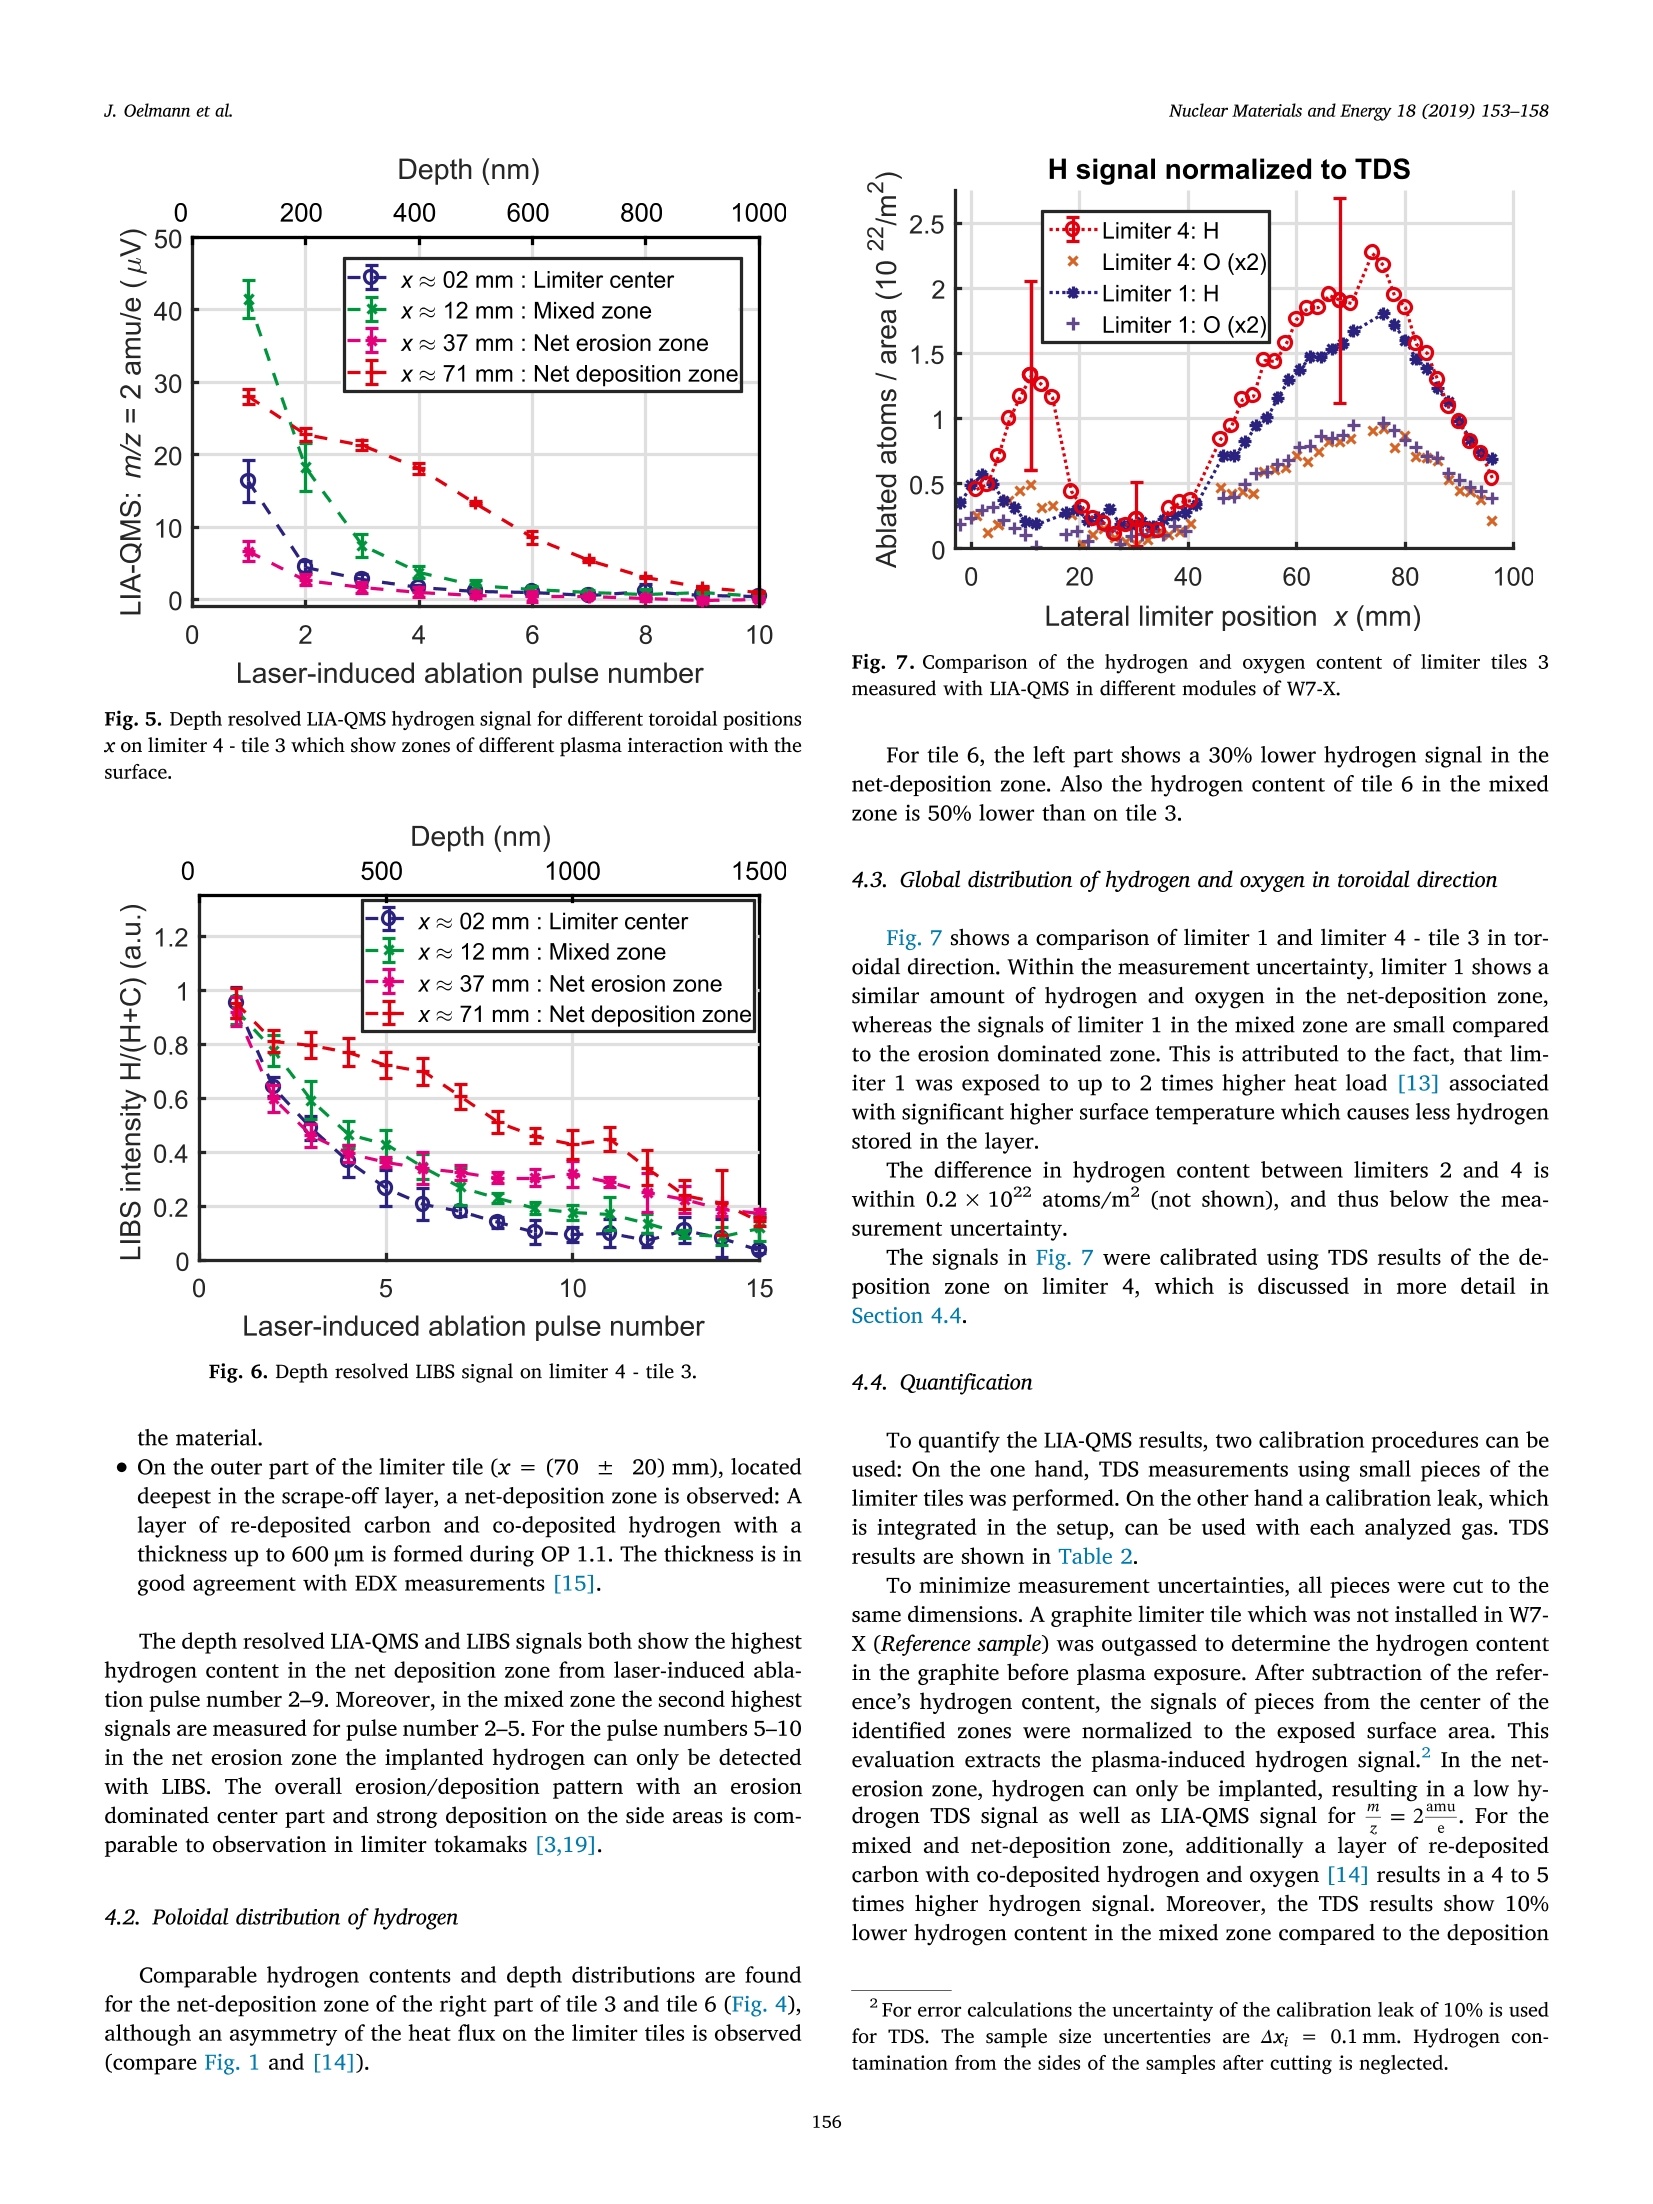
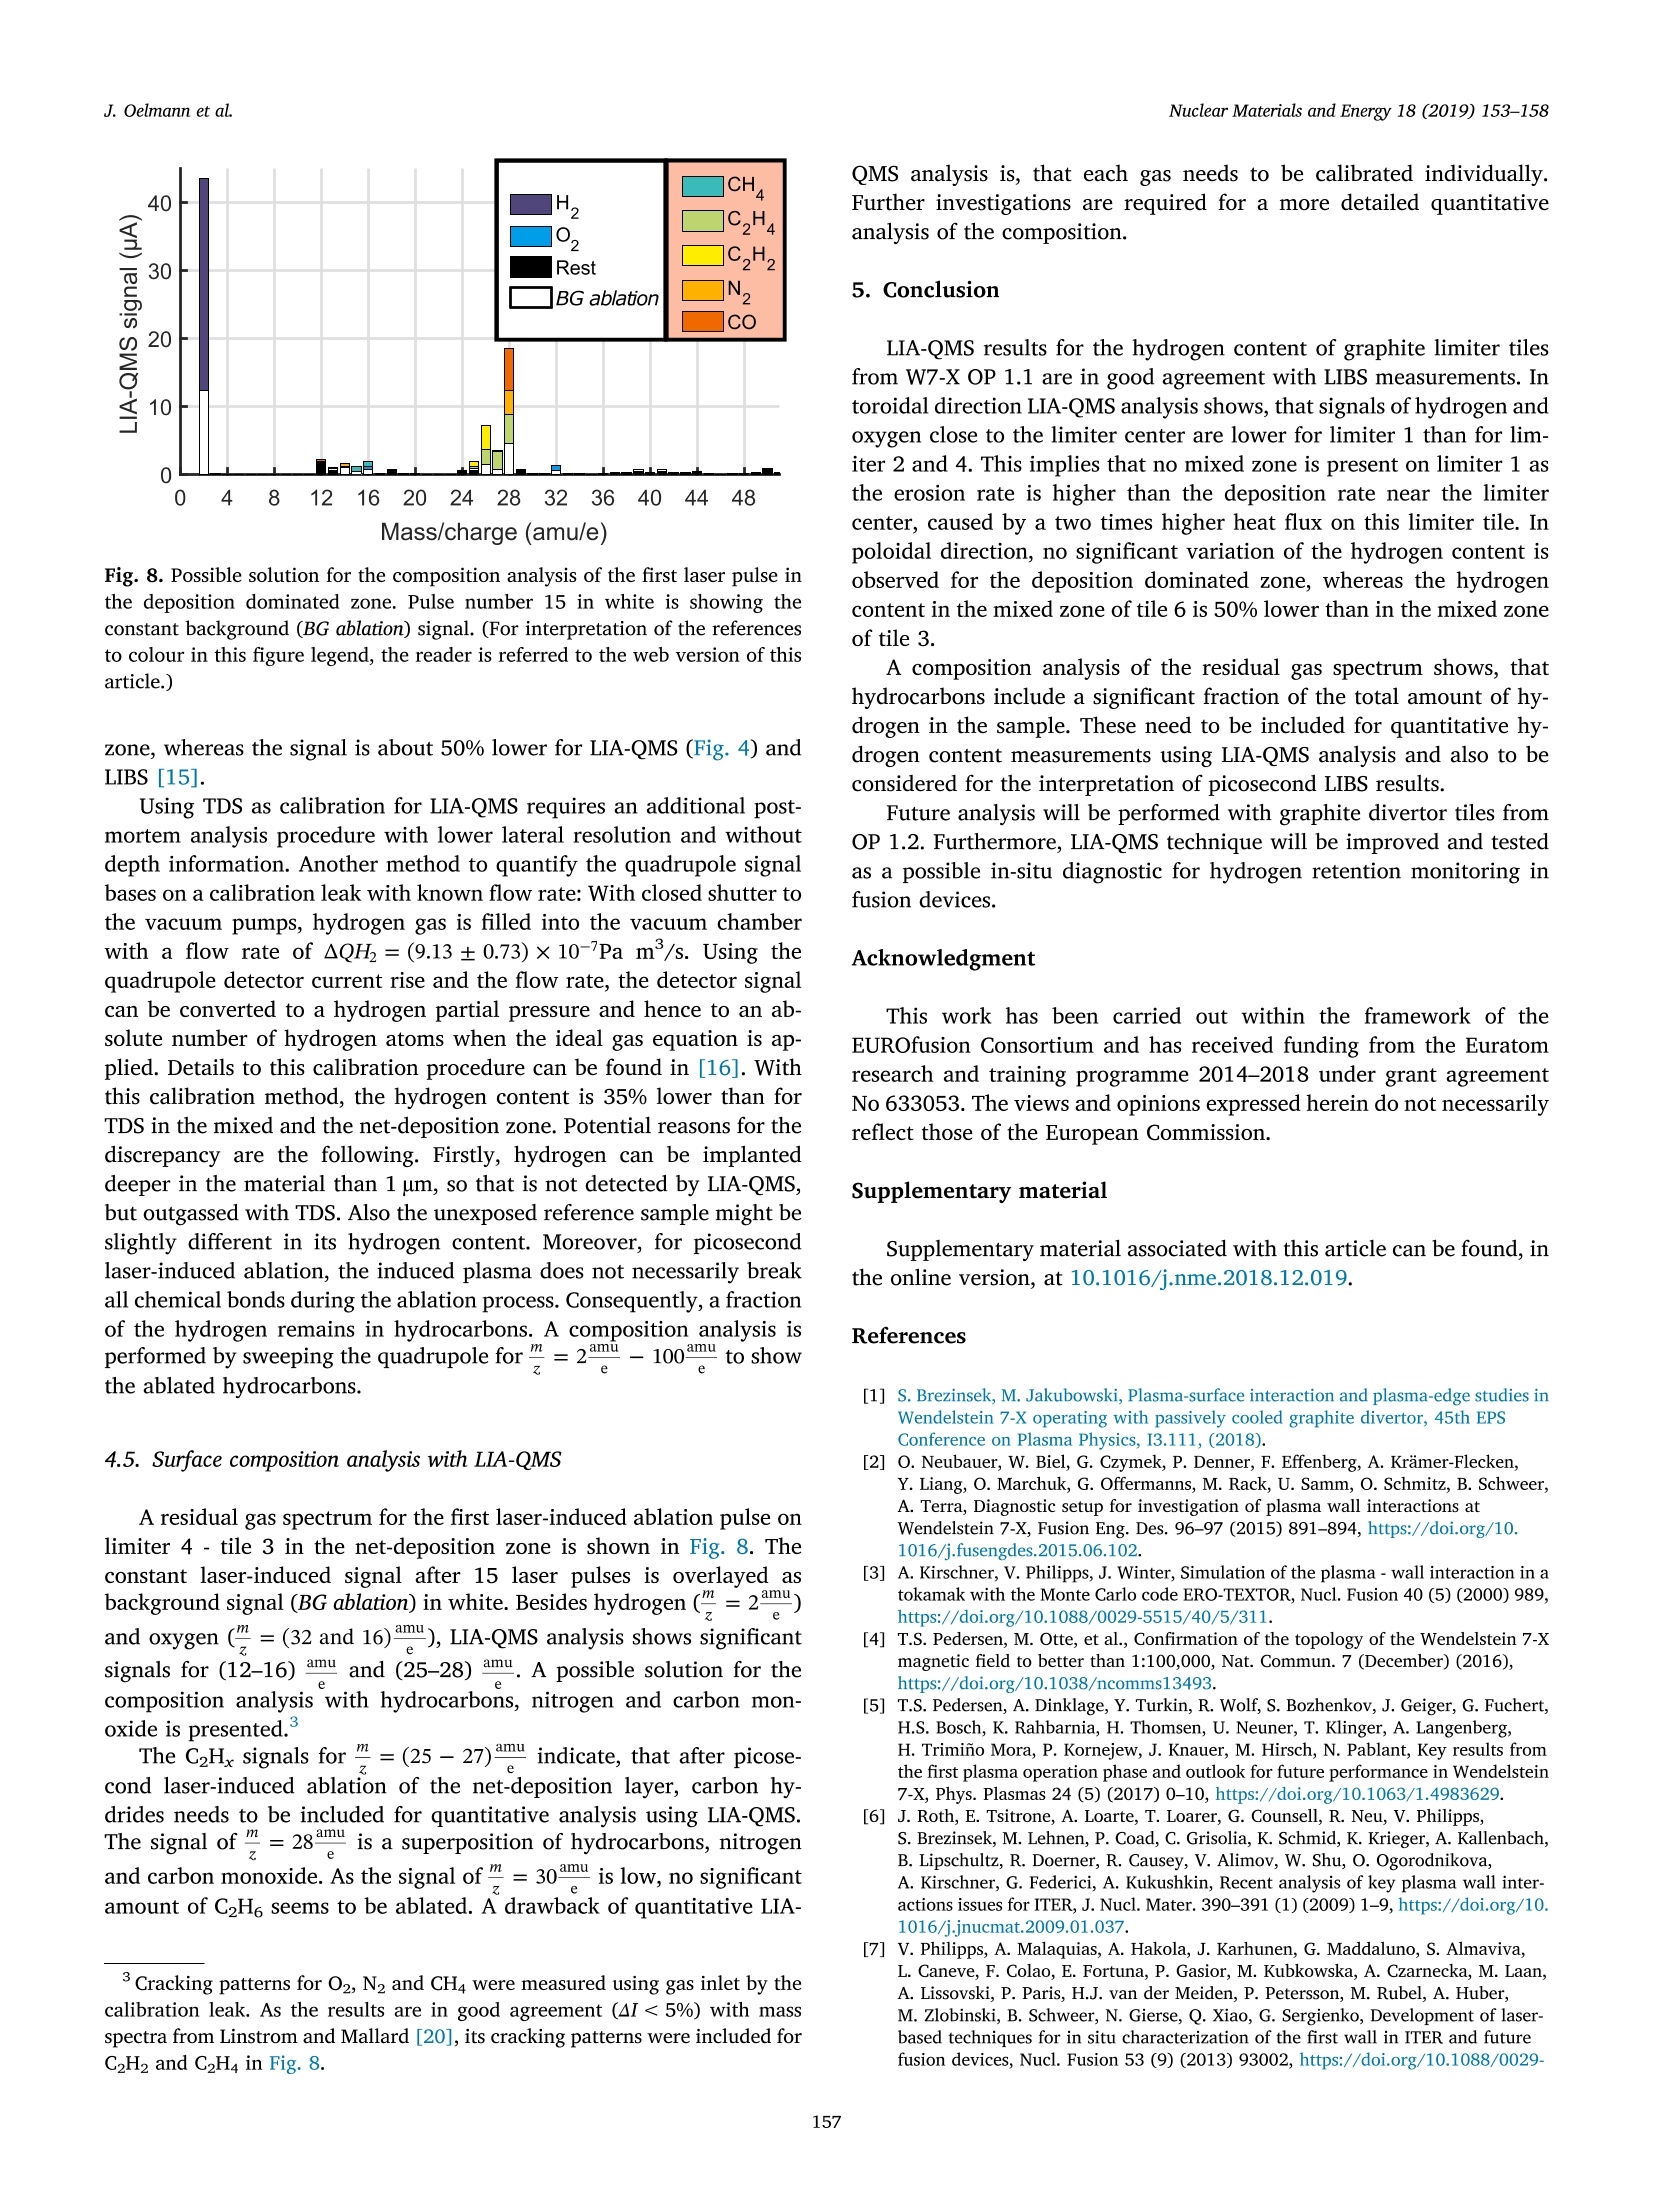
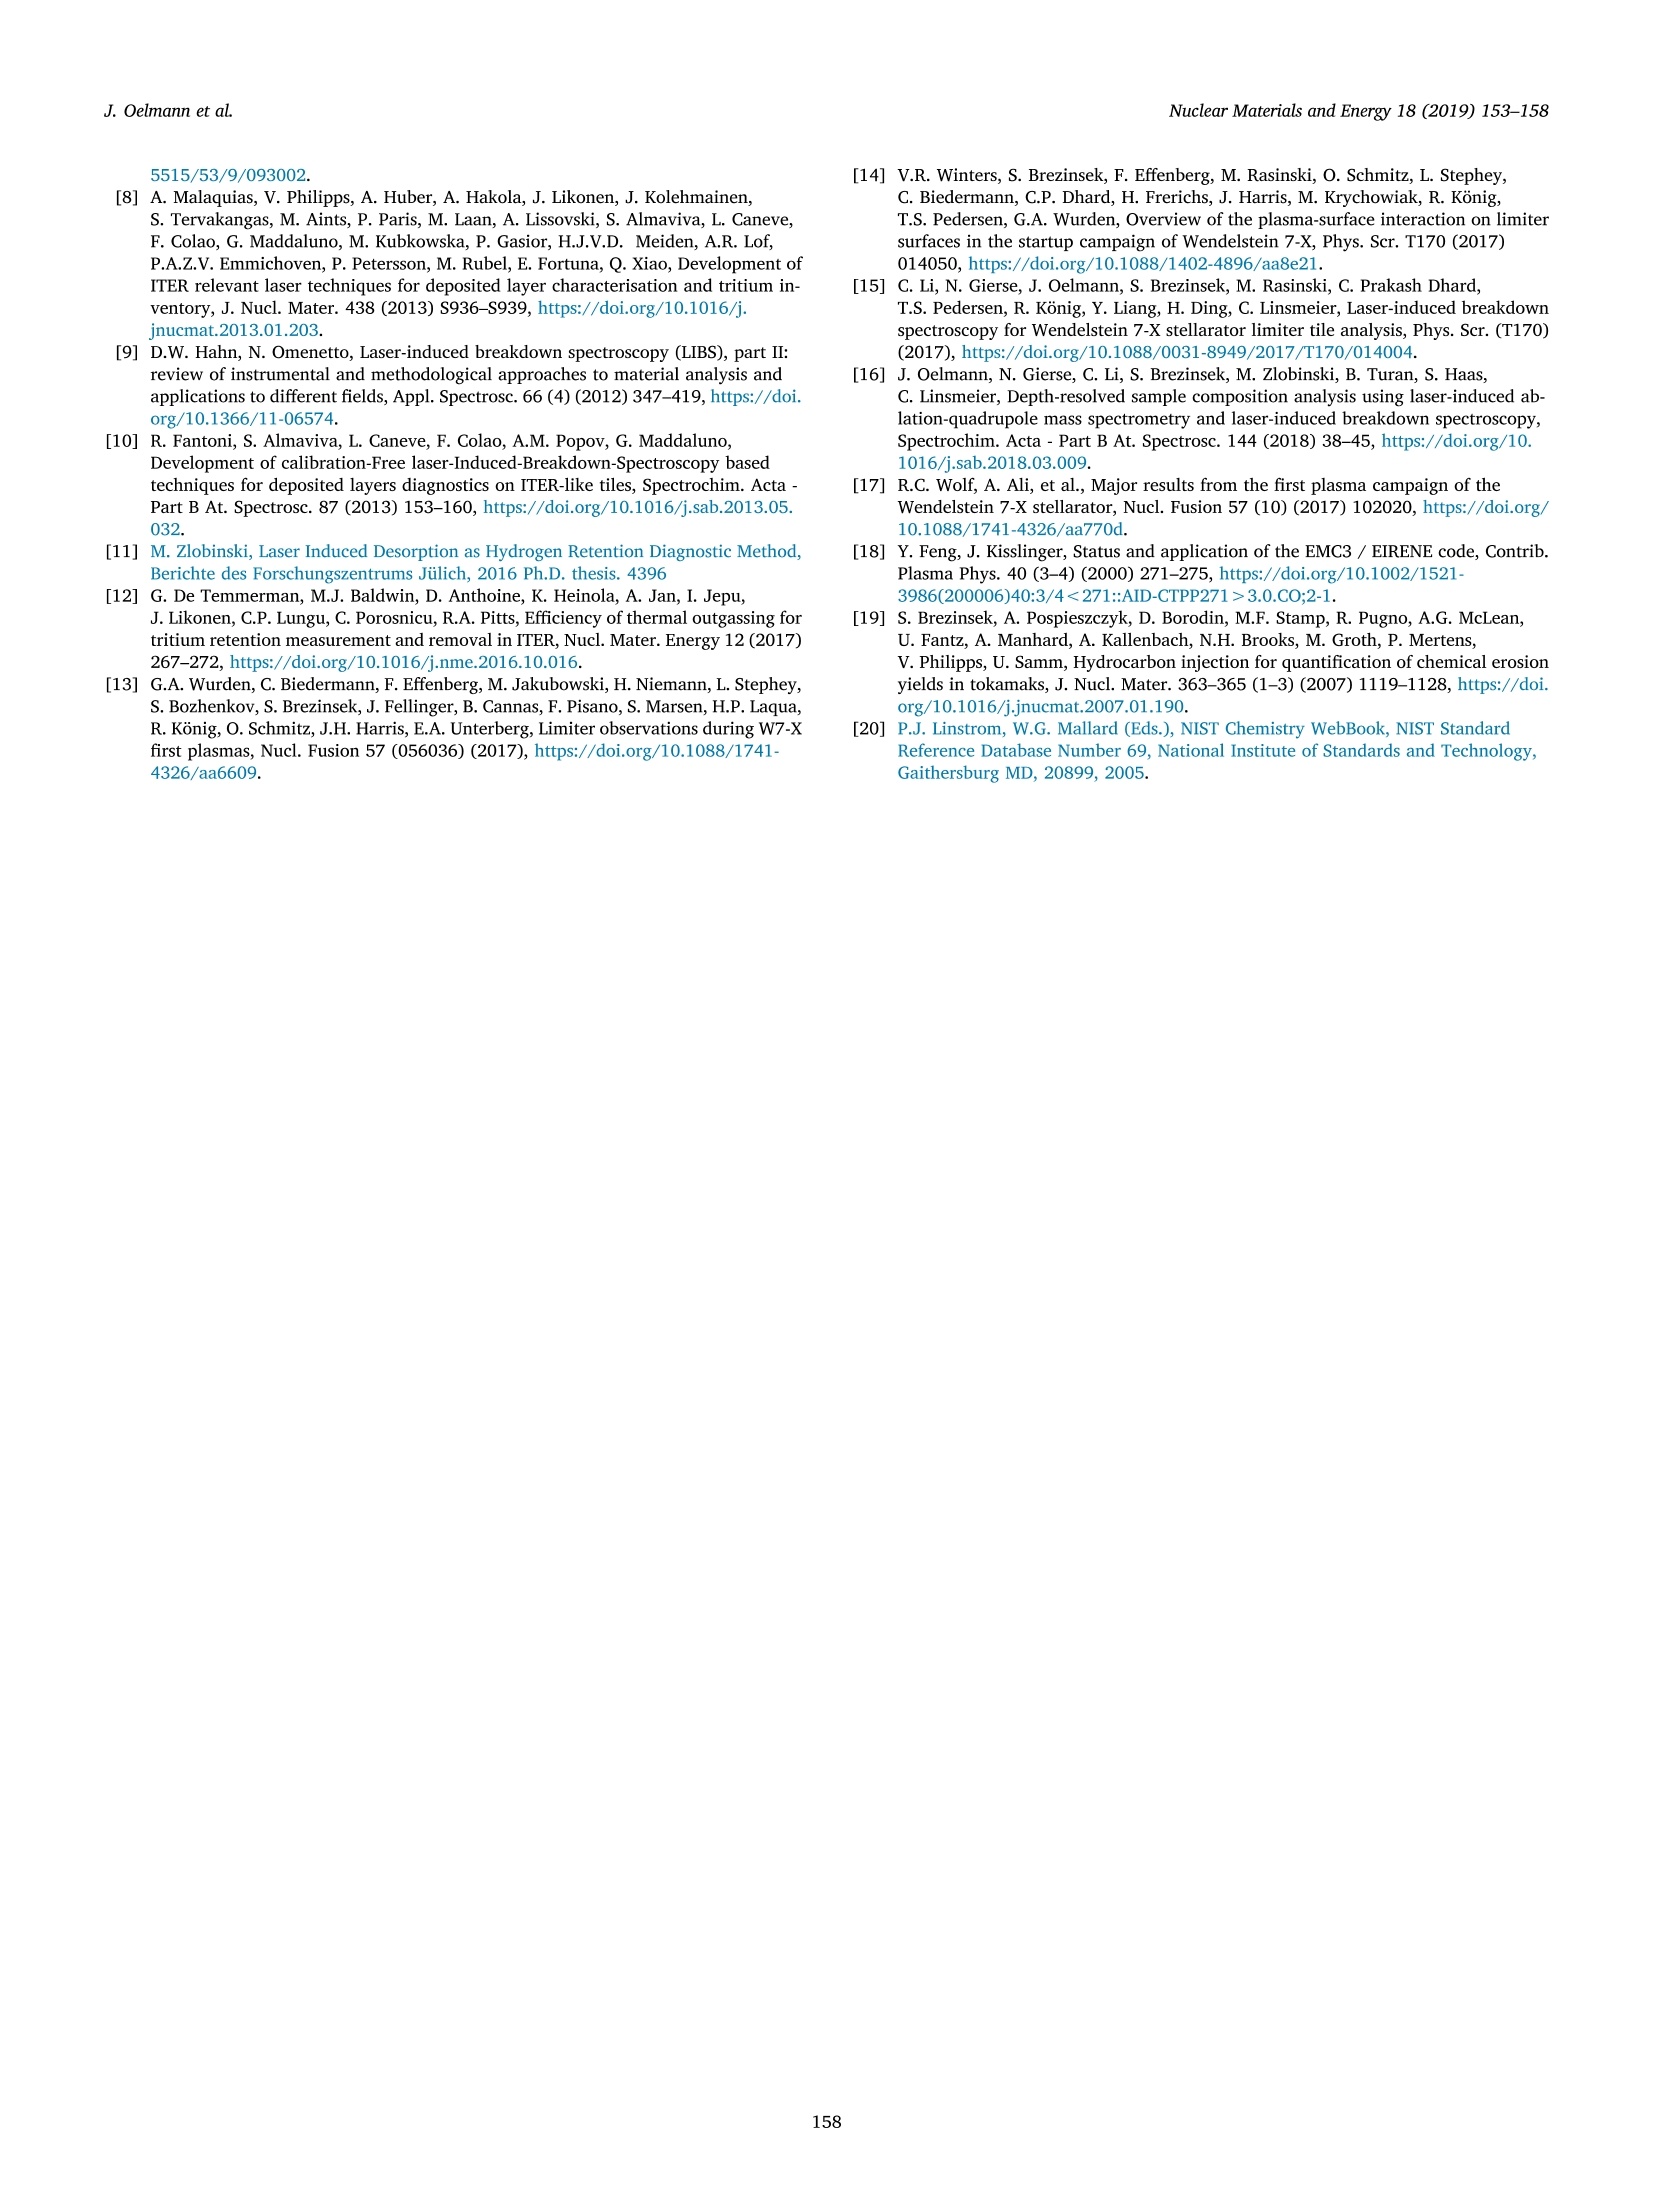
Nuclear Materials and Energy 18 (2019) 153-158Contents lists available at ScienceDirectjournal homepage: www.elsevier.com/locate/nme J. Oelmann et al.Nuclear Materials and Energy 18 (2019) 153-158 Nuclear Materials and Energy Depth resolved analysis of hydrogen in W7-X graphite components usinglaser-induced ablation-quadrupole mass spectrometry (LIA-QMS) Jannis Oelmann*, Cong Li,:Sebastijan Brezinsek, Marcin Rasinski,Chandra Prakash Dhard,Ralf Konig, Victoria Winters", Christian Linsmeier Forschungszentrum Jiilich GmbH, Institut fiir Energie-und Klimaforschung-Plasmaphysik, Partner of the Trilateral Euregio Cluster (TEC), Jiilich 52425, GermanyKey Laboratory of Materials Modification by Laser, Ion and Electron Beams, Chinese Ministry of Education, School of Physics, Dalian University of Technology, Dalian116024, PR China Max-Planck-Institut fir Plasmaphysik, Greifswald 17491, Germany “University of Wisconsin Madison, Department of Engineering Physics, Madison, WI, USA ARTICLEIN F O ABSTRACT Keywords: Laser-induced ablation A deep understanding of the plasma-wall interaction processes in fusion devices like Wendelstein 7-X is ne-cessary for an efficient plasma operation and a long lifetime of the plasma-facing components. Quadrupole mass spectrometry Laser-induced breakdown spectroscopy Graphite plasma-facing components Wendelstein 7-X Limiter In this work we present an approach employing residual gas analysis after picosecond laser-induced ablation(ps LIA-QMS) of graphite limiter tiles, exposed in the first plasma operational phase of Wendelstein 7-X, fordepth-resolved and quantitative hydrogen content analysis. A series of poloidal and toroidal locations areanalyzed at three of the five limiters, showing up to 2.3 ×10hydrogen atoms/m"in net-deposition areas aftera total plasma exposure of about 311 s in mixed hydrogen and helium operation.Shallow implantation ofhydrogen is observed in erosion zones, where a low fuel content is present due to the high surface temperatureduring plasma operation. The hydrogen content spans between (1.1 and 3.7)×102 hydrogen atoms/m in thenet-erosion areas. Moreover, oxygen has been analyzed and its appearance in both the implantation and de-position zone was verified. Results are compared to thermal desorption spectrometry and to simultaneouslyperformed laser-induced breakdown spectroscopy (LIBS) measurements. 1. Introduction Monitoring plasma-wall interaction processes like erosion, re-deposition, retention and outgassing in fusion devices like Wendelstein7-X (W7-X) is essential for the lifetime of the first wall as well as for abetter understanding of the fuel (hydrogen) retention [1-3]. This isespecially important for long-time discharges of up to 1800 s in the nextW7-X operation phases [4,5] and for future fusion reactors operatingwith tritium, where a sustainable fuel cycle is required and a inventorylimit for tritium will be present [6]. Using laser-based methods likeLaser-Induced Breakdown Spectroscopy (LIBS), in-situ as well as ex-situanalysis can be performed preparation free [7,8]. Still, the plasmaformation and its characteristic light emission are non-equilibriumprocesses, which impedes quantitative analysis of unknown materialcompositions, although Calibration-Free LIBS (CF-LIBS) analysis im-proved [9,10]. Most commonly used quantitative analysis methods like NuclearReaction Analysis (NRA) cannot give information about hydrogen, need detailed information about the sample composition (e.g. Secondary IonMass Spectrometry) or have no or poor depth resolution (e.g. ThermalDesorption Spectrometry (TDS)). Laser-induced desorption-quadrupolemass spectrometry (LID-QMS) [11] bases on desorption of volatilesample components by laser-induced material heating. It is currentlyproposed as in-situ tritium monitor in reactor devices like ITER [12],but has poor depth resolution due to heat diffusion into the surroundingmaterial. Post mortem analysis of graphite limiter tiles from the initial op-erational phase of W7-X in limiter configuration (OP 1.1) [13] has beenperformed recently: Scanning electron microscopy (SEM) with FocusedIon Beam (FIB) and Energy Dispersive X-ray (EDX) analysis showsdifferent surface structures, owing to local re-deposition (rough) andbackground deposition (smooth) [14]. LIBS analysis in toroidal direc-tion of the limiter showed a higher hydrogen content at the outer partsof the limiter [15] as eroded carbon from the central part is re-de-posited in this regions with co-deposition of oxygen and hydrogen. We present additional information on these limiter tiles using the ( E-mail address: j.o e lmann@fz- ju elich.de (J.Oelmann). ) ( https://doi.org/ 1 0.1016/ j .nme.2018. 1 2.019 ) ( Received 3 1 July 2018; Received in revised form 2 December 2 018; Accepted 15 December 2018 ) ( 2352-1791/C 2018 Published by Elsevier Ltd. This is an open access article under the CC BY-NC-ND license ) ( (http://creativecommons.org/licenses/BY-NC-ND/4.0/). ) technique of picosecond Laser-induced ablation-quadrupole massspectrometry (LIA-QMS) [16]. It is one of a limited number of post-mortem analysis diagnostics which allows quantitative and depth-re-solved information of the hydrogen content in graphite components. Asa residual gas analysis, only volatile sample components can be de-tected, which is why LIBS is performed simultaneously in one setup.Compared to LID-QMS, the ablation process in the presented picose-cond LIA-QMS method gives depth-resolved information and theplasma formation enables spectroscopic measurements. This contribution consists of five sections: The introduction is fol-lowed by information concerning samples from W7-X and plasma ex-posure conditions (Section 2). The combined setup for LIBS and LIA-QMS as well as details to these techniques are presented in Section 3.Limiter tile analysis results comparing three different limiters in po-loidal and toroidal direction and a discussion are shown in Section 4.Finally, a conclusion is given in Section 5. 2. Samples In operation phase 1.1, five equivalent graphite limiters were in-stalled in W7-X [13]. They were exposed to helium and hydrogenplasmas with a total exposure time of about 311 s [17]. Each limiterconsists of nine tiles. The analyzed positions with their labels are shownin Fig. 1. The overlay shows a simulation of EMC3-EIRENE code [18]for the heat flux in a standard magnetic configuration of W7-X hy-drogen plasma.Two stripes of high heat fluxes in poloidal direction areobserved on the limiter. Their maxima are detected on tiles 3 and 6 forthe left and right side of the limiter respectively. The simulation pre-dicts an asymmetry in toroidal direction of one limiter tile due to theimposed magnetic field structure with different connection lengths[13]. Moreover, an asymmetry on one limiter in poloidal direction ispredicted. Fig. 1. Photo of limiter modules 5 to 1 (left to right), each containing nine tiles.Analyzed tiles are marked in red. On limiter 4 a simulation of the heat flux(EMC3-EIRENE code [13]) owing to electron and ion impact is overlayed. (Forinterpretation of the references to colour in this figure legend, the reader isreferred to the web version of this article.) Fig. 2. Schematic overview of the setup: Single picosecond laser pulses are usedto successive ablate a sample in a vacuum chamber. A combination of LIBS andQMS is used to measure the sample’s composition. For a residual gas analysisand the calibration of the quadrupole mass spectrometer a valve to the vacuumpumps is closed (figure based on [16]). Here, we use the hydrogen content in the tiles to study if theasymmetries in the impinging ion and heat flux can be observed bypost-mortem analysis techniques. Additionally, a comparison of lim-iter 1, 2 and 4 is shown, as limiter 1 was positioned slightly deeper intothe plasma and received higher heat loads [13]. 3. Experimental setup The experimental setup for picosecond laser-induced ablation usinga Nd:YVO4 laser by EKSPLA is shown in Fig. 2. The samples aremounted on a x-, y-,d-stage in a vacuum chamber with a base pressureof p=1×10⁻⁷mbar. The limiter tiles are cut into 7 pieces to reduce achange of the laser fluence caused by its curved surface. This results inan angle between the laser pulses and the samples surface of 90°± 5°.An increase of the laser spot size is neglected. To perform residual gasanalysis after single shot laser-induced ablation (LIA-QMS), a valve tothe vacuum pumps can be closed. Simultaneously, LIBS is performedwith an observation angle of 85°. The focal lengths of the biconvexcollimation lens and the planoconvex focusing lens are f=100 mm andf=500 mm respectively. Applied laser parameter and settings areshown in Table 1. 3.1. Diagnostics With the setup shown in Fig. 2, LIA-QMS and LIBS are performedsimultaneously to get sample composition information from char-acteristic line radiation (LIBS) with additional quantitative information Table 1 Overview of the laser parameter and settings used for the single shot analysis ofW7-X graphite limiter tiles. Laser wavelength: = 355 nm Pulse duration: =35ps Pulse energy: E, =25mJ Spot diameter at sample: dz = 700 um Average laser fluence: Fr =6.5 of volatile species (LIA-QMS). Using the laser parameter shown inTable 1, a depth resolution of ≈ 100 nm and a lateral resolution of upto 2 mm is achieved. In addition, TDS Was performed with pieces(l×w×h=(8×8×4)mm) of the limiter tiles, assuming there wasno modification of the composition for material deeper than 4 mm dueto plasma operation in W7-X. TDS is used as independent measure ofthe quantitative hydrogen content, without any depth resolution, but asintegral measure. 3.1.1. LIA-QMS Laser-induced ablation-quadrupole mass spectrometry is a relativelynovel method to measure volatile sample components. After closing avalve to the vacuum pumps, a high energetic picosecondlaser pulse isfocused on the sample surface. The partial pressure of removed materialin gas phase with "up to 100amu is detected in quasi-equilibriumwitha quadrupole mass spectrometer. Details on the measurement techniquecan be found in [16]. After 15 subsequent laser pulses on one sampleposition of the limiter tiles, a constant measurement signal is observed.For all LIA-QMS data shown in this publication, this constant signal issubtracted as background. Consequently, only the composition mod-ifications, caused by exposure to W7-X plasma, close to the surface areanalyzed, whereas intrinsic components and parasitic signals from in-teraction of the laser radiation with the chamber wall are subtracted.The measurement signals can be quantified by TDS results (Table 2) orby using a calibration leak (described in [16]). 3.1.2. LIBS For laser-induced breakdown spectroscopy a single-core fiber with adiameter of 600 um and a numerical aperture of 0.22 transports emittedlight into a Ocean Optics, HR2000 USB spectrometer. The wavelengthrange is 350 nm to 800 nm with spectral resolution of about 1 nm(FWHM). More details on the LIBS setup and its applications for ana-lysis of the limiter tiles can be found in [15]. LIBS data uses hydrogenand carbon peak intensities for a qualitative comparison with LIA-QMSresults. 4. Results and discussion The surface composition of different positions on the graphite lim-iters is analyzed. Fig. 3 shows a photo of limiter 4- tile 3 with labelingfor toroidal and poloidal scanning direction. 4.1. Local distribution of hydrogen on limiter 4 A scan over the limiter tiles in toroidal direction with a lateral re-solution up to 2 mm is performed. The integrated signal of ten succes-sive laser-induced ablations, giving a total ablation depth of 1 um isshown in Fig. 4 for tile 3 and 6. Regarding tile 3, the hydrogen contentshows a symmetry for the left and right part with two maxima on eachside of the limiter. The maximum at the outside of the right side (x70mm) of the tile is slightly broader than the on the left side, which isattributed to the shape of the limiter. Fig. 5 shows the depth resolved LIA-QMS hydrogen signals for thelocal extremes of tile 3 in Fig. 4. Fig. 6 shows LIBS results at the samepositions. The laser-induced ablation rate for the top x-axis was mea-sured ex-situ with a profilometer and approximated to be equivalent forthe different layer structures. The depth distribution of the hydrogencontent is different in these four zones on the limiter, which is con-sistent with microscopy measurements in these regions [14]: ( T he te r m quasi-equilibrium is us e d to describe a c o n s tant partial pre s sure, caused by laser-induced sample ablation, which is superposed with a linear rise of the background signal, caused b y outgassing of the vacuum cha m ber wall. ) Table 2 TDS measurement results of limiter tile pieces from the identified zones and theextracted plasma-induced H content increase. Errors include uncertainties ofthe calibration leak and of the sample size measurements. Sample TDS signal Plasma-induced signal (1018 H atoms) (1022 H atoms/m²) Reference (0.80±0.12) Mixed (1.79±0.27) (1.55±0.60) Net-erosion (1.04±0.16) (0.38±0.43) Net-deposition (2.00±0.30) (1.88±0.66) Fig. 3. Photo of limiter 4-tile 3 with lateral position x in toroidal direction. Thecolored regions show the identified zones (figure based on [15]). Lateral limiter position|x| (mm) Fig. 4. LIA-QMS hydrogen signals of limiter 4-tiles 3 and 6 over toroidal di-rection x as surface coordinate with 0 at the center of the limiter. The signalsare folded to show the symmetry for the left and right side of the limiters. Thevertical lines show the centers of the identified zones. In the limiter center (x =0 mm)-almost tangential to the plasma alow hydrogen content is observed. This plasma-wetted zone is ero-sion-dominated due to high surface temperature and energy of in-cident particles. ·Near the limiter center(x=(12 ± 5) mm) a mixed zone with highhydrogen content in small depth is observed. Local redepositionpartially coats the surface of the limiter in this section [14], causinga higher hydrogen content than in the limiter center for LIA-QMSand LIBS analysis. ·Next to this area (x= (30 ±10)mm) a small amount of hydrogenindicates a pure erosion zone where hydrogen is only implanted in Laser-induced ablation pulse number Fig. 5. Depth resolved LIA-QMS hydrogen signal for different toroidal positionsx on limiter 4-tile 3 which show zones of different plasma interaction with thesurface. Fig. 6. Depth resolved LIBS signal on limiter 4- tile 3. the material. ·On the outer part of the limiter tile (x= (70± 20) mm), locateddeepest in the scrape-off layer, a net-deposition zone is observed: Alayer of re-deposited carbon and co-deposited hydrogen with athickness up to 600 um is formed during OP 1.1. The thickness is ingood agreement with EDX measurements [15]. The depth resolved LIA-QMS and LIBS signals both show the highesthydrogen content in the net deposition zone from laser-induced abla-tion pulse number 2-9. Moreover, in the mixed zone the second highestsignals are measured for pulse number 2-5. For the pulse numbers 5-10in the net erosion zone the implanted hydrogen can only be detectedwith LIBS. The overall erosion/deposition pattern with an erosiondominated center part and strong deposition on the side areas is com-parable to observation in limiter tokamaks [3,19]. 4.2. Poloidal distribution of hydrogen Comparable hydrogen contents and depth distributions are foundfor the net-deposition zone of the right part of tile 3 and tile 6 (Fig. 4),although an asymmetry of the heat flux on the limiter tiles is observed(compare Fig. 1 and [14]). Lateral limiter position x(mm) Fig.7. Comparison of the hydrogen and oxygen content of limiter tiles 3measured with LIA-QMS in different modules of W7-X. For tile 6, the left part shows a 30% lower hydrogen signal in thenet-deposition zone. Also the hydrogen content of tile 6 in the mixedzone is 50% lower than on tile 3. 4.3. Global distribution of hydrogen and oxygen in toroidal direction Fig. 7 shows a comparison of limiter 1 and limiter 4 -tile 3 in tor-oidal direction. Within the measurement uncertainty, limiter 1 shows asimilar amount of hydrogen and oxygen in the net-deposition zone,whereas the signals of limiter 1 in the mixed zone are small comparedto the erosion dominated zone. This is attributed to the fact, that lim-iter 1 was exposed to up to 2 times higher heat load [13] associatedwith significant higher surface temperature which causes less hydrogenstored in the layer. The difference in hydrogen content between limiters 2 and 4 iswithin 0.2×10²² atoms/m²(not shown), and thus below the mea-surement uncertainty. The signals in Fig. 7 were calibrated using TDS results of the de-position zone on limiter 4, which is discussed in more detail inSection 4.4. 4.4. Quantification To quantify the LIA-QMS results, two calibration procedures can beused: On the one hand, TDS measurements using small pieces of thelimiter tiles was performed.On the other hand a calibration leak, whichis integrated in the setup, can be used with each analyzed gas. TDSresults are shown in Table 2. To minimize measurement uncertainties, all pieces were cut to thesame dimensions. A graphite limiter tile which was not installed in W7-X (Reference sample) was outgassed to determine the hydrogen contentin the graphite before plasma exposure.After subtraction of the refer-ence’s hydrogen content, the signals of pieces from the center of theidentified zones were normalized to the exposed surface area. Thisevaluation extracts the plasma-induced hydrogen signal. In the net-erosion zone, hydrogen can only be implanted, resulting in a low hy-drogen TDS signal as well as LIA-QMS signal forZ =2amu. For themixed and net-deposition zone, additionally a layer of re-depositedcarbon with co-deposited hydrogen and oxygen [14] results in a 4 to 5times higher hydrogen signal. Moreover, the TDS results show 10%lower hydrogen content in the mixed zone compared to the deposition ( For error calculations t he u ncertainty of the calibration l eak of 10% is u sedfor TDS. T he sample s i ze u n certenties a re A x; = 0.1 mm. Hydrogen con-tamination f r om th e si d es of the sa m ples aft e r cutting is neglected. ) Fig. 8. Possible solution for the composition analysis of the first laser pulse inthe deposition dominated zone. Pulse number 15 in white is showing theconstant background (BG ablation) signal.(For interpretation of the referencesto colour in this figure legend, the reader is referred to the web version of thisarticle.) zone, whereas the signal is about 50%lower for LIA-QMS (Fig.4) andLIBS [15]. Using TDS as calibration for LIA-QMS requires an additional post-mortem analysis procedure with lower lateral resolution and withoutdepth information. Another method to quantify the quadrupole signalbases on a calibration leak with known flow rate: With closed shutter tothe vacuum pumps, hydrogen gas is filled into the vacuum chamberwith a flow rate of AQH=(9.13±0.73)×10-7Pa m/s. Using thequadrupole detector current rise and the flow rate, the detector signalcan be converted to a hydrogen partial pressure and hence to an ab-solute number of hydrogen atoms when the ideal gas equation is ap-plied. Details to this calibration procedure can be found in [16]. Withthis calibration method, the hydrogen content is 35% lower than forTDS in the mixed and the net-deposition zone. Potential reasons for thediscrepancy are the following. Firstly, hydrogen can be implanteddeeper in the material than 1 um, so that is not detected by LIA-QMS,but outgassed with TDS. Also the unexposed reference sample might beslightly different in its hydrogen content. Moreover, for picosecondlaser-induced ablation, the induced plasma does not necessarily breakall chemical bonds during the ablation process. Consequently, a fractionof the hydrogen remains in hydrocarbons. A composition analysis isperformed by sweeping the quadrupole for =2amu- 100amu tto showthe ablated hydrocarbons. 4.5. Surface composition analysis with LIA-QMS A residual gas spectrum for the first laser-induced ablation pulse onlimiter 4- tile 3 in the net-deposition zone is shown in Fig.8. Theconstant laser-induced signal after 15 laser pulses is overlayed asbackground signal (BG ablation) in white. Besides hydrogen (" =2mu)and oxygen ("=(32 and 16)am), LIA-QMS analysis shows significantsignals for (12-16) amu and (25-28) amu. A possible solution for thee ecomposition analysis with hydrocarbons, nitrogen and carbon mon-oxide is presented. The C2Hx signals for =(25-27)amu indicate, that after picose-cond laser-induced ablation of the net-deposition layer,carbon hy-drides needs to be included for quantitative analysis using LIA-QMS.The signal of =28 is a superposition of hydrocarbons, nitrogenand carbon monoxide. As the signal of "=30amu is low, no significantamount of C2H6 seems to be ablated. A drawback of quantitative LIA- ( C racking patterns for O 2, N2 and CH4 were measured using gas inlet by the calibration leak. As the results are in good agreeme n t (AI<5%) with mass spectra from L i nstrom and Ma l lard [20 ] , it s cracking patterns were included forC2H2 and C2H4 i n F ig. 8 . ) QMS analysis is, that each gas needs to be calibrated individually.Further investigations are required for a more detailed quantitativeanalysis of the composition. 5. Conclusion LIA-QMS results for the hydrogen content of graphite limiter tilesfrom W7-X OP 1.1 are in good agreement with LIBS measurements. Intoroidal direction LIA-QMS analysis shows, that signals of hydrogen andoxygen close to the limiter center are lower for limiter 1 than for lim-iter 2 and 4. This implies that no mixed zone is present on limiter 1 asthe erosion rate is higher than the deposition rate near the limitercenter, caused by a two times higher heat flux on this limiter tile. Inpoloidal direction, no significant variation of the hydrogen content isobserved for the deposition dominated zone, whereas the hydrogencontent in the mixed zone of tile 6 is 50% lower than in the mixed zoneof tile 3. A composition analysis of the residual gas spectrum shows, thathydrocarbons include a significant fraction of the total amount of hy-drogen in the sample. These need to be included for quantitative hy-drogen content measurements using LIA-QMS analysis and also to beconsidered for the interpretation of picosecond LIBS results. Future analysis will be performed with graphite divertor tiles fromOP 1.2. Furthermore, LIA-QMS technique will be improved and testedas a possible in-situ diagnostic for hydrogen retention monitoring infusion devices. Acknowledgment This work has been carried out within the framework of theEUROfusion Consortium and has received funding from the Euratomresearch and training programme 2014-2018 under grant agreementNo 633053. The views and opinions expressed herein do not necessarilyreflect those of the European Commission. Supplementary material Supplementary material associated with this article can be found, inthe online version, at 10.1016/j.nme.2018.12.019. References ( [1] S . Brez i nsek, M. Jakubowski, P las m a-surface interaction and plasma-edge stud i es in W endelstein 7 - X o p erating with passively c o oled g r aphite dive r to r , 45th EP S Conference on P la s ma P h ysics, I 3. 1 11, ( 2018). ) ( [2] O ( . Neubauer, W . Biel, G . Czymek, P. Denner, F. Ef f enberg, A. Kramer-Flecken, Y . L iang, O. M archuk, G . Offermanns, M. Ra c k, U. Sa m m, O. Schmitz, B. S c hweer,A. T erra, Diagnostic setup f or investigation of plasma wall interactions atWendelstein 7-X, Fusion Eng. D es. 9 6-97 (2015) 891-894, htt ps:// doi .org/10. 1 016/ j . f usengdes.2015.0 6 . 1 02. ) ( [3] A . Kirschner, V. P h ilipps, J . Winter, Simulation of the plasma- wall inte r action in a tokamak with the Monte Carlo code ERO-TEXTOR, Nucl. Fusion 40 (5) (2000) 989, h ttps: // doi.org/10.1088/0029-5515/40/5/311 . ) [4] T.S. Pedersen, M. Otte, et al.,Confirmation of the topology of the Wendelstein 7-Xmagnetic field to better than 1:100,000, Nat. Commun. 7 (December) (2016),https://doi.org/10.1038/ncomms13493. [5] T.S. Pedersen, A. Dinklage, Y.Turkin, R. Wolf, S. Bozhenkov, J. Geiger, G. Fuchert,H.S. Bosch, K. Rahbarnia, H. Thomsen, U. Neuner, T. Klinger, A. Langenberg,H. Trimino Mora, P. Kornejew, J. Knauer, M. Hirsch, N. Pablant, Key results fromthe first plasma operation phase and outlook for future performance in Wendelstein7-X, Phys. Plasmas 24 (5)(2017) 0-10, https://doi.org/10.1063/1.4983629. [6] J. Roth, E. Tsitrone, A. Loarte, T. Loarer, G. Counsell, R. Neu, V. Philipps,S. Brezinsek, M. Lehnen,P. Coad,C. Grisolia, K. Schmid, K. Krieger, A. Kallenbach,B. Lipschultz, R. Doerner, R. Causey, V. Alimov, W. Shu, O. Ogorodnikova,A. Kirschner, G. Federici, A. Kukushkin, Recent analysis of key plasma wall inter-actions issues for ITER, J. Nucl. Mater. 390-391(1)(2009) 1-9, https://doi.org/10.1016/j.jnucmat.2009.01.037. [7] V. Philipps, A. Malaquias, A. Hakola, J. Karhunen, G. Maddaluno, S. Almaviva,L. Caneve, F. Colao, E. Fortuna, P. Gasior, M. Kubkowska, A. Czarnecka, M. Laan,A. Lissovski, P. Paris, H.J. van der Meiden, P. Petersson, M. Rubel, A. Huber,M. Zlobinski, B. Schweer, N. Gierse, Q. Xiao, G. Sergienko, Development of laser-based techniques for in situ characterization of the first wall in ITER and futurefusion devices, Nucl. Fusion 53 (9) (2013) 93002, https://doi.org/10.1088/0029- ( 5515/53/9/093002. ) ( [8] ] . A. Malaquias, V . P hilipps, A. Huber, A. Hakola, J. Likonen, J. Kolehmainen, S . Tervakangas, M. A ints, P . P aris, M. Laan, A. Lissovski, S . Almaviva, L. Caneve, F . Colao, G. Maddaluno, M . Kubkowska, P. Gasior, H.J.V.D. M e iden, A.R. Lof, P .A.Z.V. Emmichoven, P. P e tersson, M. Rubel, E. F ortuna,Q . Xiao, Development of I TER relevant laser techniques for deposited layer characterisation and tritium in- ventory, J. Nucl. Mater. 438 (2013) S936-S939, htt p s://do i .org/10 .10 16 / j. i nucmat.201 3 .01.203 . ) ( [9] ] D.W. Hahn, N . O m enetto, La s er-induced bre a kdown spectroscopy (LIBS), part II:review of i nstrumental and methodological approaches to material analysis an d applications to different fields, Appl. Spectrosc. 6 6 (4) ( 2012) 3 4 7-419,http s: / /doi. org/ 1 0.1366/ 1 1 -06574. ) [10] R. Fantoni, S. Almaviva, L. Caneve, F. Colao, A.M. Popov, G. Maddaluno,oum_Development of calibration-Free laser-Induced-Breakdown-Spectroscopy basedtechniques for deposited layers diagnostics on ITER-like tiles, Spectrochim. Acta-Part B At. Spectrosc. 87 (2013) 153-160, https://doi.org/10.1016/j.sab.2013.05.032. ( [11 ] M . Z lobinski, L aser I n d uced Desorp ti on a s H y drogen R etention Diagn o stic Me t hod, B erichte d es F orschung sz ent r u m s Jii l ich, 2016 Ph. D . thesis. 4 396 ) ( [12] G . D e Temmerman, M.J. Bal d win, D. Ant h oine, K. Hei n ola, A. J an , I. Jepu,J. Likonen, C.P. Lungu, C. P o rosnicu, R.A. Pi t ts, Efficiency of thermal ou t gassing fortritium retention measurement and re m oval in I TER, Nucl. Mater. Ene r gy 12 ( 2 017) 2 67-272, h ttps: // doi.o rg/ 10.101 6 /j . nme. 2 01 6 .10.016. ) ( [1 3 ] G .A. Wurden,C. Biedermann, F. Ef f enberg,M. Jakubowski, H. N i e mann,L. Stephey, S . B ozhenkov, S. Brezinsek, J. F e llinger, B . Cannas, F. P i sano, S. Marsen, H. P . La q ua, R. K onig,O. Schmitz, J.H. Harris, E.A. Unterberg, Limiter observations during W7-X f irst plasmas, Nucl. Fusion 57 (056036)(2017), h tt ps ://doi. o rg/10.1088/1741- 4326/aa6609. ) ( [ 14] V .R. Winters, S. Brezinsek, F . Effenberg, M. Rasinski, O. Schmitz, L. Stephey,C. B iedermann, C . P. D h ard, H . Frerichs, J. H arris, M. K rychowiak, R . K o nig,T.S. Pedersen, G.A. W urden, Overview of t he pla s ma-surface inte r action on limi t er s urfaces in the startup campaign of Wendelstein 7-X, Phys. Scr. T 170 ( 2 017) 014050,ht t ps :/ / doi.or g/1 0. 1 088/ 1 4 0 2-4896/a a 8e21. ) ( [ 15 ] C . L i, N. Gierse, J. Oelmann, S . Brezinsek, M. Rasinski, C. Prakash Dhard, T .S. Pedersen, R. Konig, Y.Liang, H . Ding, C. Linsmeier, L aser-induced breakdownspectroscopy for Wendelstein 7-X st e llarator limiter tile analysis, Phys. Scr. (T170) ( 2017), h tt ps://do i . or g/10.1088/ 0 031-8949/2017/T 1 70/ 01 4004. ) [16] J. Oelmann, N. Gierse, C. Li, S. Brezinsek, M. Zlobinski, B. Turan, S. Haas,C. Linsmeier, Depth-resolved sample composition analysis using laser-induced ab-lation-quadrupole mass spectrometry and laser-induced breakdown spectroscopy,Spectrochim. Acta - Part B At. Spectrosc. 144 (2018) 38-45, https://doi.org/10.1016/j.sab.2018.03.009. [17] R.C. Wolf, A. Ali, et al., Major results from the first plasma campaign of theWendelstein 7-X stellarator, Nucl. Fusion 57 (10) (2017) 102020, https://doi.org/10.1088/1741-4326/aa770d. [18] Y. Feng, J. Kisslinger, Status and application of the EMC3/ EIRENE code, Contrib.Plasma Phys. 40 (3-4) (2000) 271-275, https://doi.org/10.1002/1521-3986(200006)40:3/4<271::AID-CTPP271>3.0.CO;2-1. [19] S. Brezinsek, A. Pospieszczyk, D. Borodin, M.F. Stamp, R. Pugno, A.G. McLean,U. Fantz, A. Manhard, A. Kallenbach, N.H. Brooks, M. Groth, P. Mertens,V. Philipps, U. Samm, Hydrocarbon injection for quantification of chemical erosionyields in tokamaks, J. Nucl. Mater. 363-365 (1-3) (2007)1119-1128, https://doi.org/10.1016/j.jnucmat.2007.01.190. [20]P.J. Linstrom,W.G. Mallard (Eds.), NIST Chemistry WebBook, NIST StandardReference Database Number 69, National Institute of Standards and Technology,Gaithersburg MD, 20899,2005. A deep understanding of the plasma-wall interaction processes in fusion devices like Wendelstein 7-X is necessary for an efficient plasma operation and a long lifetime of the plasma-facing components. In this work we present an approach employing residual gas analysis after picosecond laser-induced ablation (ps LIA-QMS) of graphite limiter tiles, exposed in the first plasma operational phase of Wendelstein 7-X, for depth-resolved and quantitative hydrogen content analysis. A series of poloidal and toroidal locations areanalyzed at three of the five limiters, showing up to 2.3×10²² hydrogen atoms/m2 in net-deposition areas after a total plasma exposure of about 311 s in mixed hydrogen and helium operation. Shallow implantation of hydrogen is observed in erosion zones, where a low fuel content is present due to the high surface temperature during plasma operation. The hydrogen content spans between (1.1 and 3.7)×1021 hydrogen atoms/m2 in the net-erosion areas. Moreover, oxygen has been analyzed and its appearance in both the implantation and deposition zone was verified. Results are compared to thermal desorption spectrometry and to simultaneously performed laser-induced breakdown spectroscopy (LIBS) measurements.
确定
还剩4页未读,是否继续阅读?

产品配置单
北京欧兰科技发展有限公司为您提供《W7-X石墨中氢检测方案(激光产品)》,该方案主要用于其他中氢检测,参考标准--,《W7-X石墨中氢检测方案(激光产品)》用到的仪器有PL2250 闪光灯泵浦皮秒Nd:YAG激光器
推荐专场


相关方案
更多
该厂商其他方案
更多