


方案详情
文
本研究建立了一种预测橄榄油能否通过特级初榨感官测试的模型。使用的仪器为安捷伦7890A GC 和安捷伦7200 系列精确质量Q-TOF 质谱联用系统,同时在电子轰击电离源(EI)和正化学电离源(PCI)模式下,检测发现了橄榄油中存在大量的化合物。使用Mass Profiler Professional 软件进行统计分析并建立分类模型,该分类模型利用 5 种特定化合物可以准确预测一种橄榄油能否通过感官测试。
方案详情

代谢组学 基于精确质量的子离子谱图对代谢产物的可能结构进行确认 安捷伦 7200 GC/Q/TOF应用文集 The Measure of Confidence Agilent Technologies AGILENT 7200 四飞杆飞行时间气质联用系统 The Measure of Confidence 满足定性分析要求的 宽线性范围 高分辨率 定量分析 >13,000 @ m/z271.9867 >4个数量级 代谢组学 食品质控和农药残留天然产物研究 ·人类和动物兴奋剂 .环境污染物 .法医/毒理学.能源研究和石油化工 .食品研究、香精和香料材料研究和监测 合成物确认和质控 国土安全 |MS/MS 模式的定性分析 分子结构关联计算 (MSC) 工具有助于通过 MS/MS 谱图进行结构解析。 离子源可拆卸无需放空即可轻松切换离子源 目录 安捷伦 7200 Q-TOF GC/MS 对最有挑战性的应用实现最有力的定性和定量分析 .2 使用安捷伦 GC/Q-TOF 分析咖啡中的挥发性硫化物食品检测 .118 使用安捷伦 GC/Q-TOF MS 和 Mass Profiler Professional 软件表征橄榄油 .20 使用安捷伦 7200 GC/Q-TOF分析原油中的生物标志物 .30 使用 Agilent 7200 系列 GC/Q-TOF 进行酵母类固醇的代谢轮廓分析. 39 气相色谱-四极杆-飞行时间质谱仪(GC-QTOF)分析大中中多种农药残留 .50 ASMS 2012 M 486-Structural Elucidation and Predictive Model Generation of Oliver OilClassification using a GC/Q-TOF MS and Multivariate Analysis . .55 ASMS 2012 Th 600-Negative Chemical lonization and Accurate Mass - A Novel Approach tothe Analysis of Pesticides by GC/Q-TOF 1.559 ASMS 2012 Th 602-Dissecting the Mechanism of Antifungal Drug Action by GC/Q-TOF .663 Contents lists available at SciVerse ScienceDirect Analytica Chimica Acta . 67 Identification of drug targets by chemogenomic and metabolomic profiling in yeast .. .76 安捷伦 7200 Q-TOF GC/MS The Measure of Confidence ..m 复杂的基质和痕量分析均要求分析者提供最佳的定性和定量数据。现在,一种新型分析技术的出现可以帮助您找到答案。 安捷伦7200 Q-TOF 是世界上首款专门针对气质联用系统设计的 Q-TOF (四极杆飞行时间质谱)。它完美结合了分离功能强大的7890 系列 GC 和7000三重串联四极杆 GC/MS 以及6500 LC/Q-TOF 系统中久经考验的 MS 组件,重新诠释了 GC/MS 分析技术。它具有可靠的GC/MS 操作平台,出色的选择性、全谱高灵敏度质谱数据采集、高速采样频率、准确的质量信息,极大地简化了分子表征和结构鉴定的过程。 世界首台 Q-TOF GC/MS, 集分离功能强大的安捷 7890 GC 和高选择性、高分辨率的 TOF 质谱仪为一体 实现出色的定性和定量分析的首选 安捷伦 7200 Q-TOF GC/MS 完美结合了旗舰 GC/MS 系统中最炙手可热的特性与如下先进的功能: 高分辨率和精确的质量数 低至 ppm 级的质量精度,高出单四极杆质谱15倍到50倍的分辨率,可实现针对目标物、非目标物和未知化合物高度可靠的分析。 低检出限和卓越的线性 高于四极杆质谱的全谱范围的灵敏度可以以最精确的质量数妹集色谱柱上大多数低至 pg 级的化合物。双增益放大模式可将范围扩展至105. 无以伦比的MS/MS 选择性 高分辨率 MS/MS的检测选择性远远超越其他 MS/MS分析 仪。此外,具有精确质量数的子离子谱图不但可以帮助鉴定目 标物和非目标物,而且还有助于解析未知化合物。 简化对精确质量的 MS 和MS/MS数居分析 安捷伦 MassHunter 软件提供有效的工具用于定性、定量分析和结果确认。 ·使用专为 El或 CI数据优化的解卷积软件确定复杂样品中的化合物 ·将谱库检索结果与计算得到的分子离子和碎片离子分子式相 结合,确定化合物结构,简化定性过程·使用 Mass Profiler Professional,一种质谱数据的化学计量学软件,可在几种数据文件上执行多元统计分析精确质量数信息可以使您信心十足地进行化合物的定性和定量 分析。 与尖端科技相结合 7890 GC 全优的性能 包括多模式进样口、高性能反吹功能和快速、低热容的色谱柱技术 高灵敏度的提取离子源 程序升温最高达350℃,可长时间经受复杂基 质的考验 可加热的石英整体双曲面四极杆 可加热至200°C而没有分辨率或灵敏度的损 失,消除高沸点色谱峰的污染 稳定、高性能的 TOF 技术 三 安捷伦正交 TOF 技术确保成千上万的 LC/TOF 和LC/Q-TOF 具有高度一致的性能 内标质量校正(IRM)必要的时候,可以将 IRM 化合物导入系统中进行校正,确保质量精度最大化 可拆卸的离子源 通过计算机控制传输线和真空内锁装置,确保30 min 内无需排空即可更换离子源而不会引起任何故障 安捷伦 7200 Q-TOF GC/MS 是成熟技术与全新、独特功能的完美结合 二级离子镜改善了二阶时间聚焦,从而提高了质量分辨率 专利设计的INVAR 飞行管,密封在真空隔绝外壳中,消除了由于温度改变导致的质量漂移,保证了全天候的质量准确度。同时加长的飞行管提高了质量分辨率 4 GHz ADC 电路设计提供更高的采集速率 (32 Gbit/s), 因此提高了低浓度样品检测的分辨率、质量精确度和灵敏度 双增益放大器将动态范围扩大到105 可加热的石英整体四极杆质量分析器已经应用到超过 20,000 台的安捷伦质谱系统中,和安捷伦7000 四及杆MS/MS 相同, 其性能优势众所周知 混合通道板光电倍增管离子检测器提 供单离子级别的检测灵敏度、卓越的 时间分辨率和更宽的线性范围 离子在六极杆碰撞池中被加速,可以在没干扰的情况下更快生成高质量的 MS/MS 谱图 三个分子涡轮泵,包括两个单级泵和一个用于离子源和四极杆分析器的差分泵,为分析器各区域提供最优的真空条件 卓越的线性和质量精度可以分析目标物、非目标物以及未知化合物 新型可拆卸离子源 (RIS), 便于快速更换整个离子源组件,包括推斥极、离子体、拉出极和双灯丝,并且 30 min 内可完成,无需对质量分析仪放真空 界面友好的视频和软件引导用户逐步进行离子源的拆卸和安装,确保整个过程安全无误 色谱柱上含量 pg 质量误差 ppm 2-甲酰噻分 2-乙酰基噻唑 1 -3.57 -0.79 2 -4.46 -0.79 5 -2.68 -0.79 10 -2.68 0.79 20 -2.68 0.00 50 -0.89 1.57 100 0.00 1.57 200 -1.79 1.57 500 2.68 1.57 1000 1.79 -1.57 平均值 -1.43 0.31 新型内标质量(IRM)校正是一种专用系统,用校准化合物在每次扫描中对质量轴进行校正。IRM 可确保大多数复杂谱图条件下低至 ppm 级的质量准确度 模拟数字转换(ADC)检测器: ADC 电路 4 GHz的采集速率可在高分辨率模式下获得出色的线性。为获得更宽的线性范围,双增益放大器可通过低增益通道和高增益通道同步处理检测器信号,使动态范围高达 105 更多有关安捷伦7200 Q-TOF GC/MS 的性能,请访问 www.agilent.com/chem/GCMS_QTOF:cn 结果证明 GC/Q-TOF 技术使出色的定性和定量分析真实、可行 依靠安捷伦7200 Q-TOF GC/MS 低至 ppm 级的质量精确度和高分辨率,用户可以降低分析的不确定性,将假阳性减至最低,确认数据库检索结果,得到未知化合物的分子式。 快速、无障碍设置 自动化采集软件指导用户逐步进行调谐和质量校准操作,获得精确的高分辨率和准确的质量数。 极高的分辨率是定性结果高度可信的重要保证 系统高达13500 (FWHM)的分辨率可轻松将标称质量均为240 Da 的两个化合物分离,二者的精确质量数只相差0.0436 Da. 极高的分辨率对准确识别复杂基质中的化合物是必不可少的。 精确的质量数可有效消除基体干扰使用精精至0.010 Da 的提取离子窗口,目标物茚虫威的碎片离子(150.01195 Da)可轻松从基体干扰物β-生育酚的离子(150.06839 Da) 中分离出来,这无疑有利于准确可靠的定量分析。 当分析对选择性要求更高时,可采用精确质量的 MS/MS 技术将目标分析物和基体干扰物进一步分离。 邮 目标物和未知物的识别可通过多种技术确认: x10+2a-荜澄茄油萜全扫描模式1.8·进行El谱库检索 1.6 CsH24105.0690119.08461.4161.13181281.0331·在PCI模式下测定分子离子峰 0.8 68.0252 91.05350.60.40.241.038355.0538133.0995204.1864·对多个母离子进行 MS/MS 裂解以记录裂解途径 安捷 3040 5060 7080 90 10011010120 130 140 150160170 180 190200 210220230响应值 vs 质荷比(m/z)伦独创x10°CCHmH·通过精确质量数据计算所有离子的分子式 5.11ppm8- a-荜澄茄油萜: MS/MS-3.5CH8ppm161.13337- 母离子:204 119.0851对于非常棘手的复杂分离,如右图中的 a-荜澄茄油萜样 67 -2.63ppm5- CE:10 eV 105.06964-品, MS/MS 的选生性同样可生成简化的质谱图以方便鉴定 31CH2-0.93ppm结构。 1- 81.0683 133.1013'147.11860 304050607080 90100110120 130 140 150160 170 180 190 200210220 230响应值 vs 质荷比 (m/z) 高速谱图采集是 TOF MS 的另一个基本优势。高达 50 Hz 的采集速率可以使您通过 MassHunter’s Unknowns Analysis 软件的色谱图解卷积功能高效地解析大 量组分 分析和推测细胞功能的变化 代谢组学是研究不同条件下代谢变化的有力工具。复杂的代谢研究充分结合 GC/Q-TOF 全扫描技术的高灵敏度和高质量精度以及 MS/MS 的高性能,用于未知代谢物的结构鉴定。7200GC/Q-TOF 扩展的动态范围使其可以对一个细胞中存在的一系列代谢物同时进行准确的鉴定分析。 对于一个简单实验,安捷伦7200 Q-TOF GC/MS 可以提供准确的质量信息、全扫描模式下出色的灵敏度和动态范围等必需的 基本要素,用于识别和定量代谢通路中研究的所有中间产物,从而准确无误地揭示出受试样品在生化通路中的反应步骤。 Mass Profiler Professional (MPP)软件用于统计数据的评估,分析内容包括数据筛查,基线校正和显著性检验。该软件的可视化操作工具同样是数据分析不可缺少的因素。 代谢组学研究中经常出现大量的非目标物和未知代谢产物,它们对数据的生化解析会产生潜在的重要影响,因此,这些重要代谢产物的结构必须十分明确。 安捷伦7200 Q-TOF GC/MS 和 MassHunter Workstation 软件结合使用是此类研究的理想之选。 明确的结勺鉴定: MassHunter Qual Workstation 的 Mass Caliper 工具可在质谱图中任意2个不同质荷比离子间阐释中 性碎片的丢失 x103 118.0446 1 468.3783 496.3699 08 481.3488 0.7 0.6- 586.4229 0.3- 0.2 473.2899 0.1 0 470475480 571.3936 X501.3149 ) 4485490495 50005505i510 515520525530 535540J5545 550555560565570响应值 vs 质荷比(m/z)02H,0NAD(P)+ 575 580585 4a-甲酰-4G-甲基-5a-胆甾-8,24-二烯-3B-醇 致谢: 该应用报告的工作得到了 Manhong Wu", Robert St. Onge, SundariSuresh, Ronald Davis 和 Gary Peltz"等人的大力协助和支持。在此表示衷心感谢。 ”斯担福大学医学院麻醉系 ?斯担福大学生化与基因研究中心 3-酮基-4-甲基酵母甾醇 更多有关安捷伦7200 Q-TOF GC/MS 的性能,请访问 www.agilent.com/chem/GCMS_QTOF:cn 在复杂基质中实现可靠的污染物筛查和鉴定 全面的食品安全筛查既包括对常规污染物的定量分析,也包括对非目标物和未知物的定性分析。 分析的成功往往取决于全扫描模式下的高灵敏度,以及用于目标物确认和未知物分析中的精确质量数信息。 特级初榨橄榄油的评估 使用 Mass Profiler Professional (MPP) 软件以 GC/Q-TOF数据为基础构建一个模型,用于预测一个橄榄油样品是否能通过特级初榨橄榄油感官测试。模型使用5种特定化合物预测感官测试的结果。 除了El质谱数据外,正离子 CI 精确质量数质谱对于模型中化合物分子离子的确认也是十分必要的。 MPP 软件中的主成分分析 (PCA), 显示了数据簇的分布状态。蓝色表示样品顺利通过感官测试,而红色表示未通过 0- 11 1140 50D60 70 80 90100 110120 130140 150160 170180 190200210220 230240 250260 270280 290300310320 330 340响应值vs质荷比 (m/z) ( 参考文献: ) 使用安捷伦 GC/Q-TOF分析咖啡中的挥发性硫化物:出版号. 5990-9076CHCN ( Olive Oil Characterization using Agilent GC/Q-TOF MS and Mass Profiler Professional Software: Pub N o .5991-0106EN ) 更多有关安捷伦7200 Q-TOF GC/MS 的性能,请访问 www.agilent.com/chem/GCMS_QTOF:cn 对目标物和未知物实现可靠的筛查和鉴定 环境分析中最重要的挑战之一是对复杂基质中存在的许多种痕量化合物进行定性和定量分析。对于此类型应用,以下要素是必不可少的: ·全谱范围内高灵敏的精确质量数采集 ·宽的动态范围 ·易于掌握的自动化定性分析 ·目标物的批量处理功能 ( 参考文献: ) 使用安捷伦7200 Q-TOF GC/MS 分析原油中的生 ( 物标志物。 ) 出版号:5990-9477CHCN 将精确质量数和子离子谱图相结合,明确未知化合物的结构 中草药提取物中含有大量的化合物,需要分别确认。然而,商品化El 质谱谱库并非总能提供所研究组分的质谱信息。在这种情况下,安捷伦 7200 Q-TOF GC/MS 生成的精确质量数子离 子质谱对于建立碎片离子之间的联系,确定结构相关性具有重要价值。 卡法树萃取液中未知物的鉴定 更多有关安捷伦 7200 Q-TOF GC/MS 的性能, 可靠、一致的分析源自业内最好的 GC 和 GC/MS 系统 Agilent 7890B 气相色谱仪 ·可靠性能:安捷伦第五代电子气路控制 (EPC)和数字电路以及改进的检测器性能,使 Agilent 7890B 气相色谱的可靠性及分析性能达到了前所未有的高度 ·更高的样品分析通量:快速柱箱降温、新的反吹功能和先进的自动化性能使分析时间更短,每个样品的分析成本最低。所有这些都能容易地整合到您现有的方法中 ·扩展的色谱功能:灵活的EPC 设计可进行行杂的分析,可选择第三台检测器(TCD 或 ECD) 实现一机多用 安捷伦5977A 系列 GC/MSD ·更高的灵敏度:我们新推出的 Extractor 离子源和调谐方案可提高 MSD 灵敏度,让您可以满怀信心地检测痕量化合物并在常规分析中获得更低的检测限 ·最高的生产率:全新集成的硬件和软件功能可简化工作流程,帮助您用更少的资源完成更多的工作 ·最好的软件选择:可以选择使生产率最高的工作流程。继续使用通用可靠的 ChemStation,或者选择成熟的MassHunter软件 安捷伦 240 离子阱 GC/MS ·最广泛的离子化和扫描技术-EI, CI, MS/MS, MS" ·最高的El和 CI全扫描灵敏度 ·稳健的操作和超长的有效运行时间 安捷伦7000 系列三重串联四极杆 GC/MS ·唯一一款装备可加热石英四极杆分析器的三重串联四极杆GC/MS, 该四极杆分析器为专利技术,专为气相色谱分析而设计 ·常规检测可达 fg 级的灵敏度和优越的选择性 ·每秒多达 500 MRM 转换 安捷伦 GC 和 GC/MS ·随时可用的成套工作流程解决方案适用于60多种主要应用 ·出厂前经预装并通过特定应用方法及相应混标测试 终身确保仪器的最佳性能——最大限度地提高您实验室的分析通量 作为世界色谱行业的引领者,安捷伦始终定位于带带用户最具创新性的样品前处理产品、GC 色谱柱和消耗品,帮助客户满足最苛刻的分析挑战。 从最少的重复样本中获得准确、重现的结果 只有安捷伦提供完整的样品制备产品线以满足您的仪器分析所需。 ·安捷伦 Bond Elut 聚合物 SPE 产品可提供最洁净的萃取操作,选择性地将干扰物从复杂基质中清除。由超过40种固定相组成30多种产品形式,种类之多居当今市场之首 ·安捷伦出品的行业领先的 QuEChERS 前处理包是一种经济有效的工具,使样品制备更加快速、简单、可靠 更多信息,请访问 www.agilent.com/chem/sampleprep:cn 信心十足地进行痕量分析 安捷伦超高惰性气相色谱解决方案的各组件共同为分析创造出惰性的样品流路,使您可以获得ppb 或者 ppt 级的检出限,以满足当今分析所需。 ·安捷伦 J&W 超高惰性气相色谱柱过过行业最严格的混合标样测试,确保一致的柱惰性和出色的低柱流失 Ukra lnert niet Liners ·无论带或不带玻璃毛,安捷伦的超高惰性衬管都提供了稳健、可重复并且可靠的惰性流路 更多有关确保 GC 惰性流路的信息,请访问www.agilent.com/chem/ultrainert:cn 安捷伦的承诺 依赖10万多个成功的认证案例和几十年的认证测试实践经验,您有理由相信可以依靠安捷伦的系统认证和仪器校准证明顺利通过法规认证。 实时技术支持和预警 每台安捷伦仪器内装的“智能系统”对仪器可能出现的故障提前预警,使工作效率和分析通量达到最大化。 安捷伦 OpenLAB 随着食品、药品、土壤和水样分析生成的数据日益复杂和庞大,您迫切需要将大量原始数据转化成可操作的信息。安捷伦OpenLAB ELN 和 OpenLAB ECM帮助收集、分析并共享您的结果,在促进合作的同时保护并归档您的知识财产。 安捷伦的价值承诺 我们承诺自购买之日起至少10年的仪器使用保证,或者我们可以折价为您提供升级产品。 安捷伦的服务保障 在安捷伦服务协议范围内,只要您有要求,我们承诺为您的仪器提供维修或者免费更换服务。 使用安捷伦 GC/Q-TOF分析啡啡中的挥发性硫化物 咖啡中释放出来的挥发性硫化物对咖啡的香气和味道起着非常重要的作用。由于许多香味化合物都是以痕量水平存在,对怡人的咖啡香气进行完全表征是一项比较困难的事情。复杂食物基质中痕量水平(低ng/mL级)硫化物的定性和定量通常需要耗时的样品制备过程和高分离度的复杂仪器,如 2D GC/MS联用仪。使用高分辨率、高灵敏度和快速分析的安捷伦 GC/Q-TOF系统,可以通过最少量的样品制备和1D GC标准方法得到高质量、一致性的结果。 主要优势: .·安捷伦 7200 GC/Q-TOF 为复杂食物基质中的硫化物常规分析提供了快速、简单的解决方案 ( ·系统的高灵敏度可使咖啡中挥发性硫化物的定性 和定 量水平低至 1 pg 柱 上 进样量 ) 对于 GC/Q-TOF方法,只需对样品进行简单的液液萃取,即可进行咖啡中挥发性硫化物的分析。具有低质量误差的高分辨率的质谱图有助于在严重基质干扰下对目标化合物进行识别和分析。7200 GC/Q-TOF具有低 pg级的方法检出限,质量精度误差小于5ppm。基质中检测的线性范围高达3个数量级,线性相关系数大于0.995。对 ng/mL级的2-噻吩甲醛和2-乙酰基噻唑成功运用了标准加入法进行测定,这个浓度是咖啡萃取物中的天然浓度水平。 ( ·安捷伦7200 系列 GC/Q-T O F 卓越分分辨率和质量精度为复杂食物基质中的目标组分定量分析提供足够高的选择性 ) ( 覆 盖 3个数量级浓度范围的线性确保目标物在宽浓度范围内满足定量要求 ) 总之,安捷伦7200 GC/Q-TOF可对复杂食物基质中的化合物进行痕量水平分析,无需复杂繁琐的样品制备和分离方法。 方法由来自 Gerstel K.K.的 Nobuo Ochiai 和 Kikuo Sasamoto 以及安捷伦科技有限公司的Ryo Ogasawara 和 Sofia Aronova 建立。 图1.咖啡萃取液的 TIC 谱图(未添加硫化物标准品),充分证明了基质的复杂性 2-噻吩甲醛, EIC 图2.咖啡基质中,天然浓度水平的加标2-噻吩甲醛和2-乙酰基噻唑的 EIC 和质谱图 表1.2-噻吩甲醛和2-乙酰基噻唑的咖啡加标萃取液中的质量误差 质量误差, ppm 柱上量 pg 2-噻分甲醛 2-乙酰基噻唑 -3.57150 -0.78735 -4.46438 -0.78735 -2.67863 -0.78735 -2.67863 0.78735 -2.67863 0.00000 -0.89288 1.57470 0.00000 1.57470 -1.78575 1.57470 2.67863 -1.57470 1000 1.78575 -1.57470 Average 2.32148 1.10229 使用安捷伦 GC/Q-TOF MS 和MassProfiler Professional软件表征橄榄油 应用简报 食品检测与农业 作者 摘要 Stephan Baumann, Sofia Aronova 安捷伦科技有限公司 Santa Clara, 加利福尼亚 本研究建立了一种预测橄榄油能否通过特级初榨感官测试的模型。使用的仪器为安捷伦7890A GC 和安捷伦7200 系列精确质量 Q-TOF 质谱联用系统,同时在电子轰击电离源(EI)和正化学电离源(PCI)模式下,检测发现了橄榄油中存在大量的化合物。使用 Mass Profiler Professional 软件进行统计分析并建立分类模型,该分类模型利用5 种特定化合物可以准确预测一种橄榄油能否通过感官测试。 美国 在美国,对地中海食物和橄榄油健康效应的日益追捧使橄榄油的需求快速增长。到2013年,美国市场预期将超过18亿美元[1]。橄榄油被认为与欧洲南部人口的长寿和心脏病低发率有关。事实上,食品与药品管理局(FDA) 已经批准橄榄油中单不饱和脂肪酸降低冠心病风险的健康声明。最近有研究表明,橄榄油的消炎作用主要来源于第一次压榨得到的特级初榨橄榄油(EVOO),很少有食物含有如此丰富的抗氧化物和消炎成分。 国际橄榄油理事会(IOC)和美国农业部 (USDA) 已经建立了EVOO 的分类标准,包括由品鉴小组进行的感官测试和化学测试。然而,最近的研究[2]表明, 占美国 EVOO 市场 99%的进口橄榄油往往通不过 EVOO 类别的感官测试,加之感官测试是昂贵和主观的。 基于美国市场EVOO 强大的市场场额和对 EVOO 日益增长的需求,非常值得开发一种可以预测橄榄油能否通过感官测试的化学筛查法。这样,生产厂商只需提交那些通过几率高的橄榄油产品进行感官测试。这样的化学筛查同样可以降低鉴别和认证的费用和时间,同时提高市场上 EVOO 的品质。 该应用报告证明了开发一种模型预测橄榄油能否通过感官测试的可行性。该模型使用一种类似于近期红酒分类报告[3]中应用的非目标化合物分析方法,同司采用电子轰击电离源(El)和正化学电离源(PCI)模式采集数据,使用安捷伦 7890A GC 和安捷伦7200 系列精确质量 Q-TOF 质谱联用系统, 安捷伦 MassHunter软件用于谱图的解卷积, Mass Profiler Professional(MPP)软件用于深度统计分析和建立分类模型。橄榄油样品中的5种特定化合物与感官测试失败有关。 实验 试剂和标准品 环己烷,色谱纯,来自 Sigma-Aldrich 公司。 样品 一共10种橄榄油样品均来自UC Davis Olive Center。所有样品均接受了由 IOC 授权小组执行的感官测试确定定们是否符合 EVOO标准。样品室温下避光保存,用环己烷按 1:10的比例进行稀释,以 1:10分流比进样到气相色谱中,按随机顺序进行分析。 仪器 研究使用的仪器是安捷伦 7890A GC 和安捷伦7200系列 GC/Q-TOF 联用系统。仪器的操作条件列于表1。 表1. GC 和MS仪器条件 色谱柱 DB-5 MS, 30 m x 0.25 mm x 0.25 pm (部件号122-5532) 进样量 1pL MMI进样口 50°C 保持0.01 min, 600°C/min 升到 300°℃ 吹扫分流出口 60 mL/min @ 1 minute 柱箱升温程序 45℃保持 4.25 min, 5C/min 升到75℃, 保持0min, 再以 10℃/min 升到320℃, 保持10 min 载气 氦气, 1.3 mL/min 恒流 传输线温度 290°C MS仪器参数设置 离子化模式 El, 正CI (20%甲烷气体) 离子源温度 230°C 四极杆温度 150°C m/z范围 40~800m/z 质谱采集速率 5 Hz, 同时以曲线图模式和棒状图模式采集 数据处理和统计分析 使用 MassHunter 定性分析软件(版本B.05 SP1) 进行数据处理,其中的谱图解卷积工具用于色谱峰定性。通过调整质量和化合物过滤器,可以鉴定100~300个化合物。使用 MassHunter的输出工具创建 CEF 文件将解卷积数据输入到 MPP. 使用Mass Profiler Professional 软件(版本2.1.5)进行统计分析,数据处理步骤如下: 1.设置导入过滤器和对齐参数 2.选择归一化准则 3.定义样品组 4.设置数据过滤器 5.用主成分分析(PCA) 图对数据进行聚类评估 一旦这些步骤完成后,就使用倍率变化和显著性分析等统计工具对数据进行评估。最后的分析步骤是建立和测试分类模型。进一 步的数据处理还包括使用质谱数据库检索和分子式估算排布对化合物进行定性。 结果和讨论 数据采集和处理 使用 GC/Q-TOF 对 EVOO 样品中的化合物进行鉴定。使用MassHunter 中的谱图解卷积(图1)通常情况下可识别大约150个色谱峰。使用冷柱头分流进样,进样口温度从50℃程序升温至300℃, 将热分解降至最低。为了能较好分离早出峰的化合物,将柱温箱初始升温速率设为5C/min。 使用 MassHunter 的解卷积对色谱峰进行识别,然后利用 MassHunter的输出工具生成可以导入到 Mass Profiler Professional (MPP) 软件的CEF 文件。 图1. 通常情况下,利用谱图解卷积可以识别约150个色谱峰,峰面积筛选器为最大峰峰面积的0.1% MPP软件匹配了以谱图类型和保留时间为基础的提取离子色谱(EICs)。提取离子图图要求交叉相关系数为0.6,保留时间匹配到 0.05 min, 才认为是同一个化合物。图2中的质量和保留时间曲线显示橄榄油中共识别出442个独特的实体(化合物),它们中的大多数只出现过1到2次,并且在数据过滤时被筛选掉。 定义了样品组后,在 MPP 中设置数据过滤器。实体过滤可以生成更高质量的数据集,使后续多元分析更有意义。第一次过滤确定了哪些实体(化合物)100%时间都在至少一个样品组中出现(频率分析)。该频率过滤器将初步标记物从442个降到了91个。 统计分析 当使用复杂的统计软件经编写以处理 ASCI 或文本类型的结果时,标记物发现的统计分析往往会非常繁琐和费时。MPP软件是有效利用复杂而“嘈杂”的数据,进行复杂的数据管理、筛选、统计分析、解释、模型创建和预测的理想选择。它提供了一个易于遵循的指导工作流程,帮助用户决定如何最好地去评估数据。专家级用户可以直接进行所需的数据处理(详情见Mass ProfilerProfessional 产品样本5990-4164CHCN)。 主成分分析(PCA) 是一种经常采用的非监督多元分析技术,它可对数据进行降维处理,同时保留数据中的鉴别能力。 RT (min) 图2. 质量和保留时间曲线表明经谱图解解积识别了442个独特的化合物。它们中的大多数只出现过1到2次,会被 MPP过滤掉。低频的化合物以红色表示,高频的以蓝色表示 PCA 通过把测量的变量转化为不相关的主成分,每个主成分是一个原始变量的线性组合。它作为一种质量控制工具,分析数据如何聚类并确定离群样本。实体(化合物) PCA 在通过和未通过感官测试样品之间分析数量上的不同,进一步确定了数据分组的差异性(图3)。 倍率变化和统计学意义 一旦确定了橄榄油样品通过和未通过感官测试这两大分类,即进行统计学分析。首先,测定任何指定化合物的浓度倍率变化(上升),这项分析识别选定数组之间丰度差异大的实体(化合物),即通过和未通过的 EVOO 品品中那些浓度相差2倍、3倍、4倍或更多的实体(化合物)。 下一步,利用方差分析(ANOVA) 确定那些满足倍率变化标准的化合物间是否具有统计学上显著性差异。使用概率值 P=0.01, 频率筛选得到的91个实体减少到5个重要化合物。倍率变化分析和ANOVA分析的结果以火山曲线(图4)表示。选定P值最低和倍率变化最大的5个化合物用于创建分类模型。 分类模型 分类的目的是以几个变量描述并且已知分类信息识别的一套训练样品为基础,建立一种一般性假设。任务是通过前者映射后者。为实现此目的,大量基于统计或人工智能的技术被开发出来[4]。本研究的目的就是以5种与不能通过感官测试有关的化合物为基础预测哪个橄榄油样品不能通过感官测试。 偏最小二乘(PLS) 分析尤其适合于这种观察对象,这里指样品数量比测量变量(如检测实体, m/z)少的情况。因为它具有处理大量相关及嘈杂变量的能力,应用越来越广泛。偏最小二乘判别分析法(PLSDA) 用于锐化不同观察组别之间的分区,从而获得最大化的分类,已经成为代谢组学数据分类强有力的工具[4]。因此, PLSDA 被用于建立橄榄油分类模型。 图3. 主成分分析(PCA)显示数据如何聚类。红色表示未通过感官测试的样品,蓝色表示通过感官测试的样品 图4. 火山曲线表示了X轴上每个实体的倍率变化和在Y轴上的显著性差异。这5种化合物聚积在未通过感官测试的样品中 根据 MPP 筛选出的5种化合物将数据分为2类,下一步是创建一个模型来预测一种橄榄油样品能否通过感官测试。建立分类模型的第一步是用数据对模型进行训练(图5)。 为测试模型,要使用相同但未包括在创建模型中的训练数据和样品,虽然有些多余,但这是一个有效的统计过程。采用同样的分类预测模型验证训练模型。包括那些不用于构建模型的有限数量的样品,模型的准确度均为100%(图6)。这些结果表明了创建一个模型用于准确预测一个 EVOO样品能否通过感官测试的可行性。 iaentifie Training PredlictedtTratningo Cunfidence CSC1-8-1:192 IE Training IE Training 1.000| F5W2-EI-1:Ig2 EE Tralning! IF, Trainingl 1000 ESC1-E-1 Ig2 P Trainingl IP. Training] 1000 P. Training] [e, Training] 1000 RSA1-E-1:102 P. Trainingl IP. Training 1000 图5. 代表了PCA 中3 个聚类的 PLSD 训练集 identifier Grade Training Predicted(Class Pre... Confidence PAC1-E-1: 1g2 F None IF TrainingI 1000 E5C2-E1-1102 P Training [e Trainingl 1000 ESC1-E1-1 1g2 P Training [P. Trainingl 1.000 SAC1-E1-1192 F None E. TrainingL 1000 RFC2-E1-1 Ig2 P None B. Trainingl 1.000 RSA2-E1-1-1g2 P None Ie, TrainingL 1.000 CSC1-El-1: Ig2 F Uraining If Trainingl 1.000 RSA1-E1-11g2 P Training Ie. TrainingL 1000 EFC1-EI-1 Ig2 P None e. Trainingl 1000 FSW2-E1-1:1g2 F Training F. Training] 10001 图6. 模型准确预测了所有样品的通过与否,包括那些未参与模型与建的样品,这些样品没有用于构建预测模型,在“Training”变量中以“None”表示 化合物定性 安捷伦 7200 系列 GC/Q-TOF 这类仪器的优势在于可以以El、CI和产物离子扫描模式采集数据。这些正交操作模式有助于信息确认。El可以进行谱库检索并提供碎片数据;CI可以提供经验公式方面的信息;产物离子 MS/MS 扫描生成的数据可用于精确质量的子结构检索,应用到El或 CI产物离子上。 然而,没有必要知道分类模型中使用的化合物是什么,但化合物鉴定可以了解那些化学组分直接或间接对橄榄油感官质量产生副作用的机理。安捷伦7200 系列 GC/Q-TOF 可以提供精确质量的结构信息,对化合物鉴定(ID)具有强大的优势。 使用安捷伦 MassHunter 定量软件进行精确质量谱图解卷积并从干扰峰中提取干净谱图。然后,根据 NIST 数据库对El质谱数据进行检索(图7)。除了最后一个化合物,所有El数据均发现有相应的匹配度。虽然碎片形成模式是一样的,但和四极杆仪器得到的数据相比,该匹配因子相对较低,因为 NIST 谱库中大部分数据均来自于四极杆质谱。这两种质谱仪在不同的质量范围内体现的最佳性能各有不同:四极杆质谱的响应在低质量范围内优于飞行时间质谱。 210 图7. El 商业谱库如 Wiley 和NIST 可以进行精确质量 EI GC/Q-TOF 数据检索确定化合物 El离子的精确质量信息有助于聚积化合物的初步定性,除了一个缺少主导分子离子的化合物外(图8),对其他所有化合物质量准确度均低于5 ppm。 利用正CI精确质量数据,每个标记物都可以生成分子式(图8)。根据观察到的碎片形成模式,数据对第5个化合物(最底行)的分子式进行了确认。除了227 m/z 处的预期峰和和的(M+C,H)+ PCI加合物外,还观察到一个209 m/z 的碎片峰,这和丢失H,0分子的结果一致。191 m/z 的碎片峰的形成表明了第二个水分子的丢失。从这些数据可以推测该化合物为一个经验分子式为CHz60,的二醇类物质,它的质量准确度正好大于8 ppm, 符合低信号强度。对 NIST 谱库检索确定的另外4种化合物的研究表明,它们都具有影响橄榄油味道的气味,从而导致无法通过感官测试(图9)。 MPPID 初步NIST 检索ID NIST匹配度 分子式 CAS EI、M*+ PCI、[M+H]+ 计算值 测定值 质量偏差(ppm) 计算值 测定值 质量偏差 (ppm) 55.0@27.546 n-棕榈酸 789 C16H3202 57-10-3 256.2397 256.2385 4.7 257.2475 257.2470 1.9 73.0@29.750 硬脂酸乙酯 703 C20H4002 111-61-5 312.3023 312.3008 4.8 313.3101 313.3091 3.2 81.0@35.731 角鲨烯 831 C30H50 111-02-4 410.3907 410.3904 0.7 411.3985 411.3987 0.5 105.0@20.906 a-荜澄茄油烯 880 C15H24.4 17699-14-8 204.1873 204.1883 4.9 205.1951 205.1945 2.9 71.0@27.260 NIST谱库不存在 N/A C4H2602 N/A 226.1927 ND ND 227.2006 227.1987 8.4 图8. PCI质谱数据提供了精确质量信息,用于确定积聚在未通过测试的橄榄油样品中的化合物的分子离子。最下一行是在El谱图中没有发现主导性分子离子碎片的化合物信息 MPP ID 初步 NIST 检索 ID NIST 匹配度 分子式 CAS 气味 来源 55.0@27.546 n-棕榈酸 789 C163202 57-10-3 淡油 Bedoukian Research 73.0@29.750 硬脂酸乙酯 703 C204002 111-61-5 蜡 Good Scents 公司 81.0@35.731 角鲨烯 831 C30H50 111-02-4 花香 Good Scents 公司 105.0@20.906 α-荜澄茄油希 880 C15H24 17699-14-8 草药香 Good Scents 公司 图9. 4种和感官测试失败有关的化合物气味列表 使用 Molecular Structure Correlator 进行结构确认 Q-TOF 产物离子谱图可以帮助确认所有生成的碎片离子和所提议的结构异构体建立联系。Molecular Structure Correlator 可以对子结构进行 ChemSpider 数据库检索并且将结果和所有可能的异构体建立联系。每个碎片离子按与建议分子式的质量误差和生成该建议分子式需要断裂多少个化学键的罚点排序。将每个碎片离子的得分加权平均,同时考虑每个碎片离子的强度和质量数,得到一个异构体的个体兼容性评分 (Compatibility Score)(图10). 该工具作为El谱库的补充,清晰地鉴定出29.75 min 的峰为一种乙酯类化合物,最佳匹配化合物为硬脂酸乙酯。MolecularStructure Correlator 表明, 312 m/z 母离子的产物离子和硬脂酸乙酯有很好的相关性,兼容性性分为98(图10)。此外,碎片的精确质量和建议质量相关性良好,所有碎片的质量误差在 5 ppm之内,这为化合物鉴定提供了额外的确认信息。 图10. Molecular Structure Correlator 将 Q-TOF 产物离子的谱图和结构异构体经验公式的谱图相比,确定哪个产物离子和异构体的碎片相关,从而得出兼容性评分 结论 使用 Agilent GC/Q-TOF系统的精确质量 El 源和正 CI源扫描数据建立了一个模型,用于准确预测一种橄榄油样品是否能够通过感官测试。虽然只是使用小样本创建的模型,但也充分证明了这种方法的可行性。使用增大的样本量构建的预测性模型将为橄榄油厂商提供一种经济、快速的测试方法预测他们的产品能否通过感官测试,从而,避免了对劣质油进行感官测试花费的时间和金钱。对没有通过感官测试的 EVOOs 中聚积化合物的识别与通过味道识别劣质橄榄油一样可靠。这种方法还可以被创造性地用于构建另一种模型,以预测一种橄榄油是否被掺杂了廉价替代品。 ( 参考文献 ) ( 1. O live Oil i n t he U.S., 3rd E dition, Apr 1 , 2009, a m a rketingreport from Packaged Facts (http://www.packagedfacts.com/Olive-Oil-Edition-2071654/) ) ( 2. E. N . F rankel, R. J. Mailer, C. F. Shoemaker, S . C. Wang, J. D. Flynn,"Tests indicate that imported "extra virgin"olive o i l often fails international and USDA standards" UC Davis Olive Center, July 2010 (http://olivecenter.ucdavis.edu/news-events/news/files/olive%20oil%20final%20071410% 20.pdf) ) ( 3. L. Vaclavik, 0. Lacina, J . Hajslova , J. Zweigenbaum."The use of high performance l iquid chromatography-quadrupole time-of-flight mass spectrometry coupled toadvanced data mining and c h emometric tools for discrimination and classification of red wines according to their variety . ", Anal Chim Acta.685,4 5 -51 (2011) ) 4. J. Boccard, J. L. Veuthey, S. Rudaz."Knowledgediscovery in metabolomics: an overview of MS datahandling."J Sep Sci. 33,290-304(2010) 更多信息 此数据仅代表典型结果,有关我们产品和服务的更多信息,请访问 www.agilent.com/chem/cn。 使用安捷伦 7200 GC/Q-TOF分析原油中的生物标志物 应用简报 石化和环保 作者 摘要 Frank David ( 色谱研究所 ) Kennedypark 26, B-8500 Kortrijk, 在油源特征分析和溢油源勘探等多种石化应用中常常需要对原油中的生物标志物如(烷基)二苯并噻吩、藿烷和甾烷等进行分析。经过复杂的样品制备和分馏后, 采用 GC-MS 方法对其进行分析。 比利时 稀释后的样品无需分馏即可使用飞行时间质谱仪进行分析,感兴趣的生物指标可通过提取精确质量来实现高选择性的测定。 Sofia Aronova 安捷伦科技有限公司 Santa Clara,CA, 系统出色的灵敏度可对二苯并噻吩、烷基化二苯并噻吩和藿烷进行选择性测定。使用安捷伦 GC/Q-TOF 的 MS/MS模式还可对低浓度的甾烷进行选择性测定。 美国 生物标志物包括烷烃、多环脂肪烃、多环芳烃等一系列碳氢化合物,这些化合物均为永久性环境污染物。这些生物标志物可用于包括油源特征分析等在内的多种石化应用中,作为油品成熟度和油品老化的指标。生物标志物也可被用于勘探造成环境污染的油泄漏源[1、2]。 典型的生物标志物多为杂环多环芳香烃类如烷基化二苯并噻吩、五环三萜类如藿烷和甾醇衍生的多环烷烃如甾烷(例如胆甾烷)。通常使用 GC-MS 法测定这些生物标志物。分析前,样品先经液液萃取、气相色谱柱和/或固相萃取,将烷烃类化合物和芳烃类化合物分离。最后,萃取液经气相色谱分离,使用质谱的选择离子监测(SIM)模式进行检测。由于监测的标志物数量庞大,经常需要采取多次运行,每次运行针对一组特定的生物标志物。 该篇应用中,使用安捷伦7200 Q-TOF 直接对原油稀释液中的二苯并噻吩(DBTs)、藿烷和甾烷进行测定。飞行时间质谱将高灵敏度、分辨率与精确质量测定相结合,为复杂基质中的痕量组分检测提供了独一无二的选择性。GC/Q-TOF 方法不只局限于几种预选的分析物(如SIM 和 MRM模式分别用于单级四极杆和三重四极杆),还可以通过提取精确质量的离子色谱的模式对不同种类的生物标志物进行检测、鉴别和定量。此外, MS/MS 模式还对全扫描下低选择性的痕量组分有更高的选择性。 实验 化学试剂和样品 选择 NIST SRM 2260a (LGC, Molsheim, 法国)二苯并噻吩参比溶液用于仪器性能测试,检测液为正己烷的10倍稀释液。二苯并噻吩的最终浓度为 0.38 ng/pL。 原油样品来自法国道达尔。称取 100mg原油, 用10mL正己烷超声提取。再将溶液离心,上清液用正己烷稀释10倍(原油最终浓度为1 mg/mL) 。 GC 和MS条件 使用配置 SSL 的安捷伦 7890A GC 和7200 Q-TOF的气质联用系统进行分析。 分析条件见表1。 表 1. GC/Q-TOF条件 进样口类型 分流/不分流 模式 不分流 温度 300C 进样体积 1 pL DB-5MS, 30 m x 0.25 mm, 0.25 pm 1.5 mL/min,氦气,恒流 50℃ (1min) -10°C/min-320°℃(8min) 电离模式 El MS 模式 扫描范围40-500 Da 采集速率 5Hz MS/MS模式 扫描范围 40-500 Da CE:10 eV 离子源温度 280°C 四极杆温度 150°C 结果和讨论 首先对二苯并噻吩浓度为 0.38 ng/pL 的参比液进行分析。色谱图(分析窗口范围为5-23.5 min) 如表1所示。DBT在16.3 min 出峰,其质谱图见图1B, 基峰离子为 m/z 184.0338, 与精确质量的分子离子 (C,H,S,M*=184.0341)相比,质量误差小于2 ppm。 接着,用相同方法对原油样品进行分析。图2a为总离子流图。谱图轮廓显示为典型的正构烷烃同系物峰。二苯并噻吩的出峰位置用箭头标出。采用单级四极杆 MS 提取 m/z 184±0.5 amu 的离子谱图,可以检出二苯并噻吩,如图2b所示。但同时其他几个化合物也能够被检测到,尤其在14-18 min 的时间窗口内尤为明显。这些化合物(可能为C4-萘,C-AH18,MW=184)可能会干扰选定生物标志物的测定。 ×106 A 图1. 芳香烃混标的GC/Q-TOF分析(0.38ng二苯并噻吩(C,H,S,M*+=184.0341)的质谱图如B所示) 响应与采集时间(min) 图2a. 原油的总离子流图 (DBT的流出时间用箭头标出) ×106 4.8- 图2b. 184±0.5 amu 的提取离子谱图 通过提取精确质量离子(184.0341±5 ppm) 的离子谱图,可有效消除所有干扰,大大提高分析的选择性,如图2c所示。16.32 min的质谱图如图 2d所示。复杂基质中 DBT的精确质量(m/z184.0339) 未受到明显影响,质量误差小于2 ppm。 23 24 25 26 27 28 29 响应与采集时间(min) 图2c. 184.0341 ±5 ppm 的离子提取谱图 ×106 图2d. 原油中二苯并噻吩的质谱图 同样原理,可对甲基-二苯并噻吩(C1-DBT,4个同分异构体,只得到了3个异构体的谱图)提取 m/z 198.0498 的离子谱图,对C,-二苯并噻吩提取 m/z 212.0645 的离子谱图。这些 DBT标志物可轻松检出,如图3所示。 图3. 检测 DBT (m/z184.0341)、甲基-二苯并噻吩(m/z198.0498)和C,二苯并噻吩 (m/z 212.0645)所得到的精确质量(±5ppm)提取离子谱图 除了含硫的多环芳烃外,藿烷和甾烷同样为重要的生物标志物。同样可以提取精确质量离子的离子谱图,对复杂原油基质中的这些化合物进行选择性检测。图4为191 ±0.5 amu (顶部)和191.1794 ±10ppm(底部)条件下提取离子的谱图对比。使用精确质量检测无疑可获得更高的选择性和更高的信噪比。在时间窗口26 min 到 30 min 的范围内可检测出几种藿烷。27-28 min的大峰可能为降-藿烷 (C,Hso.MW=398)。 图4. 检测藿烷在 191 ±0.5 amu (顶部)和191.1794 ±10ppm(底部)条件下的提取离子精确质量谱图 最后进行甾烷特征离子的提取。因为这些分析物在样品中的浓度很低,如图5所示,即便使用精确质量提取离子图谱,依然容易受到基质离子的干扰。而 GC/Q-TOF 还可以采用 MS/MS模式,可以以离子400为母离子(C,H,,M**=乙基胆甾烷)再次提取子离子谱图。子离子在217.1951 时的提取离子谱图表明,乙基胆甾烷测定的选择性有了显著提高,如图 6所示。 图5. 甾烷的精确质量提取离子谱图 (217.1951±10 ppm 和400.4064±10ppm) 图6. 检测甾烷在全扫描模式下精确质量 (400.4064±10 ppm)离子的提取离子谱图(顶部) 和MS/MS模式下精确质量(400>217.1951±10ppm)产物离子的提取离子谱图(底部)的对比 结论 安捷伦 7200 Q-TOF 可对原油中的各种生物标志物进行分析,无需进行预分馏。稀释后的原油可直接用于测定,利用精确质量的提取离子谱图和窄化的提取窗口可对二苯并噻吩和藿烷等生物标志物进行高选择性监测。 7200 Q-TOF 在 MS/MS 模式下同样可对痕量甾烷进行选择性检测。 总之,安捷伦7200 GC/Q-TOF 系统可应用在石油特征勘察中,对目标和非目标生物标志物均可进行有效的分析。 ( 参考文献 ) ( 1. Z. Wang and M. F i ngas, Developments in the an a lysis of petroleum hydrocarbons in oils, petroleum products and oil-spill-related environmental samples by gas chro- matography, J. Chromatogr.A 774(1997)51-78. ) ( 2. Z. Wang, M. Fingas, C. Yang and B. Hollebone, BiomarkerFingerprinting: Application and Limitation for Correlation and Source Identification of Oils and Petroleum Products, Prep. Pap.-Am. Chem. Soc., Div. Fuel Chem. 49 (1 ) (2004) 331-334. ) 更多信息 ( 有关我们产品和服务的更多信息,请访问 w w w.agilent.com/chem/cn. ) 作者 Manhong Wu, Robert St. Onge, Sundari Suresh, Ronald Davis, and Gary Peltz 医药和生物化学学院 基因研究中心 斯坦福大学 Stanford, CA 美国 Sofia Aronova and Stephan Baumann 安捷伦科技有限公司 Santa Clara,CA 美国 使用 Agilent 7200 系列 GC/Q-TOF 进行酵母类固醇的代谢轮廓分析 应用报告 代谢组学 摘要 使用安捷伦7200 系列 GC/Q-TOF 系统和 Mass Profiler Professional (MPP) 软件对酵母类固醇进行了代谢轮廓分析,用来精确测定新型潜在抗真菌药物的靶酶。将相对浓度的麦角甾醇生物合成中间体的靶标分析和非靶标分析相结合,再赋予精确质量的高分辨GC/Q-TOF 技术, 可以获得最全面的结果。电子电离(El)的全采集模式质谱图结合MS/MS产物离子质谱数据,进一步确保了酵母中药物治疗蓄积化合物定性的准确性。 前言 芽殖酵母酿酒酵母因为其简单而且菌株可适用于基因组中所有基因的个体缺失而成为一种广受欢迎的模式生物。本研究使用酿酒酵母对新型抗真菌药物进行评价。这一药物家族以麦角甾醇,一一种真菌细胞膜的重要组成部分为作用靶标。麦角甾醇和动物细胞中的胆固醇功能相似。虽然如此,但很多参与酵母类固醇生物合成的酶在结构和特异性上与哺乳动物细胞中相应的酶有很大的差别。因此,那些抑制麦角甾醇生物合成路径的药物通常具有抗真菌的治疗潜力。这些药物可以通过互补性遗传和分析方法确定。作为分析通量最高的方法,曾有文献进行过 Haploinsufficiency Profiling (HIP) 筛查[1]。 HIP涉及了基因缺失的酵母对药物的生长,造成菌株灵敏度升高,表明杂合位点的产物可能是抑制剂的靶标。除此之外,还可使用精确质量高分分辨相色谱/四极杆-飞行时间质谱(GC/Q-TOF)联用进行酵母类固醇代谢物轮廓分析并与遗传学相结合专用于潜替药物的靶酶鉴定。 本应用报告描述了使用安捷伦7890气相色谱和7200系列 Q-TOF质谱联用仪通过定性药物治疗后,蓄积的化合物对新兴抗真菌药物的靶标物进行可靠的鉴定。首先用两种明确效果的抗真菌药物对方法进行验证,接着对有潜在治疗特性的新兴药物进行测定。较宽的仪器线性范围允许在酵母细胞的浓度范围内同时量化脂类代谢产物。 以麦角甾醇生物合成路径中的靶中间体以及药物治疗蓄积的非靶代谢物对非治疗样本的相对水平为基础,提出了几种潜在抗真菌药物作用于酵母中固醇代谢的机理。此外,使用 MS/MS 产物离子的精确质量谱图结合 Molecular Structure Correlator (MSC)工具对某些蓄积的代谢产物进行结构确认。 实验 试剂和标准品 标准品和试剂 来源 特比萘芬 Sequoia Research Products 氟康唑 Sigma-Aldrich 桃柘酮 Sigma-Aldrich NCE 1181-0519 ChemDiv MSTFA (N-甲基-N-三甲基硅烷-三氟乙 Sigma-Aldrich 酰胺)+1%TMCS(三甲基氯硅烷) 甲氧基胺盐酸盐 Sigma-Aldrich 无水吡啶 Sigma-Aldrich 仪器 本研究在7890A 和 7200 系列 GC/Q-TOF 上进行。仪器条件列于表1。 表1. GC 和MS仪器条件 样品制备 用抑制10%增长率的药物浓缩液对6个含有5mL野生型酵母培养液 (BY4743)的平行样进行培养,当 OD60n值约为1时进行收集(约3×10⁷细胞/mL)。用 Folch 法提取酵母油脂[21。相当于原培养液 2.5个ODs0n单位的下层有机相通过快速抽真空干燥,用40mg/mL甲氧基胺盐酸盐的吡啶溶液进行衍生化,再用 MSTFA+1%TMCS 混合溶液进行硅烷化,溶液的最终体积为100pL。取 1pL用于气相色谱进样。 数据分析 使用安捷伦 MassHunter B.05 进行定量。所有谱图均使用 MassHunter Qualitative Analysis B.05 进行解卷积,感兴趣的代谢产物通过与 NIST11 谱库比对确定结构。 使用多元软件包 Mass Profiler Professional (MPP) 对解卷积后的数据进行统计评估(数据过滤、统计学意义分析、确定痕量水平的特异性化合物和结果可视化),测定药物治疗样本中浓度显著不同于对照样本的化合物。此软件可以进行多个非预期代谢产物的检测。 结果与讨论 数据分析 得益于精确的质量数信息, GC/Q-TOF 数据的谱图解卷积可以区分具有相同标称质量碎片离子的共流出化合物。MassHunterQualitative Analysis 软件按以下4步进行解卷积: 1.噪声分析:为每个离子的谱图计算噪声因子 2.化合物预测:噪声分析结果和保留时间一起对每个谱图组分进行峰形模型预测 3.谱图解卷积:用最小二乘法创建每个组分的质谱图 4.化合物识别:对每个组分进行El谱库检索和比对 无偏方法的优势之一是无需考虑目标离子进行解卷积。在“化合物预测”步骤中确定的色谱峰形可以识别相邻扫描中具有相似的峰形和峰顶的组分。 色谱峰解卷积还有助于区分具有相同经验公式的不同化合物。图1表明3种化合物的分子式均为C,Ha0,但只有右侧的谱图具有和4,4-二甲基-8,24-胆甾-二烯醇相匹配的El谱图结构。根据下面的9步向导工作流程,确定4,4-二甲基-8,24-胆甾-二烯醇是这些化合物中唯一符合 Mass Profiler Professional (MPP)多元统计软件包设定的倍率变化和显著性标准的化合物。 一旦谱图完成解卷积,即创建了化合物交换格式(.CEF) 的文件。然后用 MPP 软件测定那些浓度因药物发生显著变化的化合物。MPP统计评估步骤如下: 1. 定义实验类型、工作流程和生物体 2.选定数据源为 MassHunter Qualitative Analysis 3从Qualitative Analysis 导入 .CEF 文件4 设置丰度和模型离子过滤器 5.定义保留时间和匹配因子定位参数 6.选择校准类型 7.选择基线校准 8.设置条件筛选标志 9.火山曲线过滤。其结合了显著性(p<0.05)的 Student’s t检验结果和阈值为2的倍率变化结果 概念验证 使用先前所述的抗真菌药物和易于理解的靶酶来论证使用精确质量高分辨 GC/Q-TOF分析酵母类固醇代谢轮廓的可行性。特比萘 芬和氟康唑都是广泛使用的抗真菌药物,在麦角甾醇的生物合成路径中的靶标为完全不同的过程,且抑制机理成熟。特比奈芬抑制 ERG1 的基因产物鲨烯环氧酶,从而防止角鲨烯转化成路径上的后续中间体,角鲨烯环氧化物。酵母细胞一直在持续生成角鲨烯但却不能有效地将之转化成下游中间体,从而导致了角鲨烯的蓄积。氟康唑抑制 ERG11的基因产物细胞色素 P45014a-去甲基化酶或者羊毛甾醇去甲基酶,这时,就会形成羊毛甾醇的蓄积。研究对相关类固醇在药物治疗样本和非治疗样本中的代谢物丰度变化进行了对比和评估(图2和图3)。 图2. 经特比萘芬治疗后,不同类固醇代谢产物丰度的倍率变化,包括因为抑制 ERG1 基因产物角鲨烯环氧酶造成的角鲨烯蓄积 图3. 经氟康唑治疗后,不同类固醇代谢产物丰度的倍率变化,包括因为抑制 ERG11 基因产物14a-去甲基化酶造成的羊毛甾醇蓄积 正如预期的那样,分别在特比萘芬和氟康唑治疗的样本中发现了角鲨烯和羊毛甾醇的蓄积。使用 MPP,发现在氟康唑治疗的样本中因14a-去甲基化酶的活性受到抑制而导致几种14a-甲基类固醇的蓄积。非靶标分析得到的结果显示麦角甾醇生物合成路径上 的某些下游酶表现得更加“混杂”,这样可以使用蓄积的类固醇和额外的甲基官能团作为他们的培养基。14a-甲基类固醇的经验公式可以通过 El碎片谱图和精确质量信息(表2)确定。碎片离子的精确质量进一步确保了化合物定性的可靠性。 表2. 氟康唑的非靶标分析结果 衍生化产物 MI MI精确质量 质量误差 组分(m/z @RT) 化合物 分子式 (m/z) (m/z) (ppm) 469@28.08 14-a-去甲基粪甾醇 C29H480 484.4095 484.4101 1.24 379 @28.26 14-a-去甲基-4-a-甲基酵母甾醇 C29H480 484.4095 484.4107 2.48 467@28.39 14-a-去甲基-3-酮基-a-甲基酵母甾醇 C2gH460 482.3938 482.3931 -1.45 RT=保留时间 新型抗真菌药物的代谢轮廓特征分析 根据基因筛查结果,选择了一些麦角甾醇生物合成路径的潜在抑制剂如桃柘酮和一种新型化学实体(NCE) 1181-0519进行研究。为了更好地了解新型潜在药物诱导的酵母中的代谢变化,同时采用了靶标分析和非靶标分析比较治疗样本和非治疗的样本中代谢产物的蓄积水平。 此外, MS/MS 实验结果提供的结构信息对药物治疗造成的蓄积代谢物的结构鉴定至关重要。结果清晰表明, NCE 1181-0519 和桃柘酮的靶标分别是 Erg25 和 Erg26。 用MPP 进行统计分析有助于轻松识别不同变化差异的组分(图4)。 图4. MPP的显著性分析表明, NCE 1181-0519治疗的样本中,只有一种化合物(4,4-二甲基-8,24-胆甾二醇)的倍率变化存在显著性差异 在 NCE 1181-0519 样本中,只有4,4-二甲基-8,24-胆甾二醇满足显 著性检验标准,即倍率变化的p<0.05, 说明 NCE 特异性作用于 Erg25, 下游中间产物的衰减同样有力地支持了这一结论(图5)。 图5. 经氟康唑治疗后,不同类固醇代谢产物丰度的倍率变化,包括4,4-二甲基-8,24-胆甾二烯醇的蓄积和下游中间体的下降,确定 Erg25 为药物靶标 桃兆酮造成4a-羧基-46-甲基-5a-胆甾-8,24-二烯-3G-醇的蓄积,这和 Erg26 作为桃柘酮的靶标结果一致(图6),因为它是一个生物性质不稳定的中间体,通常不检测该化合物,本实验未将其作为原始靶标物,只能通过非靶标分析揭示桃柘酮会导致其蓄积。 这一代谢物的结构通过精确质质产物离子谱图信息(图7)确认,Molecular Structure Correlator软件用于进一步确人 MS/MS生成碎片的结构,并生成匹配度分值表,以此确定蓄积化合物最佳的结构式(图8)。 图6. 经桃柘酮治疗后,4a-羧基-4-甲基-5a-胆甾-8,24-二烯-3-醇丰度的倍率变化, Erg26 为桃柘酮的特异性靶标 4a-羧基-4β-甲基-5a-胆甾-8,24-二烯-3J-醇 图7. MS/MS产物离子谱图帮助进一步确认非靶标方法确定的蓄积物结构,4a-羧基-4G-甲基-5a-胆甾-8,24-二烯-3G-醇 图8. Molecular Structure Correlator 根据MS/MS的每张精确质量碎片离子谱图分配分子式。通过软件工具挖掘 ChemSpider 数据库。通过 MDL Molfile 添加结构式可以对所有可能的同位素或者特定的化合物进行评估 7200 GC/Q-TOF 全扫描模式出色的灵敏度可在一次实验中识别所有必要的代谢物,这对特异性较差的抗真菌药物的作用机理解析非常重要。图9总结了两种潜在抗真菌药物的代谢轮廓分析结 果,说明了ERG25 和ERG26分别是 NCE 1181-0519 和桃柘酮在麦角甾醇生物合成路径的靶基因。 图9. 麦角甾醇生物合成的路径图,红色标注的为研究确定的 NCE1181-0519 和桃柘酮的靶基因 7200 系列 GC/Q-TOF 是一个功能强大的分析工具,用来进行酵母类固醇代谢轮廓的扫描,识别公认抗真菌药物的靶酶,与Haploinsufficiency Profiling 一起更详尽地阐明药物抑制机理。7200 GC/Q-TOF 的精确质量信息和全谱图的灵敏度可以对目标物及药物治疗蓄积形成的未知化合物进行可靠的识别和定性。线性范围高达5个数量级,可以对整个细胞浓度范围内的代谢物同时进行测定。 用此方法对几种潜在抗真菌的药物包括 NCE1181-0519 和桃柘酮的作用机理进行了解析,这一过程通过经 Mass Profiler Professional评估,中间体浓度发生显著变化的样本同时进行靶标分析和非靶标分析实现的。此外,7200 GC/Q-TOF通过精确质量 MS/MS产物离子谱图与 Molecular Structure Correlator 工具相结合,可对未知代谢物进行结构确认和解析。 ( 1. G. Giaever, P. F laherty, J. Kumm, M. Pr o ctor, C. Nislow, D. F. Jaramillo, A. M. Chu, M . I. Jordan, A. P. A rkin, R .W Davis . "Chemogenomic pro f iling: identifying the functionalinteractions of small molecules in yeast." Proc Natl AcadSci U S A. 101, 793-798 (2004). ) ( 2. .J J. Folch, M. Lees, G. H. Sloane Stanley. "A simple method for the isolation and purification of total lipids from animal tissues . "J Biol Chem. 226,497-509(1957). ) 更多信息 本文中的数据仅代表测定的典型结果。有关产品和服务的更多信息, 请访问 www.agilent.com/chem/cn 气相色谱-四极杆-飞行时间质谱仪(GC-QTOF)分析大葱中多种农药残留 应用报告 作者 前言 王雯雯余天安捷伦科技(中国)有限公司 大葱不仅是中国传统的调味品,而且是一种重要的出口农产品。传统的分析方法,比如气相色谱或者气相色谱一单四四杆质谱仪容易受大葱当中强基质干扰,造成分析结果出现偏差。高分辨 Q-TOF GC/MS 即可以工作在单 TOF 模下下,利用采集到的碎片精确质量数对未知化合物进行定性分析,也能充分利用 MS/MS 选择性进一步增强的优势,对目标化合物进行更准确的检测,特别适用于类似大葱这样复杂的样品。本文使用安捷伦7200 Q-TOF GCMS 对大葱当中的多种农药残留进行定性分析,以考察7200检测复杂样品的能力。 仪器参数 ( 气相色谱: Agilent 7890A, 色谱柱: Agilent HP-35 MS 色谱柱 (30m×0.25mm× 0.25pm); 程序升温: 80°℃保留 1.0 min, 2 5 ℃· min-1升到170 °C, 6°℃· min1 升到300°℃, 保留 10 min; 载气:气气,载气流量:1.1mL·min-1;进样口温度: 270°℃,进样体积:1.0pL,进样模式:不分流。 ) ( 质谱系统: 7200 Q-TOF。离子源:El,离子化能量:70eV,离子源温度:250℃,气质接口温度:280°C,溶剂延迟:5.0 min,工作模式:全扫描和MS/MS,扫描范围: m/z 45-450。 ) 结果及讨论 精确质量数对结果的影响 图1(上)是大葱基质当中100.0ng·mL1的100种农药在 TOF模式下采集得到的 TIC 结果;图1(中)显示的是 Procymidone质荷比为 m/z 283.0161的碎片在+/-0.5 Da 提取窗口情况下得 到的 EIC 结果,此时由于离子提取窗口太宽(即所要求的准确度低),其它质荷比相近的离子碎片也被提取出来了。这个结果与低分辨四极杆质谱结果类似。而如果把提取窗口进一步缩小到+/-10ppm, 如图1(下)所示,那么高分辨情况下得到的精确质量数碎片就可以与基质当中的干扰离子碎片明显区别开来。 图1. (上)在大葱基质中100种农药的总离子流图(100ngmL): (中)在单 TOF扫描模式下,提取离子流图(283.0161+/-0.50 Da); (下)在单 TOF 扫描模式下,提取离子流图(283.0161+/-10ppm) 质量准确性 表1显示了部分被检测农药在10.0 ngmL-1添加水平时的分辨率和质量精度。即使是在如此低浓度的情况下, 7200 GC-Q/TOF也表现出了非常优异的质量检测精度和分辨率,特别是长时间的整机性能的稳定性(仪器调谐是2d之前做的,而且在数据采集过程当中没有使用内标来实时校准质量轴)。 校准曲线 在大葱基质当中添加了100种农药,添加水平分别为10.0、20.0、50.0、100.0和200.0ngmL1。结果显示,绝大多数农药都有很好的线性响应。图2中,敌中在10.0 ng mL1添加水平 EIC结果,信噪比为63.39;敌稗标准曲线,相关系数0.9992。 表1. 部分农药碎片离子的分辨率和检测精度 名称 分子式 精确质量数(理论) 精确质量数(实测) 分辨率 精确度/ppm 异丙甲草胺 C1H16N 162.1277 162.1272 11327 3.24 二苯胺 C12H1N 169.0886 169.0879 11036 4.14 达草灭 C12HgCIF,N,0 303.0381 303.0369 12448 3.88 腐霉利 C13H1CI2NO2 283.0161 283.0154 12686 2.6 p.p'-DDD C13HgCl2 235.0076 235.0076 12207 -0.08 o,p'-DDT C13HgC2 235.0076 235.0068 12274 3.33 o,p'-DDD C13HgCI2 235.0076 235.0068 12274 3.33 嘧菌环胺 C14H14N3 224.1182 224.1177 12138 2.34 灭蚁灵 C5C6 269.8126 269.8119 12364 2.47 四氯硝基苯 CsHCI4 200.8824 200.882 11686 3.42 五氯硝基苯 C5CI CINO, 294.8337 294.833 12288 2.27 HCB CCI37CI 283.8096 283.8096 13151 0.06 Gamma-BHC CHCI 180.9373 180.9369 11576 2.26 Delta-BHC C6 HC3 180.9373 180.9368 11489 2.82 三氯杀螨砜 C6H4CIOS 158.9666 158.9662 10728 2.45 五氯苯 CHCI, 247.8515 247.8509 12734 2.58 西玛津 CH12CIN 201.0776 201.0769 11692 3.35 戊炔草胺 C,H,OCI, 172.9555 172.9554 10809 0.85 噻嗪酮 C7H,N 105.0573 105.057 9159 2.86 抗蚜威 C。H12N,0 166.0975 166.0971 11369 2.34 为了考察7200在全扫描模式下的灵敏度,选择最低添加水平(10.0ngmL-1)结果计算所有农药的信噪比,所有农药的S/N都大于3.表2列出了部分农药的线性相关系数及信噪比结。 表2. 部分农药标准曲线相关系数及信噪比 农药名称 碎片离子精确质量数 R2 信噪比 农药名称 碎片离子精确质量数 R2 信噪比 四氯硝基苯 200.8824 0.991 156.55 腐霉利 283.0161 0.998 21.76 氯苯胺灵 152.9976 0.995 17.8 氯丹 405.7972 0.994 5.38 戊炔草胺 172.9555 0.993 22.9 氟酰胺 173.0209 0.991 29.73 莠去津 200.0697 0.998 27.59 p.p'-DDE 315.9375 0.999 101.25 西玛津 201.0776 0.992 21.04 o,p'-DDT 235.0076 0.993 63.66 野麦畏 268.0324 0.999 32.86 o,p'-DDD 235.0076 0.993 61.63 gamma-六六六 180.9373 0.996 170.07 三氯杀螨砜 158.9666 0.992 22.37 delta-六六六 180.9373 0.998 46.18 氯苯嘧啶醇 138.9945 0.985 7.46 敌 160.9794 0.999 63.39 哒螨灵 147.1168 0.997 21.72 异丙甲草胺 162.1277 0.994 43.16 醚菊酯 163.1117 0.99 25.13 根据EU 法规对农药残留检测的要求,高分辨质谱需要至少两个精确质量数碎片才能对目标化合物进行确认。图3显示的是在10.0 ng'mL1浓度水平下部分农药的两个精确质量数的 EIC 重叠 结果。可以看出即使浓度很低,但是仍能很容易对农药进行准确的定性分析。 图3. 在10.0ngmL-1浓度水平下部分农药的两个精确质量数的 EIC 重叠结果 MS/MS选择性及精确质量采集 一些基质非常复杂的样品,或者由于某种原因,样品的前处理步骤比较简单,都会导致大量高浓度离子碎片进入到质谱检剑器当中。如果这些碎片的保留时间和质荷比与被检测的目标化合物非常接近, 单纯的 TOF 工作模式也不能满足检测的需要,此时可以 使用 Q-TOF模式,首先用低分辨四极杆选择性地只让某一种碎片离子通过,在碰撞池碎裂后,再进入 TOF 进行高分辨条件下精确质量数的采集。这样可以有效排除干扰问题。, 下图当中 Atrazine在离子提取窗口为 20 ppm 时, 旁边仍然有干扰离子出现。采用Q-TOF模式进行检测,则可以得到非常干净的结果。 图4. TOF模式下10.0 ng 'mL-1Atrazine 在不同提取窗口范围时 EIC 结果 A: m/z (215.0932±0.50) Da; B: m/z (215.0932 ±20) ppm; C: MS/MS模式下以m/z 215 为母离子,做子离子扫描得到的 EIC结果(215>(200.0689±20) ppm) 结论 (1)凭借高分辨和出色的离子碎片精确质量数采集能力,7200 0-TOF GC/MS 在面对类似大葱这样复杂样品当中农药残留任务时表现出了高灵敏度和高准确性的特点。 ( (2)7200在高分辨条件下的长期工作稳定性会极大方便用户的日 常使用。 ) ( (3) Q-TOF 两种工作模式可以确保用户面对不同检测状况采取不同 的检测方法,取得同样高可靠性的实验结。 ) 附录 ASMS 2012M 486 Structural Elucidation andPredictive ModelGeneration of Oliver OilClassification using aGC/Q-TOF MS andMultivariate Analysis Stephan Baumann and Sofia AronovaAgilent Technologies, Santa Clara, CA Overview A model was constructed to predicts whether an olive oilwould pass the extra virgin sensory test. Running a GC/QTOF MS in both electron impact (El) and positive chemicalionization (PCI) modes iidentified a largenumber ofcompounds in olive oil.Multivariate software was thenusedto perform statistical analysisi aand construct aclassification model utilizing the presence of five specificcompounds to accurately predict whether an olive oil wouldfail the sensory test. Introduction The demand for olive oil is growing rapidly in the UnitedStates. The US market is expected to surpass $1.8 billion by2013. The International Olive Council (IOC) and USDA haveestablished standards for the classification of extra virginolive oil (EVOO), including a sensory test conducted by atasting panel, as well as chemical tests. However, recentstudies have stated that imported olive oils, which accountfor 99% of the EVOO on the US market, often fail thesensory test for EVO0 classification. Multivariate softwarecan be used to model olive oil classification and a GC/Q-TOF can be used to determine the identity of markers thatcorrelate with a failed sensory test. In this experiment we demonstrated thatituntargetedcompound analysis done on an accurate mass GC/Q-TOFcould be used with an El spectral library to help identifymarkers that correlate with a failed sensory test. We alsoshowedthat orthogonaltechniquesssuch ass1 positivechemical ionization could be used to collaborate the Elidentifications. Experimental Sample Preparation Procedure Ten olive oil samples were obtained from the UC Davis OliveCenter. All of these samples had been subjected to IOCsensory test using a panel sanctioned by the IOC todetermine if they passed or failed the criteria for EVOO. Thesamples were stored in the dark at room temperature. Thesamples were diluted 1:10 in cyclohexane and injected intothe GC/Q-TOF with a 1:10 split. The results were evaluatedusing multivariate analysis and a model was developed thataccurately predicted if an EVO0 would fail the sensory test.Representative samples were then analyzed in PCl and EIProduct lon Scan modes to aid in Structural Elucidation. Experimental Figure 1:7890 GC / 7200 Q-TOF instrumentation. Table 1: A cold splitless injection was used to minimizethermal decomposition. Figure 2: Typically, about 150 peaks are identified bychromatographic deconvolution with a relative area filter of0.1% of largest peak. Mass Profiler Professional (MPP) was used for statisticalevaluation of the ddata.. This softwaree providesthepossibility of using a guided workflow that helps the userevaluate the analytical data. The guided approach efficientlyreduces the datasetfrom 442 components tofivestatistically relevant compounds in a few steps. The stepswere as follows: 1.Define18ttheexperimentittype,workflow,N.andorganism. 2Select the data source as MassHunter Qual.345 Import CEF files from MassHunter Qual Set abundance and model ion filters. Define retention and match factor alignmentparameters. (Total Compounds: 442) 6Select internal, external, or no calibration.7 Choose baseline correction. Set condition filter flags. (Total Compounds: 91) 8Filter based on Volcano Plot. This combines the Student’s t-test for significance (p<0.05) withfold change threshold = 4. (Total Compounds: 5) Figure 3: This mass vs. retention time plot shows that 442unique compounds were distinguished by chromatographicdeconvolution, most of which occurred only once or twiceanddwere filtered. out by MPP. The low frequencycomponents are shown in red while the higher frequencycomponents are shown in blue. Figure 4: Principal Component Analysis (PCA) shows howdata clusters. The samples that failed the sensory test aremarked in red and the ones that passed are blue. Figure 5: The Volcano Plot shows fold-change for eachentity on the x-axis and significance on the yaxis. The fivecompounds in the upper right hand corner are accumulatedin the samples that failed the sensory test. Class Prediction Through multivariate analysis we identified five compoundsthat correlated with a failed sensory test; the next step wasto build a class prediction model that could be runindependently of MPP. To do this we had to train the modelwith the data. There are several classification models that can be appliedhowever Partial Least Square (PLS) analysis is particularlyadapted to situations where there are fewer observations(i.e. number of samples) than measured variables(e.g.detected entities, m/z). Its use has become very populardue to its ability to deal with many correlated and noisyvariables. Therefore, PLSDA was used to construct the oliveoil classification model. Identifier Trnining Predicted(Training) Canfidence CSCI-E1: Iq2 [F,Training] [F.Training] 1.000 FSW2 E1:1g2 [F.Trainingl [F. Training] 1000 ESCIE1: Ig2 [P. Training] [P. Training] 1000 ESC2-E1: lq2 [P.Training] [P. Training] 1.000 Table 2: PLSD training set which contains representativesfrom each of the three clusters found in the PCA plot. We can see in table three that a small data set such as thisone is capable of identifying lower grade olive oil beingmisclassified as EVO0, a larger model could also determineif an olive oil has any of the characteristic compoundsrelated to fusty', rancid, musty or vinegary flavor notes. Results and Discussion Identifier Grade Training Predicted Confidence (Class Prediction) PACIEI: Ig2 F None [F. Training] 1.000 ESC2-E1: lg2 P Training [P.Training] 1.000 ESCI-E1: lg2 P Training [P. Training] 1.000 SAC1-El: 1g2 F None [F. Training】 1.000 RFC2-El: Ig2 P None [P. Training] 1.000 RSA2-E: 1Ig2 P None [P.Training] 1.000 CSC1-EI:lg2 F Iraining [F.Training] 1.000 RSA1-E: Ig2 P Training [P. Training】 1.000 EFCI-E: Ig2 P None [P. Training] 1.000 FSWZ-EI: Ig2 F Training [F.Training] 1.000 Table 3: The model correctly predicted the pass or failstatus of all samples, including those not used to constructthe model. The samples that were not used for building theprediction model are listed with the Training variable set as'None'. Compound Identification/Structure Elucidation While it is not necessary to know the identity of thecompounds used in the classification model, identificationcould lead to an understanding of the mechanism by whichthose chemical components might adversely affect thesensory qualities of olive oil. The advantage of the 7200GC/Q-TOF is that it can collect data in El, Cl, and Productlon Scan modes. These orthogonal modes of operation aidconfirmation. El spectra allow library searching and providefragmentation data, CI providesinformation about theempirical formula, and Product lon Scan MS/MS generatesapplied to El or Cl generated ions. Figure 6: Commercial unit mass El spectral libraries likeWiley and NIST can be searched using accurate mass ElGC/Q-TOF data to identify compounds As we see in Figure 7, the Molecular Structure Correlator(MSC) performs a substructure search of the ChemSpiderdatabase using MS/MS product ion scan data. MSCcorrelates the product ion scan results to all the possiblestructural isomers. Each individual fragment ion is rankedbasedonIs.Clon ma8s8error corresponding top theeproposedformula, along with a penalty based on how many bondsneeded to be broken to generate that proposed formula. Anisomer’s individual compatibility scoreis weightedaverage of the fragment ion scores, taking into account theintensity and the mass of each fragment ion. Figure 7: MSC performs a ChemSpider substructure searchontheproduct:t ionscan fragmentsof ethyloctadecanoate's molecular ion peak and generates acompatibility score. Note that this substructure is equallycompBatiEble with eicosanoic acid as to ethyl octadecanoate.The El fragmentation pattern is what allows us todistinguish between structural isomers. Exact Mass NISTiD Formula EI[M"]+ Measured MBssError (PPM) PCI[M+H]+ Measured MBss Error (PPM) n-Hexndecanoic acid CgHeD: 256.2385 4.7 257.2470 1.9 Octodecanoic acid. ethyl ester C-Ha0 312.3008 4.8 313.3091 3.2 Squalene CyHs 410.39037 0.8 411.3937 0.5 aCubebene CygHa 2041883 4.9 205.1945 2.9 Table 4: PCI spectral data provided confirmatory accuratemass information for molecular ions of the four up-regulated compounds that had molecular ion peaks andwere identified through El library searching. Conclusions Using accurateemassEl andpositiveecclscanndatageneratedby aGC/Q-TOF system, amodel ccan beconstructed that accurately predicts whether an olive oilwill pass the EVOO) sensory test. Although a studyconstructed using a very small sample set generates anincomplete model, it demonstrates the feasibility of theapproach.Apredictive modelconstructedusingsignificantly larger sample sizee would give oliveproducers a quick determination as to whether their oilwould fail the sensory test and the defects present. Structure elucidation of four of the model compounds wasaccomplliisshheedd by El library searching combinedd withMolecular Formula Generation, Isotopic Pattern Filtering,. and Molecular Structure Correlation. ASMS 2012Th 600 Negative Chemicallonization and AccurateMass -A Novel Approachto the Analysis ofPesticides by GC/Q-TOF Moritz Hebestreit, Jorg Riener,Bernhard Rothweiler Agilent Technologies, Waldbronn,Germany Abstract Analysis of pesticide residues in feed and food is anongoing challenge. Especially in "QuEChERS-times", highlyselective. methods are obligatory to2teliminatematrixinterferences. GC/MS with high mass accuracy and fullscan acquisition opens up the possibility of highly selectivedetermination ofaatheoretically unlimitednumber ofcompounds.Negativechemical ionizationisIsaddingadditional selectivityandincreases the: molecular ionresponse for lower detection limits than electron impact orpositive chemical ionization for dedicated pesticides likehalogenated pyrethroides. We present preliminary data for the analysis of y-BHC.y-chlordane, a-chlordane and trans-nonachlor in variousfood matrices. Experimental Standards Calibration solutions of y-BHC, y-chlordane, a-chlordaneand trans nonachlor were prepared in ethyl acetate at20 fg/uL (ppt), 50 fg/uL, 100 fg/uL, 200 fg/uL, 500 fg/uL,1000 fg/pL, 2000 fg/pL and 5000 fg/pL. Calibration curveswere generated from 20 fg/pL to 1000 fg/pL. Samples Food samples were prepared by Eurofins Food Testing UKLimited using a QuEChERS-like method to yield 1 g/mL matrix in acetonitrile. The following matrices were provided:a) Parsley b) Mint c) Tomato d) Grapes e) Brussel Sproutsf) Kale g) Swede h) Orange i) Cucumber j) SageAliquots of each 90 pL of the extracts were spiked with 10 uL of calibration solutions to yield concentrations of50 fg/pL, 100 fg/pL, 200 fg/pL and 500 fg/pL. GC/MS System The GC and MS configurations and conditions were asshown in Table 1. To ensure mass accuracy, recalibration ofthe TOF was performed automatically within the sequence.No further mass correction was applied. Data Analysis Agilent MassHunter Qualitative and Quantitative Analysiswere used. y-Chlordane, a-chlordane and trans-nonachlorshowed molecular ions. For y-BHC, the most abundant ionis the chlorine fragment. Quantifier ions are listed in table 2.At least two further ions served as qualifiers (not shown).Quantitative Analysis was performed withextractionwindows of ± 50 ppm. Table 1. GC/MS Conditions Compound Chemical Formulae oflons usedfor Quantification Exact Mass (Da) Y-BHC [CI]=[M-CHC4] 69.93825 y-Chlordane [CHCICI]=[M+4J 409.79242 a-Chlordane [CioHeCICI]=[M+4] 409.79242 trans-Nonachlor [C10HgCICI]^=[M+2 441.75640 Tablc 2. Chemical formulae and exact masses of quantifier ions, chlorineisotopes are indicated Calibration Solutions All compounds were detectable at the lowest calibration Figure 1. Calibration curves of targetcompounds Figure 2. Quantrlier response of y-BHC and y-chlordane at 20 fg/pL (i.e. lowestcalibration level) Figure 3. Quantifierresponse of a-chlordane and trans-nonachlor at 20 fg/pL Samples The quantifier ions with extraction windows of ± 50 ppmwere sufficiently selective in all matrices. All targets couldbe detected at the lowest spiked level (50 ppt) and higher,except of y-chlordane and a-chlordane in parsley as well asy-BHC in mint. y-Chlordane and a.-chlordane in parsley aswell as y-BHC in mint were detectable at 100 ppt or higher.S/N ratios (peak to peak) at the lowest detectable levels are shown in table 3. Matrix Y-BHC y-Chlordane a-Chlordane trans- Nonachlor Parsley 6 7(100 ppt) 48 (100 ppt) 4 Mint 63 (100 ppt) 61 69 7 Tomato 64 133 46 73 Grapes 6 130 49 85 Brussel Sprouts 37° 133 27 92 Kale 82 124 45 78 Swede 62 188 63 149 Orange 23 47 70 28 Cucumber 38 207 60 73 Sage 4 72 46 7 "Very lowesidues already densetable in unspilnd sample Table 3. S/N ratios (peak topeak) in matrix at 50 ppt if not indicated differently The following figures illustrate obtained mass accuracy ofthe quantifier ions at different concentrations in thecalibration solutions and in the matrices. No postacquisitional recalibration was applied. Figure 4. Mass difference of measuredmass 1minus56exact mass Vs.concentration in calibration solutions Figure 5a. Mass difference of measured mass minus exact mass of y-BHC (top)and y-chlordane (bottom) in the ten ditferent matrices Figure 5b. Mass difference of measured mass minus exact mass of a-chlordane(top) and trans-nonachlor (bottom) in the ten different matrices Fig. 4 shows the influence of the concentration on massaccuracy. At low ion counts, higher errors are mostprobably due to the ion statistics. At higher concentrations,mass accuracy is stable for all ions (-0.03 mDa ± 0.46 mDa(n=4) at 1 ppb for the four different quantifier ions). Figures 5a and 5b illustrate mass accuracy depending onthe matrix. Mass differences are within few mDa in allmatrices at all spiked levels. As expected, mass accuracy inmatrix is better at higher levels (-0.25 mDa± 1.44 mDa (n=40)at 500 ppt for all quantifiers in all matrices). Conclusions The results of this preliminary study let us confirm, thatnegative chemical ionization combined with high massaccuracyandsufficientresolving power can provideexcellent selectivity and sensitivity for organochlorinepesticides regarding GC/MS analyses. Acknowledgements The authors would like to gratefully acknowledge JonathanHorner from Eurofins Food Testing UK Limited for providingthe QuEChERS extracts used for this study. ASMS 2012Th 602 Dissecting the Mechanismof Antifungal Drug Actionby GC/Q-TOF 1Sofia Aronova, 1Stephan Baumann,2Manhong Wu, 3Bob St. Onge,3Sundari Suresh,3Ron Davis and2Gary Peltz 1Agilent Technologies, Santa Clara,CA, Stanford University Departmentsof 2Anesthesia, School of Medicine and3Biochemistry and GenomeTechnology Center Metabolic profilingof yeast sterols was performed toprecisely determine enzymatic targets for new potentialantifungal drugs. Targeted analysis of the relative levels ofergosterolbiosynthesis pathwayintermediates wascombined with an untargeted approach, empoweredbyaccurate mass high resolution GC/Q-TOF technology, toobtain the most comprehensive results. Full scan electronionization (El) spectral information was complemented withMS/MS accurate mass product ion scan data to confirmthe identity of the compounds accumulated in yeast as aresult of drug treatment. Introduction Budding yeast Saccharomyces cerevisiae is widely used asa model genetic organism because of its simplicity andavailability of strains with individual deletions in all of thegenes in its genome. To evaluate new antifungal agentsthat targetaakke/y component ofryyeastmembrane-ergosterol - complementary genetic andanalyticalapproaches were utilized. As a first-tier high throughputapproach Haplolnsufficiency Profiling (HIP) screening wasperformed. HIP involves the growth of gene-depleted yeastagainst a drug where resulting sensitivity of the strainsuggests that the enzyme product of heterozygous locus isbeing a target of the inhibitor. Furthermore, an analyticalapproach involving accurate mass high resolution GC/Q-TOF metabolic profiling of yeast sterols was used tospecifically identify enzymatic targets of the potential drugs. Based on the relative levels of targeted intermediates of theergosterol biosynthesis pathway as well as accumulateduntargeted metabolites in drugtreated versus untreatedsamples, the mechanisms of several potential antifungaltherapeutic agents affecting sterol metabolism in yeastwere proposed. In addition, the MS/MS accurate massproduct ion spectra were used in conjunction with theMolecular Structure Correlator (MCS) tool for structuralconfirmation of some of the accumulated metabolites. Experimental Sample Preparation Wild type yeast cultures (strain BY4743) were incubatedwith drug concentrations that inhibited growth by 10%.Yeast lipids were extracted by the Folch method (Folch etal.. J Biol Chem, 1957, 226,497)..The lower chloroformaliquots were dried by speed vacuum, and the Experimental active functional groups were derivatized with 40 mg/mLhydroxyaminehydrochloride, in pyridine followed bysilylation using MSTFA + 1 % TMCS, prior to analysis byAgilent 7200 series GC/Q-TOF. Analytical Conditions This study was performed using an Agilent 7890 GCcoupled to an Agilent 7200 series Quadrupole-Time-of-Flight(Figure 1). GC and MS conditions are described in Table 1. Figure 1.7200 series GC/Q-TOF system. Table 1. GC-MS conditions used in the study. Data Processing The chromatographic deconvolution was performed usingMassHunter Unknowns Analysis software. Metabolites ofinterest were identified by comparison with the NIST11mass spectral library. The multivariate software packageMass Profiler Professional (MPP) was used to determinecompounds present at distinct levels in drug-treated vsuntreatedd samples. Quantitation wasperformedusingMassHunter Quantitative software B.05. At the first stage of this study the analytical approachutilizing GC/Q-TOF was validated using two well-describedantifungal drugs followed by the examination of novel drugswith potential therapeutic properties. Both Terbinafine andFluconazole are widely used antifungal drugs that targetdistinct steps in the ergosterol biosynthesis pathway andwhose mechanisms of yeast sterol pathway inhibition arewellunderstood. Terbinafine inhibits the ERG1geneproduct.:, squaleneepoxidase, tthusppreventingtheconversion of squalene to the next intermediate of thepathway. Therefore, squalene accumulation and depletionof downstream intermediates of the pathway is an expectedoutcome in this case. Data obtained by GC/Q-TOF wereconsistent with this expectation (Figure 2). Figure 2. Squalene accumulation was observed in yeasttreated with Terbinafine as compared to untreated control.The numbers represent fold change. Similarly, in thecaseofanazole aantifungalaagentFluconazole,thatinhibitsERG11gene product theBcytochrome P450 14a-demethylase, or lanosteroldemethylase, accumulation of lanosterol is expected. Figure 3. Significant accumulation of lanosterol as well asdepletion of several targeted downstream metabolites wasobserved following Fluconazole treatment. Unexpected Observation Revealed byLUntargetedApproach In addition to accumulation of lanosterol and depletion ofother targeteddownstreammetabolites(Figure3),untargeted approach revealed a buildup of several 14a-methyl sterols that are not usually detected in yeast (Table2). Component {m/z@ RT) Compound Formula Mlof Derivatized Accurate Mass of MI (m/z) Mass Error (ppm) Species ((m/z) 459028.08 14a desmethyl.e3O CgHg0 484.4095 484.4101 1.24 379 0 28.26 methyl zymosterol CH.o 484.4095 484.4107 2.48 457 0 28.39 14a deamethw13keto4.methylzymosterol CH.o 482.3938 482.3931 -1.45 RT-Retention Time MI-Molecular lon Table 2. Results of Untargeted Analysis of FluconazoleIreatment. The empirical formulas of the accumulated 14a-methylsterols were determined based on El fragmentation spectraand accurate mass information. Accumulation of 14a-methyl sterols suggested that some of the downstreamenzymes in the ergosterol biosynthesis pathway are rather"promiscuous"and are able to utilize sterols with an extramethyl group as their substrates. Metabolic Profiling for Characterization of PotentialAntifungal Drugs A few potentialinhibitors of ergosterol1biosynthesispathway such as Totarol and New Chemical Entity (NCE)1181-0519 were evaluated. Statistical analysis performed inMPP helped to easily identify specific steps of the pathwayaffected by a drug. In the case of NCE 1181-0519 only 4,4-gmethno cnolestaeno met the zigncance cenafor a biologically significant fold-change (Figure 4). Whentaking into account downregulation of the downstreamintermediates (Figure 5). the results strongly suggested thatthe NCE specifically inhibited Erg25. Totarol treatment resulted in the accumulation of anothersterol. 4a-carboxy-4p-methyl-5a-cholesta-8,24-dienol,suggesting Erg26 being a specific target of Totarol (Figure6). This sterol was not originally targeted since it is abiologically unstable intermediate present only at tracelevels and was revealed only in an untargeted approach. Figure 4. Significance analysis performed in MPP showsthat only one compound (4,4-dimethyl-8,24cholestadienol)is accumulated in response to treatment with NCE 1181-0519. Figure 5. Significant accumulation of 4.4-dimethyl-8,24-cholestadienol as well as downregulation of downstreammetabolites in response to treatment with NCE 1181-0519strongly suggest Erg25 as its target. Figure 6. Buildup of 4a-carboxy-4B-methyl-5a-cholesta-8,24-dienol is consistent with Erg26 being the specific target forTotarol. Thee structureeooft4a-carboxy-4-methyl-5a-cholesta-8,24-dienol was confirmed using accurate mass product ionspectra information (Figure 7) since NIST library spectrum isnot available for this compound. Figure 7. MS/MS |product ion spectrum helps to confirmthe structure of one of the compounds identified byuntargetedapproach, 4a-carboxy-4-methyl-5a-cholesta-8.24-dienol. Molecular Structure Correlator (MSC) was further used topredict the substructures oftheresultingMS/MSfragments and evaluate best candidate structures ofaccumulated compounds (Figure 8). Figure 8. MCS helps to assign formulas to each accuratemassfragment from product ion scan. Compoundsstructures are extracted from ChemSpider database or from.mol file to visualize fragmentation and provide the scorethat reflects the probability of each fragment structurebeing formed. Finally, it assigns a compatibility score toeach possible compound structure. Conclusions Metabolic profiling of yeast sterols is a powerful approachfor identifying enzymatic targets of antifungal drugs, andcan be used in combination with HIP to elucidate themechanism of drug inhibition in more details. The accuratemass information and full spectrum sensitivity of GC/Q-TOFenabledreliable identification off1targetsas wellasunknown compounds that accumulated as a result of thetreatments. The accumulation of several intermediates ofyeast sterol biosynthesis pathway in drug treated vsuntreated samples helped to elucidate the mechanisms ofseveral potential antifungal agents including NCE 1181-0519 and Totarol. journal homepage: www.elsevier.com/locate/aca Rapid simultaneous screening and identification of multiple pesticideresidues in vegetables Fang Zhang , Chongtian Yub, Wenwen Wang,Ruojing Fan, Zhixu Zhang b,Yinlong Guoa,* a Shanghai Mass Spectrometry Center, Shanghai Institute ofOrganic Chemistry,Chinese Academy of Sciences, Shanghai 200032, ChinaDAgilent Technologies (China) Co., Ltd., 140 Tianlin Road, Shanghai 200233, China D The method was set up for a universalscreening of pesticide residues. d The database included retentiontime, a single characteristic ion anda pair ofions. DGC-QTOF MS as a new instru-ment system was applied due to itsimproving sensitivity and accuracy. D Limit ofidentification of the databasewas at 5 ppb in this case and accuratemass errors less than 2.5 mDa. D Thirteen pesticides were found in thevegetables (11 in celery, 9 in rape, 3in scallion and 2 in spinach). ARTIC L EIN F O Article history: Received 5 September 2012Received in revised form 22 October 2012Accepted 26 October 2012 Available online 2 November 2012 Keywords: Pesticide residues Database Screening Structural identification Gas chromatography-quadrupoletime-of-flight mass spectrometry(GC-QTOF MS) GRAPHICALABSTRACT ABSTRACT A method for the rapid simultaneous screening and identification of multiple pesticide residues in veg-etables was established using a novel database and gas chromatography in combination with hybridquadrupole time-of-flight mass spectrometry (GC-QTOF MS). A total of 187 pesticides with differentchemical species were measured by GC-QTOF MS to create the database, which collected the retentiontime and exact masses of ions from the first-stage mass spectrum (MSl spectrum) and second-stagemass spectrum (MS’spectrum) for each pesticide. The workflow of the created database consisted of“MSl screening" for possible pesticides by chemical formula match and"MS? identification” for struc-tural confirmation of product ion by accurate mass measurement. To evaluate the applicability of thedatabase, a spinach matrix was prepared by solid phase extraction, spiked with a mixture of 50 pesti-cides at seven concentrations between 0.1 and 10 ppb, and analyzed by GC-QTOF MS. It was found thatall of the 50 pesticides with concentrations as low as 5 ppb were detected in the “MSl screening"step andaccurate masses were identified with errors less than 2.5 mDa in the “MS2 identification”step, indicatinghigh sensitivity, accuracy, selectivity and specificity. Finally, to validate the applicability, the new methodwas applied to four fresh celery, rape, scallion and spinach vegetables from a local market. As a result, atotal of 13 pesticides were found, with 11 in celery, 9 in rape,3 in scallion and 2 in spinach. In conclusion,GC-QTOF MS combined with an exact mass database is one of the most efficient tools for the analysis ofpesticide residues in vegetables. ( * Corresponding author. Tel. : +86 021 54925300; fax: +86 021 54 9 25314. E-mail address: ylguo@sioc.ac.cn(Y. Guo). ) Agriculture in the world has changed greatly in the past 100years. Many farmers pursue high yields by utilizing cheap energy, plentiful water supplies, effective chemical fertilizers and pesti-cides. Pesticides achieve their intended control of pests; on theother hand, bring unintended and adverse impact to the health ofhumans and animals as well. For example, recent studies showeda link between heavy pesticidal use in rural areas and incidence ofchildhood leukemia [1-3]. The wide use of pesticides in agriculturecontributes to environmental pollution, affecting land, water, andfood products in particular. Some pesticide residues can survivefoods and reach consumers, imposing a potential threat to humanand animal health, even after the applied pesticides were thoughtto dissipate. Research reveals that prolonged exposure to pesticideresidues may increase the risk of various cancers and neurologi-cal disorders, and impair the immune system [4-7]. The increasedexposure to pesticide residues from food sources has caused seri-ous concerns in food safety. The Pesticide Residues Committee,an independent organization established in many countries, hasrepeatedly advised the governments to establish a nationwide pro-gram monitoring pesticide residues in food and drink. To monitor the pesticides residues left on the raw food products,many approaches have been taken using various analytical tech-niques including spectrophotometry [8], polarography [9],atomicabsorption spectrometry [10], thin layer chromatography [11], iso-topic tracer method [12], gas/liquid chromatography [13,14], andmass spectrometry [15]etc. At present, gas chromatography-massspectrometry (GC-MS) and liquid chromatography-tandem massspectrometry (LC-MS/MS) are the two most powerful techniquesfor multi-residue pesticides analyses [16-19]. For GC-amenablesemi-volatile pesticides GC methods are still preferred over LCmethods due to its higher resolution. With the rapid developmentof MS technique, gas chromatography-tandem mass spectrometry(GC-MS/MS) has been increasingly used to minimize signal inter-ferences in complicated sample matrices. For examples, Tao et al.used a GC-ion trap mass spectrometer (GC-IT MS) and detectedmulti-residues of pesticides in vegetables [20]. Salquebre et al.used a GC-triple quadrupole mass spectrometer (GC-TQMS) anddetected 22 pesticidal residues in human hair [21]. Although many approaches have been successfully taken for theanalysis of pesticides in food or other matrices [19,22-25], accu-rate and reliable improvement for high-throughput applicationsof untargeted residue remains an elusive goal. A method featuredwith higher accuracy, resolution, and detection sensitivity as wellas fast speed is being explored for monitoring multi-residues ofpesticide residues, especially the banned or severely restricted poi-sonous pesticide residues even in trace amounts and complicatedmatrices. The application of single-stage quadrupole MS or IT MS islimited because of the low resolution and disturbances by the highmatrix burden and co-eluting peaks. By using TQMS or more prefer-ably TQ-linear ion-trap mass spectrometer, the low scan speed andthe minimum dwell times for each multi-reaction monitoring tran-sition limit the number of substances in one measurement cycle.GC coupled with tandem high-resolution QTOF MS is a power-ful analytical tool for the identification of unknown compoundsand provides increased selectivity for the determination of tar-get compounds, even when they are nested in complicated samplematrices. Compared with other traditional tandem MS (TQMS) orhigh-resolution MS (TOFMS), the elevated mass resolution of QTOFMS enables the performance of the extracted ion chromatogramsusing narrow mass windows and measure of the characteristicsions at accurate mass seen in MS1 and MS2 spectra. Such narrowmass windows lead to a remarkable improvement of sensitivitydue to the decrease of the background noise and the improve-ment of the signal-to-noise ratio. In addition, QTOF MS possesses ahigh-speed spectral acquisition rate, which can rate as fast as 50 Hzto perform effective MS² dissociations of multiple precursor ionsin one measurement cycle. Considering these advantageous fea-tures for improving sensitivity and accuracy,GC-QTOFMS as a new instrument system could have a promising future for routine mon-itoring of targeted and non-targeted pesticides. Prior to this study,Portoles et al. reported a pesticide residue analysis using an atmo-spheric pressure chemical ionization source in GC-QTOF MS [26].In this study, we present a rapid, simultaneous, and multi-speciesscreening and identification method capable of monitoring multi-residues of pesticide remaining in vegetables using GC-QTOF MS. 2. Experimental 2.1. Chemicals and reagents One hundred and eighty-seven references of pesticides includedin the database were purchased from J&K Scientific Ltd. (Beijing,China). Standard solutions of pesticide were prepared in n-hexane(HPLC grade) supplied by Fisher Scientific (Santa Clara, USA).Bond Elut Carbon/NH2 cartridges (500 mg/500mg,6mL) were pur-chased from Agilent Technologies (Santa Clara,USA).Other solventsand reagents used for sample preparations were obtained fromShanghai Reagent Company (Shanghai, PR China) in analyticalgrade purity. 2.2. Instrument and software All measurements were performed with a 7200 accurate-massGC-QTOF MS instrument (Agilent Technologies, Santa Clara, USA),using a fused silica DB-35MS capillary column of 30 m x 0.25 mmi.d.The injector was operated at 250°C in splitless mode and helium(purity>99.999%) was used as the carrier gas at 1.2 mL min-1. TheGC oven temperature was programmed from an initial temper-ature of 80°C held for 1 min, ramped at 25°Cmin-1 to 170°C,and then at 6°Cmin-1 to final 300°C held for 10 min, resultingin a total run time of 36.267 min. Injection volume was 1 pL. Theother optimized parameters included a transfer line temperatureof 300°C and an ion source of 250°C. TOF for MS was operatedat 5.0 spectra/s acquiring the mass range m/z 50-600 and about13,500 (FWHM). The MS2 conditions were fixed for each com-pound with a quadrupole for isolation of precursorion at a mediumMS resolution and a linear hexapole collision cell with nitrogen at1.5 mL min-1as the collision gas. Perfluorotributylamine (PFTBA)was utilized for daily MS calibration. MassHunter Acquisition B.06and MassHunter Qualitative Analysis B.05 were applied for the con-trol of the equipment, and the acquisition and treatment of data. Inaddition, Microsoft Excel software was applied to create a CSV filefor the database of pesticides. 2.3. Sample source The fresh vegetables of celery, rape, scallion and spinach werepurchased from a local market in Shanghai, China. 2.4. Sample preparation 2.4.1. Extraction The sample of each 20 g chopped vegetable was transferred intoan 80 mL centrifugal tube, 40 mL acetonitrile added, and blended ata15,000 rpm for 1 min with 5 g of sodium chloride added during theblending. After that, the sample homogeneity was centrifuged at4200 rpm for 5 min. The acetonitrile layer of 20 mL was transferredinto a 100-mL rotary evaporator flask and concentrated to 1 mL at40 °C for further clean-up. 2.4.2. Clean-up A Bond Elut Carbon/NH2 cartridge (500 mg/500 mg,6mL) wasadded with 2 cm anhydrous sodium sulfate and conditioned with4 mL of acetonitrile/toluene(3:1). Then, the solution obtained from the extraction step was applied to the cartridge and eluted with25 mL of acetonitrile/toluene (3:1). The entire volume of effluentwas collected and concentrated to 0.5 mL at 40°C. The residue wasdissolved in n-hexane to make a 10 mL solution for detection. Forthe spiked spinach sample,each residue was added a pesticide mix-ture of known concentrations and mixed thoroughly, then addedn-hexane to make a 10 mL solution for separation and detection. 3. Results and discussion 3.1. Creation of the database Because the database of pesticides was created for simulta-neous multi-species screening, it was important to include as manyspecies of pesticides as possible. A total of 187 pesticides,such asorganophosphate insecticides,organochlorine insecticides, organicfluorine insecticides, pyrethroid insecticides, glyphosate herbicide,and azole fungicides, were collected and divided into 11 groups at200 ppb for GC-QTOF MS analysis. TOF MS was calibrated first byusing PFTBA to achieve a typical mass resolution >13,000 and massaccuracy <5 ppm. Then 1 pL of each group standard solution wasinjected into the system for detection. According to the European Council Directive 96/23/EC 4, aminimum of four identification points per pesticide are requiredto ensure its confirmation [27]. To adhere to this Directive,retention time plus a single characteristic ion and an ion pair(precursor-product ions) for each pesticide was included in thedatabase. Among them, the same chromatographic separationensured a nearly identical retention time. The precision ofretentiontime was evaluated by the GC-MS measurements of all pesticidesgroups each in six replications. The standard deviation of eachpesticide's retention time was between ±0.00 and ±0.04 min. Theselection of characteristic ion for pesticide is a critical element forthe application of the database.The best candidate of characteris-tic ion is derived from characteristics fragmentation and owns themost abundance. But in actual cases, many pesticides have no idealcharacteristic ions meeting both features.Hence, in our design,sensitivity was preferred to selectivity in the selection of the char-acteristic ion.The most abundant ion from a MS full scan spectrumwas selected as the characteristic ion and precursor ion in order toachieve the best sensitivity. This also provided a maximum possi-bility to avoid missing the identification of pesticide in question.Moreover, the accurate masses of the selected ions could increasethe selectivity of the method. The ion pair (precursor-productions)would be utilized for the confirmation of pesticide.Of course, incase that the more abundant ion had a lower m/z ratio below 100normally due to a poor selectivity, the precursor ion would bereplaced by the ion with higher m/z and lesser abundance.The pre-cursor ion theoretically calculated from its formula was separatedin the quadrupole and submitted to collision-induced dissociation(CID). The precursor ion undergoes repeated collisions with thecollision gas, building up potential energy in the molecule, untileventually the fragmentation threshold is reached and the productions are formed [28]. The types of fragmentation that occur varyconsiderably with the type of product ion and the amount of energyinvolved. Each product ion has its specific fragmentation thresholdcalled as the optimal CID energy. Normally, it is best to work ataround the optimal CID energy, or just above, to maintain most con-trol over and obtain the highest intensity of the proposed production. Hence, for each pesticide, the optimization of collision energywas necessary to achieve an optimal abundance level of the prod-uct ion selected. At lower energies, the proposed fragmentation didnotoccur. When the energy was too high,other fragmentations mayoccur instead. Corresponding, the intensity of the proposed prod-uct ion would be decreased at a lower or higher CID energy. As an example, Fig. 1a shows a mass spectrum of triadimefon. The mostabundant ion at m/z 57 was selected as the characteristic ion, whilethe lesser abundant ion at m/z 208 was selected as the precursorion due to its higher m/z ratio. Among the three CID mass spectraof this precursor ion (Fig.1b-d), the most abundant ion at m/z 127was generated at 10 eV, rapidly reduced at 20 eV, and nearly disap-peared at 30 eV. The ions at m/z 111 and m/z 99 replaced the ion atm/z 127 as the most abundant ion at 20eV and 30 eV, respectively.Comparing the signal intensities of three ions with CID energiesfrom 5eV to 30 eV, the ion at m/z 127 with the maximum abun-dance and its optimal CID energy at 10 eV was regarded as the bestchoice for inclusion in the database (Fig.1e). The obtained optimalCID energy was included in the database as an important parame-ter for the GC-MS2 measurement in order to achieve the greatestpossible sensitivity. Finally, all three selected ions were identifiedby their chemical formula, and the exact masses of them were cal-culated and used to create the database. In some cases, retentiontime or exact ion masses of one pesticide in the database wouldmatch other pesticides. However, by expanding to four criteria ofretention time, a characteristic ion, a precursor ion, and its production for each pesticide, it is possible to completely distinguish onefrom another. 3.2. Workflow of the database GC-QTOF MS is selected as the analytic instrument for the appli-cation of the database in the workflow because it combines thehigh resolution of TOF analyzer with the capability to perform MS(GC-TOF mode) and MS experiments (GC-QTOF mode). Thus, itis possible to acquire full scan spectra of MSl and MS2 with accu-rate mass, which drastically increases the selectivity of the methoddue to the high amount and quality of the structural informationproduced. Fig. 2 illustrates the whole workflow of database in twosteps. Step one is GC-MS measurement in GC-TOF mode and"MS1screening"for possible pesticides by chemical formula match. Soft-ware named "Compounds Find by Formula Match" is applied topost-run analysis of a GC-Ms1 file measured in a full scan mode.Both the retention time and exact mass of the characteristic ionfrom the database are used to determine the pesticide match. Inaddition, the spacing and relative abundance of the ion's isotopedetected are also considered to estimate the accuracy of the match.After the search, all matched compounds are listed in one tablecalled “Compound List"and their extracted ion chromatogramswith the average spectra can be generated. Search criteria are spec-ified in two key options including mass tolerance and retentiontime window. Depending on the precision of retention time, theretention window would be set to 0.1min or less. However, thematrix effect could cause retention time shifting [29].As an extremeexample, by our estimation, the retention time of methamidophosin the celery matrix was shifted 0.18±0.05 min in six replicatescompared with the calibration standard. Considering the effectinduced by the different matrix, the retention time window wasoptimized to 0.25 min to avoid a false negative on the screening.The mass tolerance was optimized to 5 mDa. Although the TOF MShad been well calculated for high resolution and mass accuracybefore measurements, some factors known as dead time of detec-tor and abundance ofions, could affect measurement accuracy andcause mass error [30]. Thus, the mass tolerance could not be set asexpected (normally <5ppm), or some target pesticides would bemissed. Signal-to-noise ratio (S/N) here was calculated as the peakheight from the extracted ion chromatogram of each characteristicion to the background noise. Noise here was measured"peak-to-peak"from the highest to the lowest intensity over two rangesof 0.1 min before peak start and after peak end. All compoundssatisfying S/N≥3 would be viewed as the proposed pesticides forthe further verification in the second step. Step two was GC-MS- 4000 Fig. 1. (a) Mass spectrum of triadimefon at 200ppb, showing the characteristic ion at m/z 57 (low m/z) with the highest abundance and the precursor ion at m/z 208 (higherm/z) with a lesser abundance.(b) CID mass spectrum of the precursor ion at m/z 208 at the energy of10 eV, showing the most abundant ion at m/z 127. (c) CID mass spectrumof the precursor ion at m/z 208 at the energy of 20 eV, showing the most abundant ion at m/z 111. (d) CID mass spectrum of the precursor ion at m/z 208 at the energy of30 eV, showing the most abundant ion at m/z 99 and the ion at m/z 127 nearly disappearing. (e) Plot of the maximum abundance versus the collision energy in the range of5-30 eV for the ions at m/z 127, 111 and 99. measurement in GC-QTOF mode and “MS2 identification”forstructural confirmation of product ion. All proposed pesticides in“Compound List”were acquired MS2 data in one analytical runusing a targeted MS2 mode specified in the retention time andretention time window. The precursor ions with correspondingoptimal collision energies were referred to the database. The win-dows of retention time were unified to a 0.3 min time length andthe acquired times were optimized to 100 ms/spectrum to give thebest sensitivity for all pesticides in one run. In post-run analysis, anexact ion chromatogram of GC-MS2 was extracted for each prod-uct ion to generate an average spectrum, which was then utilizedto perform the mass match of the product ion in the database. The 3.3. Qualitative validation of the database Because the main purpose of the qualitative screening was todistinguish between negative and positive samples at a determinedlevel, the method proposed here would be considered satisfactorilyvalidated at a certain concentration level only when the target ionwas detected and correctly identified based on the matrix-spikedsamples tested, regardless of their recovery rate and precision.One spinach sample was spiked with 50 test pesticides (Table 1) Fig.2. Workflow of the database. Table 1 Information of 50 test pesticides and their measured mass errors in "MS2 identification". MS2 identification -0.4 Fig. 3. Screening efficiency (SE) for"MS screening"at different pesticide concentrations in a spinach matrix. x104 a 3.5 3 29 53.6243692367 201.4606 01 50 60 70 80 90 1001100120 130140 150 160 170 180 190 200 Counts (%)vs. Msss-to-Charge(m/z) Fig. 4. (a) Multi-extracted ion chromatogram of the spiked sample at 5 ppb using the software"Find Compounds by Formula Match", showing that all 50 test pesticideswere found and the signal of each pesticide met with S/N≥3. (b) Average first-stage mass spectrum of peak at 12.73 min (delta-BHC), showing the characteristic ion at m/z180.9378 and its isotope pattern. Compared with its theoretic value at m/z 180.9373 and isotope pattern in red, all ions were matched well with the spacing and relativeabundance of its isotopes and the measured mass error of 0.5 mDa. (c) Average second-stage mass spectrum of peak at 12.73 min (delta-BHC), showing that the measuredmass error of the product ions was 1.3 mDa in red block. (For interpretation of the references to color in figure legend, the reader is referred to the web version of the article.) at seven concentrations of 0.1, 0.2, 0.5, 1.0,2.0, 5.0, and 10 ppb,analyzed in two replicates together with their respective blanksaccording to the described procedures and submitted to a search inthe database. No signals of such pesticides were obtained from theanalyses of the reagent blank and spinach matrix blank, indicatingthat these materials were free of the 50 test pesticides. The limitof identification (LOI) was established as the lowest concentrationfor all test pesticides found in“Msl screening". The limit of detec-tion (LOD) was established as the lowest concentration that theanalytical process could differentiate from the background levelwith S/N≥3. The capacity of"Ms1 screening" was defined by itsscreening efficiency (SE) which was the percentage of pesticidesfound out of the total pesticides tested. As shown in Fig. 3, SE was44% at 0.1 ppb but increased to 88% at 0.5ppb, and reached 100%at 5 ppb, which was the estimated LOI in this case. Following the"MS1 screening", the proposed pesticides entered the"MS2 iden-tification”step and the mass errors of corresponding product ionswere calculated. The result showed each product ion was identi-fied successfully with the mass error below 2.5 mDa. LODs of thetest pesticides in the"MS2 identification”step were investigatedusing the spinach sample spiked at concentrations between 0.1 and100 ppb. All identified pesticides had concentrations of 10 ppb orbelow, except dinitramine,oxyfluorfen, buprofezin, and bifenazate(Table 1). There are four ways to evaluate the efficiency of a database forscreening pesticide residues,which include sensitivity, accuracy,selectivity and specificity [31]. In the screening, the narrow win-dows ofretention time and mass combined with the exact massesof multi-class characteristic ions in the database improved the highsensitivity and accuracy. Fig. 4a presents a multi-extracted ionchromatogram of the spiked sample at 5 ppb after"MS1 screening",showing LODs of all test pesticides in MS1 at 5 ppb or below. Fig. 4bshows the result of search procedure for the peak at 12.73 min inthe chromatogram of Fig. 4a, which was identified as delta-BHC.This compound was well matched using the theoretic characteris-tic ion at m/z 180.9373 with the spacing and relative abundance ofits isotopes. In addition, the pair of precursor-product ions at m/z180.9373-144.9606 further supported the structure of this com-pound (Fig. 4c). Selectivity and specificity here were supportedby the high separation efficiency of GC and the high resolutionof QTOF MS. For example, chlorothalonil and tolclofol-methyl hadclose retention times and exact masses of characteristic/precursorions (chlorothalonil: retention time at 12.86 min and ion at m/z263.8810;tolclofol-methyl: retention time at 12.99 min and ion atm/z 264.9850). As shown in Fig. 5a, they were separated due to thecombination of GC separation and exact ion extraction from thetotal ion chromatography in GC-MS, although the difference oftheir retention times and accurate ion masses was as narrow as x10 2 12.06 12.99, Tolclofol-methyl 12.06 12.99, Tolclofol-methyl a Chiorothalonil 10.5 11 11.5 12 12.5 13 13.5 14 14.5 15 1:15.5 16Counts (%)vs, Acquisition Timo(min) 1206 1300 b 1212.112.212.3 12.412.5 12.6 12.7 12.8 12.9 13 13.1 13.2 13.3 13.4 13.5 13.6 13.7 13.8 13.9 14 Fig. 5. (a) Multi-extracted ion chromatogram of chlorothalonil at m/z 263.8810 and tolclofol-methyl at m/z 264.9850 in GC-MS1. The corresponding chemical structureswere shown inside.(b) Multi-extracted ion chromatogram of chlorothalonil at m/z 228.9122 (precursorion at m/z 263.8810) and tolclofol-methyl at m/z 249.9613 (precursorion at m/z 264.9850) in GC-MS2. (c) Average accuracy MS’ spectrum of chlorothalonil peaked at 12.86 min, showing that the measured mass error of the product ion at m/z228.9122 was 1.9 mDa in red block. (d) Average accuracy MS’ spectrum of tolclofol-methyl peaked at 13.00 min, showing that the measured mass error of the product ionat m/z 249.9613 was 0.1 mDa in red block. (For interpretation of the references to color in figure legend, the reader is referred to the web version of the article.) 0.13 min and as small as 0.1040 Da. Similarly, in Fig. 5b-d, thesetwo pesticides were also separated and accurately identified dueto the exact masses of product ions in GC-MS2 and the accuratemasses of product ions with measured errors of less than 2.5 mDa.In another case whereo, p'-DDT and p, p'-DDT had the same for-mula of characteristic ion at m/z 235.0076, or where vinclozolinand pirimicarb had the same retention times at 12.17 min, goodresults were obtained thanks to the use of the four identificationcriteria. We could not find the most challenging case where twopesticide compounds share the same retention times and massesof characteristic ions. However, it is predicted that their pairedprecursor-product ions would be most useful in achieving separateidentifications of each (optical-isomers excluded). 3.4. Application to real vegetables Four fresh celery, rape, scallion and spinach vegetables werecollected from a local market. The vegetables were pretreated first according to the Chinese Official Standard Method [32]. Subse-quently, a proved extraction and clean-up method for the volatileand semi-volatile pesticides was utilized for the volatile and semi-volatile pesticides [33]. In this method, solid phase extraction wasapplied for the clean-up, which has been universally adopted formodern residue analysis of non-fatty samples. The optimal con-ditions for extraction based on the references could meet thedemand of this study. After extraction and clean-up, each sam-ple was analyzed following the workflow steps. Table 2 and Fig. 6show that a total of 13 pesticides were found in the four freshvegetables, with 11 in celery, 9 in rape, 3 in scallion and 2 inspinach. Among them, isofenphos-methyl peaked at 20.18 min, acommon phosphoramidothioate pesticide residue, was found inall four vegetables. Compared with celery and rape, scallion andspinach had less amounts of pesticide residues. Considering thevegetable processing environment,the same pesticide residues intrace amounts remaining in different vegetables might be resultsof environmental pollution. ce: found in celery; ra: found in rape; sc: found in water scallion, sp: found in spinach. Fig. 6. Multi-extracted ion chromatogram of pesticide residues in fresh celery, rape, scallion and spinach showing that identified pesticides with 11 in celery, 9 in rape, 3 inscallion and 2 in spinach. Each pesticide met S/N≥3. 4. Conclusion An exact mass database and GC-QTOF MS were combinedfor the monitoringof pesticides remaining in vegetables. In thedatabase, retention time, a single characteristic ion and an ionpair (precursor-product ions) selected from Ms1 and MS’ spec-tra were included for the rapid screening and the identificationof the pesticides. GC coupled with tandem high-resolution QTOFMS provided a powerful analytical method for the identification ofthe pesticides and increased the selectivity of the determination.The efficiency of the method was demonstrated by the lowest con-centration(LOI) at 5 ppb to identify all test pesticides by using the“Msl screening"step and mass errors of less than 2.5 mDa by usingthe “MS2 identification”step, which indicated its high sensitivity,accuracy,selectivity and specificity. Further work is in progress tofind a more universal parameter to replace the retention time inthe database, which varies with the chromatographic conditions.Success in finding this replacement would significantly improvethe application universality of this screening and identificationmethod. Acknowledgements The authors thank Agilent Technologies (China), Inc. for assis-tance in the sample preparation and experiments. The authorsacknowledge the financial support of NSFC (Grant No. 21072215), Innovation Method Fund of China (Grant No. 2010IM030900) andCAS (Grant No. YZ200938). ( References ) ( [ 1 ] F. Vinson,M. M erhi,I. Baldi , H.Raynal, L. Gamet - Payrastre,Occup.Environ. Med. ) 68 (2011)694-702. ( [ 2] G. V an Maele-Fabry, A.C. L a ntin, P . H o et, D . L i son, E n viron. I n t. 37 ( 2 011)280-291. ) ( [3] M.C.Turner, D.T. Wigle, D. Krewski, Cien. Saud e Cole t . 1 6(201 1) 1915-1931. [4] M. Cohen,Aust. Fam. Physician 36 (2007)1002-1004. ) ( [5] A.F. Hernandez, T. Parron, A.M. T s atsakis, M . Requena, R. Alarcon, O. Lopez- Guarnido, Toxicology (2012), Ju n e 21 (Epub ahe a d of p r int). ) ( [6] C. Freire, S. Koifman, Neurotoxicology 33 (2012)947-971. ) ( [7] D.A. Jett,Neurol.Clin. 29 (2011)667-677. ) ( [8] K . Seshaiah, P. Mowli, Analyst 112 (1987)1189-1190. ) ( [9] R. Inam, E.Z. Gulerman, T. Sarigul, Anal. Chim. Acta 579 (2006)117 - 123. ) ( [ 1 0] R .J. Cassella, V.A. Salim, S . Garrigues,R . E. Santelli, M. de l a Guardia, A nal. Sci. 18 (2002) 1 253-1256. ) ( [11] J . Sherma,J. E nviron. Sci. Health B 46 (2011 ) 5 57-568. ) ( [12] C .M. R e ddy, N. J . Drenzek, T.I. Eglinton, LJ . He r aty, N.C. Stu r chio, V.J . Shiner, ) ( Environ. Sci. Pollut. Res. Int. 9(2002) 1 83-186. ) ( [ 1 3] C . Zhang, H. Zhao,M.Wu, X. Hu, X. Cai, L. Ping, Z. Li,J. Chromatogr. Sci.50(2012) ) 940-944. ( [14] C. Wang,S. Ji, Q. Wu, C. Wu , Z. Wang,J. Chromatogr. Sci. 49 (20 1 1)689-694. ) ( [15] T.Cai,L. Zhang, H. Wang,J.Zhang, Y. Guo,Anal. Chim.Acta 706(2011)291-296. ) ( [ 1 6] L. Alder, K. Greulich, G. Kempe, B. V ieth, Mass S p ectrom. Re v . 25 (2 0 06)838-865. ) ( [ 1 7] D . Stajnbaher,L. Zupancic-Kralj,J. Chromatogr. A 1015 (2003) 1 85-19 8 . ) ( [ 1 8] R. Raposo, M. B a rroso, S. Fonseca, S. Costa, J.A. Q ueiroz, E . Gallardo, M . Dias, Rapid Commun. M ass Spectrom. 24(2010)3187-3194. ) ( [19]A. K ruve, K . Herodes, I. Leito, Rapi d Commun. M ass Spectrom. 24 ( 2 010)919-926. ) ( [20 0] ] ( C.J.Tao,J.Y. Hu,J.z. L i, S.S. Zheng, W. Liu, C.J. Li, Bull. Environ. Contam. Toxicol. 82(2009)111-115. ) ( [ 21] G . Salquebre, C. Schummer, M. Millet,O. B riand, B.M.Appenzeller, Anal. Chim. Acta 710(2012)65-74. ) ( [22] T. Vasiljevic, N. Dujakovic, M. Radisic,S. Grujic, M. Lausevic, M . Dimkic, Water Sci. Technol. 66(2012)965-975. ) ( [ 23] T . Portoles, E. Pitarch, F.J. Lopez , F. Hernandez, J . Chromatogr. A 1218 ( 2 011) 303-315. ) ( [24] S.Walorczyk, Rapid Commun. Mass Spectrom. 22 (2008)3791-3801. ) ( [25] K . Z hang, J.W. Wong, P . Yang, D.G. H ayward, T . Sakuma, Y . Zou, A. S chreiber, C . Borton, T .V. Nguyen, B . K aushik, D . O ulkar, A nal. C hem. 84 (2 0 12) 5677-5684. ) ( [26] T . P ortoles, J.V. Sancho, F. Hernandez, A. Newton, P. Ha n cock, J. Mass Spectrom. 45(2010)926-936. ) [27] European Commission Decision. Concerning the performance of analyticalL11methods and the interpretation of results. Document No. L221, ImplementingCouncil Directive 96/23/EC. ( [28] ] L. Sleno,D.A. Volmer, J. Mass Spectrom. 39 (2004)1091-1112. ) ( [29] H .G. Mol, A. Rooseboom,R. van Da m , M. Rod i ng, K. Arondeus,S. Sunarto, Anal. B ioanal. Chem. 389 (2007)1715-1754. ) [30] K. Webb, T. Bristow,M. Sargent, B. Stein (Eds.), Methodology for Accurate Mass ( Measurement of S m all M o lecules, LGC,Limited, Teddington,UK, 2004. ) ( [31] E uropean Commission Decision. Me t hod validation and qua l ity con t rol pro- cedures f or p esticide r esidues a nalysis i n f ood a nd f e ed. D o cument No. SANCO/10684/2009, Implemented on 01/01/2010. ) ( [32] Determination of 450 pesticides and related chemicals residues in fr u its a n d vegetables.GB/T 20769-2008. S t andardization Administration of the People’s R epublic of China. ) [33] G.F. Pang, C.L. Fan, Y.M. Liu, Y.Z. Cao,J.J. Zhang, X.M. Li, Z.Y. Li, Y.P. Wu, T.T. Guo,J.AOAC Int. 89 (2006)740-771. Identification of drug targets by chemogenomic andmetabolomic profiling in yeast Manhong Wu, Ming Zheng, Weiruo Zhang, Sundari Suresh,Ulrich Schlecht, William L. Fitch, Sofia Aronova°, Stephan Baumann°,Ronald Davis°, Robert St.Onge°, David L. Dill and Gary Peltz Objective To advance our understanding of diseasebiology, the characterization of the molecular targetfor clinically proven or new drugs is very important.Because of its simplicity and the availability of strainswith individual deletions in all of its genes, chemogenomicprofiling in yeast has been used to identify drugtargets. As measurement of drug-induced changesin cellular metabolites can yield considerableinformation about the effects of a drug, we investigatedwhether combining chemogenomic and metabolomicprofiling in yeast could improve the characterizationof drug targets. Basic methods We used chemogenomic and metabolomic profiling in yeast to characterize the target forfive drugs acting on two biologically important pathways. Anovel computational method that uses a curated metabolicnetwork was also developed,and it was used to identify thegenes that are likely to be responsible for the metabolomicdifferences found. Introduction The diploid yeast collections contain ~6000 hetero-zygous gene deletion strains and ~5000 homozygousgene deletion strains. A reduction in the copy number ofa gene within a pathway affected by a drug increasesthe sensitivity of a heterozygous deletion strain to thegrowth-inhibitory effect of the drug [1]. A chemicalgenomics assay was developed to exploit this effect forthe characterization of drug targets; the effect of a testdrug on the competitive growth of a complete collectionof bar-coded heterozygous yeast deletion strains ismeasured in a single culture [2]. This method, andrelated approaches using homozygous deletion strains,was used to characterize the targets for multiple drugsand chemicals [2-5].However, a reduction in the copynumber of genes other than the actual drug target couldalso alter the sensitivity of deletion strains, and this couldconfound efforts to identify the specific drug target bythis method. ( Supplemental di g ital content is available for this a rticle. Direct URL citations appear in the printed text and are provided in the HTML and PDF versions of thisarticl e on the journal’s Website (www.pharmacogeneticsandgenomics.com). ) Results and conclusion The combination of metabolomicand chemogenomic profiling, along with data analysescarried out using a novel computational method, couldrobustly identify the enzymes targeted by five drugs.Moreover, this novel computational method has the potentialto identify genes that are causative of metabolomicdifferences or drug targets. Pharmacogenetics andGenomics 22:877-886 C 2012 Wolters Kluwer HealthLippincott Williams & Wilkins. Pharmacogenetics and Genomics 2012,22:877-886 Keywords: chemogenomics, metabolomics,pharmacology @Departmentof Anesthesia, Stanford University School of Medicine,Departmentof Computer Science, Stanford University School of Engineering,‘Department ofBiochemistry and Stanford Genome Technology Center, Stanford University,Stanford and "Agilent Technologies Inc., Santa Clara, California, USA Correspondence to Gary Peltz, MD, PhD, Department of Anesthesia, StanfordUniversity School of Medicine, Stanford University, 300 Pasteur Drive L232,Stanford, CA 94305, USA Tel: +1 650 7212487;fax: +1 650 721 2420; e-mail: gpeltz@stanford.edu Received 15 May 2012 Accepted 22 September 2012 Metabolomic studies have been carried out in yeast [6],but relatively few metabolomic studies have analyzedyeast gene deletion strains [7]. We investigated whetherdrug targets could be determined by coupling chemo-genomic profiling with metabolomic analysis of drugresponses in yeast. The extreme differences in physico-chemicalproperties make it impossible to accuratelymeasure changes in all cellular metabolites using a singleextraction or analytic method. It is not even possible todissolve all types of metabolites into a single solvent, andthere isavery wide range of cellular metaboliteconcentrations, ranging from millimolar concentrations oftriglycerides to subpicomolar levels of signaling molecules.Liquid (LC/MS) [8] or gas (GC/MS) [9] chromatographycoupled1with massspectroscopyhave become thestandard platforms for metabolomic analysis. Althougheach platform can analyze a large number of metabolites,there are limitations on the number of metabolites thatcan be profiled reliably with a single analytic method.Therefore, to identify the cellular targets for bioactivecompounds, we used chemogenomic profiling to informtargeted metabolomic profiling. Specifically, two differentmethods were used to profile drug-induced metabolomicchanges in biosynthetic pathways that were identified DOI: 10.1097/FPC.0b013e32835aa888 9 Pasikanti KK, Ho PC, Chan ECY. Gas chromatography/mass spectrometry inmetabolomic profiling of biological fluids. J Chromatogr B 2008;871:202-211. 10Guo K, Li L. Differential 12C-/13C-isotope dansylation labeling and fastliquid chromatography/mass spectrometry for absolute and relativequantification of the metabolome. Anal Chem 2009;81:3919-3932. 11 Fiehn O, Kopka J, Trethewey RN, Willmitzer L. Identification of uncommonplant metabolites based on calculation of elemental compositions using gaschromatography and quadrupole mass spectrometry. Anal Chem 2000;72:3573-3580. 12Ghannoum MA, Rice LB. Antifungal agents: mode of action, mechanisms ofresistance, and correlation of these mechanisms with bacterial resistance.Clin Microbiol Rev 1999; 12:501-517. 13 Pierce SE, Davis RW, Nislow C, Giaever G. Chemogenomic approaches toelucidation of gene function and genetic pathways. Methods Mol Bio/ 2009;548:115-143. 14 Folch J, Lees M, Sloane Stanley GH. A simple method for the isolation andpurification of total lipids from animal tissues. J Bio/ Chem 1957;226:497-509. 15 Kind T, Wohlgemuth G, Lee do Y, Lu Y, Palazoglu M, Shahbaz S, Fiehn O.FiehnLib: mass spectral and retention index libraries for metabolomicsbased on quadrupole and time-of-flight gas chromatography/massspectrometry.Anal Chem 2009;81:10038-10048. 16 Benjamini Y, Hochberg Y. Controlling the false discovery rate: a practicaland powerful approach to multiple testing. J R Stat Soc Series B 1995;57:289-300. 17 Hastie T, Tibshirani R, Friedman J. The elements of statistical learning. NewYork: Springer; 2001. 18 Romero P, Wagg J, Green ML, Kaiser D, Krummenacker M, Karp PD.Computational prediction of human metabolic pathways from the completehuman genome. Genome Bio/ 2005; 6:R2. 19 Lepesheva GI, Waterman MR. Sterol 14alpha-demethylase cytochromeP450 (CYP51), a P450 in all biological kingdoms. Biochim Biophys Acta2007;1770:467-477. 20)(Craven RJ, Mallory JC, Hand RA. Regulation of iron homeostasis mediatedby the heme-binding protein Dap1 (damage resistance protein 1) via theP450 protein Erg11/Cyp51. J Bio/ Chem 2007;282:36543-36551. 21 Kubo l, Muroi H, Himejima M. Antibacterial activity of totarol and itspotentiation. J Nat Prod 1992; 55:1436-1440. 22 Gachotte D, Barbuch R, Gaylor J, Nickel E, Bard M.Characterization of theSaccharomyces cerevisiae ERG26 gene encoding the C-3 steroldehydrogenase (C-4 decarboxylase) involved in sterol biosynthesis.Proc Natl Acad Sci USA 1998; 95:13794-13799. 23 Kim H, Sablin SO, Ramsay RR. Inhibition of monoamine oxidase A bybeta-carboline derivatives. Arch Biochem Biophys 1997; 337:137-142. 24 Li Y, Sattler R, Yang EJ, Nunes A, Ayukawa Y, Akhtar S, et al. Harmine,a natural betacarboline alkaloid, upregulates astroglial glutamatetransporter expression. Neuropharmacology 2010; 60:1168-1175. 25 Jahaniani F, Ebrahimi SA, Rahbar-Roshandel N, Mahmoudian M.Xanthomicrol is the main cytotoxic component of Dracocephalumkotschyii and a potential anti-cancer agent.Phytochemistry 2005;66:1581-1592. 26 Rommelspacher H. The beta-carbolines (harmanes) - a new classof endogenous compounds: their relevance for the pathogenesis andtreatment of psychiatric and neurological diseases. Pharmacopsychiatria1981;14:117-125. 27 Waitzinger J, Lenders H, Pabst G, Reh C, Ulbrich E. Three explorativestudies on the efficacy of the antihistamine mebhydroline (Omeril). Int J ClinPharmacol Ther 1995; 33:373-383. 28 Abadjieva A, Pauwels K, Hilven P, Crabeel M. A new yeast metaboloninvolving at least the two first enzymes of arginine biosynthesis:acetylglutamate synthase activity requires complex formation withacetylglutamate kinase. J Bio/ Chem 2001;276:42869-42880. 29 Caspi R, Altman T, Dale JM, Dreher K, Fulcher CA, Gilham F, et al. TheMetaCyc database of metabolic pathways and enzymes and the BioCyccollection of pathway/genome databases. Nucleic Acids Res 2010;38 (Database issue):D473-D479. ( 30 Smith DA, O b ach RS. Met a bolites in safety testing (MIST): co n siderationsof mechanisms of toxicity w i th dose, abundance, and duration of t r eatment. Chem R e s Toxico/ 2009; 2 2:267- 2 79. ) ( 31 Guengerich FP, MacDonald JS. Applying m e chanisms of chemical toxicityto predict drug safety. Chem R es Toxico/ 2007; 20:344-369. ) by chemogenomic profiling. A recently developed dansyl[5-(dimethylamino)-1-napthalene sulfonamide] derivati-zation method [10] was coupled with LC/MS analysis toanalyze drug-induced changes in metabolites with primaryor secondary amines (and some other reactive groups).Dansylation increases metabolite detection sensitivity by10-1000-fold, and improves metabolite retention andseparation on reversed-phase columns [10]. In addition,trimethylsilyl derivatization and GC/MS [11] analysiswere used to profile drug-induced metabolite changesin the yeast ergosterol biosynthesis pathway. Ergosterol inyeastisthe functional equivalent of cholesterol inmammalian cells; multiple antifungal agents target thisbiosynthetic pathway [12]. Methods Chemicals Individual amino acids, a mixture of amino acid standards(LAA21), dansyl chloride, and sodium decahydrate, werepurchased from Sigma-Aldrich (St Louis, Missouri, USA).HPLC grade acetonitrile and water were purchased fromHoneywell Burdick and Jackson (Morristown, New Jersey,USA), and LC/MS grade formic acid were from ProteoChemInc. (Denver, Colorado, USA). Mebhydrolin (mebhydrolin1,5-naphthalenedisulfonate salt; M5279-1G), fluconazole(M5279-1G), and totarol (532657-100MG) were purchasedfrom Sigma-Aldrich. Harmine (286044-1G) was purchasedfrom Sigma-Aldrich. Terbinafine (SRP01197t)waspur-chased from Sequoia Research Products (Pangbourne,UK). Chemogenomic screening protocol and data analysis Chemogenomic profiling of yeast deletion strains wascarried out as described previously [4]. Briefly, yeast poolswere grown in the presence of chemical inhibitor atconcentrations that inhibited the growth of a wild-typestrain by ~10-20%.The homozygousispool (~5000strains representing nonessential genes) and heterozy-gous pool (~1100 strains representing genes essential forviability) were grown in YPD+25 mmol/I HEPES (pHadjusted to 6.8) for 5 and 20 generations, respectively.Genomic DNA extraction, PCR amplification of mole-cular tags, and Genflex tag16k array (Affymetrix, SantaClara, California, USA) hybridization, washing, andscanning were carried out as described previously [4,13]Chemogenomic data were analyzed as described pre-viously [4,13]. Briefly,quantile-normalized fluorescencevalues for each tag were log transformed, and thenz-scores were calculated as follows: Tag g-score =[(averageof controls)-(experimental value)]/(SD of controls),where controls are 12 DMSO-treated samples. Each straincontains two molecular tags, and the final -score is theaverage of the two scores associated with that strain. Yeast growth assays Isogenic cultures (100 pl) of yeast deletion strains wereinoculated at a concentration of 0.01OD600/ml and grownin 96-well microtiter plates at 30°C. Optical density was measured every 15 min over the course of several hours(as indicated in graphs) using a GENios microplate reader(Tecan, Mannedorf, Switzerland). The growth rate of eachculture was then determined as the average doubling time(AvgG) by recording the time (At) from the start ofgrowth until the optical density of the culture reached thecalibrated five-generation point and dividing this by thenumber of generations (i.e.five). We quantified the effectof drug on each strain (relative growth) by dividing AvgGat each concentration tested by AvgG at a noninhibitoryconcentration of tthe compound ((1.472,20.098, and0.071 pumol/l forrtctotarol.l, harmine,anddmebhydrolin,respectively). Yeast cell preparation The Saccharomyces cerevisiae strain, BY4743, was inoculatedinto 50ml of YPD media (10g/l yeast extract, 20 g/lpeptone, and 20 g/l dextrose, supplemented with 25 mmol/1 HEPES; pH 6.8) and grown to saturation overnight at30℃. Cells were then diluted to 0.25 OD600/ml in 50 ml offresh media. To these cultures, DMSO was added to a finalconcentration of 1% or a chemical inhibitor was addedat concentrations predetermined to inhibit growth by~10-20%. Cultures were grown for ~4h at 30℃, atwhich point a concentration of ~1OD600/ml was reached.Six 5ml aliquots of each culture were collected bycentrifugation at 3000 rpm for 5 min. Supernatants wereremoved and each cell pellet was washed with 5 ml of PBS.Samples were centrifuged as above, the supernatant ofeach sample was carefully removed, and cell pellets werefrozen at -80°C until further use. Metabolite extraction Yeast pellets were homogenized in PBS buffer with0.5 mg of 0.5 mm glass beads in a tube by vortexing for atotal of 6 min, and the tubes were returned to the icebath every 2 min for recooling.The homogenized mixturewas extracted using the Folch method [14]. The upperaqueous layers;of the chloroform: methanol: watermixture, which contained the polar metabolites extractedfrom the yeast cell pellet, were removed and driedin a Speedvac (Thermo Scientific, Waltham, Massachu-setts, USA). The dried extract was then resuspendedin water. Dansylation Dansylation was carried out using a modification of theprocedures developed by Guo and Li [10]. A volume of50 pl of the polar metabolites were dissolved in 0.1 mol/1sodium tetraborate buffer, and then combined with 50 ulof 20 mmol/l dansyl chloride and vortexed. The mixturewas incubated at room temperature for 30 min before theaddition of 50 pl of 0.5% formic acid to stop the reaction.The supernatant of the reaction mixture was then placedin an autosampler vial. Copyright O Lippincott Williams & Wilkins. Unauthorized reproduction of this article is prohibited. All samples were analyzed on an Agilent TechnologiesInc. (Santa Clara, California, USA) accurate mass Q-TOF6520 coupled with an Agilent UHPLC infinity 1290system. The chromatography runs were carried out usingaPhenomenex (Torrance, California, USA)) Kinetexreversed-phase C18 column (dimension 2.1×100mm,2.6 mm particles, 100 A pore size). Solvent A was HPLCwater with 0.1% formic acid and solvent B was LC/MSgrade acetonitrile withia0.1%formic acid.A30-mingradient at 0.5ml/min was as follows: t=0.5 min, 5%solvent B; t=20.5 min, 60% solvent B; t= 25 min, 95%solvent B; and t=30 min, 95% solvent B. The column wasequilibrated at 5% solvent B for 5 min. All data wereacquired by positive ESI (electrospray ionization) usingMasshunter acquisition software (Agilent TechnologiesInc.). Molecular feature extraction on all data was carriedout using Masshunter qualitative software. Six indepen-dently prepared extracts were analyzed for each yeaststrain, and 700-900 different ion features were identifiedin each extract. The metabolite abundance, which isa measure of the metabolite concentration in an extract,wasdetermined using Agilent Masshunter software,whichhintegrates:stthe peakareafor the irindicatedmetabolite on the extracted ion chromatogram for eachsample. GC/MS analysis The trimethylsilyl-derivatized sterols were analyzed usinga 7890GC/7200 Q-TOF instrument (Agilent TechnologiesInc.). The samples were analyzed on an HP-5ms UI(Agilent Technologies Inc.), 30mx0.25 mm ×0.25 mm,with 1 pl injection, a split 20:1, and a column flow rate of1.0ml/min. The split/splitless inlet temperaturewas250°C, transfer line was 290C, source temperature was230°℃, and quad temperature was 150℃. The oven rampwas programmed to maintain the temperature at 60℃ for1 min, increase at 10°C/min to 325C, and then held for3.5 min. The scan range was 50-600 amu, and the speedwas 5Hz. The data were acquired using Masshunteracquisition software. The key ergosterol pathway inter-mediates were identified by searching against a unit massresolution retention time locked metabolite library [15].Chromatographic peak deconvolution and quantificationwere carried out using Masshunter software. Statistical analyses For the targeted analysis of metabolites in the ergosterolpathways (Supplemental digital content, Table S1, http://links.lww.com/FPC/A529) and in the yeast arg1A, arg3A,arg4A, and arg7A gene deletion strains (Supplementaldigital content, Table S2, http://links./ww.com/FPC/A530),the individual chromatograms of metabolites with abun-dances that were below the detection limit(BDL) wereinspected manually to ensure that the metabolite was notpresent in the sample. If so, the abundance of thesemetabolites was set to 0 (on the log scale) and a standard two-sample two-sided t-testwas usedto)identifymetabolitesi飞with a significant differential abundancebetween all of the control and the drug-treated (or genedeletion) extracts on the log scale. The raw P values fromthe t-test were then adjusted for multiple testing [16]. All metabolites that were present in more than onesample were analyzed when the wild-type and deletion(ARG4,ARG5,6, or ARG8) strains were analyzed in thepresence or absence of mebhydrolin[Supplementaldigital content, Tables S3 (http://links.lww.com/FPC/A531)and S4 (http://links.lww.com/FPC/A532)]. For this analysis,the minimum threshold abundance was empirically set to1000. If a metabolite was not detected in a sample (i.e. itsabundance was below the threshold), it was assumed thatits true abundance was uniformly located between 0 and1000, and its abundance in that sample was assumed tobe one-half of the threshold value. It then had an SD:(lower detection limit)/sqrt(12). When the SEM of themetabolite abundance was estimated from the variance inthe data, this amount of variation was added to theformula to account for the uncertainty introduced by theestimation of this value. Therefore, the SEM reported inSupplemental digital content, Table S3 (http://links.lww.com/FPC/A531)was larger than the SEM estimationobtained by artificially setting all BDL values as equalto half of the lower detection limit. When the statisticalsignificanceof these differences was evaluated,a nonparametric Wilcoxon’s rank-sum test was used toavoid the artifact induced by the BDL observations.Using this method, all BDL values were treated as equalto each other and smaller than those values that wereabove the detection limit. The rawPvalues fromWilcoxon’s test were then adjusted for multiple test-ing [16]. It is noteworthy that 12 samples were analyzedfor each comparison of metabolite levels in wild-typeyeasttversus adeletionstrain. For eachhanalyzedmetabolite, usually all samples (but at least nine of the12 analyzed samples)for each condition had detectablelevels of the analyzed metabolite; the only exception wasN-acetylornithine levels in the Arg5,6 deletion strain,which was BDL for obvious reasons. Principal component analysis (PCA) was used to deter-mine the pattern of metabolite changes in an unbiasedand unsupervised manner. For this analysis, the BDLobservations were treated as described above and the datawere then subjected to a logio-based transformation, andPCA [17] was used to display the data. All analyses werecarried out using R (http://www.r-project.org). Metabolomic network analysis A curated (YeastCyc) metabolic pathway database thatcovers 947 reactions and 694 chemical species is used toanalyze yeast metabolomic datasets [18]. The analysisalgorithm constructs atable that predicts, for eachenzyme-encoding gene and each metabolite in the yeast metabolic database, whether a decrease in the activity ofan enzyme would increase or decrease the concentrationof a metabolite. (As many factors are not modeled in theavailable metabolic networks, not all of these predictionswill be correct. However, our testing indicates that theresults are valid most of the time.) The analysis assumesthat the flux of metabolites through a network is constantand that the concentrations of metabolites will change topartially counteract the effects of altering the activity ofan enzyme, either because of reversible reactions orthrough regulation of the network. Suppose that only theactivity of a single enzyme differs between two samples,and that the enzyme activity is lower in the secondsample. The concentrations of the reactants for thereaction catalyzed by that enzyme reaction will be reliablygreater in the second sample, and the concentrations ofproducts will be less. Consider a reactant A whoseconcentration is increased in the second sample. Otherreactions that consume that reactant could increase invelocity, partially consuming reactant A, and reactionsthat produce A could decrease in velocity to produce lessof it. These changes will alter the concentrations of othersubstrates of those reactions, and these changes willpropagate through additional reactions. These considerations are used to predict the changes inmetabolite concentrations that would occur if an alleliceffect (or if an inhibitor or another factor) reduced theactivity of each enzyme in the network. Initially, thealgorithm predicts that the reactants of the reactionassociated with that enzyme increase and the productsdecrease. It then iteratively propagates the predictions ofincreased and decreased metabolites through the reactionnetwork. When evaluating the propagation of changes inmetabolite concentrations across a network, it is possiblethat the reactant and product concentrations may bealtered in conflicting directions. To cope withthis,increases and decreases in metabolite concentrations arepropagated separately, and the algorithm assigns to eachpredicted change a reliability'factor that is between 0 and1, which heuristically represents our confidence in theprediction. More precisely,the algorithhm separatelycalculates the reliabilities for predictions on the basis ofincreased and decreased metabolite concentrations. Dur-ing iterative propagation, the algorithm maintains a queueof recent updates that have not yet been propagatedthrough reactions. For each iteration, it removes theupdate from the queue with maximum reliability, andpropagates it through all directly connected reactions toupdate the concentrations of other metabolites. This isrepeated until the queue of updates is empty or thereliability of the updates falls below a specified threshold,at which point the algorithm terminates. Tooropagate a change through a reaction, themetabolite be m and the reliability of the metabolitechange be r. All propagated changes will have reliability r/d, where d is the number of reactions that have m asa substrate, on the basis of the reasoning that changes tometabolites involved in many reactions will be diffusedby being distributed among those reactions. Hence,changes in the concentration of metabolites such asglucose, which are involved in many reactions, will havelower reliabilities than changes to metabolites that aresubstrates of very few reactions. Metabolites with degreesof 50 or more are ignored. Without loss of generality,assume that m is a product of a reaction, and that thechange in m is an increase. Then, decreases will bepropagated for all reaction products and increases willbe propagated for all reactants. A change will only bepropagated further if the previously computed reliabilitywas less than r/d. The other cases, where m is a reactantof the reaction or where m decreases, are treated similarly. After propagation terminates, each metabolite will usuallyhave predictions for both increases and decreases. Thenext step of the algorithm chooses a direction of changeby picking whichever has the greatest reliability, andthe change is given that reliability, and the reliabilities ofdecreases are multiplied by -1. If a metabolite has equalreliabilities for increases and decreases, it is assigneda reliability of 0, which is effectively ‘no prediction’. Byrepeating the above computation for each gene that codesfor an enzyme, a prediction table is constructed withgenes as rows and metabolites as columns. Each rowconsists of the predictions computed for the reactioncontrolled by the enzyme coded by that gene. Given a listof measured fold changes for metabolites in differentsamples, this table is used to calculate a score and rankthe genes that are most likely to explain the differences. TIe: scoring ffuunnccttion, whichiImeasures tthe matchbetween the measured and the predicted differencesfor eac1h analyzed reaction, isS(calculated asfollows:m=1rm log2Xm/ym, where M is the number of metabo-lites and xm and ym are the measured concentrations ofmetabolite m in the first and the second samples,respectively. This scoring formula rewards predictionswhose direction matches the measured differences andpenalizes predictions that oppose the measured differ-ences. Predictions with high reliability and large mea-sured fold changes contribute more toward the score thanthose with lower reliability and smaller fold changes. Thereactions are sorted by decreasing scores for presentation.Genes are then ranked in descending order of theirscores. Results Metabolomic profiling of drugs that are known to inhibitergosterol biosynthesis To determine whether the measurement of drug-inducedmetabolomic changes in yeast could identify the knowntarget for a drug,, we examined the changes in theabundance of metabolites in the ergosterol biosyntheticpathway in wild-type yeast cultures after incubation with Copyright O Lippincott Williams & Wilkins. Unauthorized reproduction of this article is prohibited. A simplified diagram of the yeast ergosterol pathway from squalene to ergosterol. The boxes represent the seven metabolites that were measuredin this study, and the enzymes are listed above each step. The red and blue arrows indicate the targets that were identified by chemogenomic andmetabolomic profiling, respectively, for each of the indicated drugs. The insets below each metabolite show the logarithm of the fold-change (relativeto control) in the abundance of that metabolite in wild-type yeast after incubation with the drug that is indicated by the corresponding colored bar.Flu, fluconazole; Harm, harmine; Terb, terbinafine. fluconazole, which is an azole antifungal that is known toinhibit yeast lanosterol 14-a-demethylase (ERG11)[19].This enzyme is a P450 monooxygenase that catalyzes acritical step in the ergosterol biosynthesis pathway [20](Fig. 1). Previously obtained chemogenomic profiling resultsindicated that fluconazole inhibits ERG11 [4].Therefore,wild-type yeast cultures were incubated with a fluconazoleconcentration (70 umol/l for 6 h) that induced a 10% growthinhibition. The abundance of ergosterol pathway metabolitesin control and fluconazole-treated cultures was then com-pared. Fluconazole induced a significant increase in squalene(three-fold, P=1.3×10-) and lanosterol (14-fold, P=3×10-') abundance, and significant decreases (~30-fold)in multiple other downstream ergosterol biosynthesis path-way metabolites, including 4,4-dimemethyl-5o-cholesta-8,14,24-trien-3β-ol, 4,4-dimethyl-5o-cholesta-8,24-dien-3β-ol,and zymosterol (Supplemental digital content, Table S1,http://links./ww.com/FPC/A529). These metabolomic changes are consistent with its known ability to inhibit ERG11(Fig. 1). The same analysis was also carried out on yeast culturesincubated with terbinafine, an allylamine antifungal agentthat inhibits an earlier step in the ergosterol biosynthesispathway (reviewed in [12]). Previously obtained chemo-genomic profiling results indicated that the growth ofERG1 haploinsufficient strains was specifically inhibitedby terbinafine [3]. Consistent with it having a differentsite of action than fluconazole, terbinafine induced adifferent pattern of metabolomic alterations. Terbinafine(20 umol/l) caused an 84.3-fold increase (P value=3×10⁻⁹))·insqualene aabundance andan87.6-fold(P=6×10⁻⁹) decrease in lanosterol abundance, alongwith an ~30-fold decrease in the abundance of multipleother downstream metabolites (Supplemental digital con-tent, Table S1, http://links.lww.com/FPC/A529). This pattern Copyright C Lippincott Williams & Wilkins. Unauthorized reproduction of this article is prohibited. Mebhydroline Homozygous deletion strains Chemogenomic profiling identifies novel inhibitors of the yeast ergosterol pathway. The chemical structures of totarol, harmine, and mebhydrolin areshown on the left. (a and b) The sensitivity of 1147 yeast heterozygous deletion strains (representing the essential yeast genome) was measured inthe presence of totarol or harmine, respectively. The sensitivity of each deletion strain to the compound is plotted on the y-axis and the heterozygousdeletion strains are arranged alphabetically on the x-axis. The most sensitive heterozygous strains in each experiment are labeled. Erg26 is identifiedas the potential target of totarol and Erg7 as the potential target of harmine. (c) The sensitivity of 4886 homozygous deletion strains was measured inthe presence of mebhydrolin. A strain carrying deletions in the CAN1 gene (encoding an arginine permease) was identified as the strain mostsensitive to mebhydrolin. of metabolomic changes indicates that terbinafine inhibitssqualene epoxidase (ERG1) (Fig. 1), which is consistentwith the chemogenomic profiling results. Chemogenomic and metabolomic profiling of two com-pounds, totarol and harmine, whose mechanism of actionhas not been characterized previously, was carried out.Chemogenomic profiling indicated that totarol, a naturalproducttwith1antimicrobialactivity [21],|. inhibitedERG26 (Fig.2 and Supplemental digital content, Fig.S1, http://links.lww.com/FPC/A525). Consistent with thechemogenomic profiling result, totarol (20 pmol/l) induced a 360-fold(P=4.3×10⁻¹¹) increase in 4o-carboxy-4B-methyl-5o-cholesta-8, 24-dien-3B-ol abundance, whereasthe abundance of downstream metabolites (zymosteroland ergosterol) was decreased (Supplemental digital con-tent, Table S1, http://links.lww.com/FPC/A529). The proteinsencoded by the ERG25, ERG26, and ERG27 genes [22]form a multienzyme complex. This complex includesthe C-3 sterol dehydrogenase (ERG26), which converts4o-carboxy-4β-methyl-5o-cholesta-8,,24-dien-3B-olintozymosterol (Fig. 1). Thus, the measured pattern of meta-bolite changes indicates that totarol inhibits ERG26.Harmine is a B-carboline alkaloid found in many middle Copyright C Lippincott Williams & Wilkins. Unauthorized reproduction of this article is prohibited. A diagram of the metabolites and reactions catalyzed by yeast deletion mutants in the arginine biosynthesis pathway is shown. The consecutivereactions catalyzed by ARG8 and ARG5,6 are the probable sites for mebhydrolin inhibition. Two metabolites that could not be measured by dansylderivatization appear in unshaded circles. For harmine, metabolomic profiling implicates a reaction (ERG25) as the target of harmine that isdownstream of that identified by chemogenomic profiling (ERG7). eastern plant families. It has a variety of bioactivities,including inhibition of monoamine oxidase A [23]; alteringcellular gene expression [24], DNA topoisomerase inhibi-tion, and induction of cytotoxicity in cancer cell lines [25].It has been considered as an anticancer agent [25] and forthe treatment of Parkinson’s and neuropsychiatric dis-eases [26]. Chemogenomic profiling indicated that har-mine selectively altered the growth of a yeast strain withan ERG7 (lanosterol synthase) haploinsufficiency (Fig. 2and Supplemental digital content, Fig. S1,http://links.low.com/FPC/A525). However, metabolomic profiling indicatedthat incubation withharmine (200umol/l) increasedlanosterol abundance by 5.4-fold (P=7.5×10-) (Supple-mental digital content, Table S1, http://links./ww.com/FPC/A529), and induced lesser increases in the abundance ofthe next two metabolites in this pathway. This indicatesthat harmine inhibits a reaction that is downstream ofERG7 (Fig. 2), which could be the reactions catalyzed bythe ERG25-27 complex or another downstream enzyme.Chemogenomicand metabolomic profiling identifiedclosely related steps in the ergosterol pathway as thetarget for totarol. However, the metabolomic data indicatethat an enzymatic step that was downstream of the targetidentified by chemogenomic profiling is the actual target.It is likely that the proximity of ERG7 to the actual targetexplains why the growth of a strain with an ERG7haploinsufficiency would be inhibited by harmine. Analysis of inhibitors of arginine biosynthesis To determine whether dansyl derivatization coupled withLC/MS analysis could identify key metabolomic changes,the abundances of arginine biosynthesis pathway meta-bolites in extracts prepared from four S. cerevisiae strainswith gene deletions (arg1A, arg3A, arg4A, and arg7A) were compared with a wild-type strain. The analysesdescribed in the supplement show that the deleted genescould be identified using this metabolomic profilingmethod (Supplemental digital content, Table S2, http://links.lww.com/FPC/A530; Fig. 3). We next examined achemical with a previously unknown target. Mebhydrolinis an antihistamine that was used previously for thetreatment of allergies [27]. Chemogenomic profilingindicated that mebhydrolin selectively affected thegrowth of a yeast strain with an arginine permeasedeletion (CAN1D) (Fig. 2 and Supplemental digitalcontent, Fig. S2, http://links.lww.com/FPC/A526). Wild-typeyeast cultures incubated with a mebhydrolin concentra-tion (150 umol/l, 6h) mebhydrolin that caused a 10%decrease in their growth rate showed 4.4-fold and 3.1-folddecreases in the abundances cof N-acetylornithine(P=0.01) and ornithine (P=0.01), respectively (Sup-plemental digital content, Table S3, http://links.lww.com/FPC/A531). These metabolomic changes indicate thatmebhydrolin affected arginine biosynthesis, but its site ofactionis distinct from the pattern of metabolomicchanges in the ARG1, ARG3, ARG4, or ARG7 deletionstrains (Fig. 3). Notably, the neo1A/NE01 heterozygousstrain also showed sensitivity to mebhydrolin (Supple-mental digital content, Fig. S2, http://links./ww.com/FPG/A526),indicating that this drug may have multiple cellular targetsin yeast. A computational method for metabolomic networkanalysis To facilitate the identification of the mebhydrolin target,a novel computational algorithm for automated analysisof metabolomic datasets was developed. It analyzes themetabolomic changes measured in a set of samples and Copyright O Lippincott Williams & Wilkins. Unauthorized reproduction of this article is prohibited. Table 1The 10 highest-ranked genes output by the metabolic network analysis program after analysis of metabolomic datasets for theindicated yeast gene deletion strains and drug treatments ARG1 ARG3 ARG4 ARG7 Gene Score Gene Score Gene Score Gene Score ARG1 2.34 ARG3 1.65 ARG4 1.88 ARG7 1.90 CAR2 1.48 SPE1 1.65 FUM1 1.19 ARG3 0.63 SPE1 1.47 ARG7 1.30 SPE1 1.08 ARO9 0.63 ASP1 1.14 LYS1 1.30 CAR2 1.08 GDH2 0.63 ASP3-2 1.14 CAR2 1.14 URA2 0.95 BAT2 0.63 ASP3-3 1.14 ACS1 0.68 CAR1 0.68 BAT1 0.63 ASP3-1 1.14 ACS2 0.68 PRS2 0.48 IDP1 0.63 ASP3-4 1.14 ARO9 0.63 PRS1 0.48 IDP2 0.63 ADK2 0.85 BAT2 0.63 PRS3 0.48 IDP3 0.63 ADK1 0.85 BAT1 0.63 PRS4 0.48 SPE1 0.63 Mebhydrolin Fluconazole Totarol Harmine Terbinafine Gene Score Gene Score Gene Score Gene Score Gene Score ARG8 2.45 ERG11 3.24 ERG26 2.71 ERG25 0.61 ERG7 4.01 AAT2 1.11 FDH1 1.74 ERG27 1.76 ERG27 0.24 ERG1 3.05 AAT1 1.11 ADE3 1.73 ERG11 1.63 ERG24 0.24 ERG27 1.24 CAR1 1.11 MIS1 1.73 HEM14 1.35 ERG11 0.19 MHT1 0.37 ALT1 0.94 ERG27 1.44 FMS1 1.35 ERG26 0.13 FDH1 0.37 GLT1 0.88 ERG24 0.71 POX1 1.35 FDH1 0.09 ADE3 0.36 LYS20 0.80 SOD2 0.64 CAT5 1.35 ADE3 0.09 MIS1 0.36 LYS21 0.80 CTA1 0.64 HEM13 1.35 MIS1 0.09 COQ5 0.36 STR2 0.79 CTT1 0.64 AD/1 1.35 ERG9 0.08 COQ3 0.36 ARG2 0.78 SOD1 0.64 COQ6 1.35 MHT1 0.05 SPE2 0.36 Of note, the relatively lower scores for the genes identified from analysis of the harmine dataset are because of the smaller changes in metabolite abundance that wereinduced by harmine. identifiestthegenesthat could be responsi forthe measured changesinmetabolite concentrations.A curated (YeastCyc) metabolic pathway database thatcovers 947 reactions and 694 chemical species is used toanalyze yeast metabolomic datasets [18]. In brief, thisalgorithm uses this yeast metabolic database to predictthe effect that a change in the activity of each enzymewould have on the concentration of each metabolite inthe database.The metabolomic differences measured ina sample dataset are then compared with these predic-tions to compute a score that assesses the match betweenthe predicted and the measured metabolite changes foreach gene. To test thiss computational method, themetabolomic data generated from four yeast strains withgene deletions in the arginine biosynthesis pathway wereanalyzed. For each of these datasets, this algorithmcorrectly identified the deleted gene as the one that wasmost likely to cause the measured metabolomic changes(Table 1). For example, ARG4 (argininosuccinate lyase)was the highest-ranking gene for the ARG4 deletionmutant data (score 1.88). The next highest-scoring genewas FUM1 (score 1.19), which is an enzyme that acts on aproduct (fumarate) of the ARG4 reaction. A moredetailed description of the analysis of ARG3 and ARG4gene deletionsis provided in Supplemental digitalcontent, Fig. S4 (http://links.lww.com/FPC/A528). We nextassessed the ability of this algorithm to analyze themetabolomic changes induced in wild-type yeast afterincubation withfour different drugs,which provideda more rigorous test of this software.The algorithmcorrectly identified ERG11 and ERG26 as the genes that were most likely to be inhibited by fluconazole andtotarol, respectively. ERG25 was the highest-scoring genewhen the harmine data were analyzed. ERG1 had thesecond-highest ranking when the terbinafine data wereanalyzed (Table 1). Taken together, the results fromanalyzingg metabolomic changesin yeast with fourdifferent gene deletions, and after treatment with fourdifferent drugs indicate that this computational methodhassthe potentialto correctly identify the ffactorsresponsible for metabolomic differences in yeast. Analysis of the mebhydrolin-induced metabolomicchanges When the mebhydrolin-induced metabolite changes wereevaluated using the computational method, it identifiedARG8 as the gene that was most likely to be inhibitedby mebhydrolin (Table 1). To examine this possibilitywe(characterizednmebhydrolin-induced metabolomicchanges in ARG4, ARG5,6, and ARG8 deletion strains(Supplemental digital content, Table S4, http://links.lww.com/FPC/A532).The ARG5,6 and ARG8 enzymes catalyzeconsecutive steps in the arginine biosynthesis pathway,which convert N-acetylglutamate into N-acetylornithine(Fig. 3). The pattern shown by PCA indicated thatmebhydrolin treatment induced a large number ofmetabolomic changes in the wild-type strain, but exerteda much smaller effect on the ARG5,6 and ARG8 deletionstrains (Supplemental digital content, Fig. S3, http://links./ww.com/FPG/A527). Importantly, the mebhydrolin-induced changes in arginine biosynthesis pathway meta-bolites (citrulline, ornithine, N-acetylornithine) that were Copyright C Lippincott Williams & Wilkins. Unauthorized reproduction of this article is prohibited. observed in the wild-type strain did not occur in the drug-treated ARG5,6 and ARG8 deletion mutants (Supple-mental digital content, Table S3, http://links.lww.com/FPC/A531). Mebhydrolin induced a larger number of metabo-lomic changes in the ARG4 strain (Supplemental digitalcontent, Fig. S3, http://links.lww.com/FPC/A527), a strainthat has a gene deletion in a more distal segment of thearginine biosynthesis pathway (Fig. 3). Taken together,the metabolomic profiling results in the wild-type and inthe deletion strains indicate that mebhydrolin targets anearly step in the arginine biosynthesis pathway, which iscatalyzed either by ARG5,6 or by ARG8. As dansylderivatization cannot measure an intermediate (N-acetyl-glutamate) in the reaction cascade catalyzed by theseenzymes, the metabolomic profiling data cannot deter-mine which of these two enzymes is the specific target.The kinase encoded by ARG5,6 forms a complex with theacetylglutamate synthase that is produced by ARG7 andARG2, which regulates the early steps in the argininebiosynthesis pathway [28]. Discussion Metabolomic profiling cannot systematically quantify allcellular metabolites, and we believe that it is best appliedin a targeted manner. Conversely, chemogenomic profil-ing can interrogate a wide range of genes systematically,but the resulting sensitivity profiles do not unambigu-ously identify the target for the chemical in question. Formost of the drugs analyzed here, metabolomic andchemogenomic profiling identified concordant targets.However, in the case of harmine, chemogenomic andmetabolomic profiling identified different targets, both ofwhich were in the ergosterol pathway. Thus, we arguethat a combination of the two approaches, comprehensivechemogenomic profiling, followed by targeted metabo-lomic profiling, provides a superior strategy for drugtarget identification than the use of either method alone. The basis for the different mebhydrolin targets identifiedby metabolomic and chemogenomic profiling is quiteclear. As arginine is present in the growth medium, thegrowth of a yeast strain with an arginine transporter genedeletion would be highly sensitive to an inhibitor ofarginine biosynthesis, which explains why chemogenomicprofiling would identify CAN1D as sensitive to mebhy-drolin. However, metabolomic profiling identified theenzymes in the arginine biosynthesis pathway that couldbe the direct target for this drug. Thus, the results fromthe two methods are actually confirmatory of each other;the chemogenomic and the metabolomic results indicatethat mebhydrolin affects arginine biosynthesis. Although we analyzed yeast metabolomic data, themetabolomic network analysis1Sprogram could also beused to analyze metabolomic data obtained from mouse,rat, or human sources. This capability is enabled by theavailability of metabolomic networks that have beenprepared for multiple other mammalian species [29]. Of note, the accuracy of the results produced by themetabolic network analysis program is limited by theaccuracy and completeness of the available metabolicnetworks. There are still many interactions betweenmetabolites and enzymes that are not modeled in theexisting metabolic networks, and there are many meta-bolites that are yet to be discovered. However, thefunctioning of this program will undoubtedly improve asthe holes in the available networks are filled in. Relatedto this, it will be important to determine how efficientlydrug targets identified in yeast translate into mammaliansystems. This can be assessed by evaluating the effectthat the drugs have on rodent tissues in vivo or on humancells in vitro. A limitation for the utility of this yeastsystem is the fact that it is most often a drug metabolite,rather than the parent drug itself, that induces anunexpected drug-induced toxicity [30,31]. As yeast lackhuman drug-metabolizing enzymes, it is likely that the‘off-target’effects induced by human drug metaboliteswill be difficult to identify using a yeast-based system.However, the targets of the parent drug, which areidentified using this yeast-based system, are more likelyto translate to mammalian systems. Acknowledgements G.P. and M.W. were partially supported by funding froma transformative RO1 award (1R01DK090992-01). D.L.D.and W.Z. were supported by a King Abdullah Universityof Science and Technology(KAUST) research grant underthe KAUST Stanford Academic Excellence Allianceprogram. S.S., U.S., R.D. and B.S. were partially supportedby funding from the National Human Genome ResearchInstitute (2R01HG003317-05) provided to R.D. Conflicts of interest There are no conflicts of interest. References 1 Giaever G, Chu AM, Ni L, Connelly C, Riles L, Veronneau S, et al. Functionalprofiling of the Saccharomyces cerevisiae genome. Nature 2002;418:387-391. 2Giaever G, Flaherty P, Kumm J, Proctor M, Nislow C, Jaramillo DF, et al.Chemogenomic profiling: identifying the functional interactionsof small molecules in yeast. Proc Natl Acad Sci USA 2004; 101:793-798. 3 Lum P, Armour C, Stepaniants S, Cavet G, Wolf M, Butler J, et al.Discovering modes of action for therapeutic compounds using a genome-wide screen of yeast heterozygotes. Cell 2004; 116:121-137. 4Hoon S, Smith AM, Wallace IM, Suresh S, Miranda M, Fung E, et al. Anintegrated platform of genomic assays reveals small-molecule bioactivities.Nat Chem Biol 2008;4:498-506. 5 Parsons AB, Lopez A, Givoni IE, Williams DE, Gray CA, Porter J, et al.Exploring the mode-of-action of bioactive compounds by chemical-geneticprofiling in yeast. Cell 2006;126:611-625. ( 6 C rutchfield CA, Lu W, Melamud E, Rabinowitz JD. Mass spectrometry-basedmetabolomics of yeast. Methods Enzymo/ 2010; 4 70:393-426. ) ( 7 Cooper SJ, Finney GL, Brown SL, Nelson SK, Hesselberth J , MacCoss MJ, et al. High-throughput profiling of amino acids in strains of the Saccharomyces cerevisiae deletion collect i on. Genome Res 201 0 ;20:1288-1296. ) 8 Want EJ, Nordstrom A, Morita H, Siuzdak G. From exogenous toendogenous: the inevitable imprint of mass spectrometry in metabolomics.J Proteome Res 2007;6:459-468. Copyright C Lippincott Williams & Wilkins. Unauthorized reproduction of this article is prohibited. 如需了解更多咨询 www.agilent.com/chem/cn 查找当地的安捷伦客户服务中心: www.agilent.com/chem/contactus:cn 安捷伦客户服务中心: 免费专线:800-820-3278400-820-3278(手机用户) 联系我们: customer-cn@agilent.com 在线询价:www.agilent.com/chem/quote:cn 本资料中的信息、说明和指标如有变更,恕不另行通知。 ( ◎安捷伦科技(中国)有限公司,2013 ) ( 2013年2月1日中国印刷 ) 摘要本研究建立了一种预测橄榄油能否通过特级初榨感官测试的模型。使用的仪器为安捷伦7890A GC 和安捷伦7200 系列精确质量Q-TOF 质谱联用系统,同时在电子轰击电离源(EI)和正化学电离源(PCI)模式下,检测发现了橄榄油中存在大量的化合物。使用Mass Profiler Professional 软件进行统计分析并建立分类模型,该分类模型利用 5 种特定化合物可以准确预测一种橄榄油能否通过感官测试。引言在美国,对地中海食物和橄榄油健康效应的日益追捧使橄榄油的需求快速增长。到2013 年,美国市场预期将超过18 亿美元。橄榄油被认为与欧洲南部人口的长寿和心脏病低发率有关。事实上,食品与药品管理局(FDA)已经批准橄榄油中单不饱和脂肪酸降低冠心病风险的健康声明。最近有研究表明,橄榄油的消炎作用主要来源于第一次压榨得到的特级初榨橄榄油(EVOO),很少有食物含有如此丰富的抗氧化物和消炎成分。国际橄榄油理事会(IOC)和美国农业部(USDA)已经建立了 EVOO 的分类标准,包括由品鉴小组进行的感官测试和化学测试。然而,最近的研究表明,占美国EVOO 市场99% 的进口橄榄油往往通不过EVOO 类别的感官测试,加之感官测试是昂贵和主观的。基于美国市场EVOO 强大的市场份额和对EVOO 日益增长的需求,非常值得开发一种可以预测橄榄油能否通过感官测试的化学筛查法。这样,生产厂商只需提交那些通过几率高的橄榄油产品进行感官测试。这样的化学筛查同样可以降低鉴别和认证的费用和时间,同时提高市场上EVOO 的品质。该应用报告证明了开发一种模型预测橄榄油能否通过感官测试的可行性。该模型使用一种类似于近期红酒分类报告中应用的非目标化合物分析方法,同时采用电子轰击电离源(EI)和正化学电离源(PCI)模式采集数据,使用安捷伦7890A GC 和安捷伦 7200 系列精确质量Q-TOF 质谱联用系统,安捷伦MassHunter 软件用于谱图的解卷积,Mass Profiler Professional(MPP)软件用于深度统计分析和建立分类模型。橄榄油样品中的5 种特定化合物与感官测试失败有关。结论使用Agilent GC/Q-TOF 系统的精确质量EI 源和正CI 源扫描数据建立了一个模型,用于准确预测一种橄榄油样品是否能够通过感官测试。虽然只是使用小样本创建的模型,但也充分证明了这种方法的可行性。使用增大的样本量构建的预测性模型将为橄榄油厂商提供一种经济、快速的测试方法预测他们的产品能否通过感官测试,从而,避免了对劣质油进行感官测试花费的时间和金钱。对没有通过感官测试的EVOOs 中聚积化合物的识别与通过味道识别劣质橄榄油一样可靠。这种方法还可以被创造性地用于构建另一种模型,以预测一种橄榄油是否被掺杂了廉价替代品。
确定

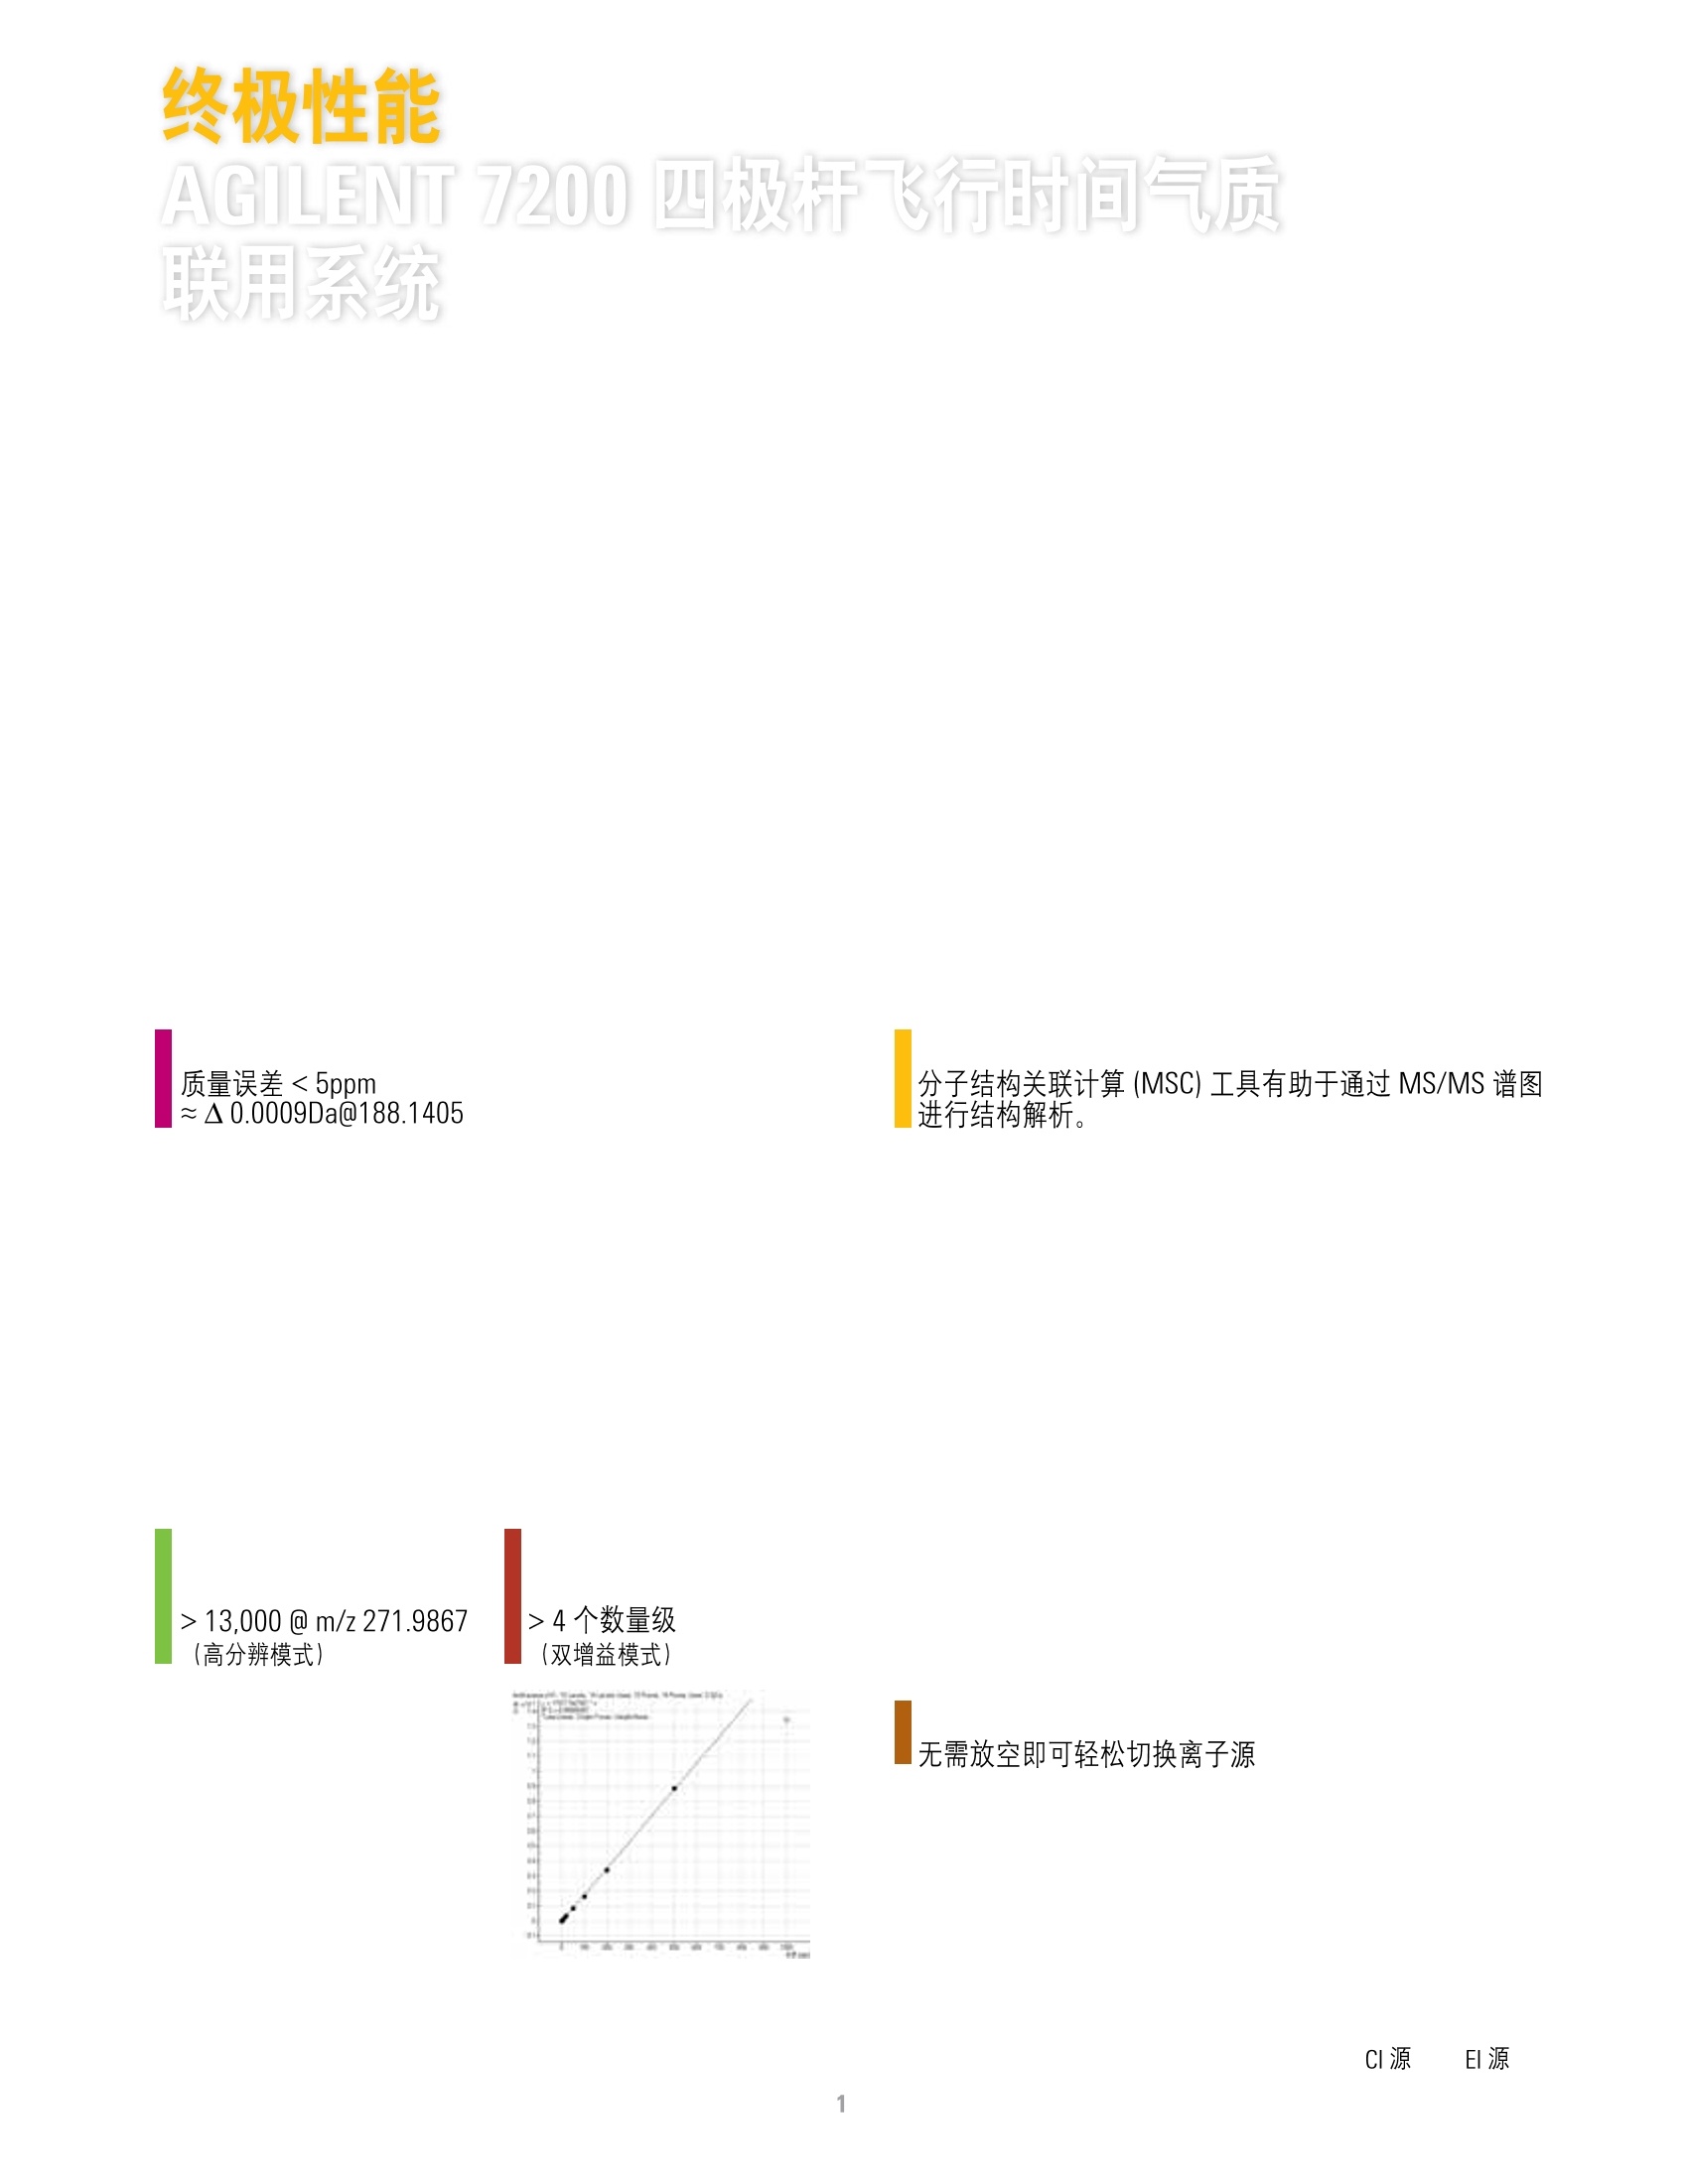

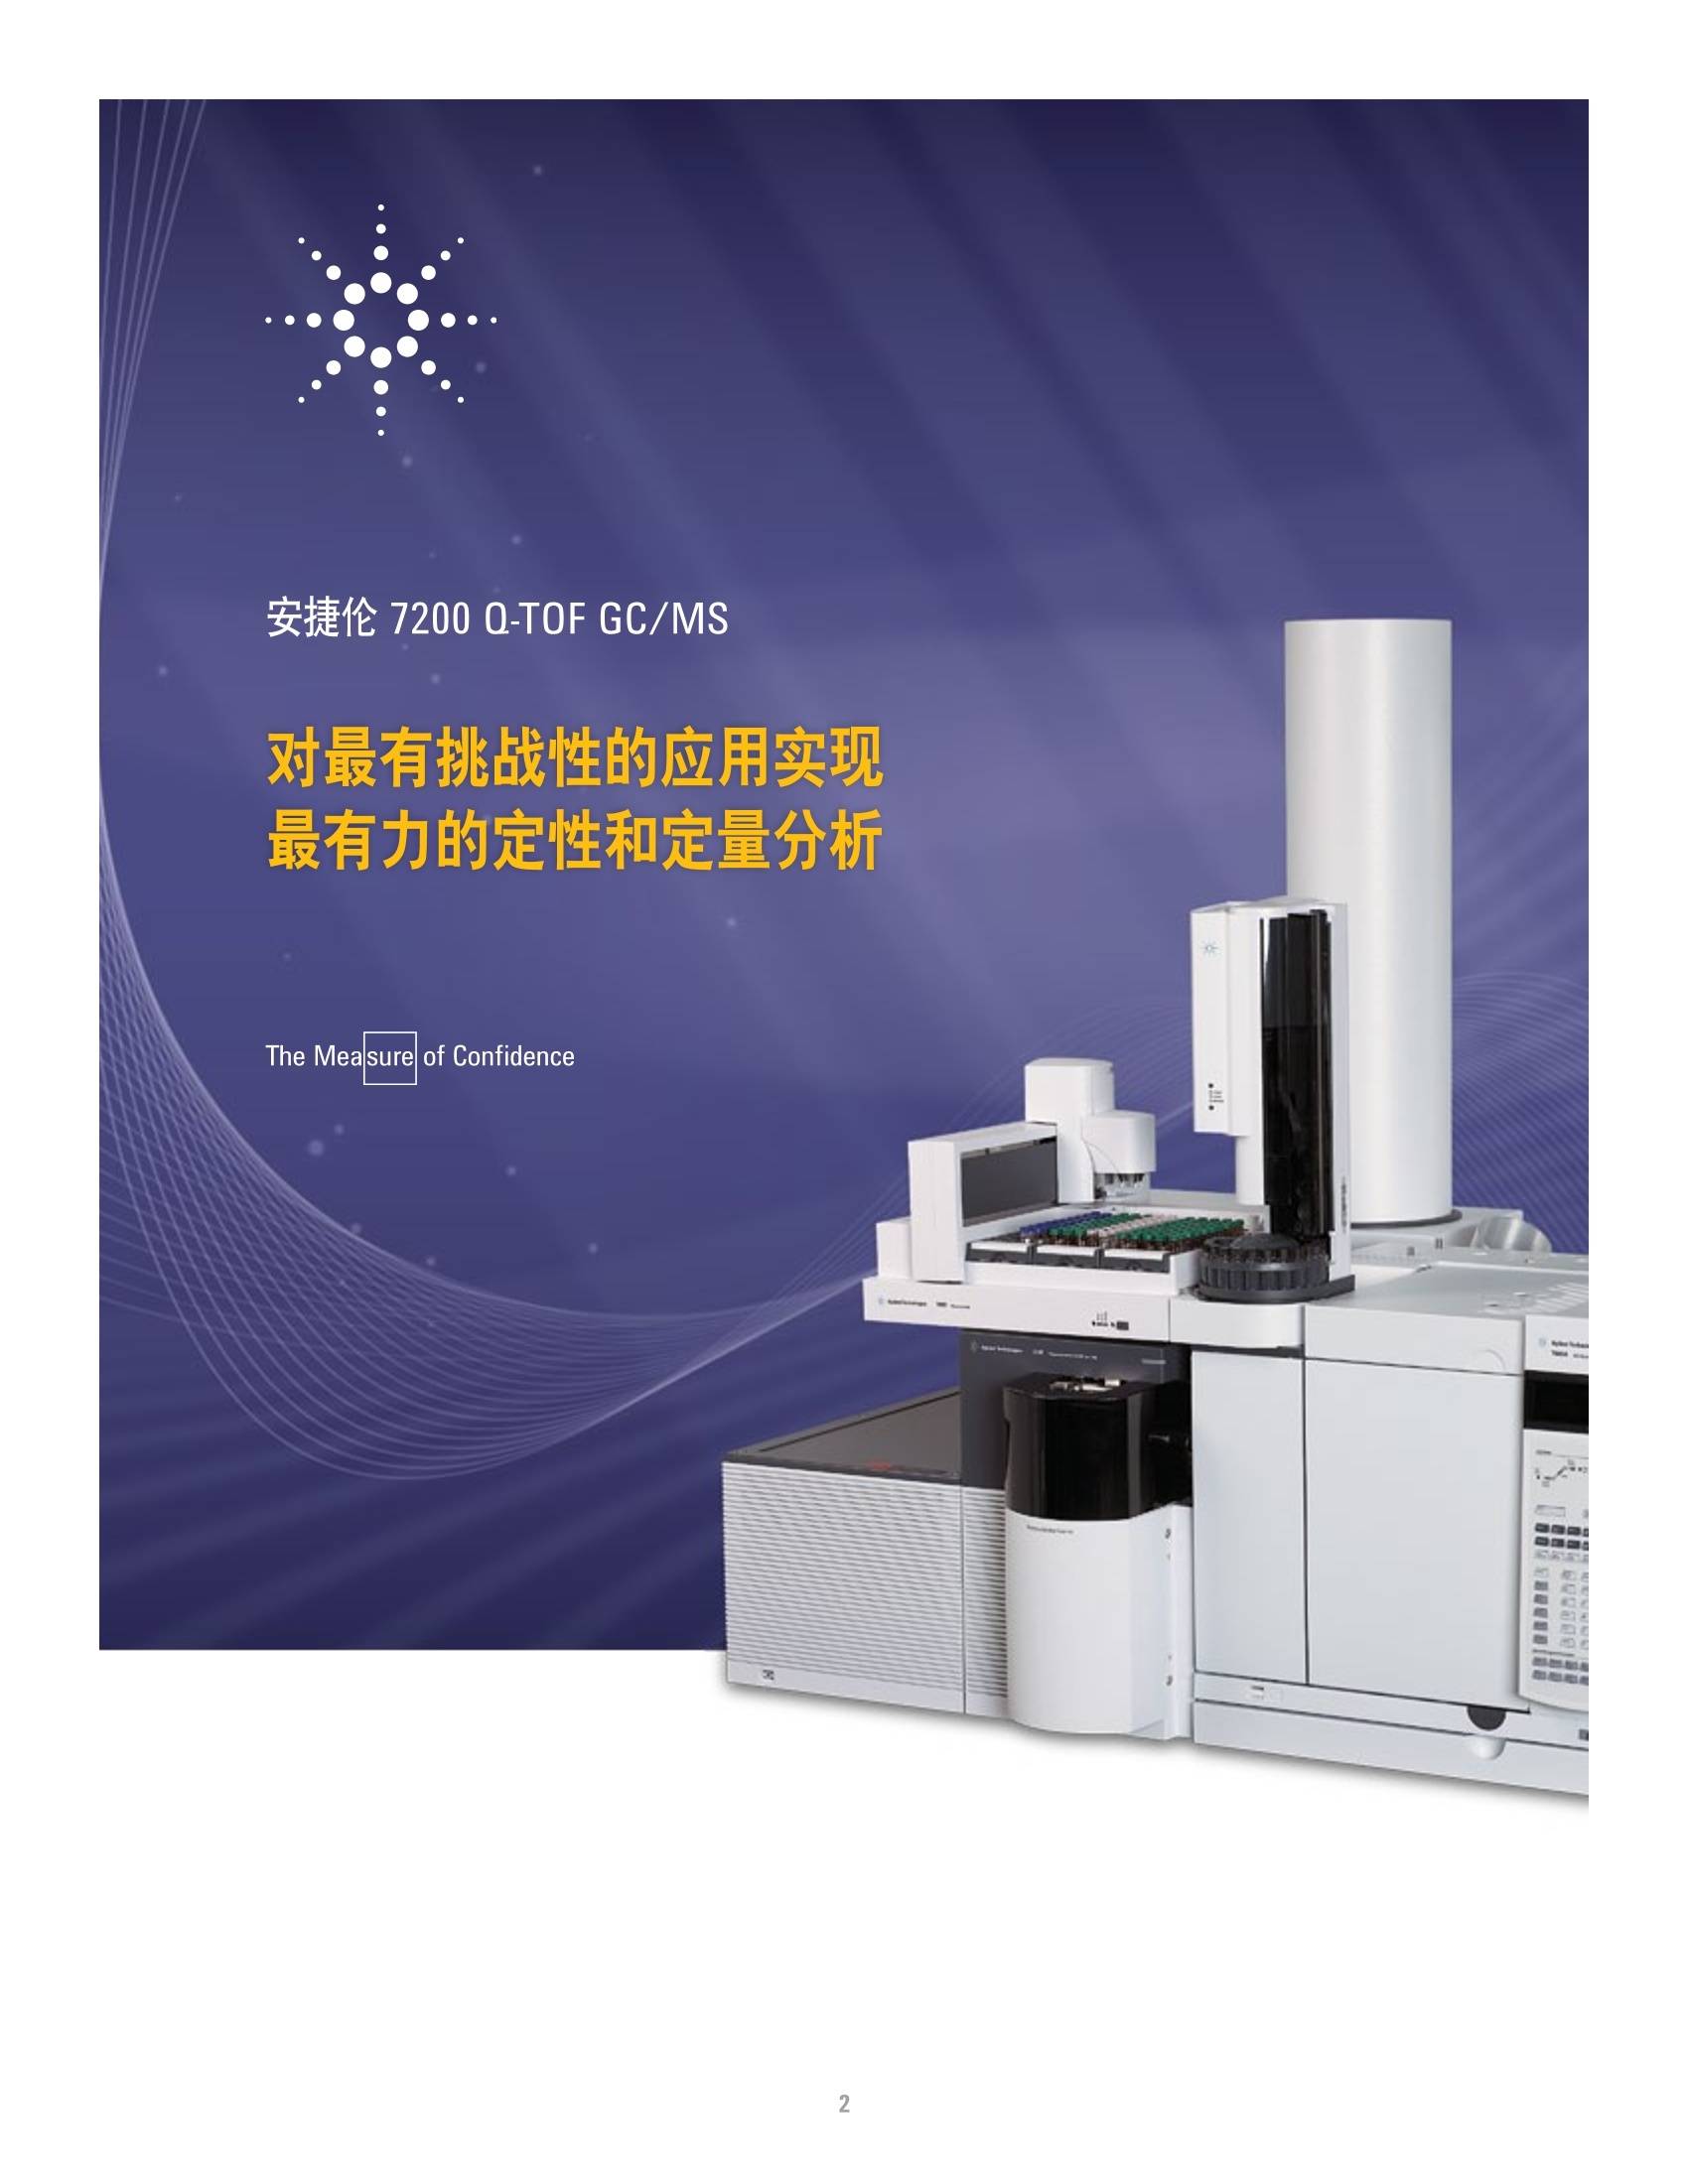
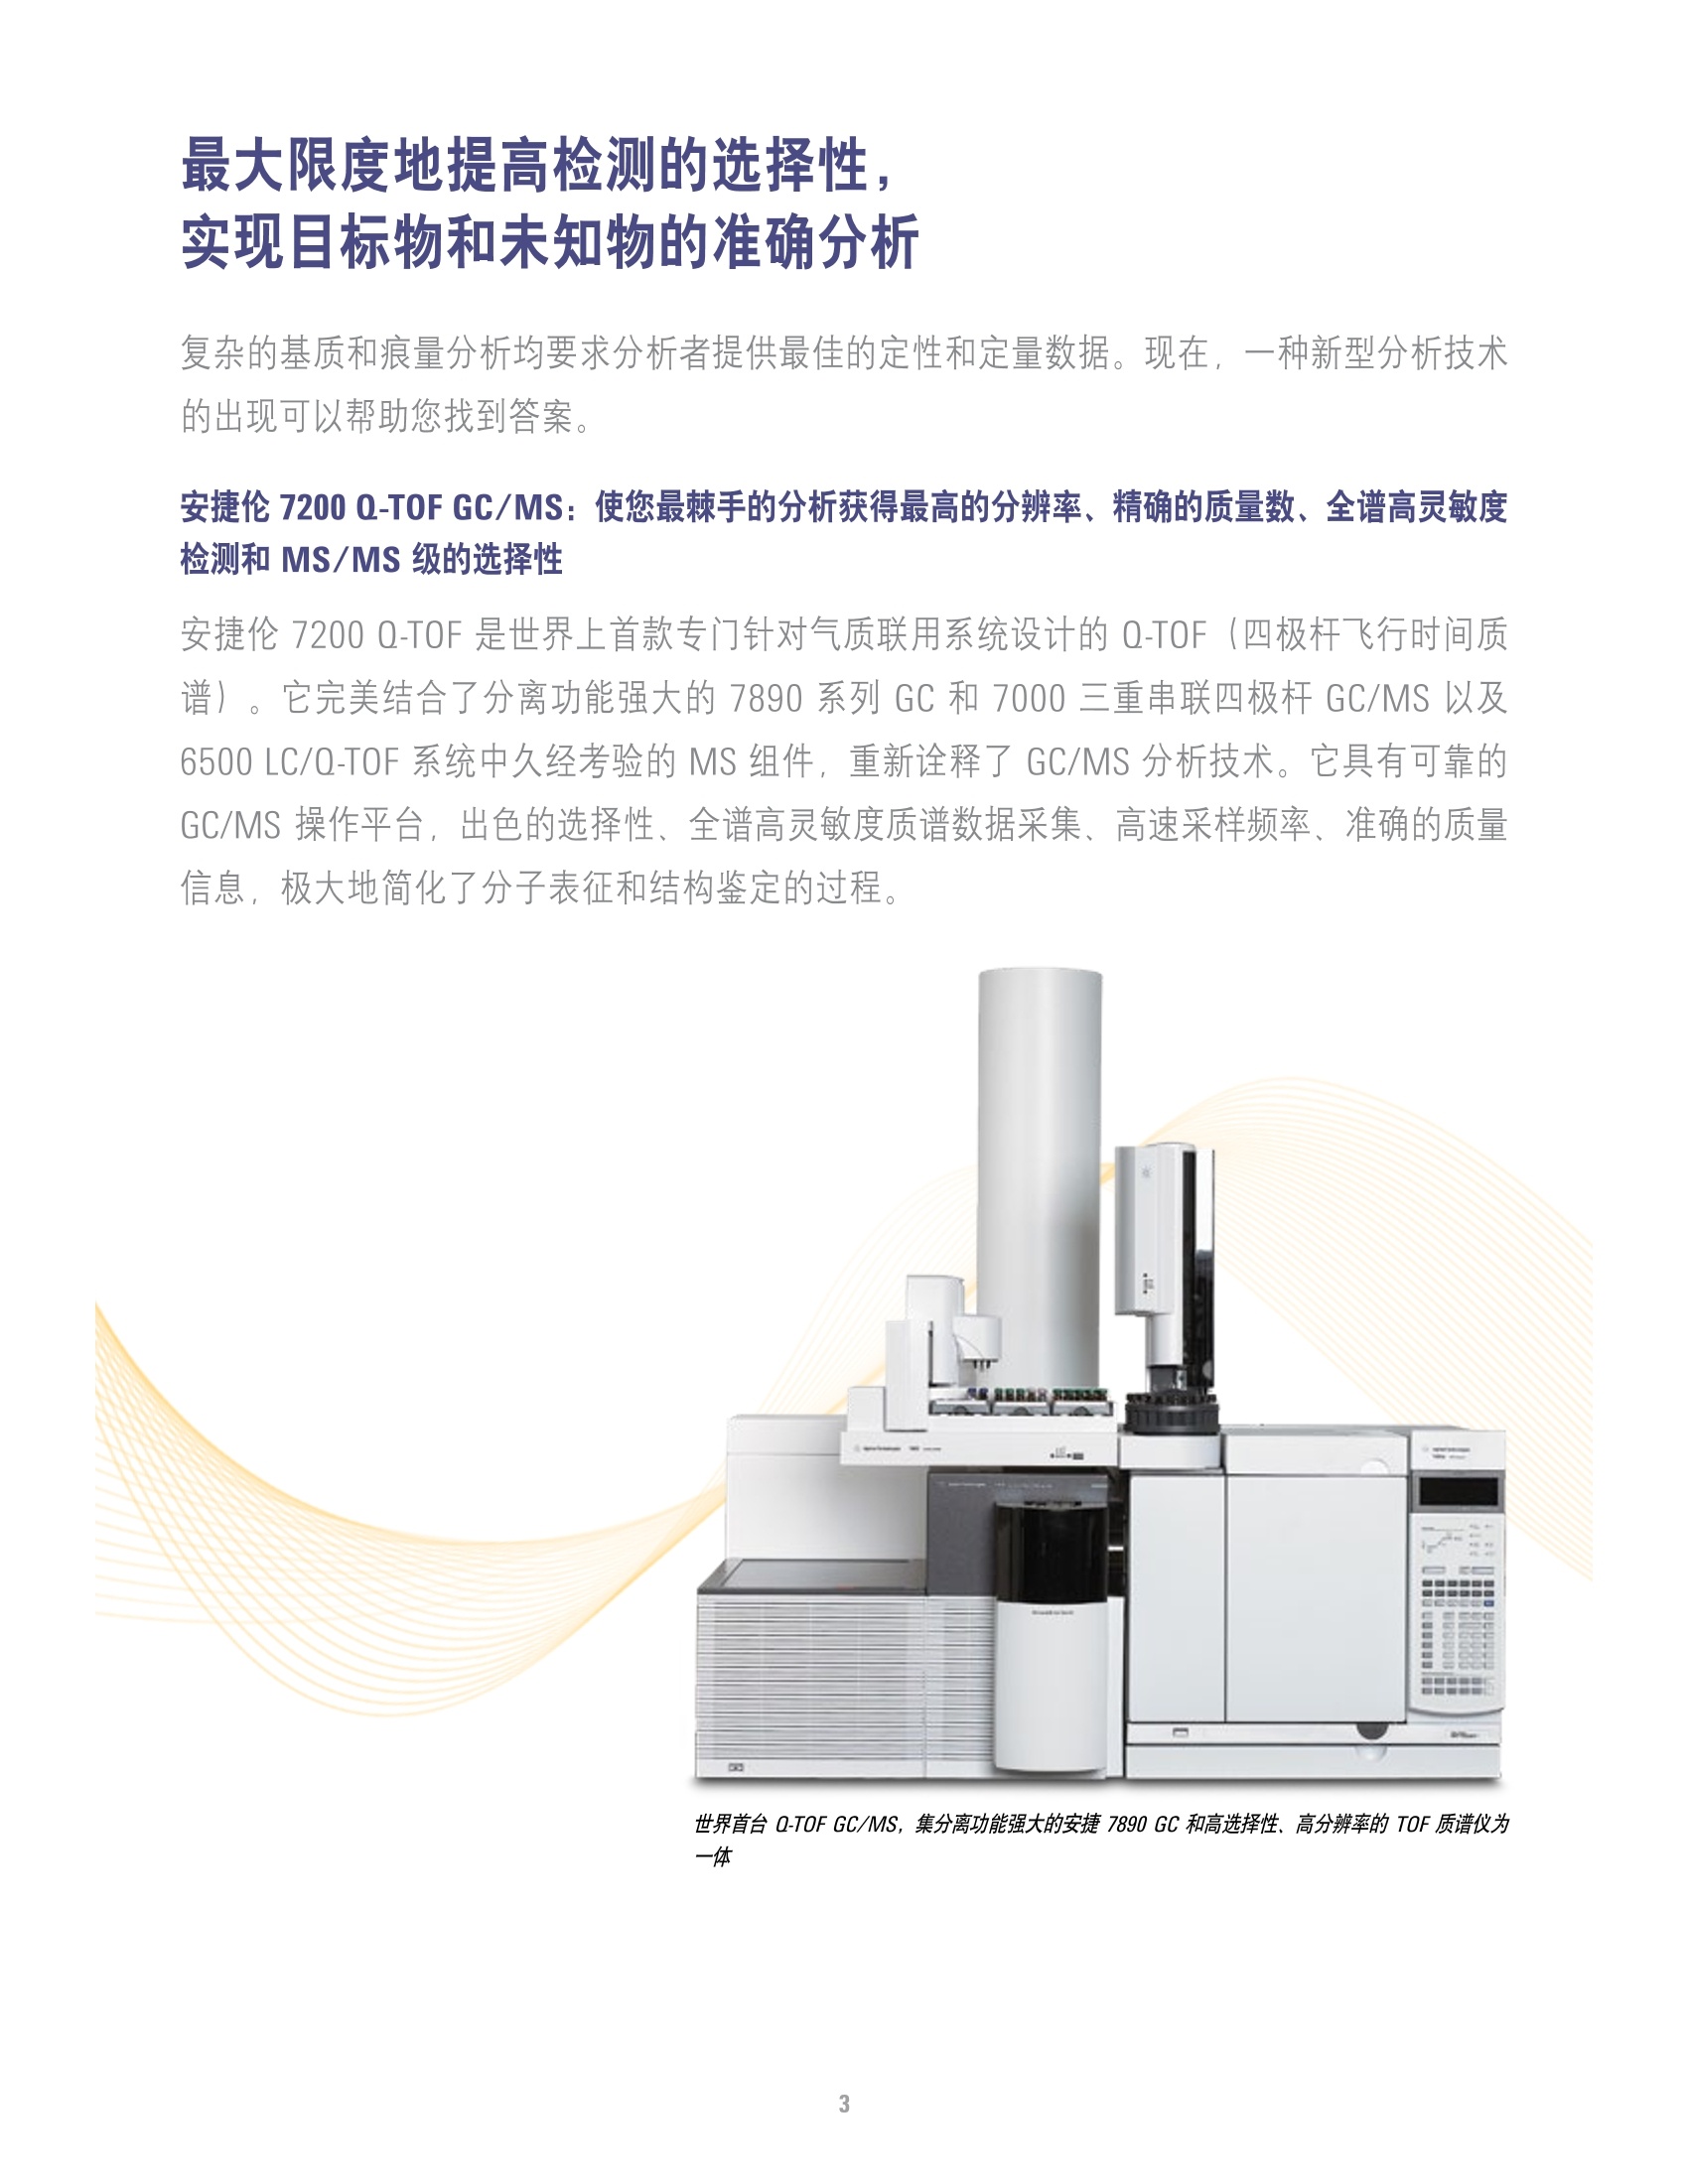
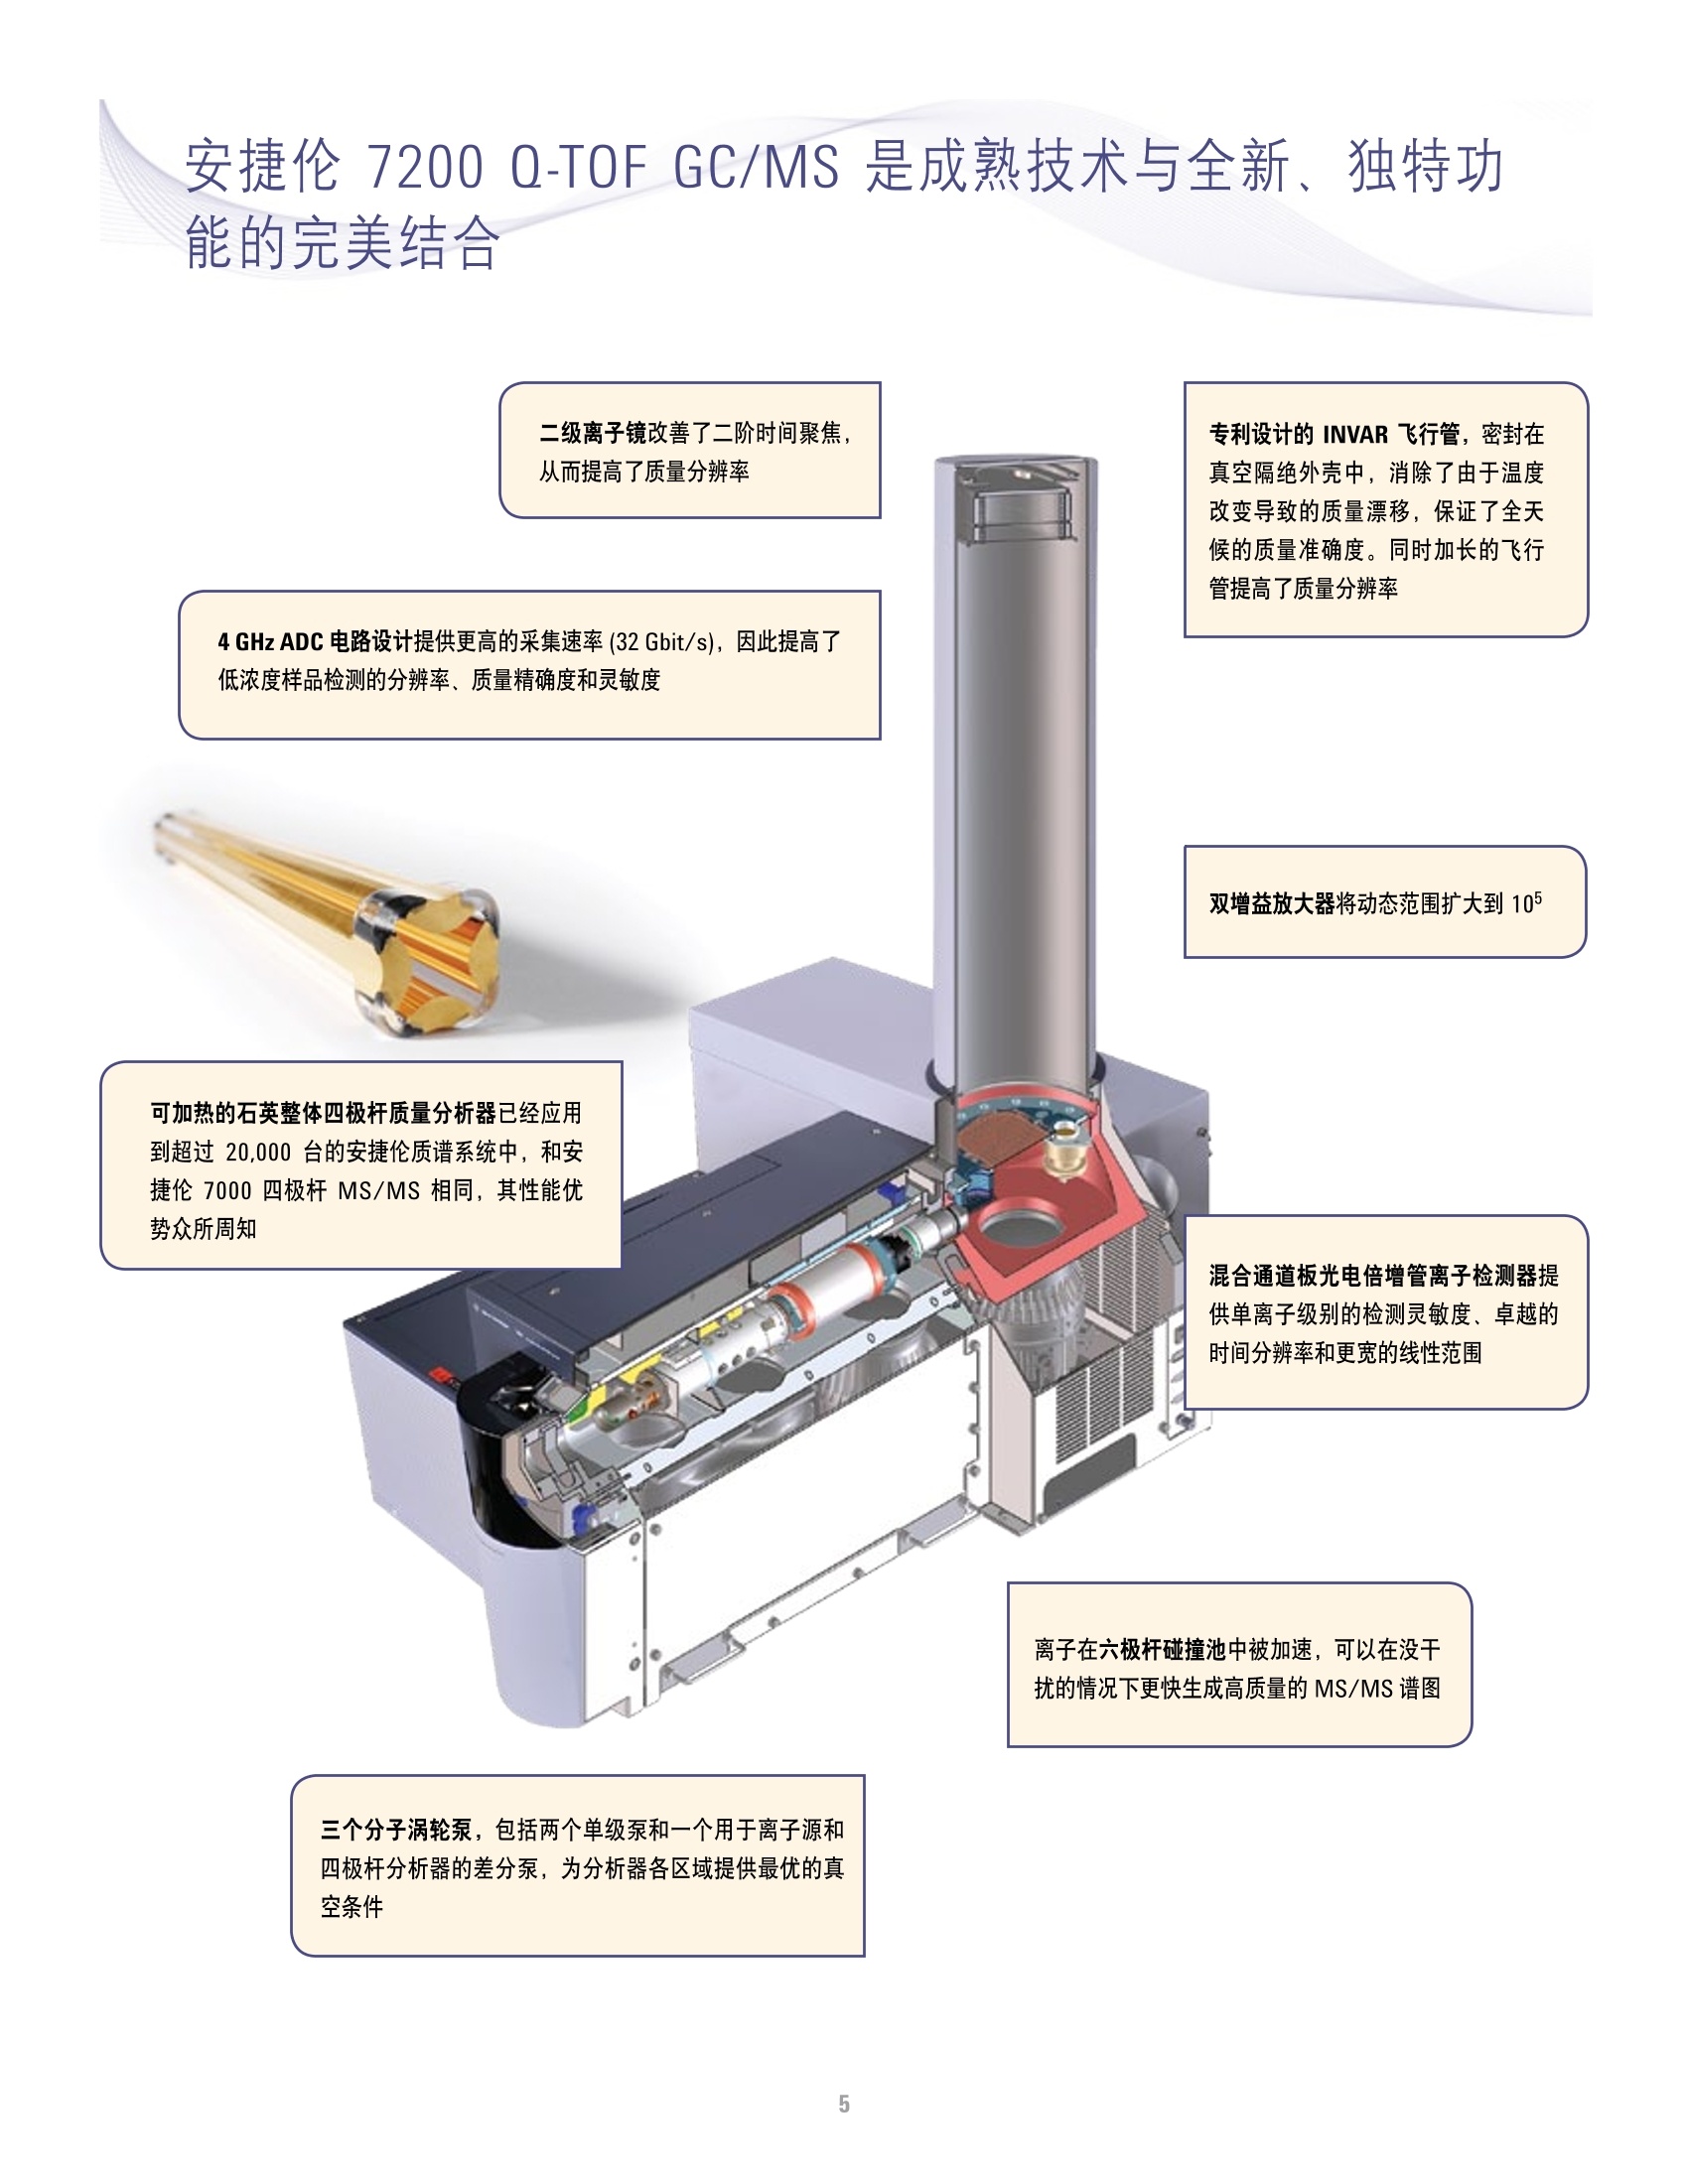
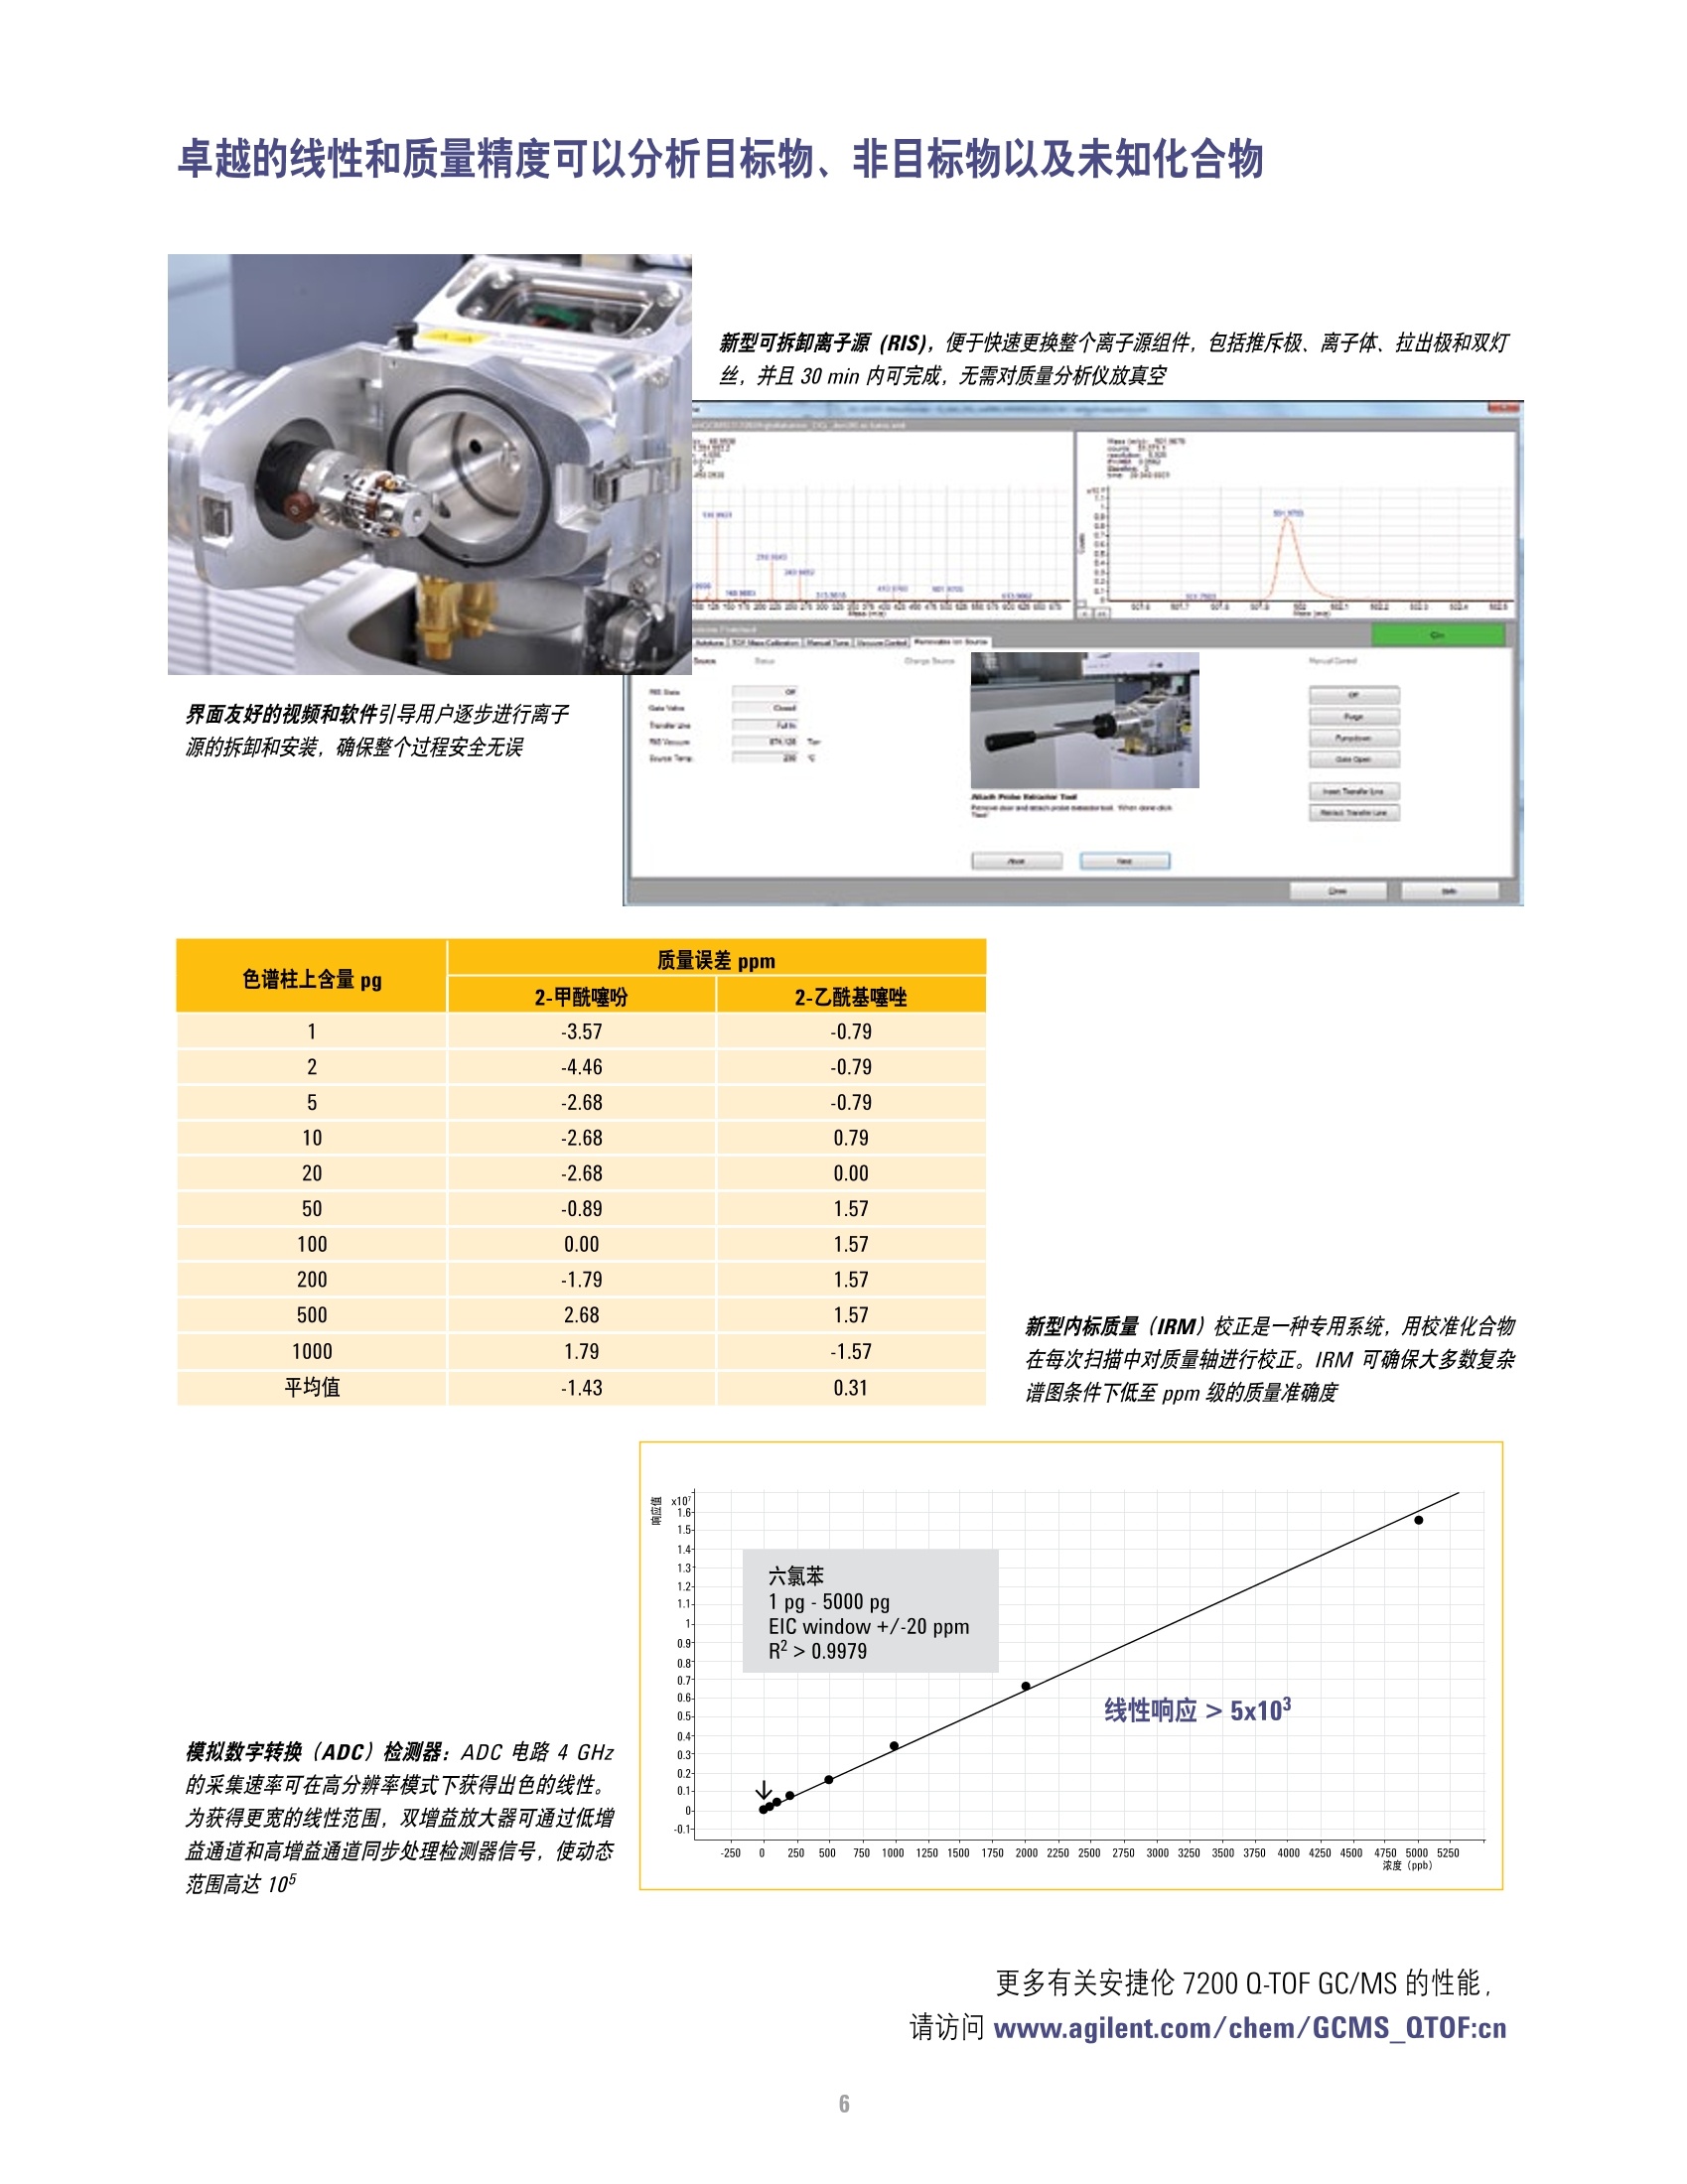
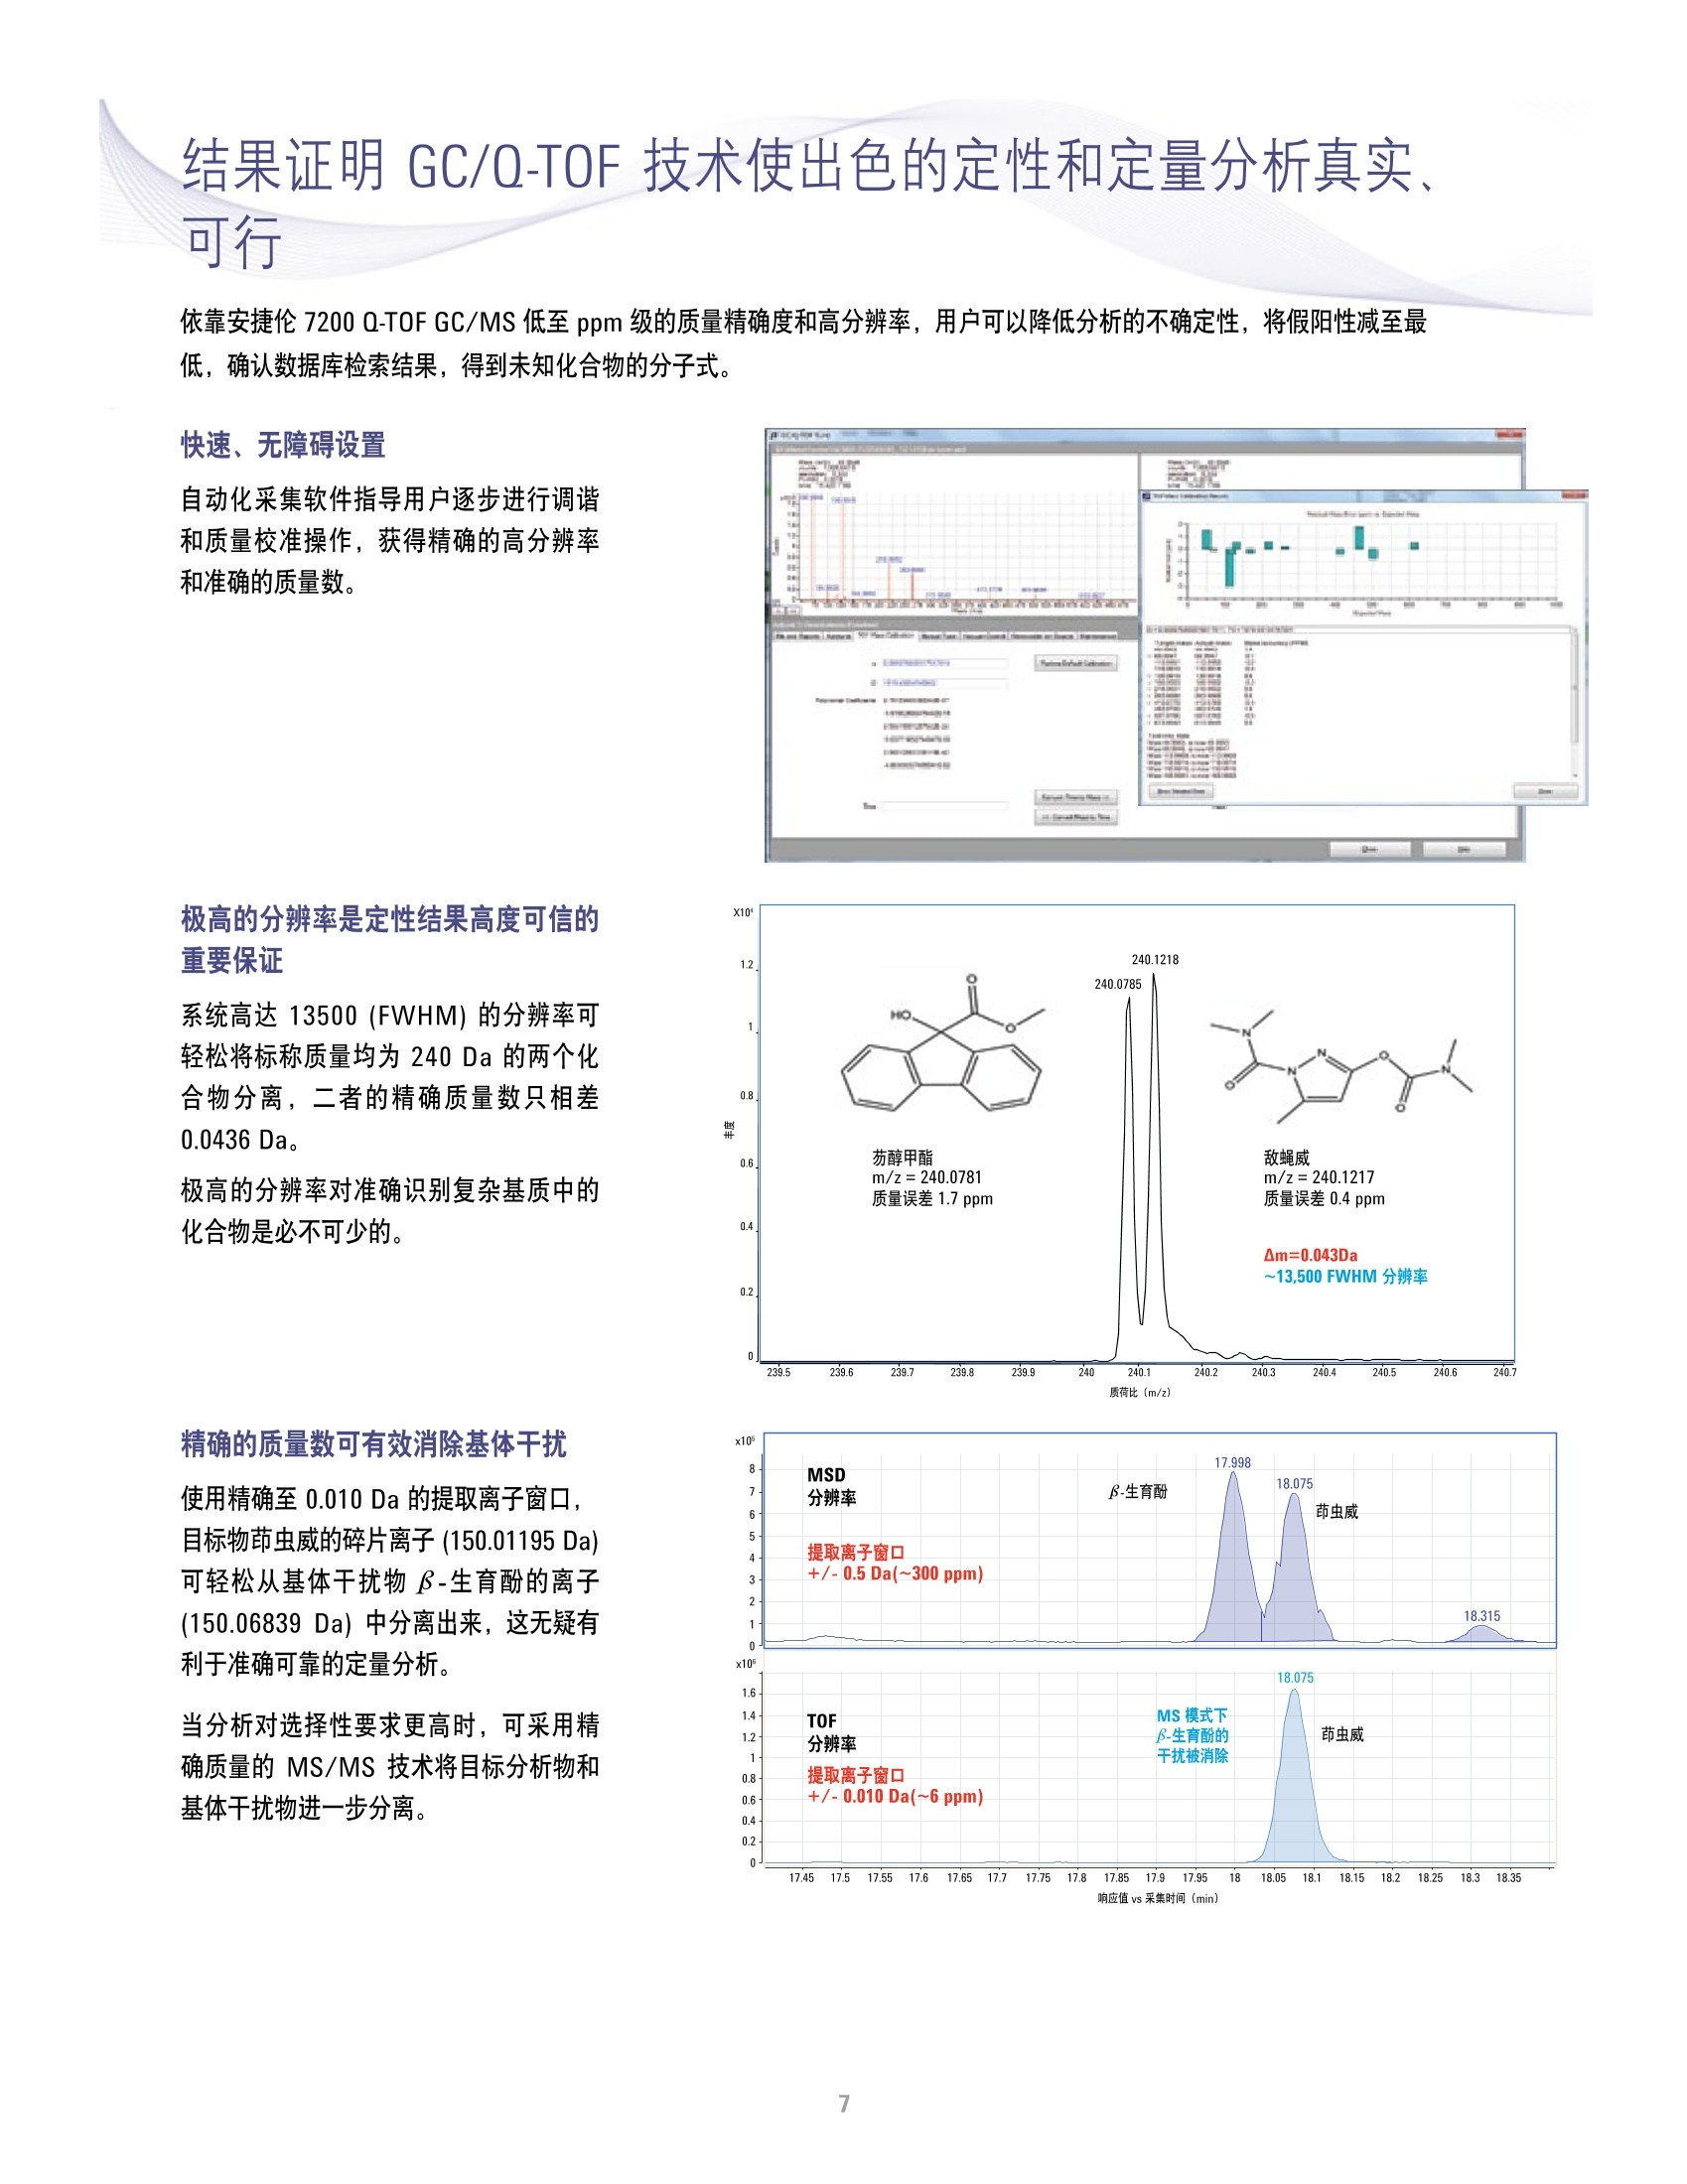
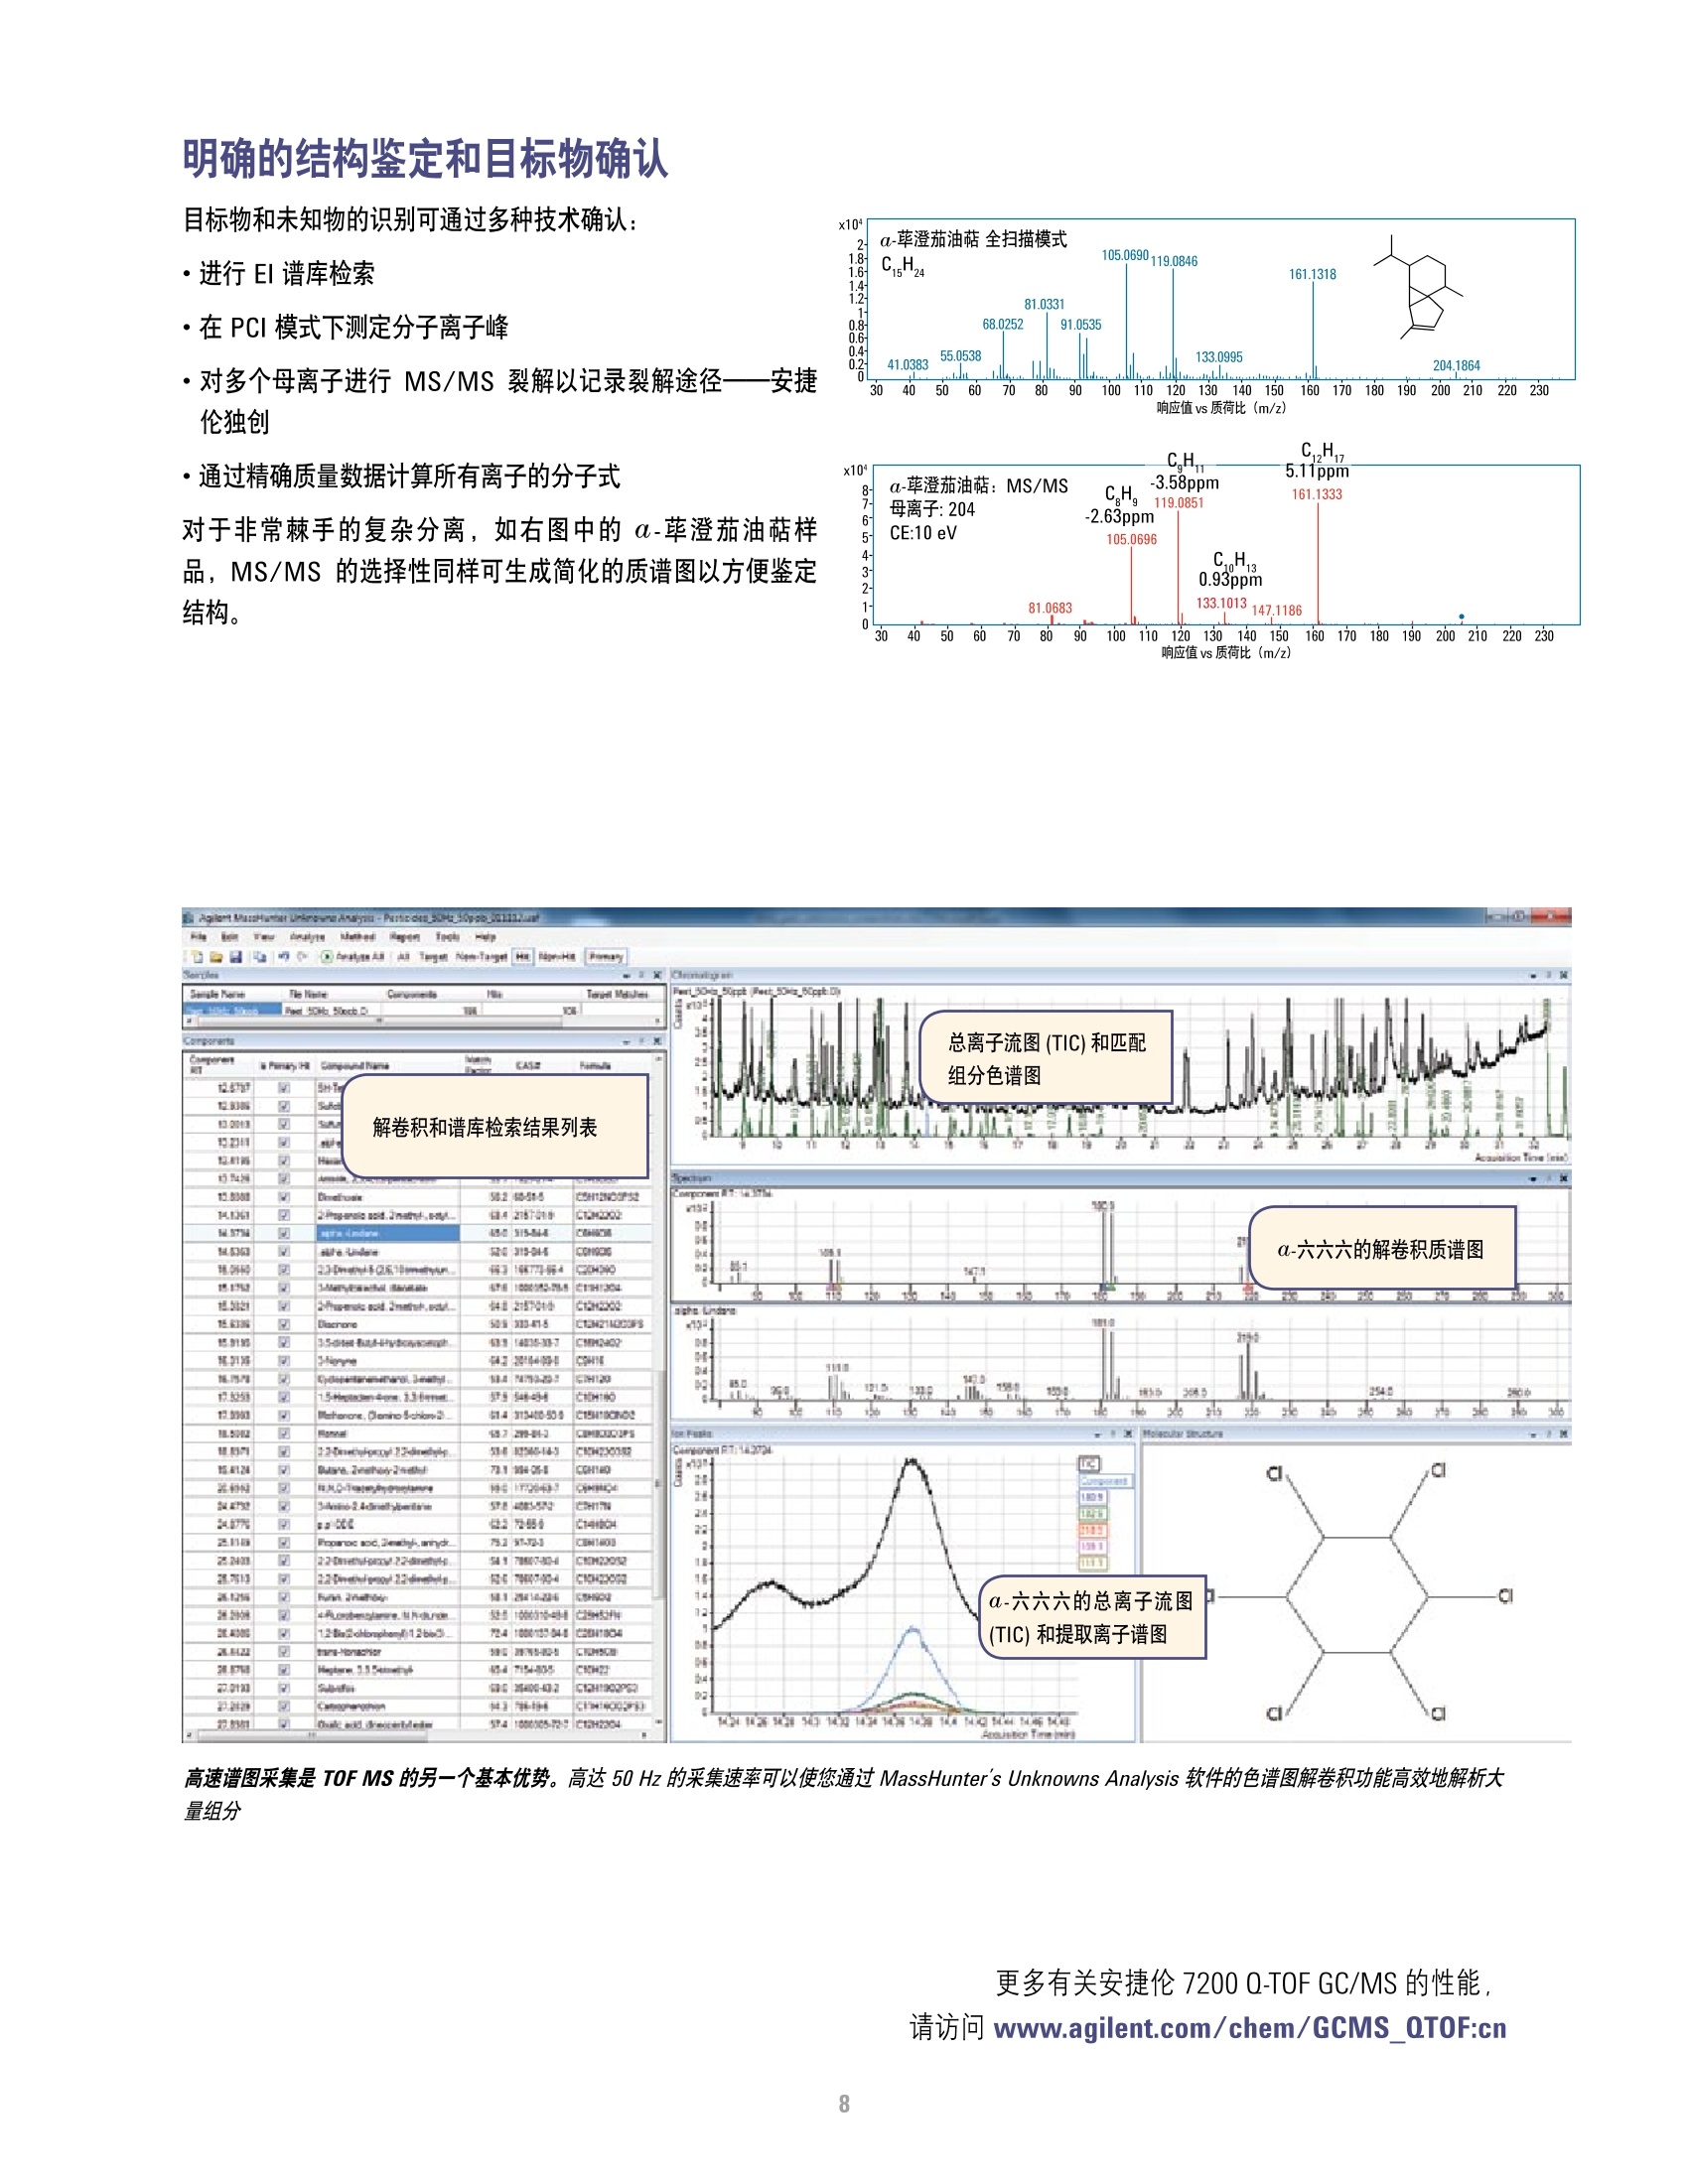

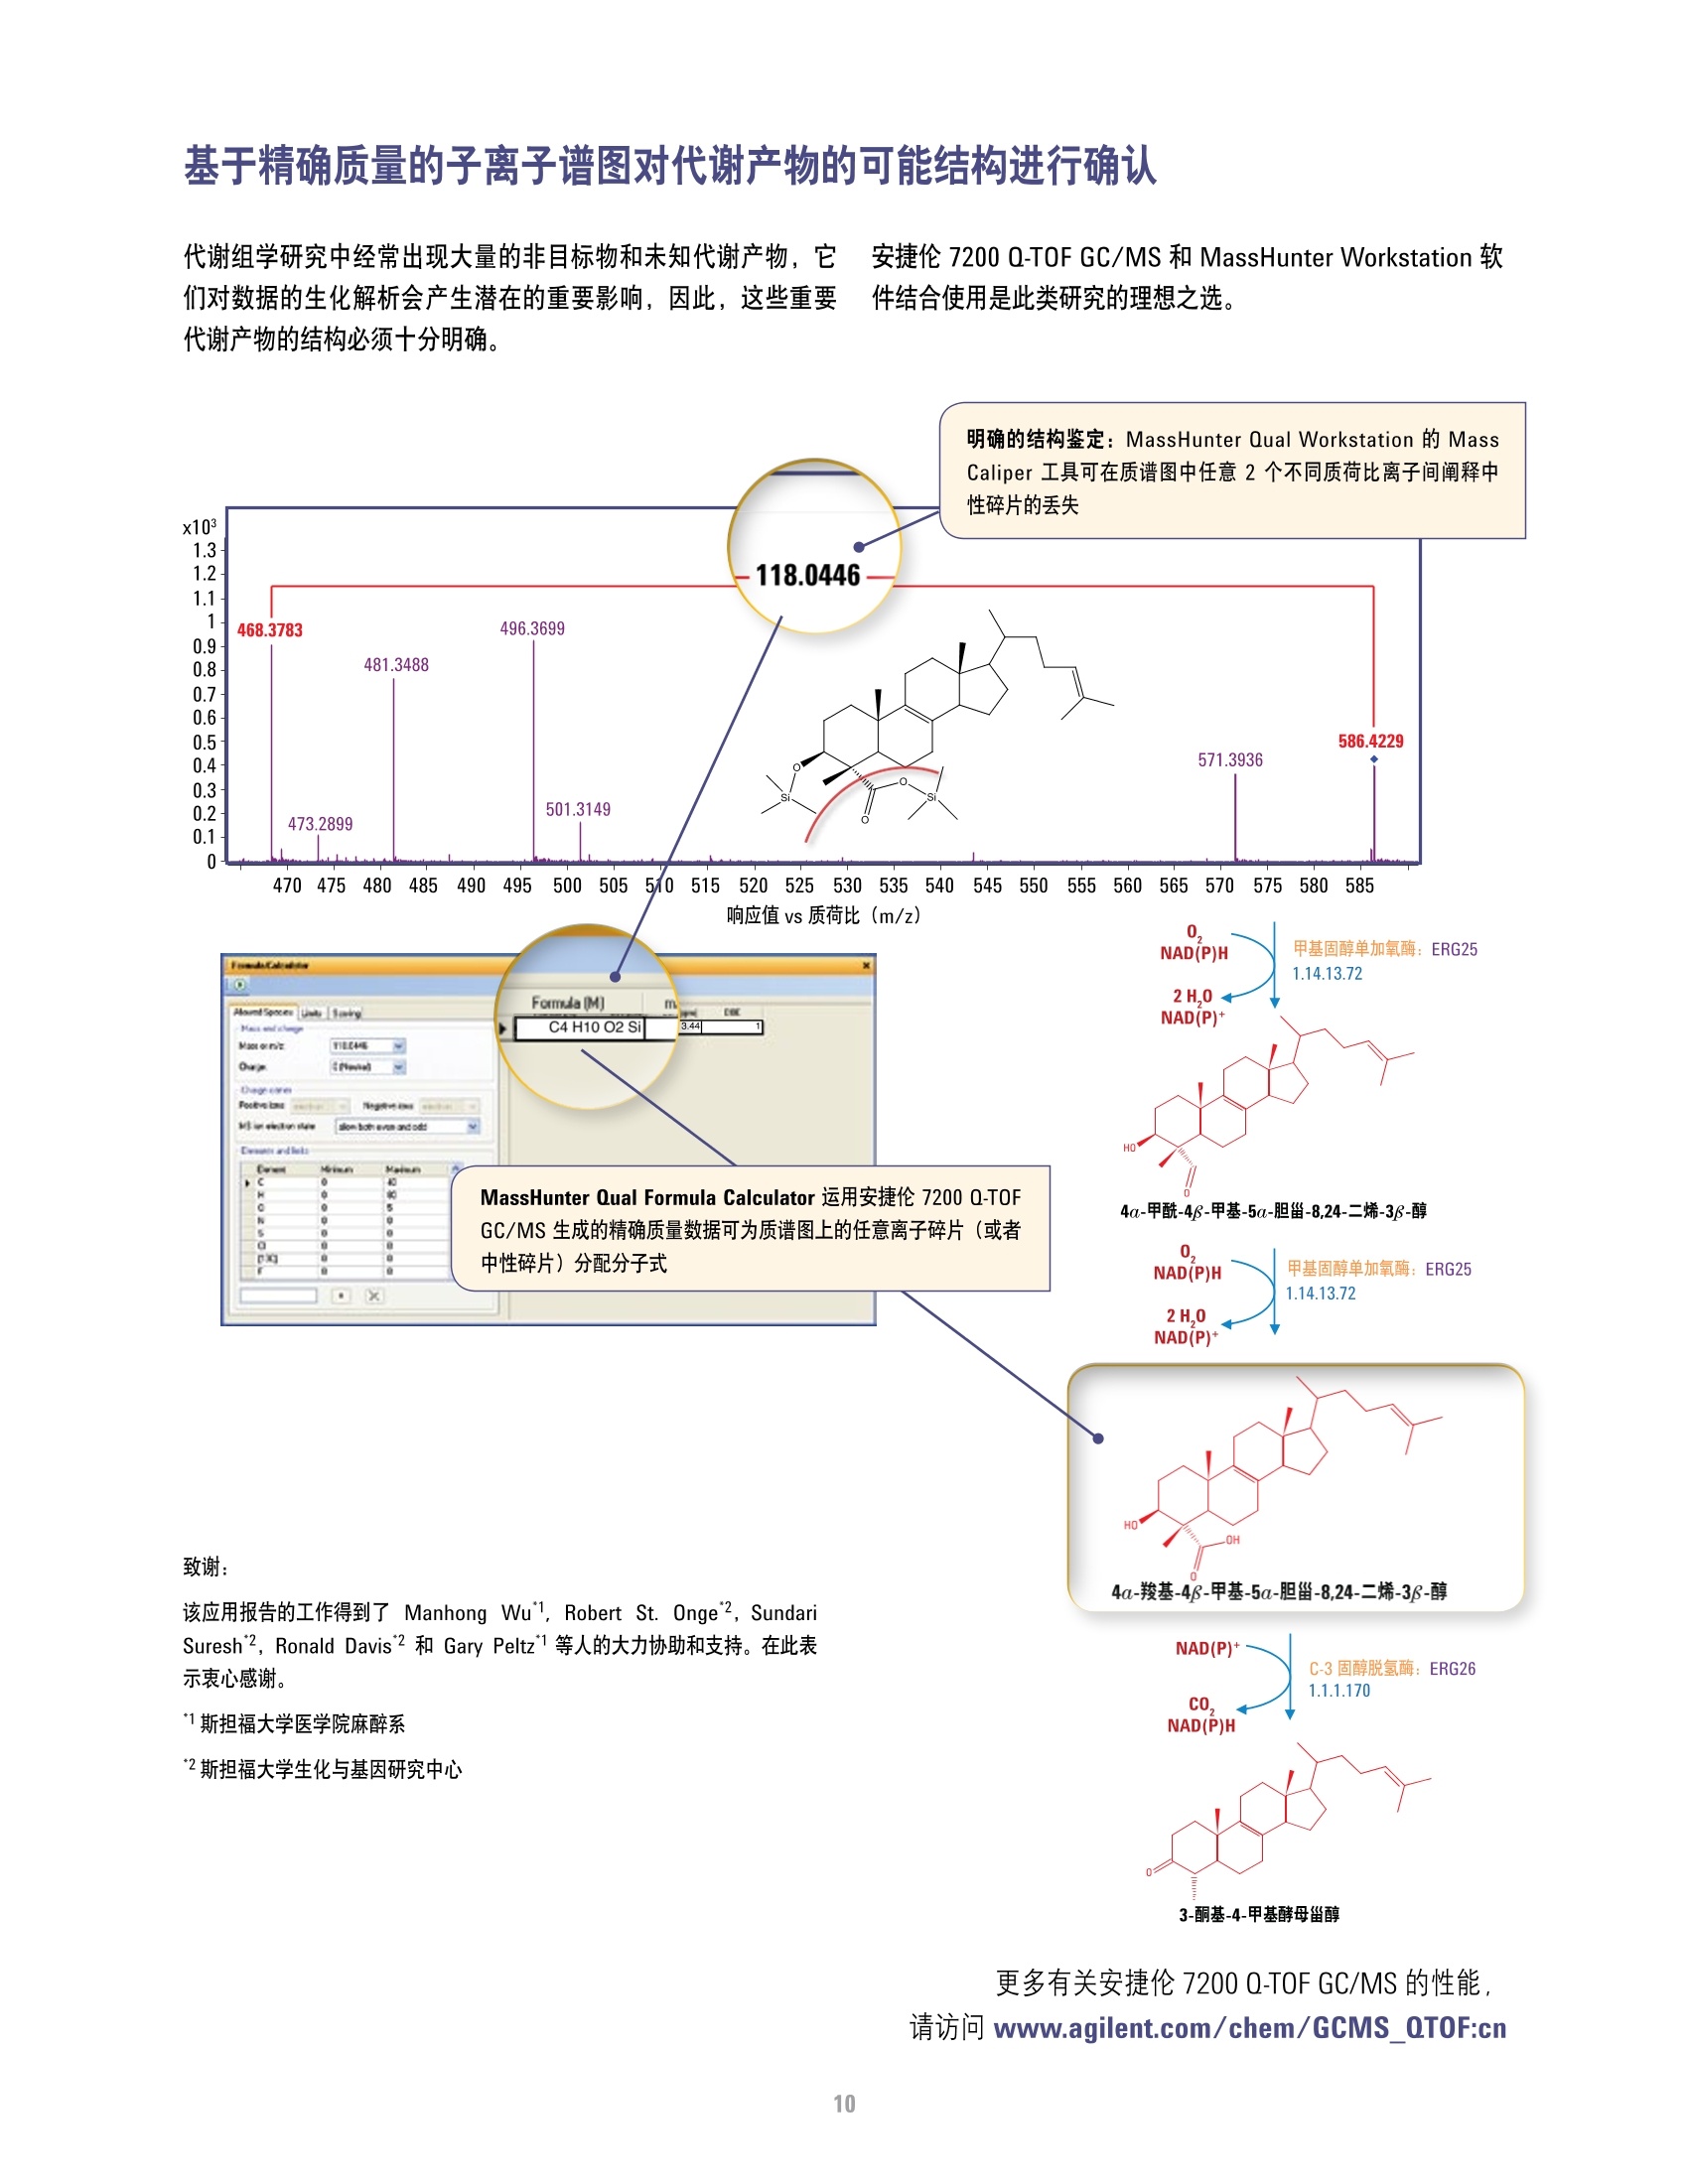
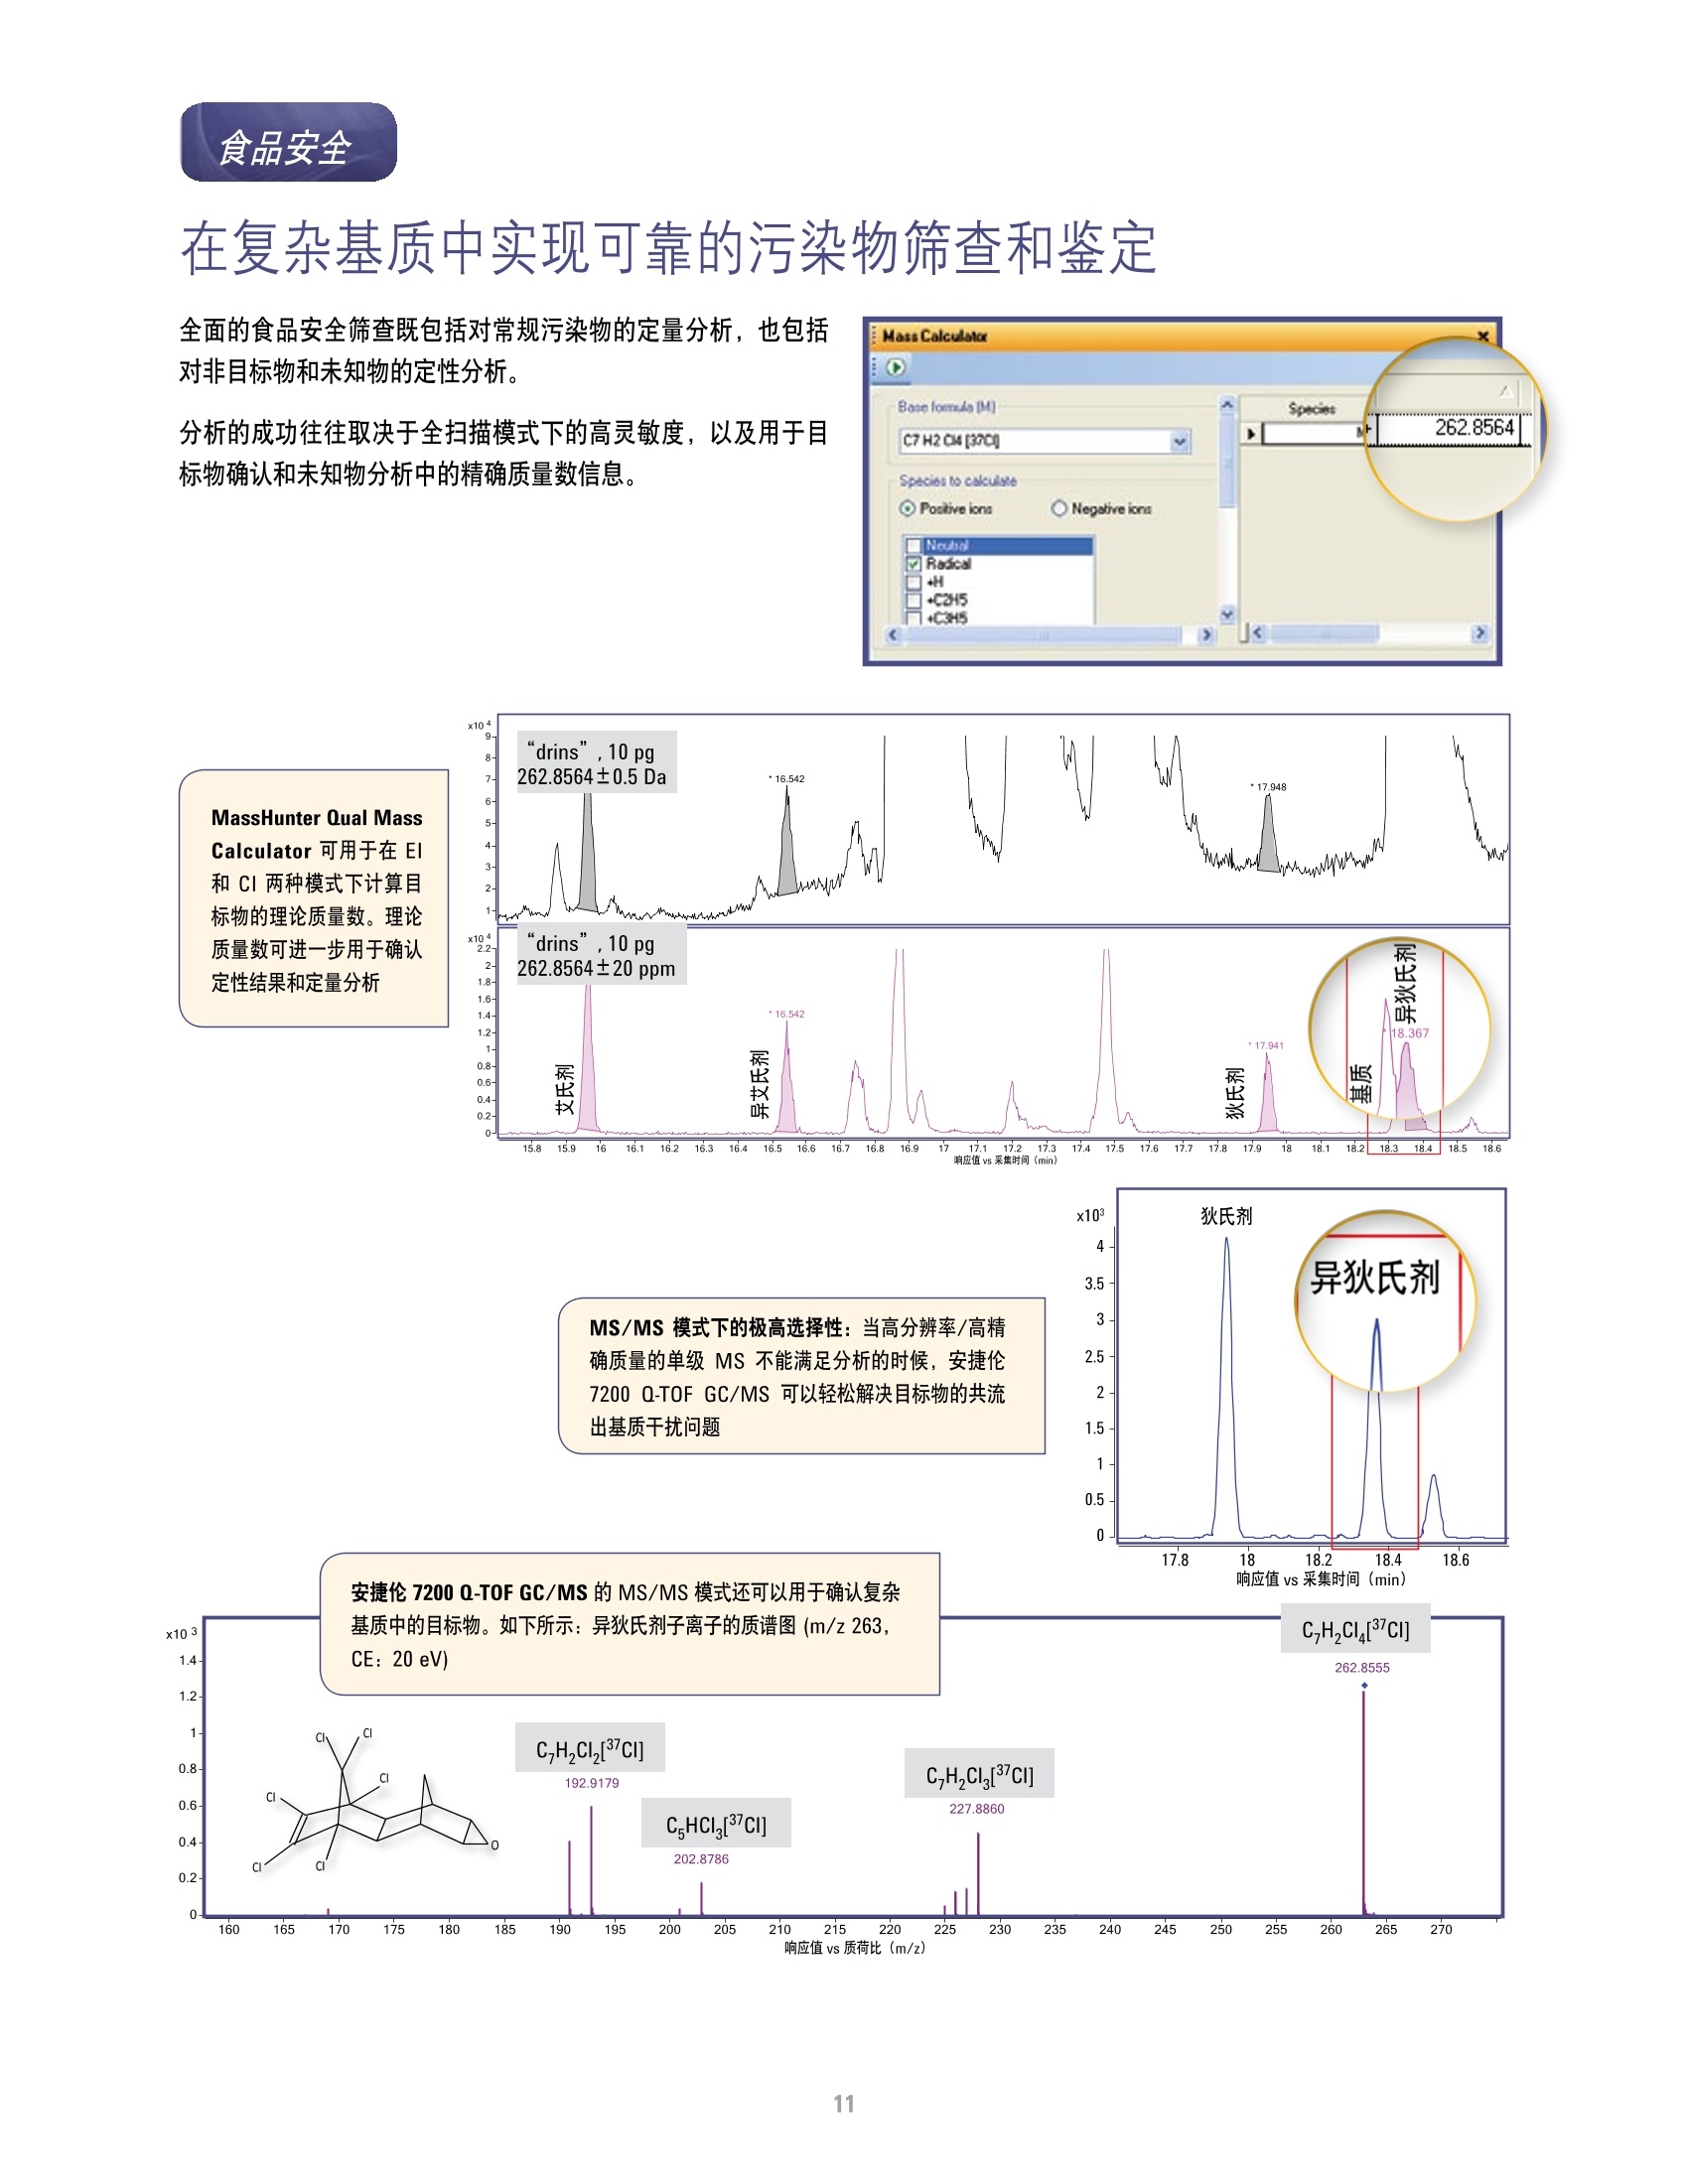
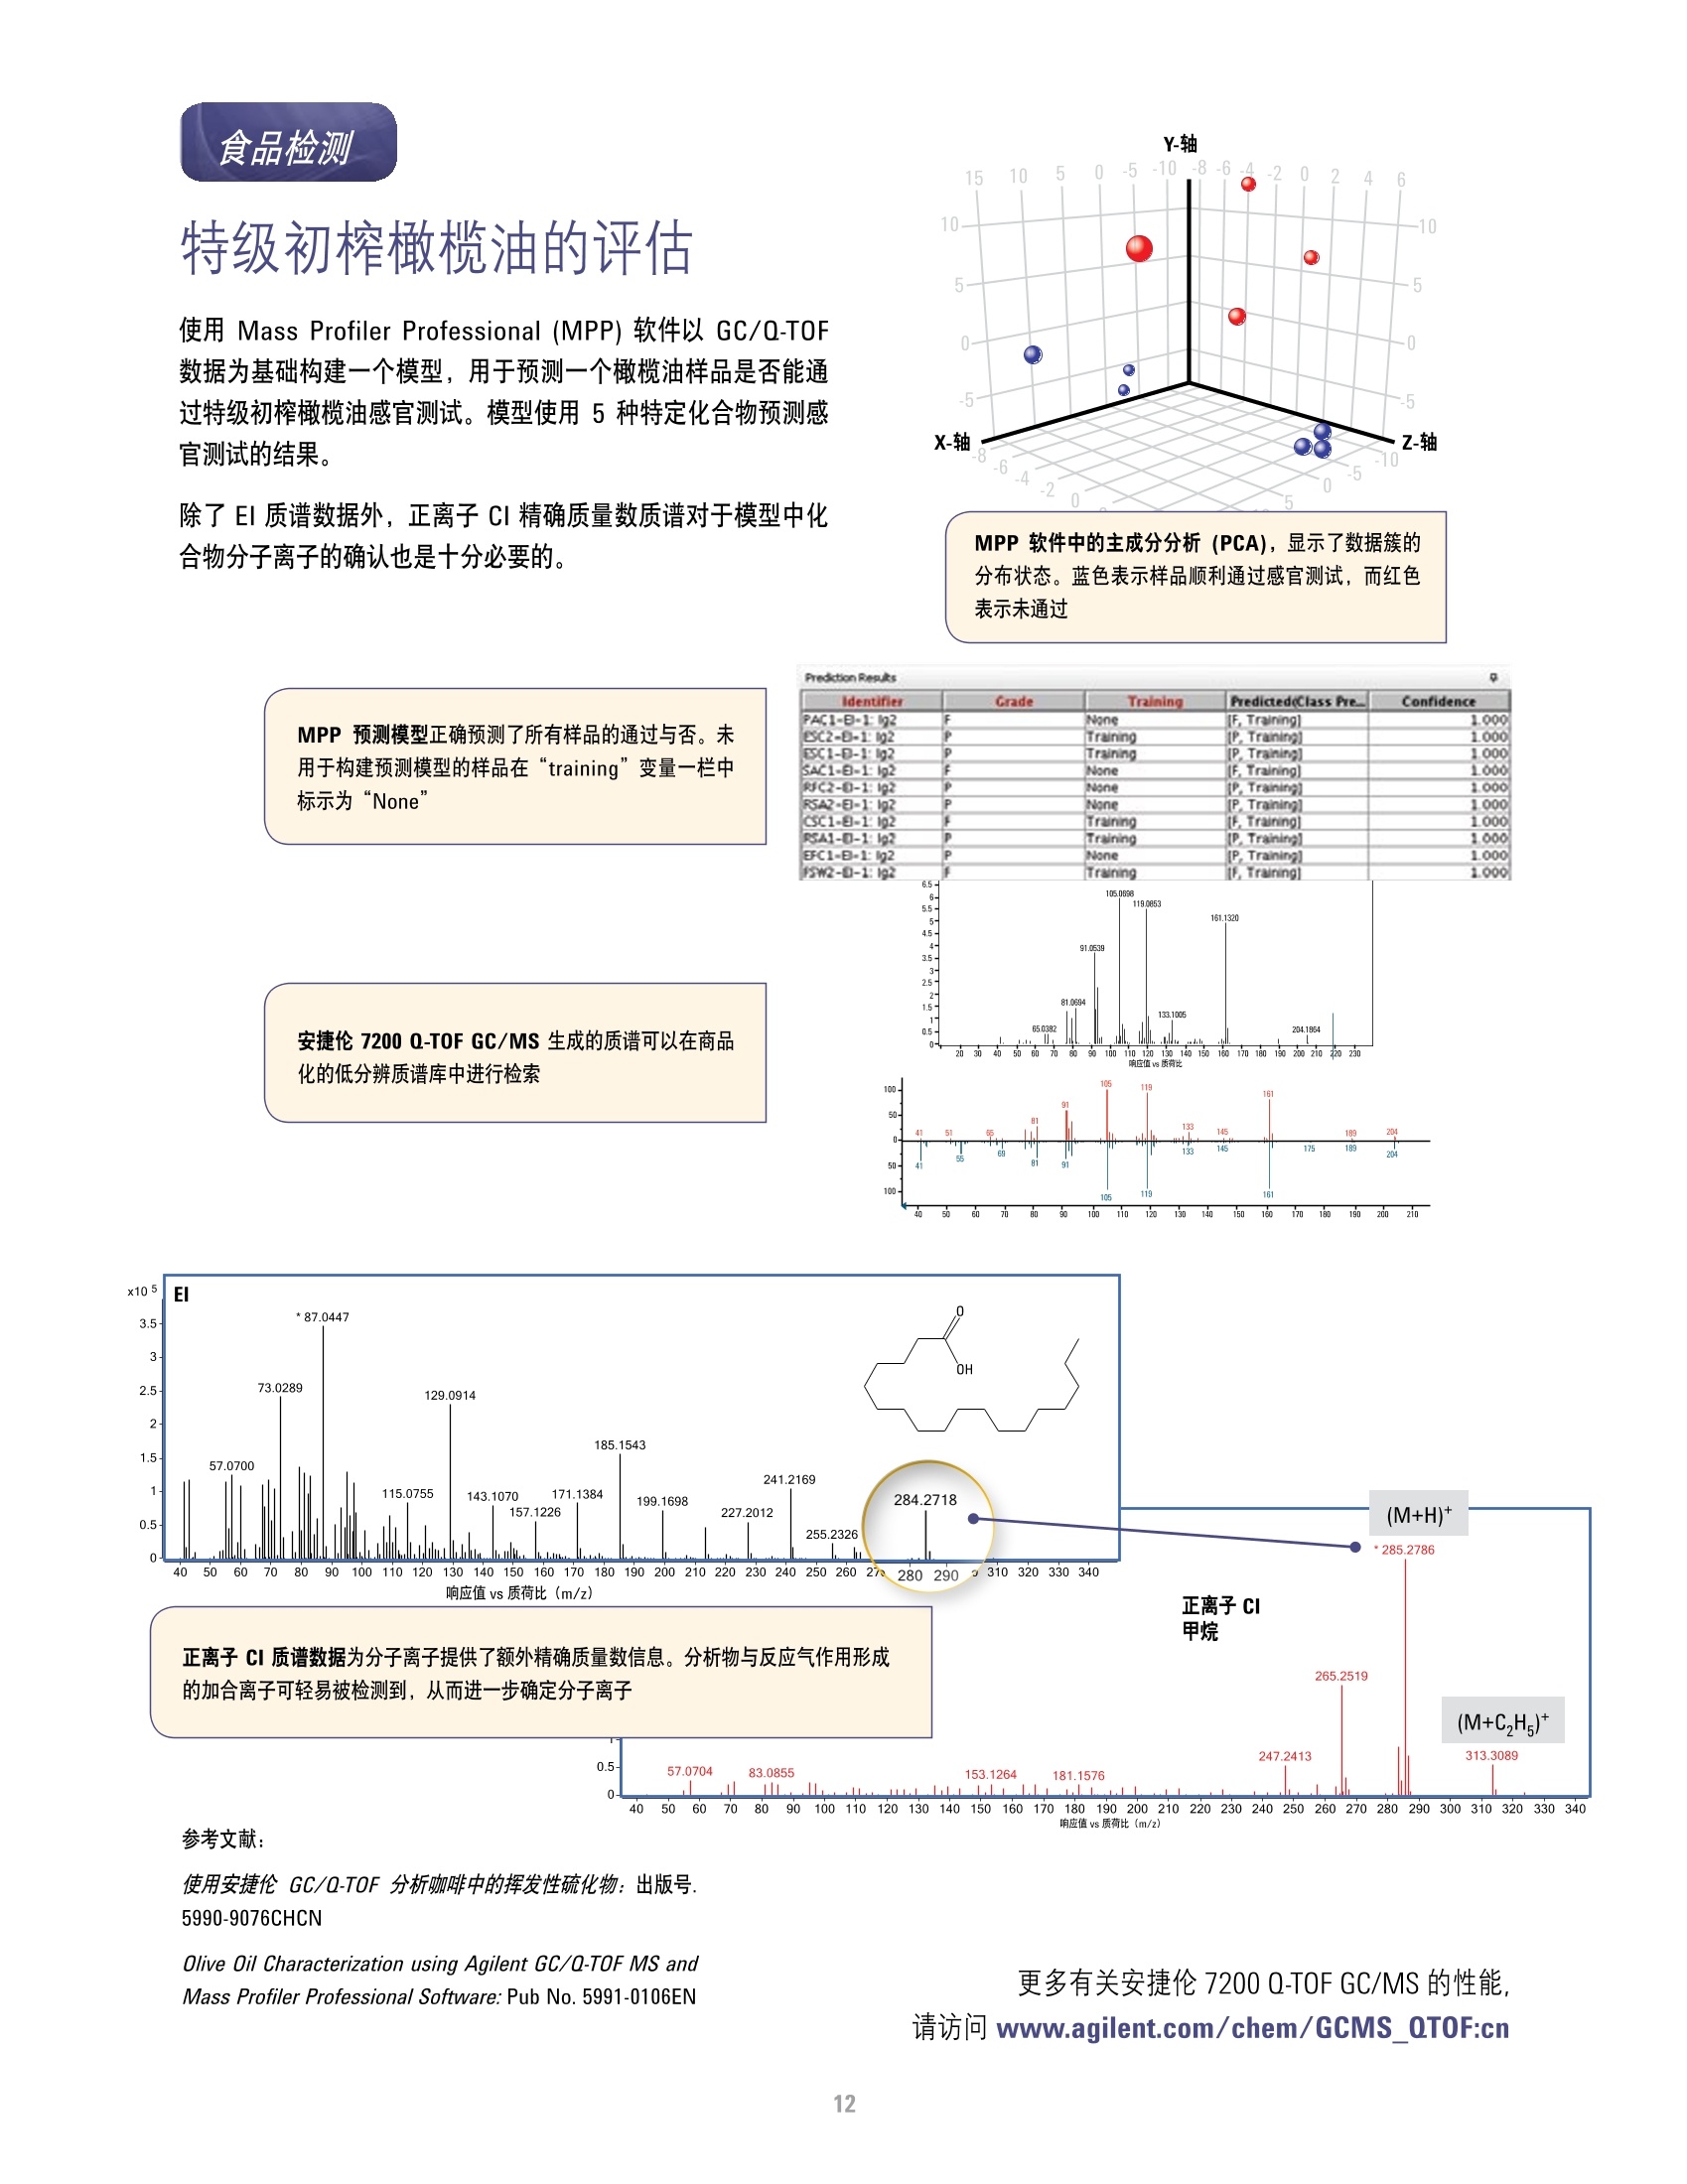
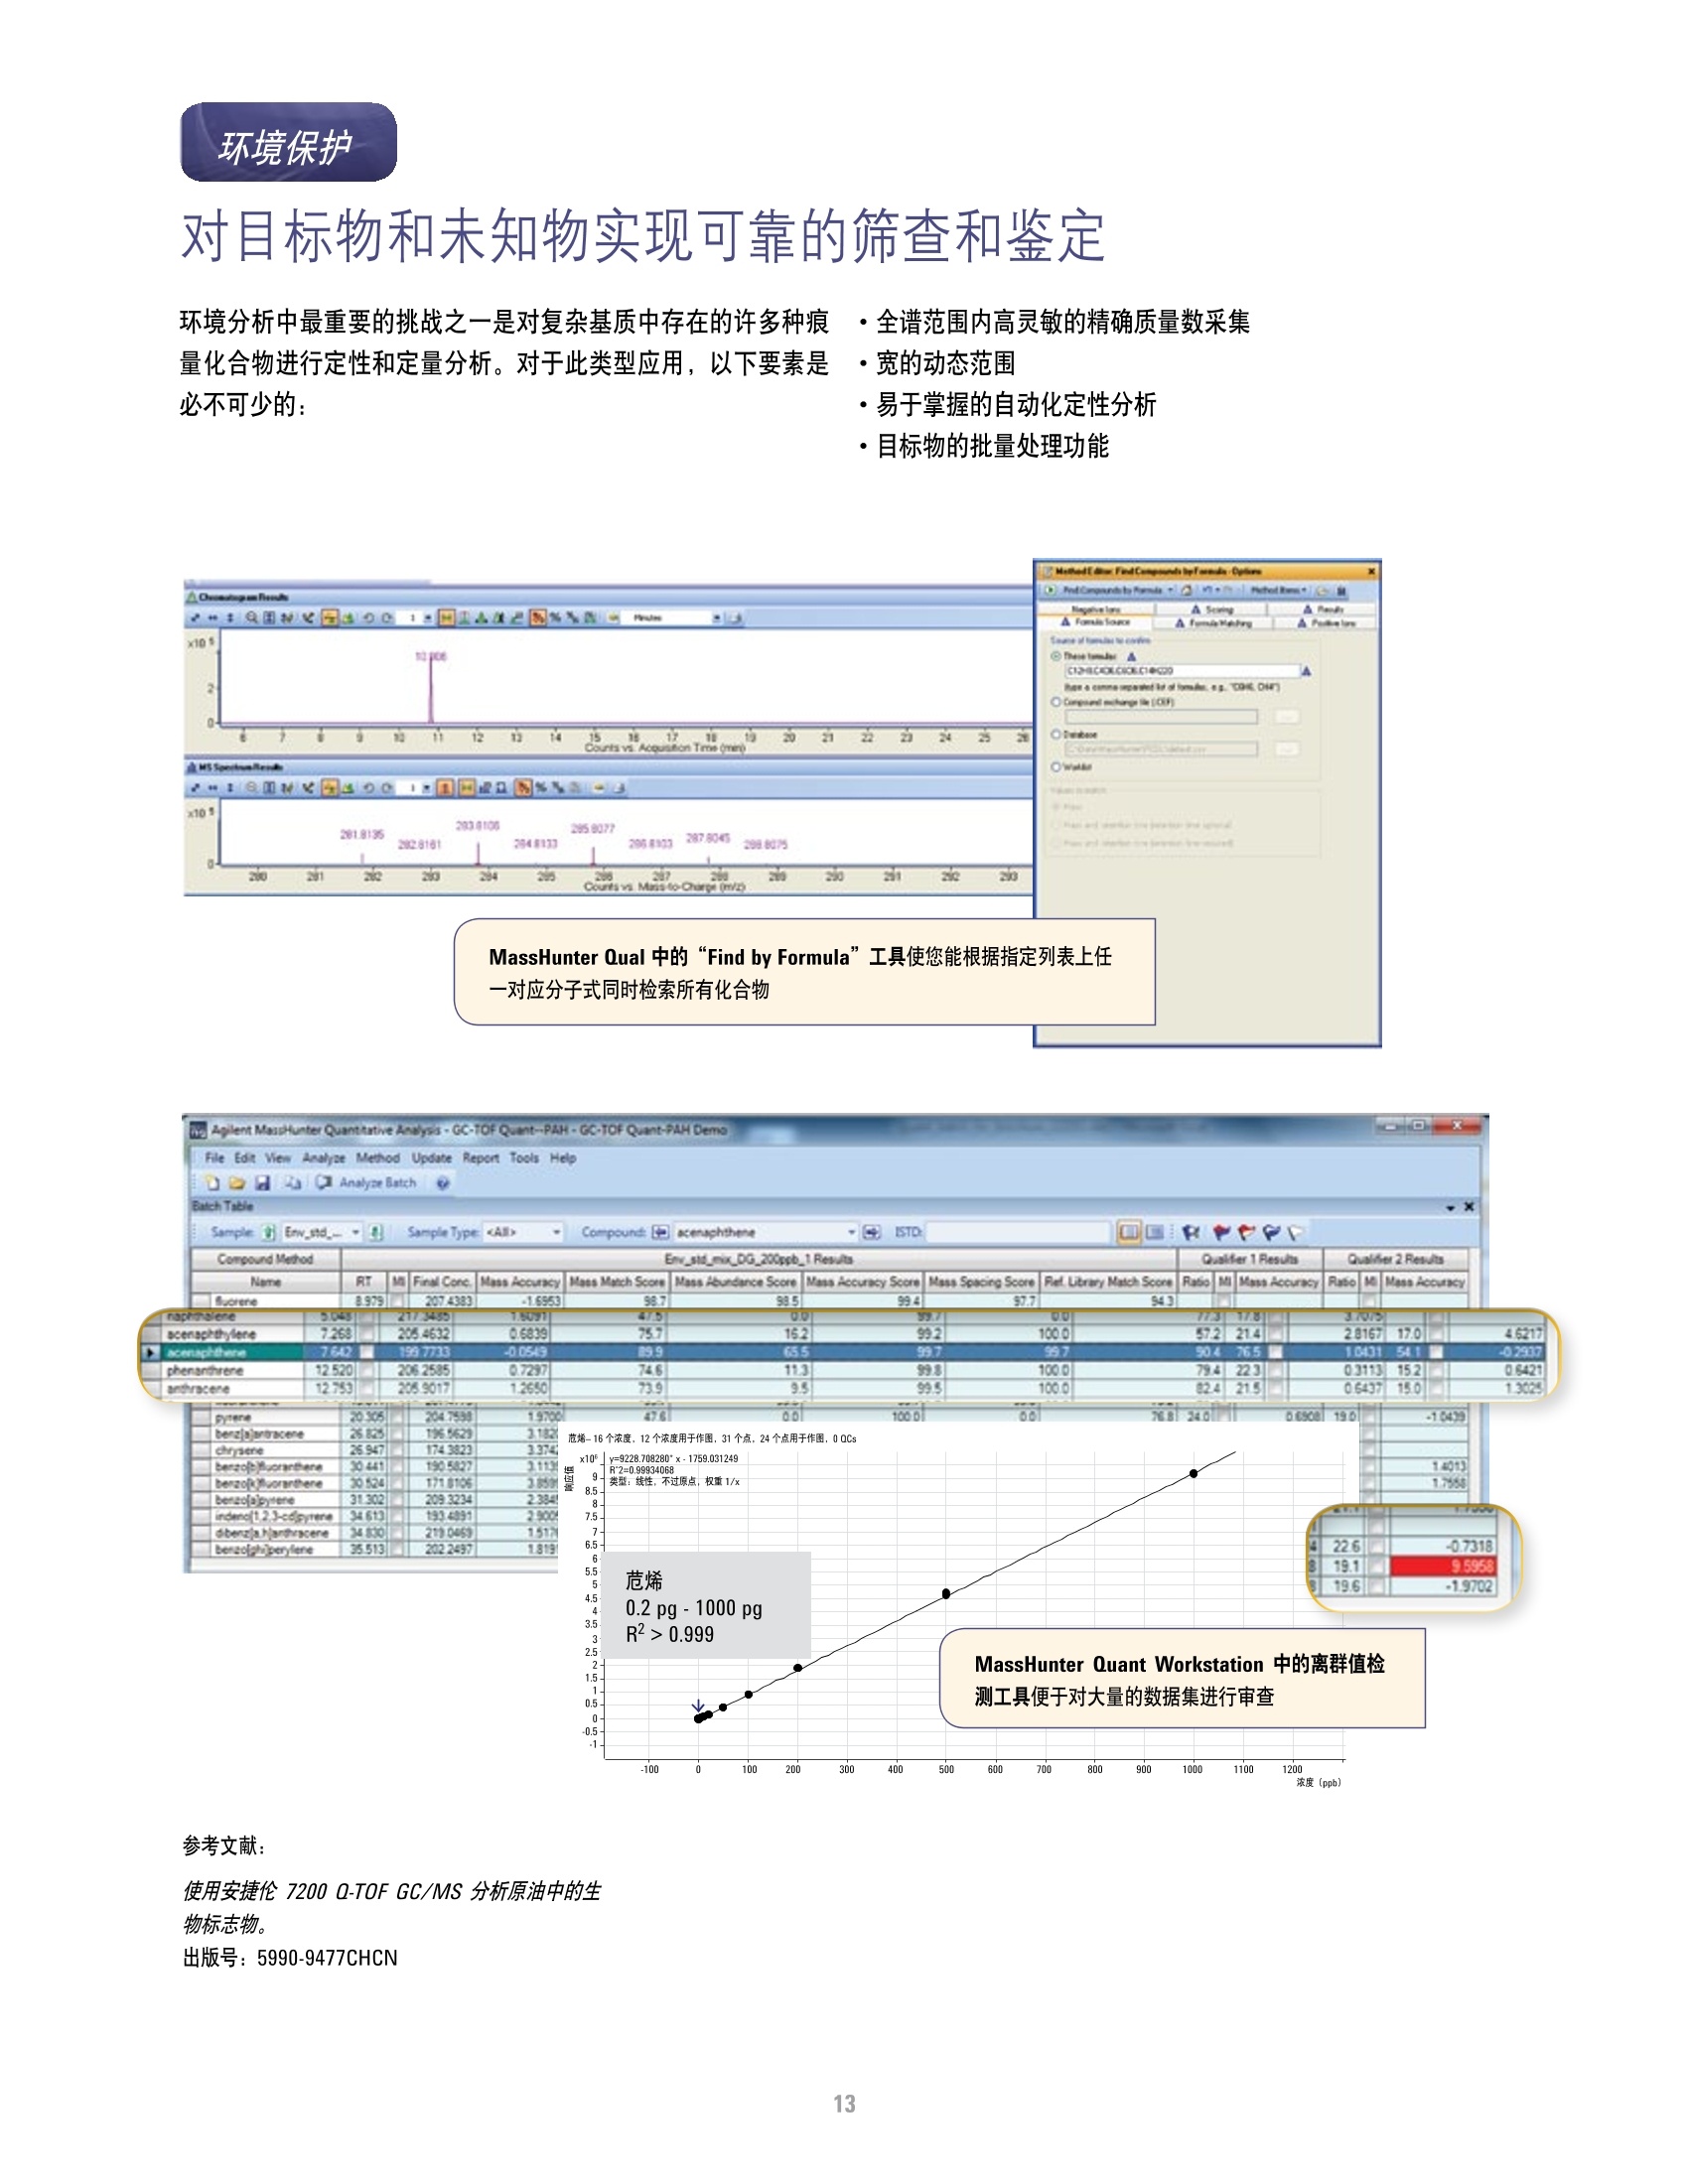

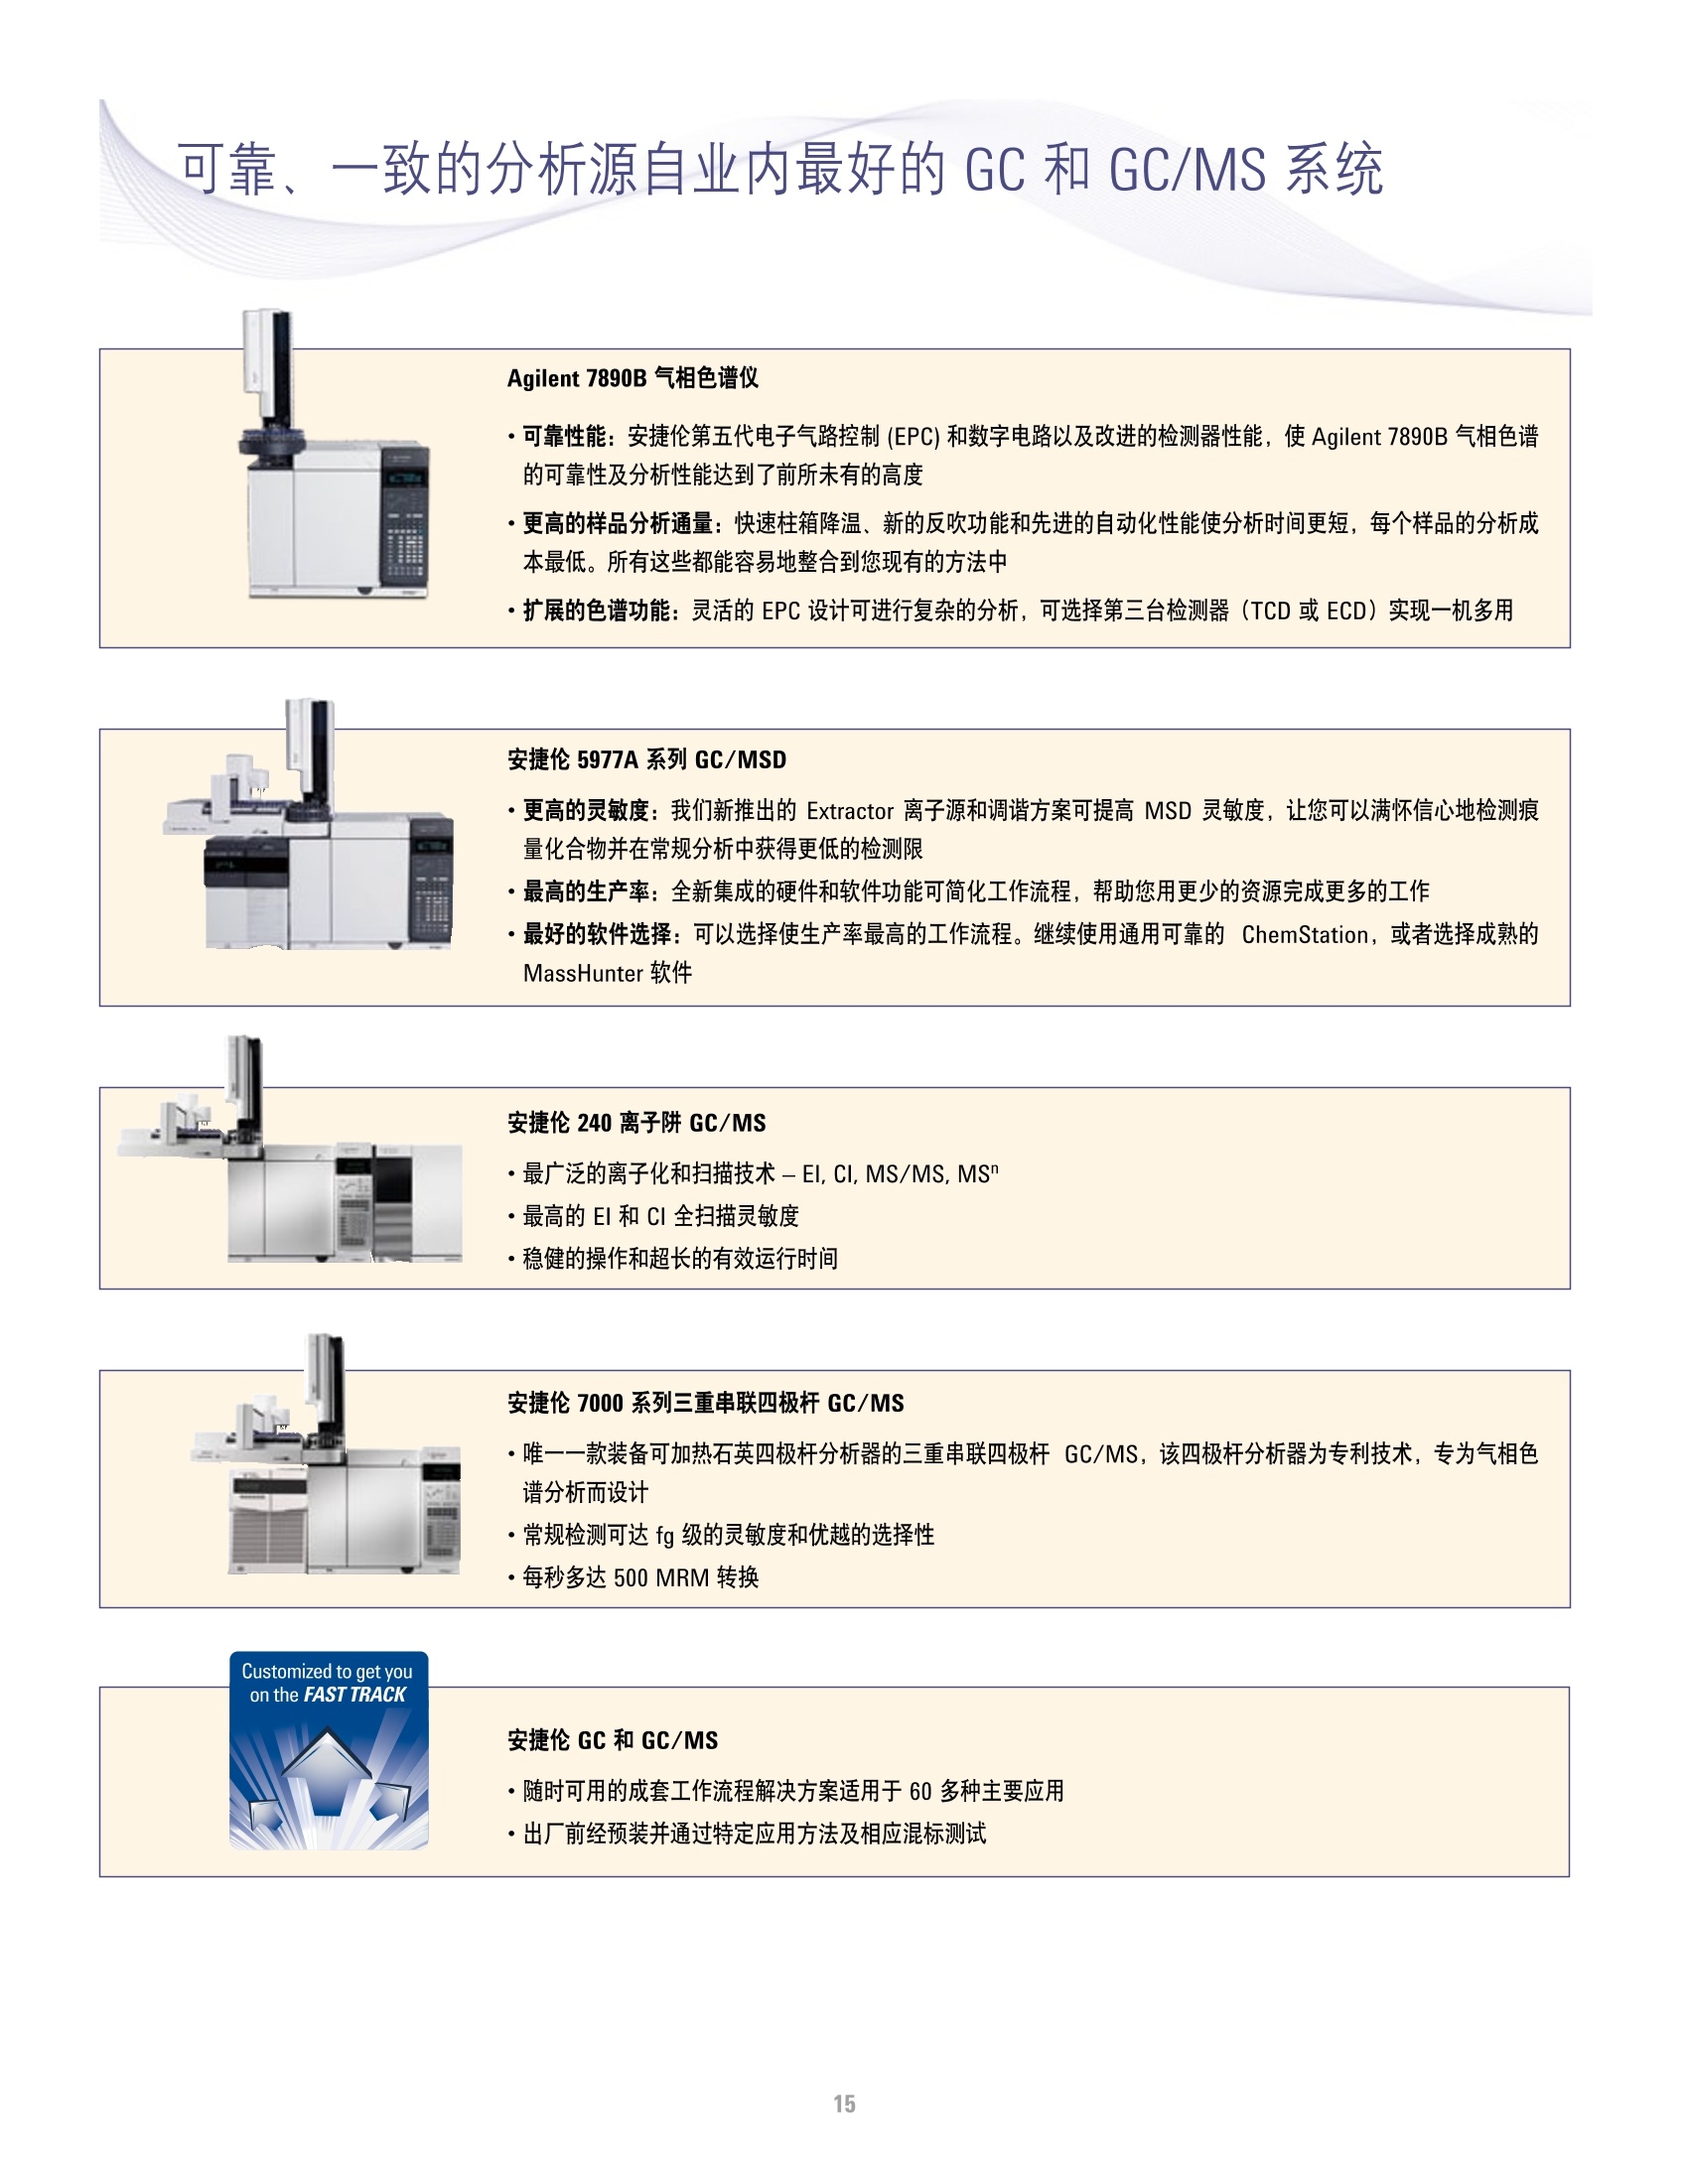
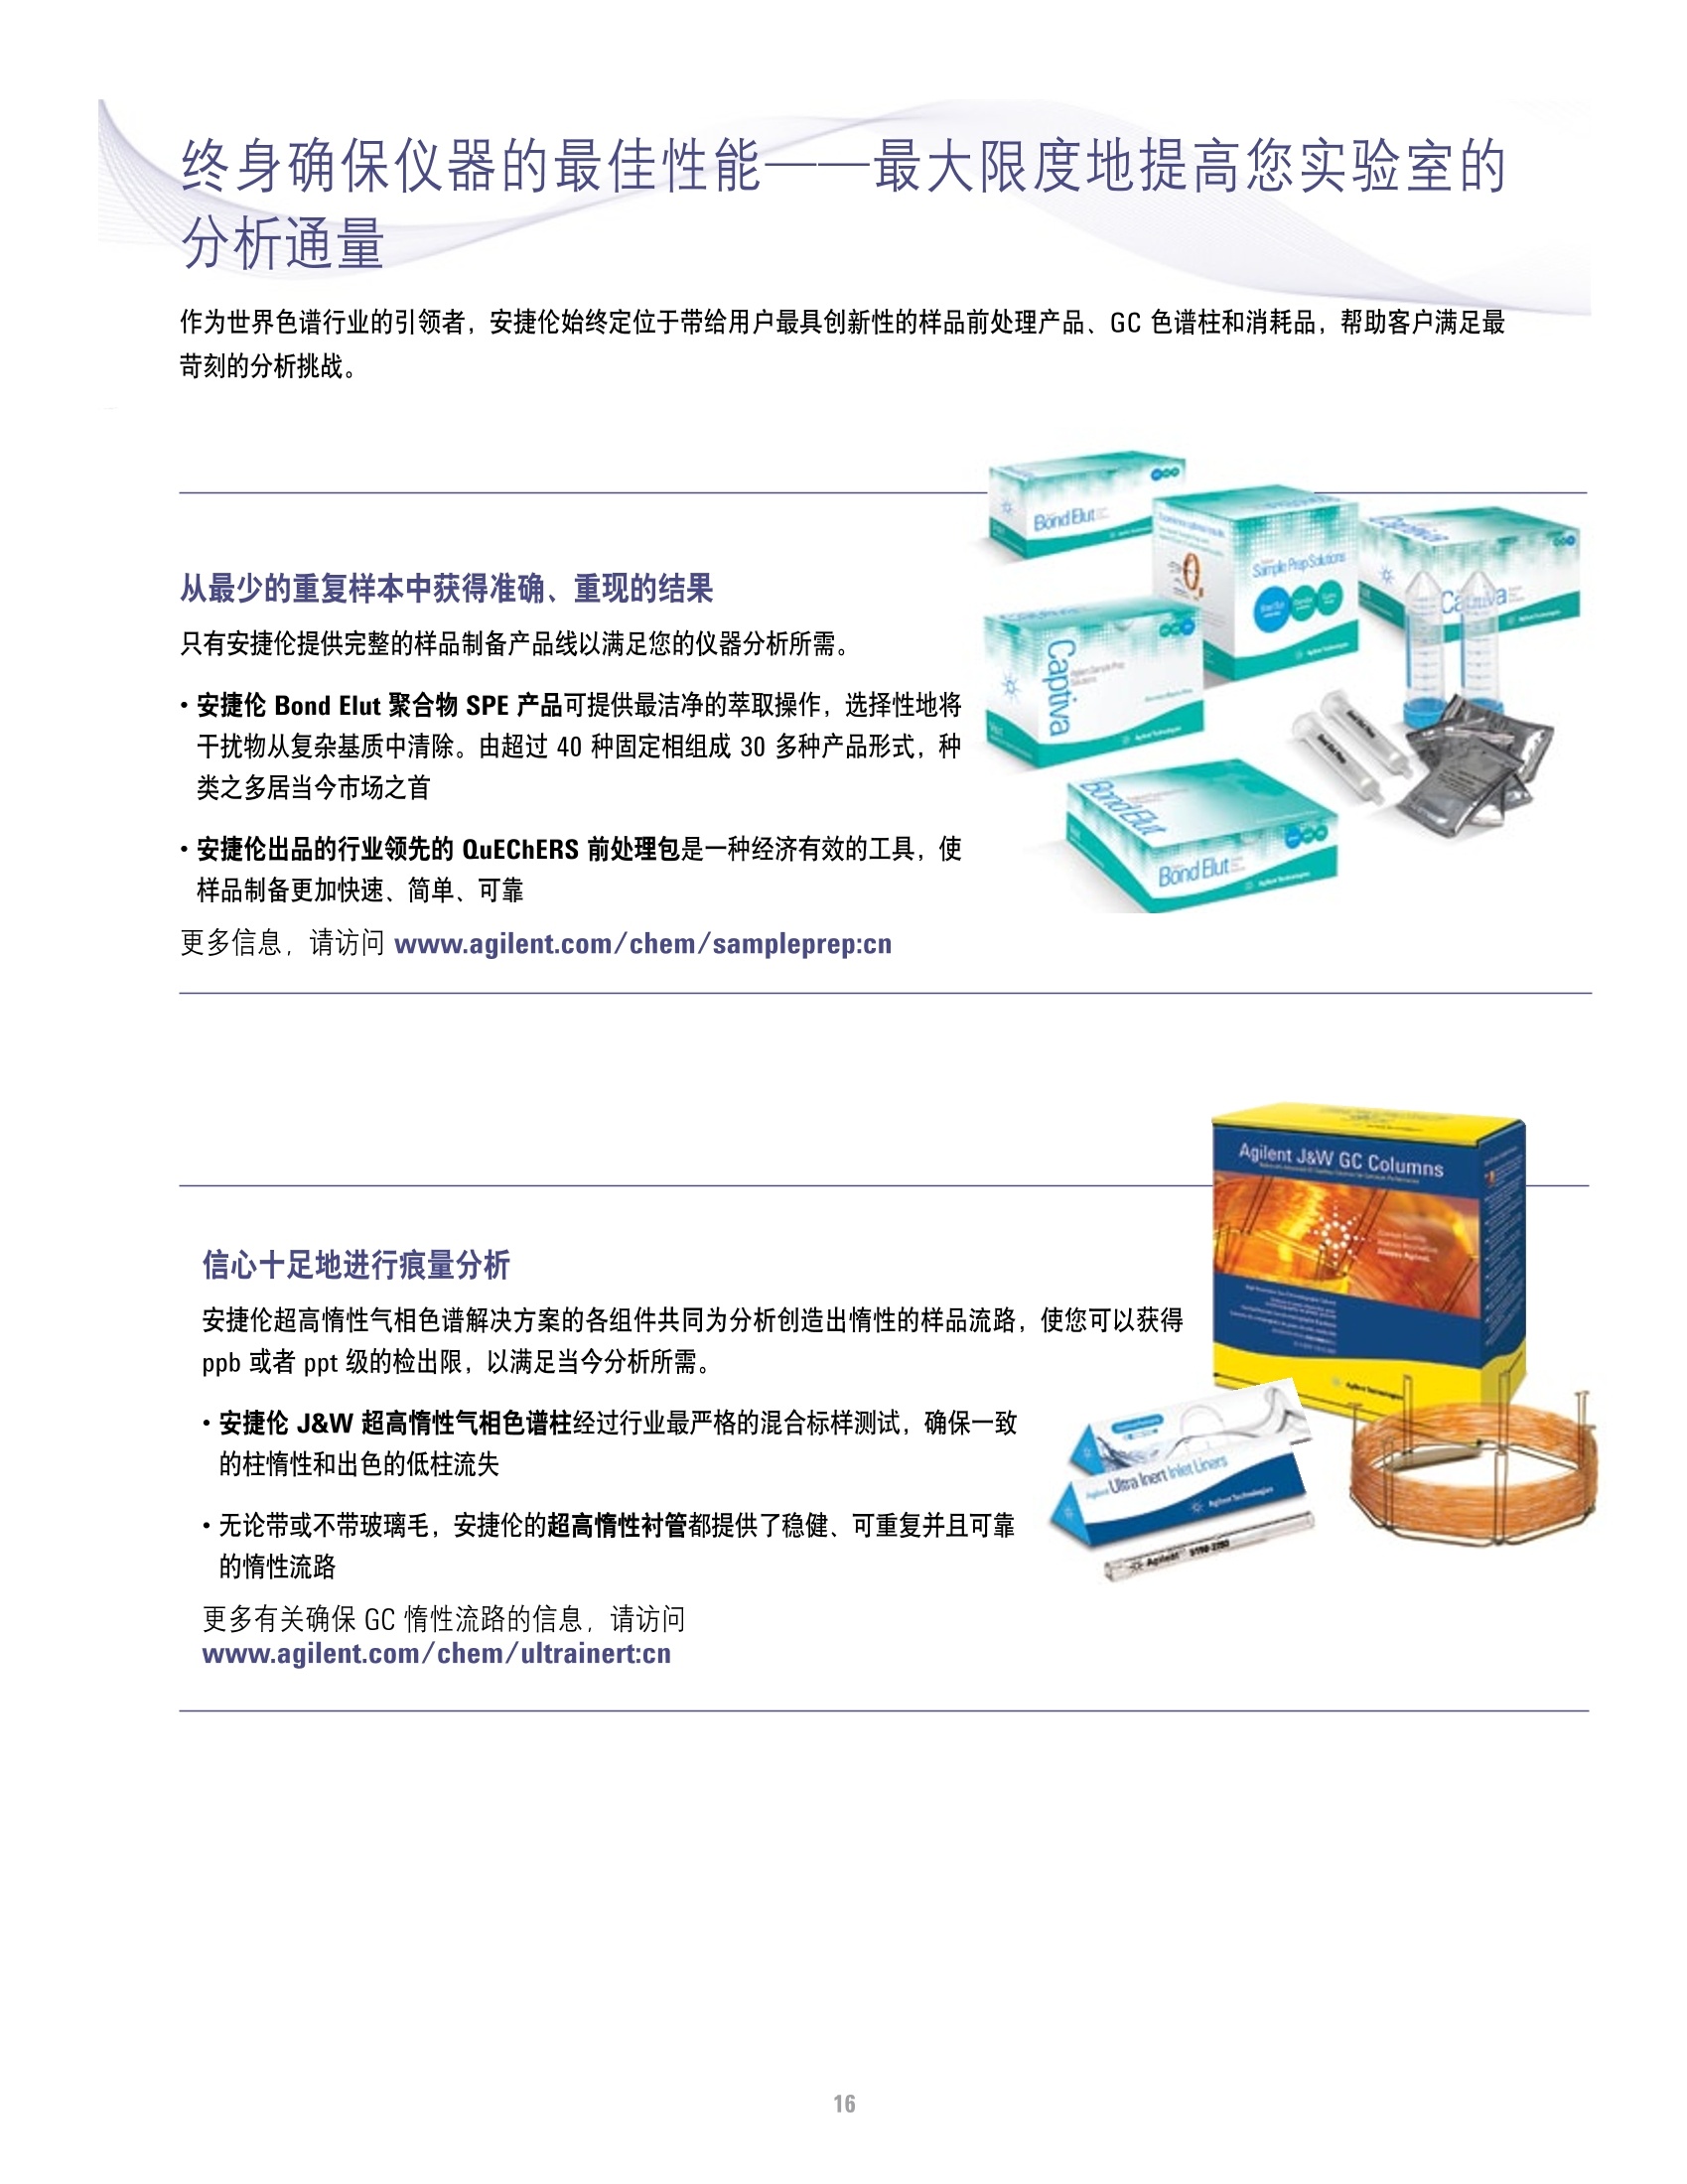
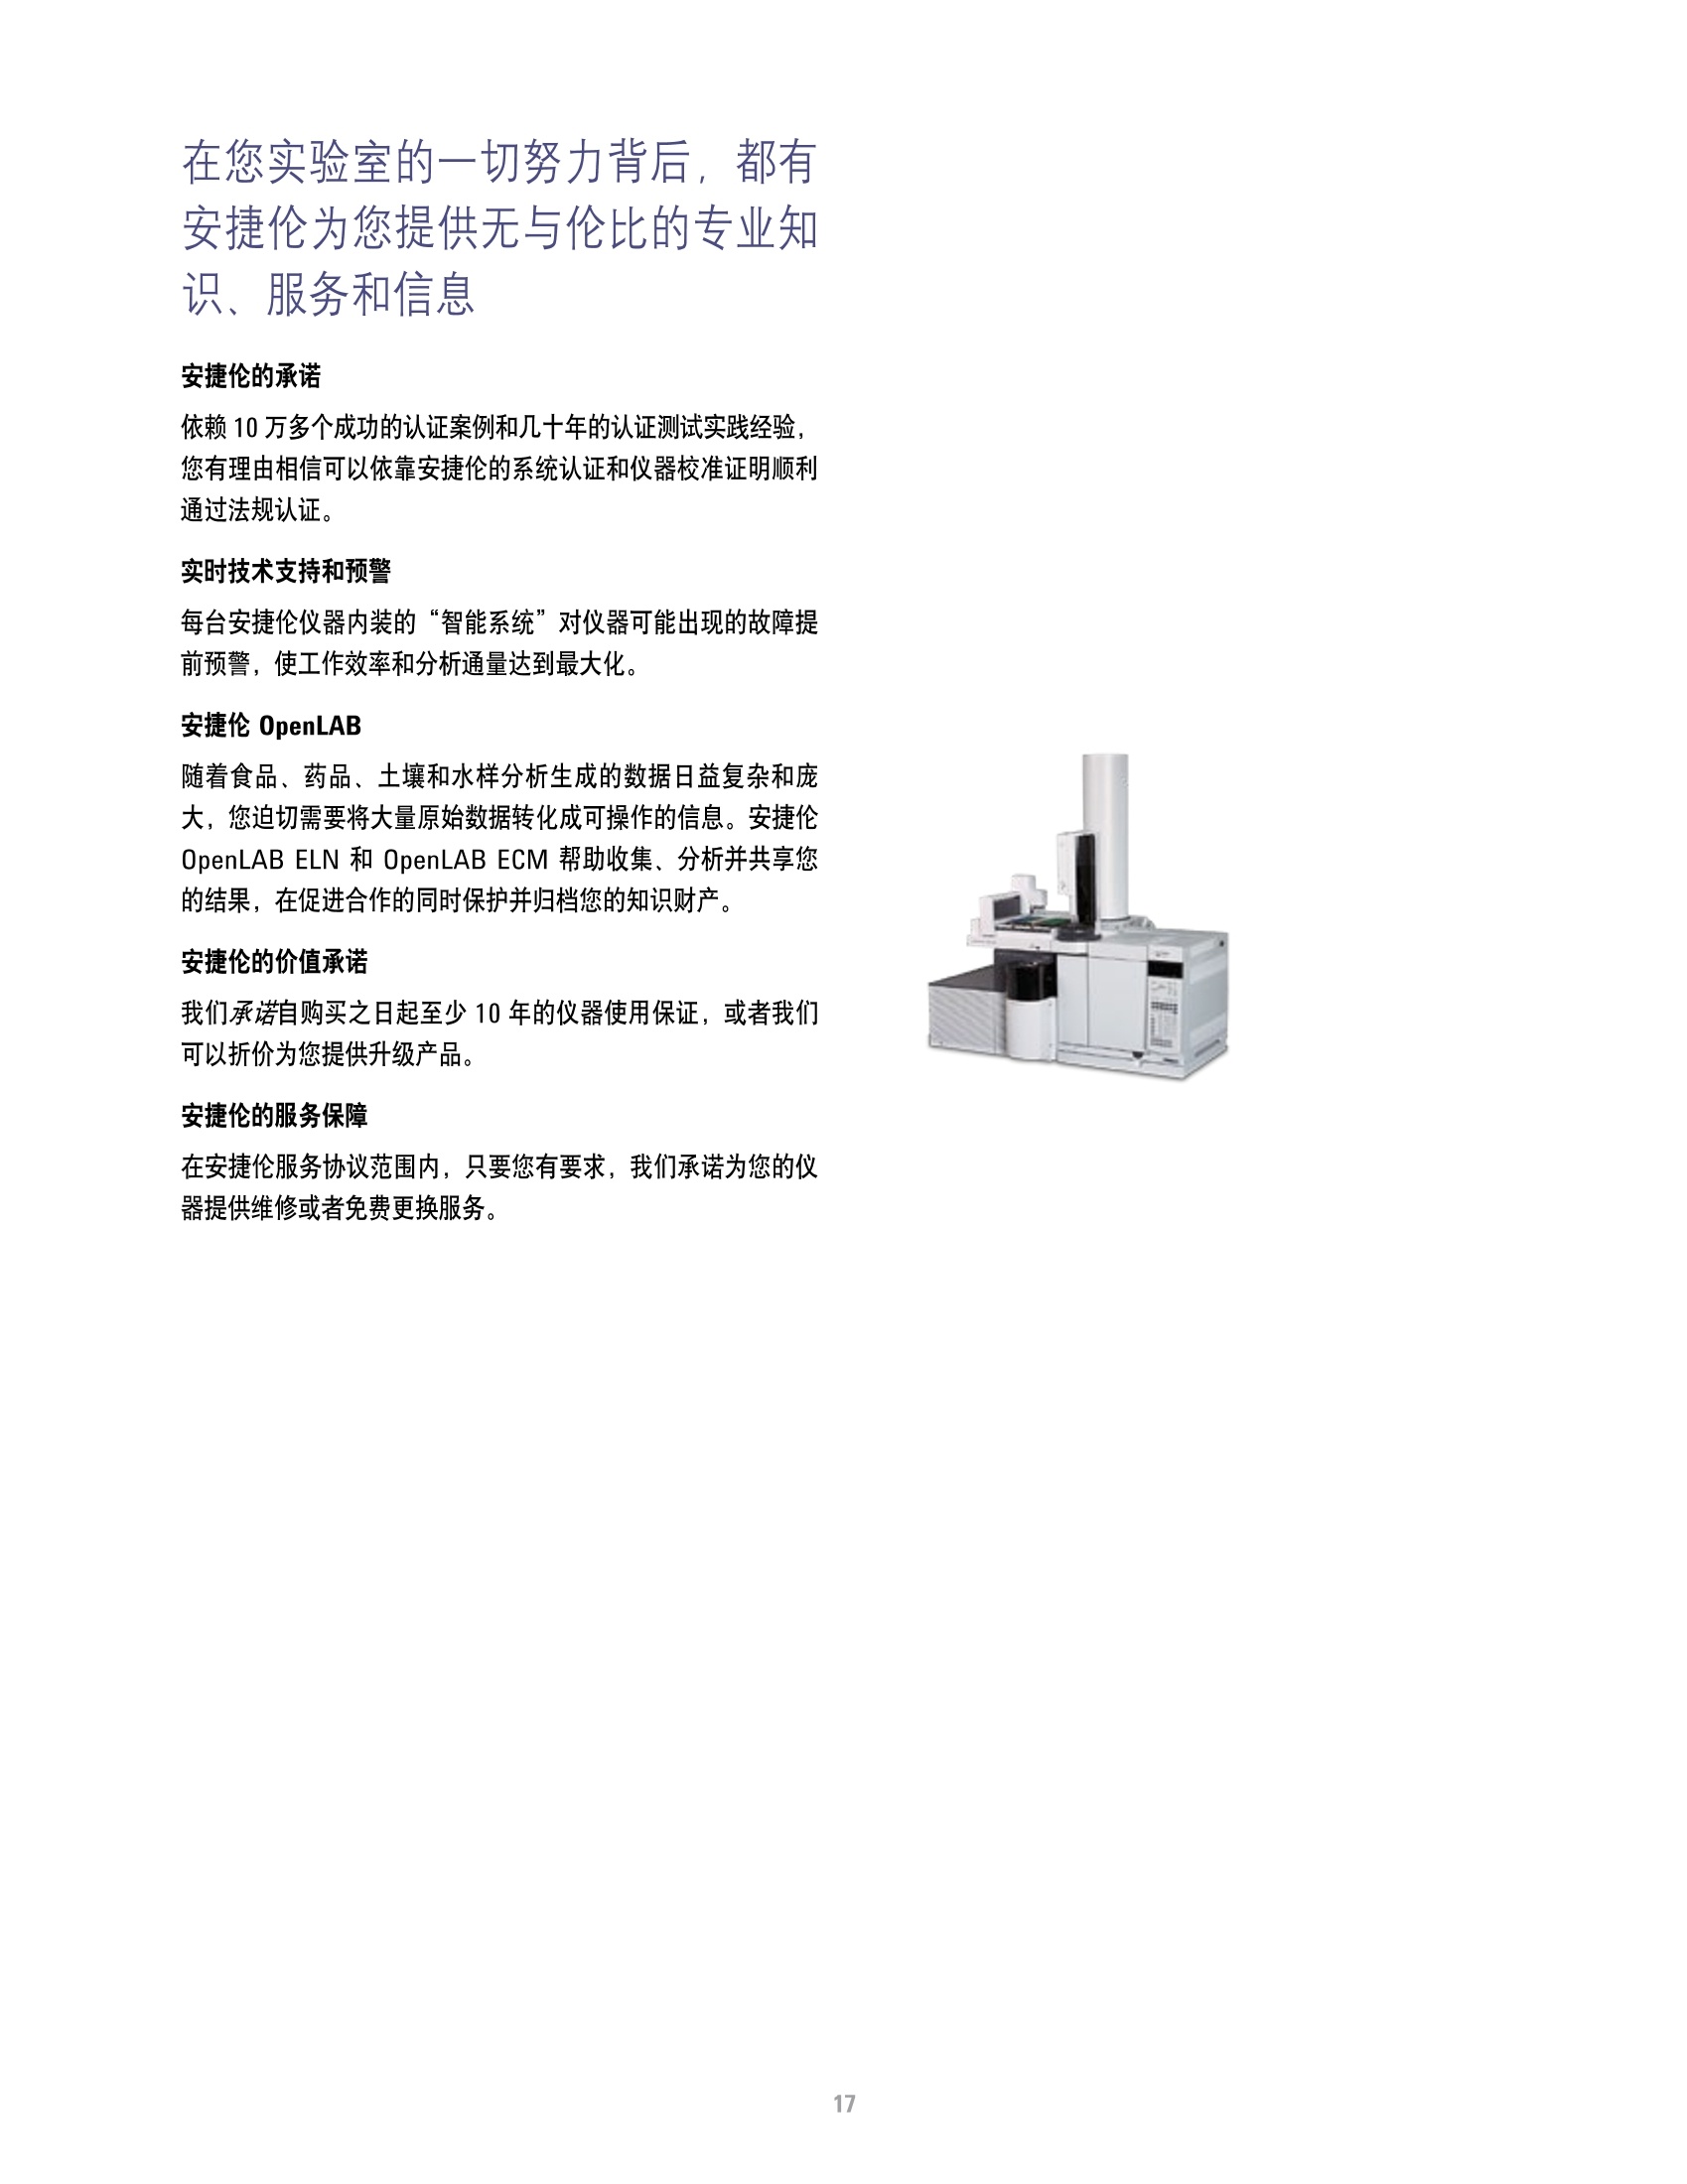
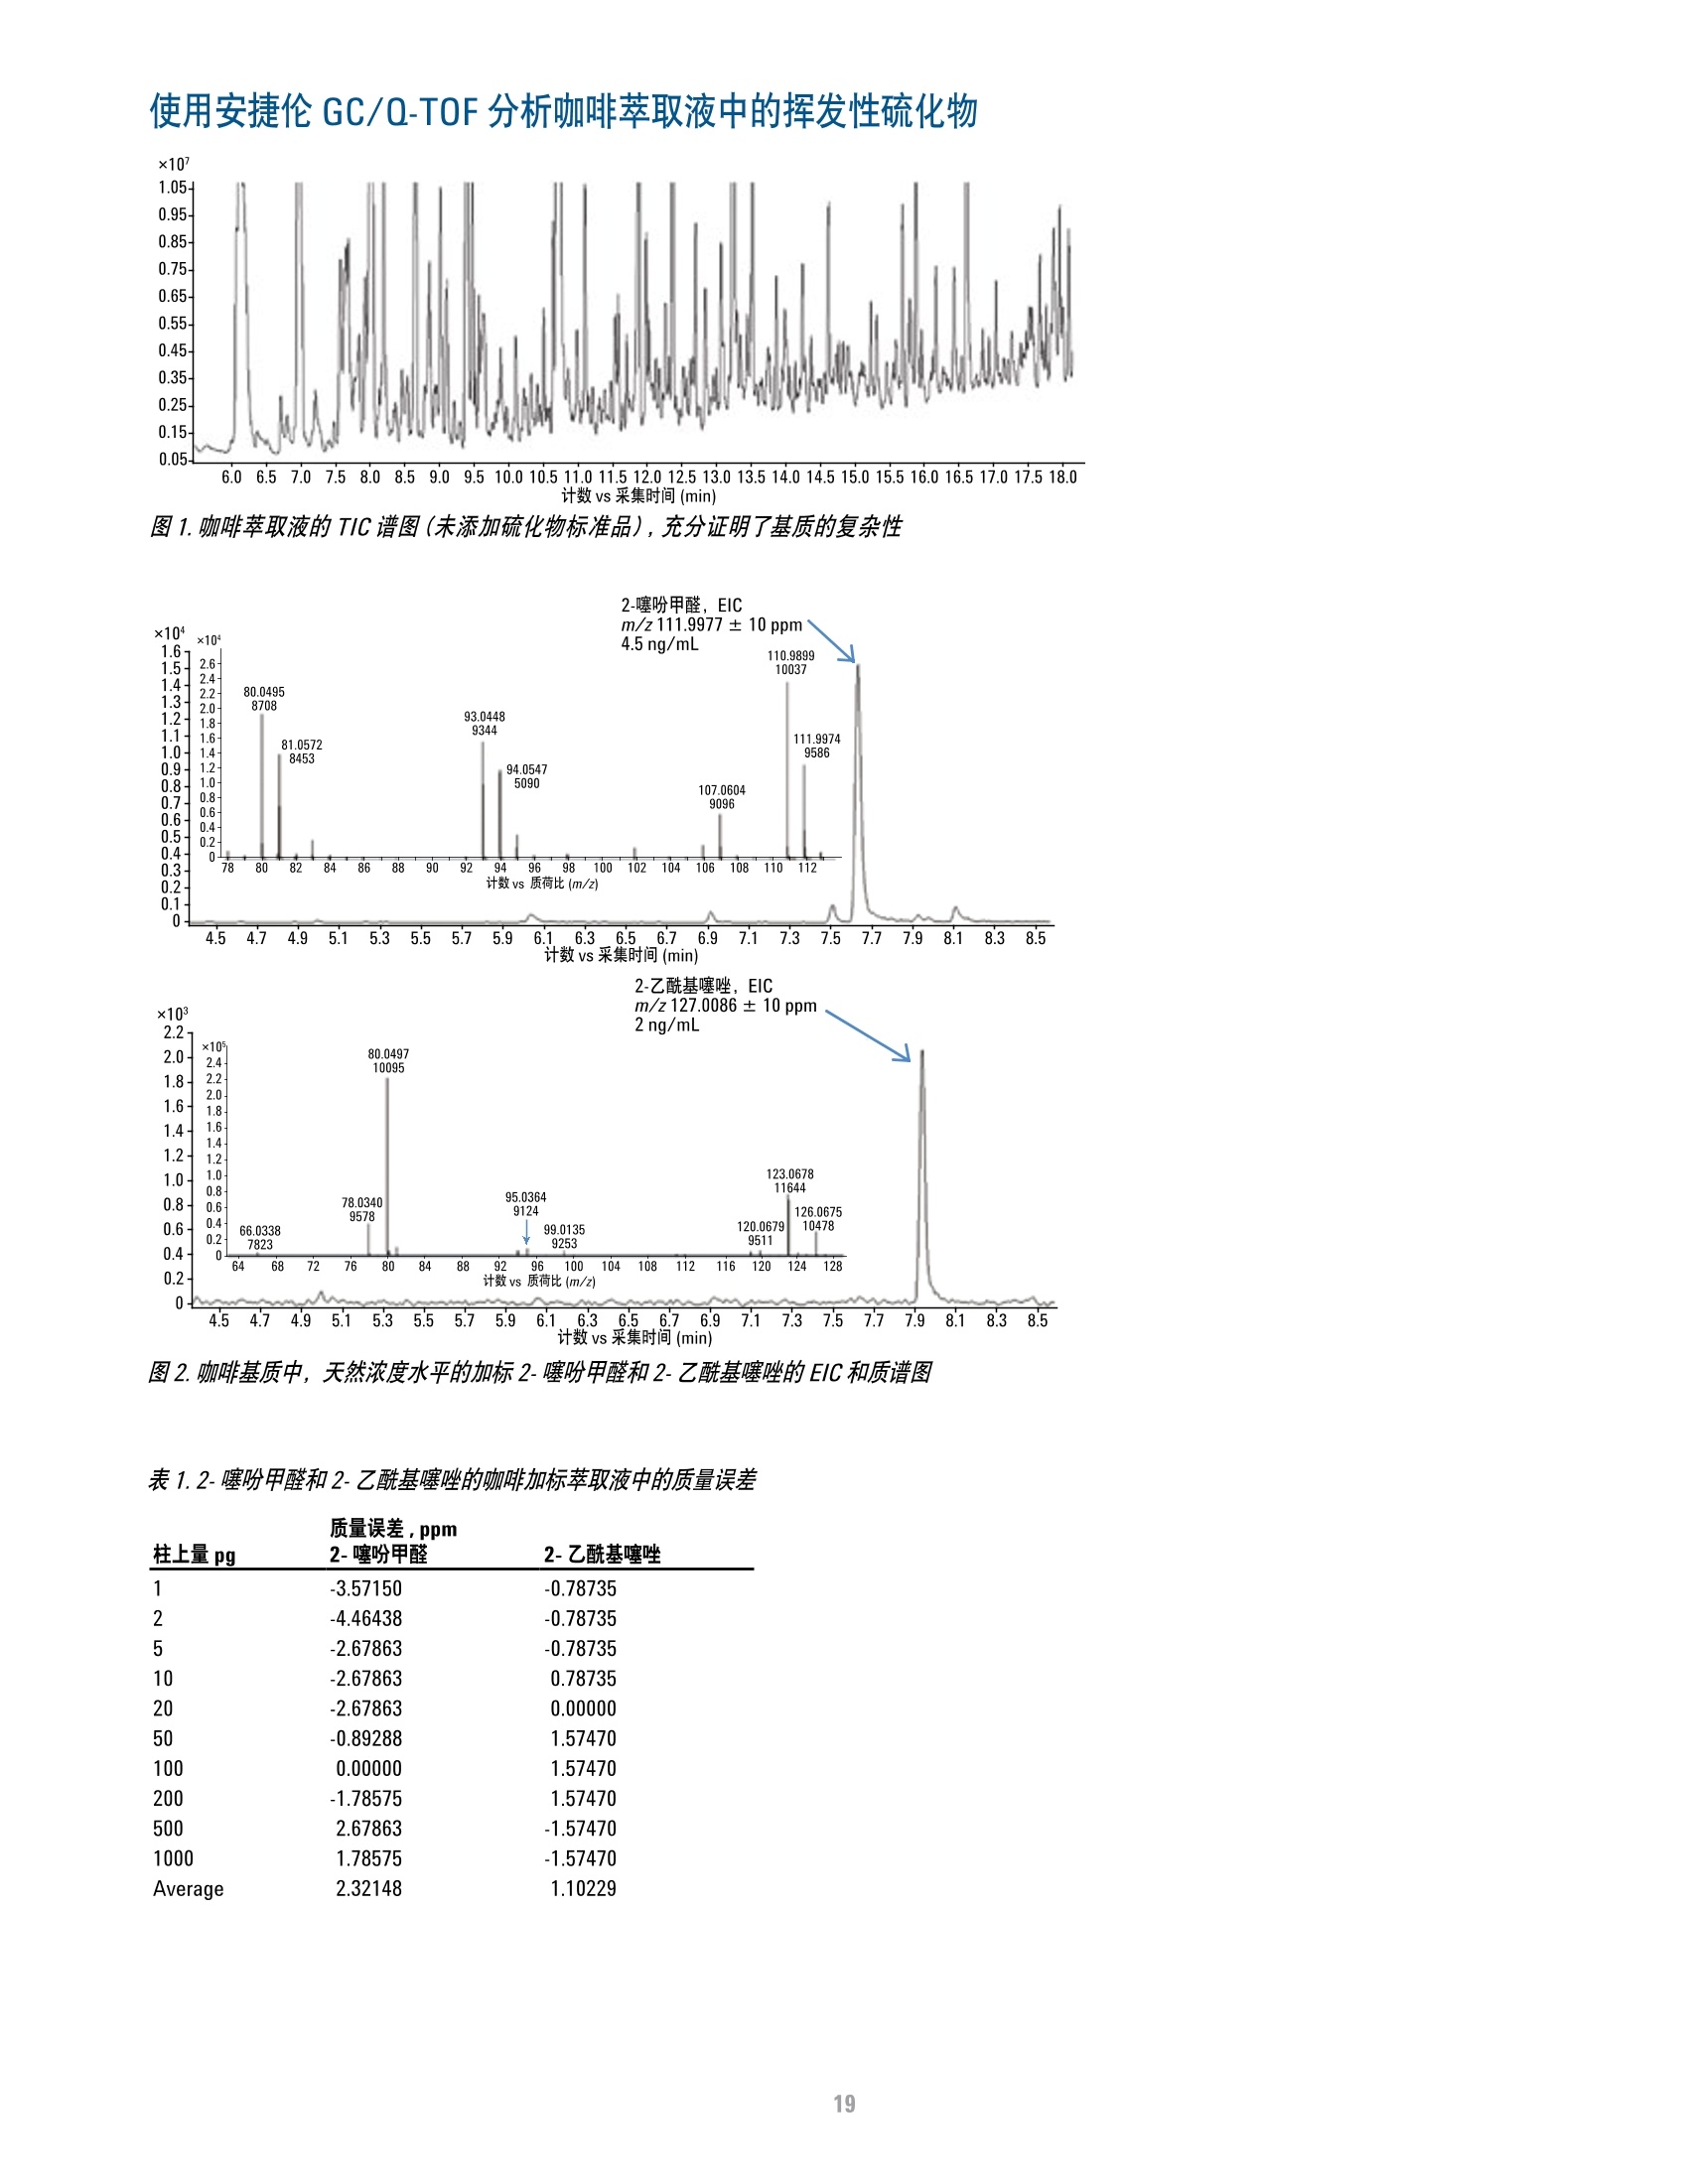

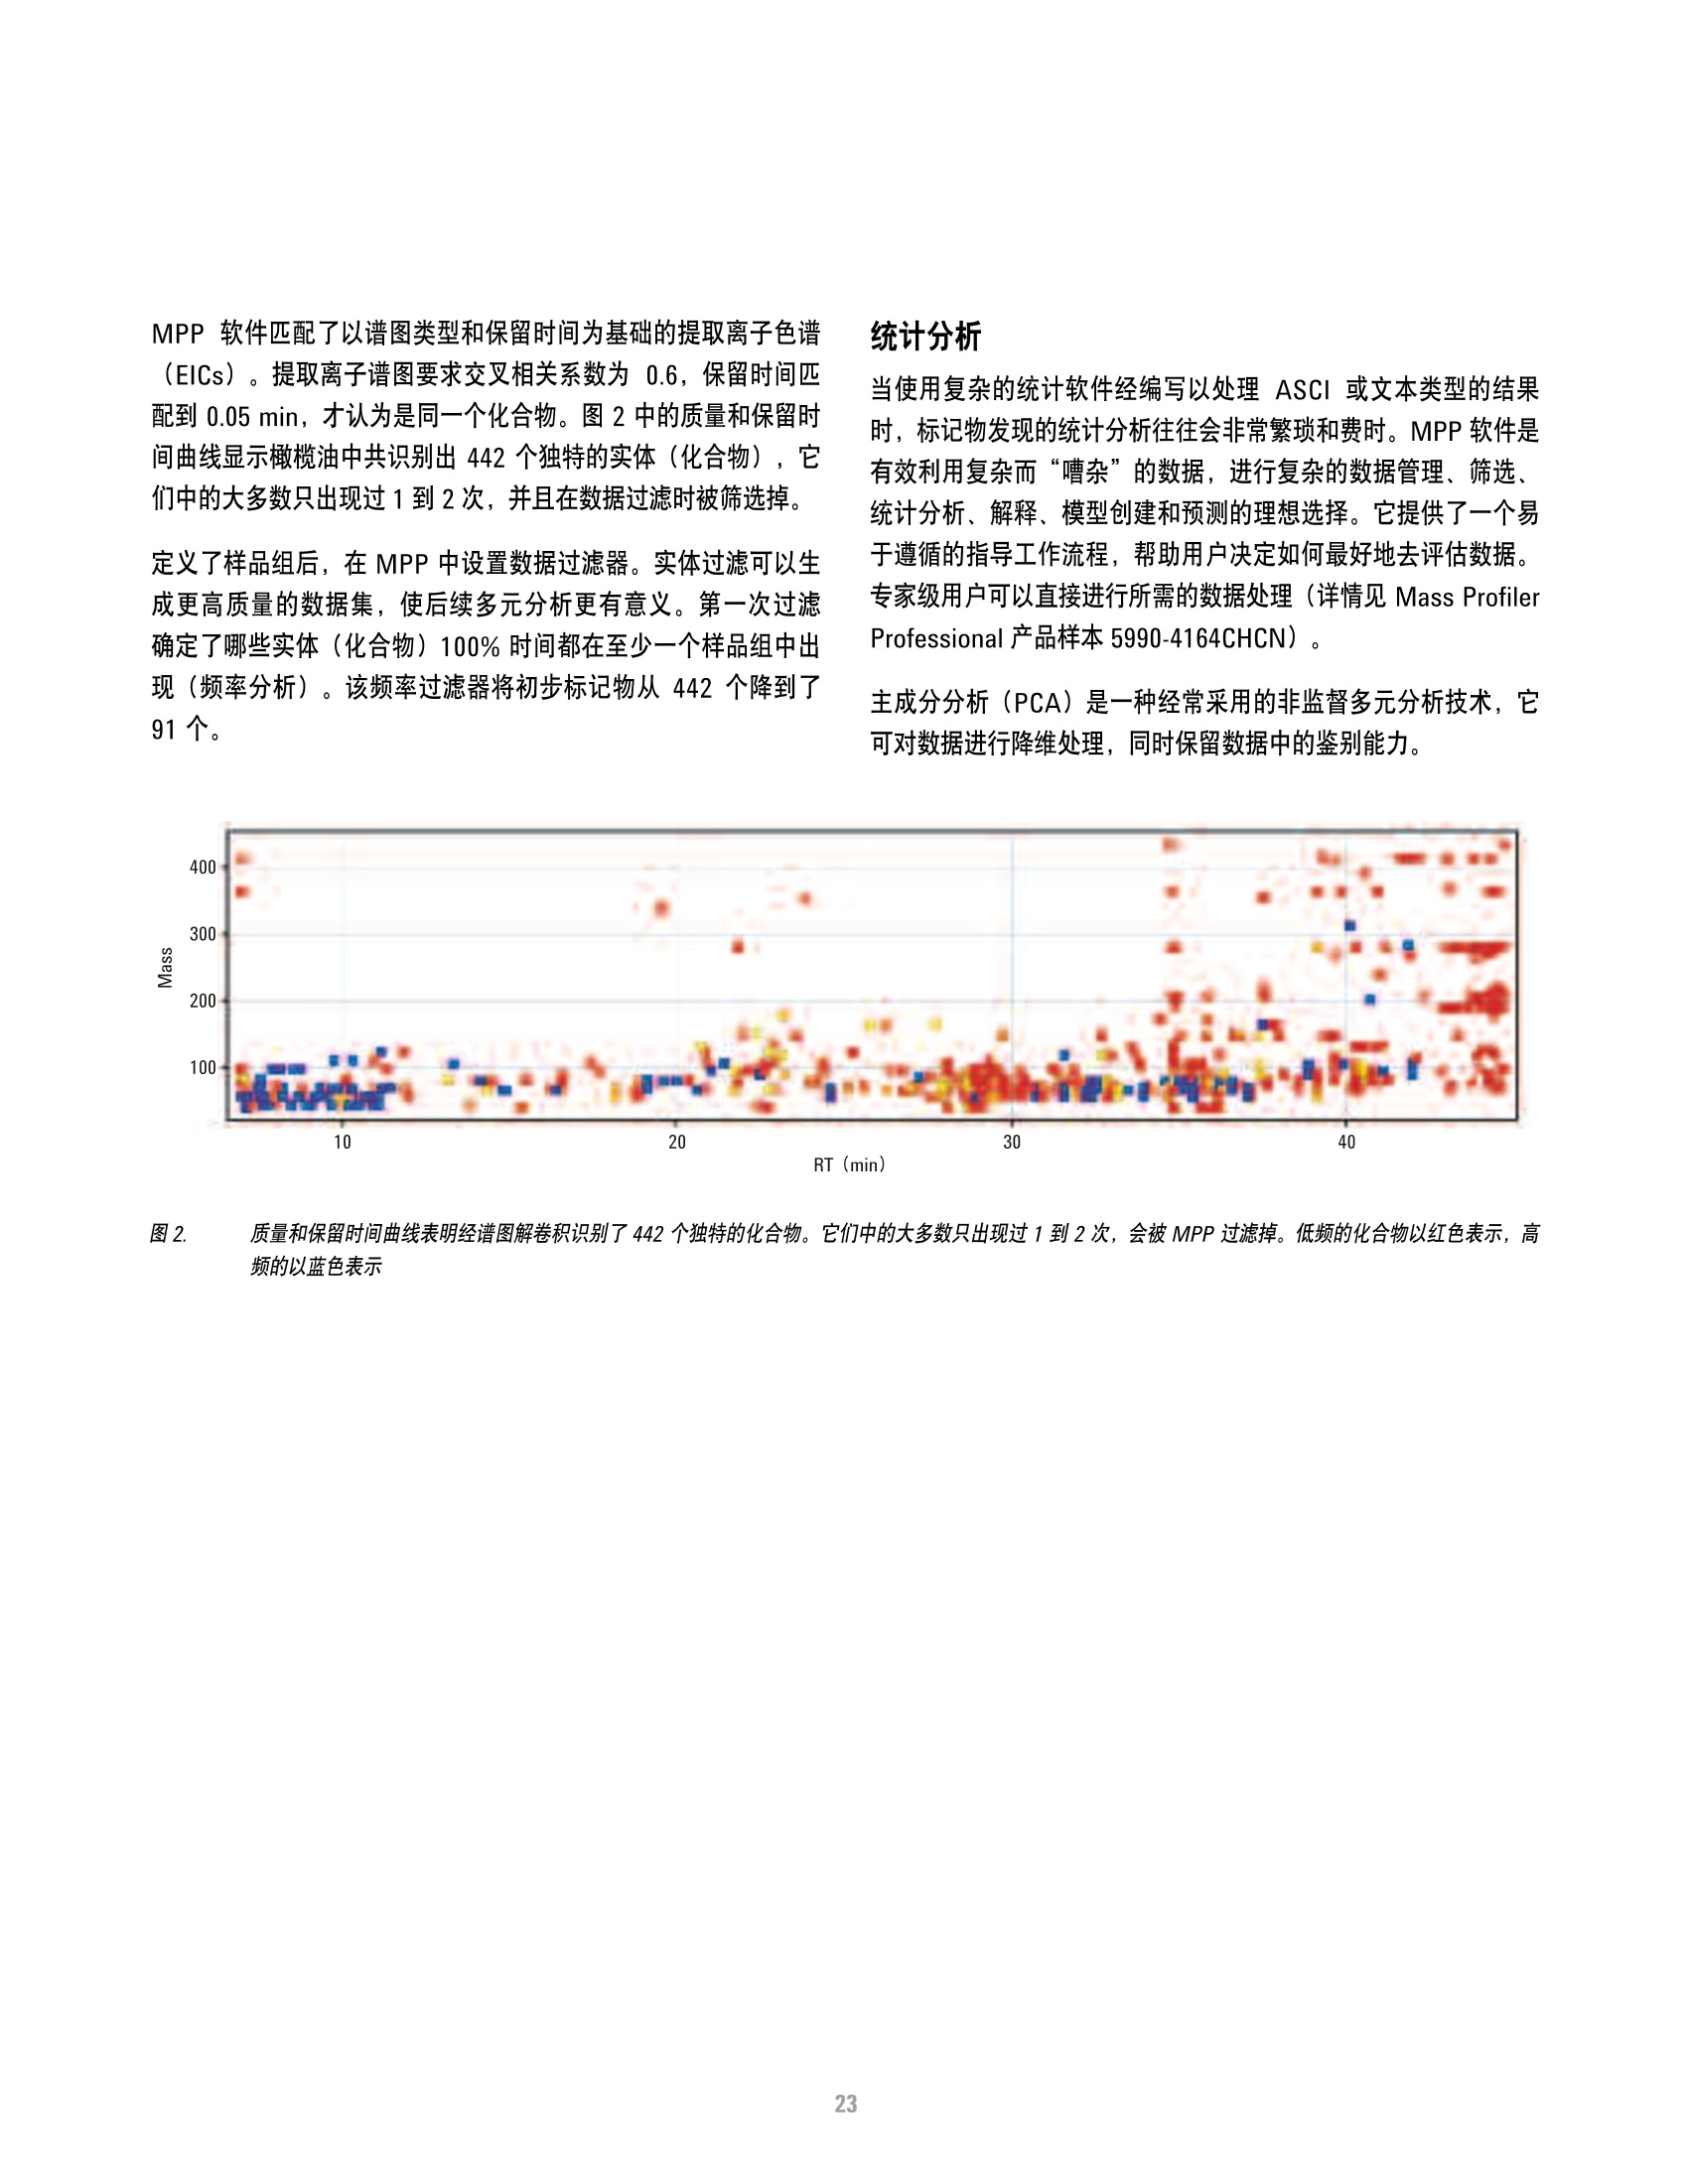
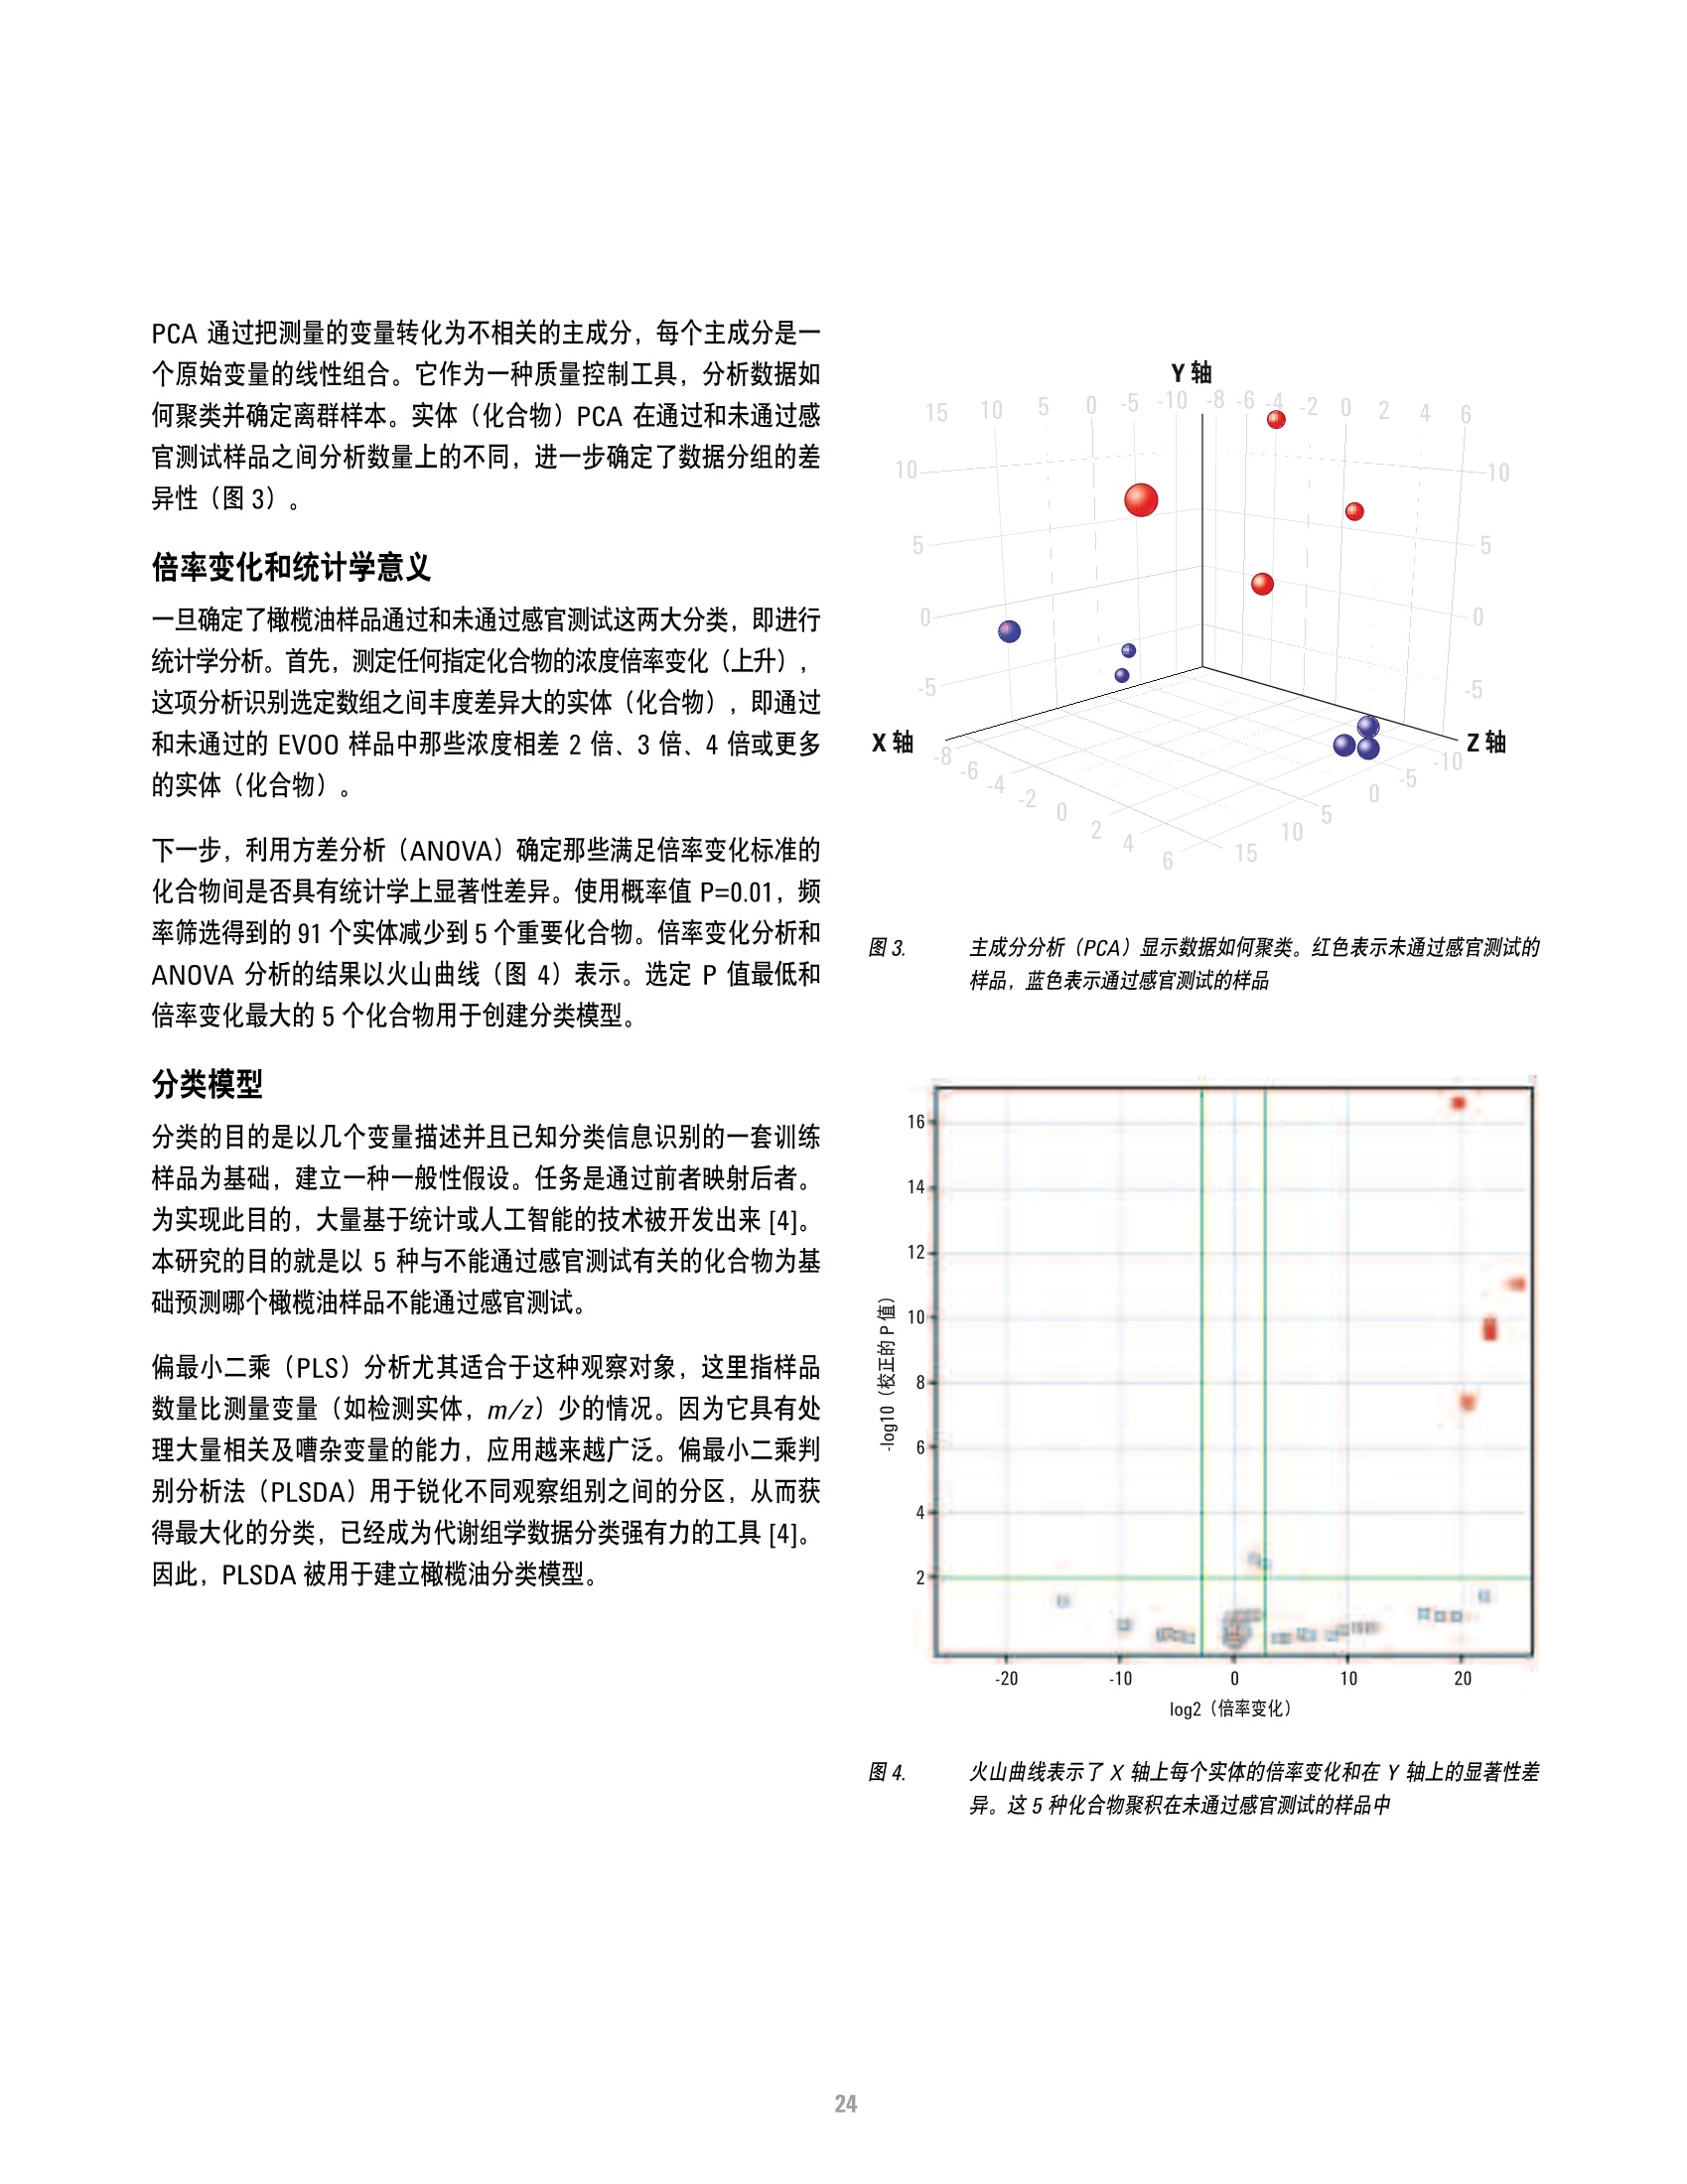
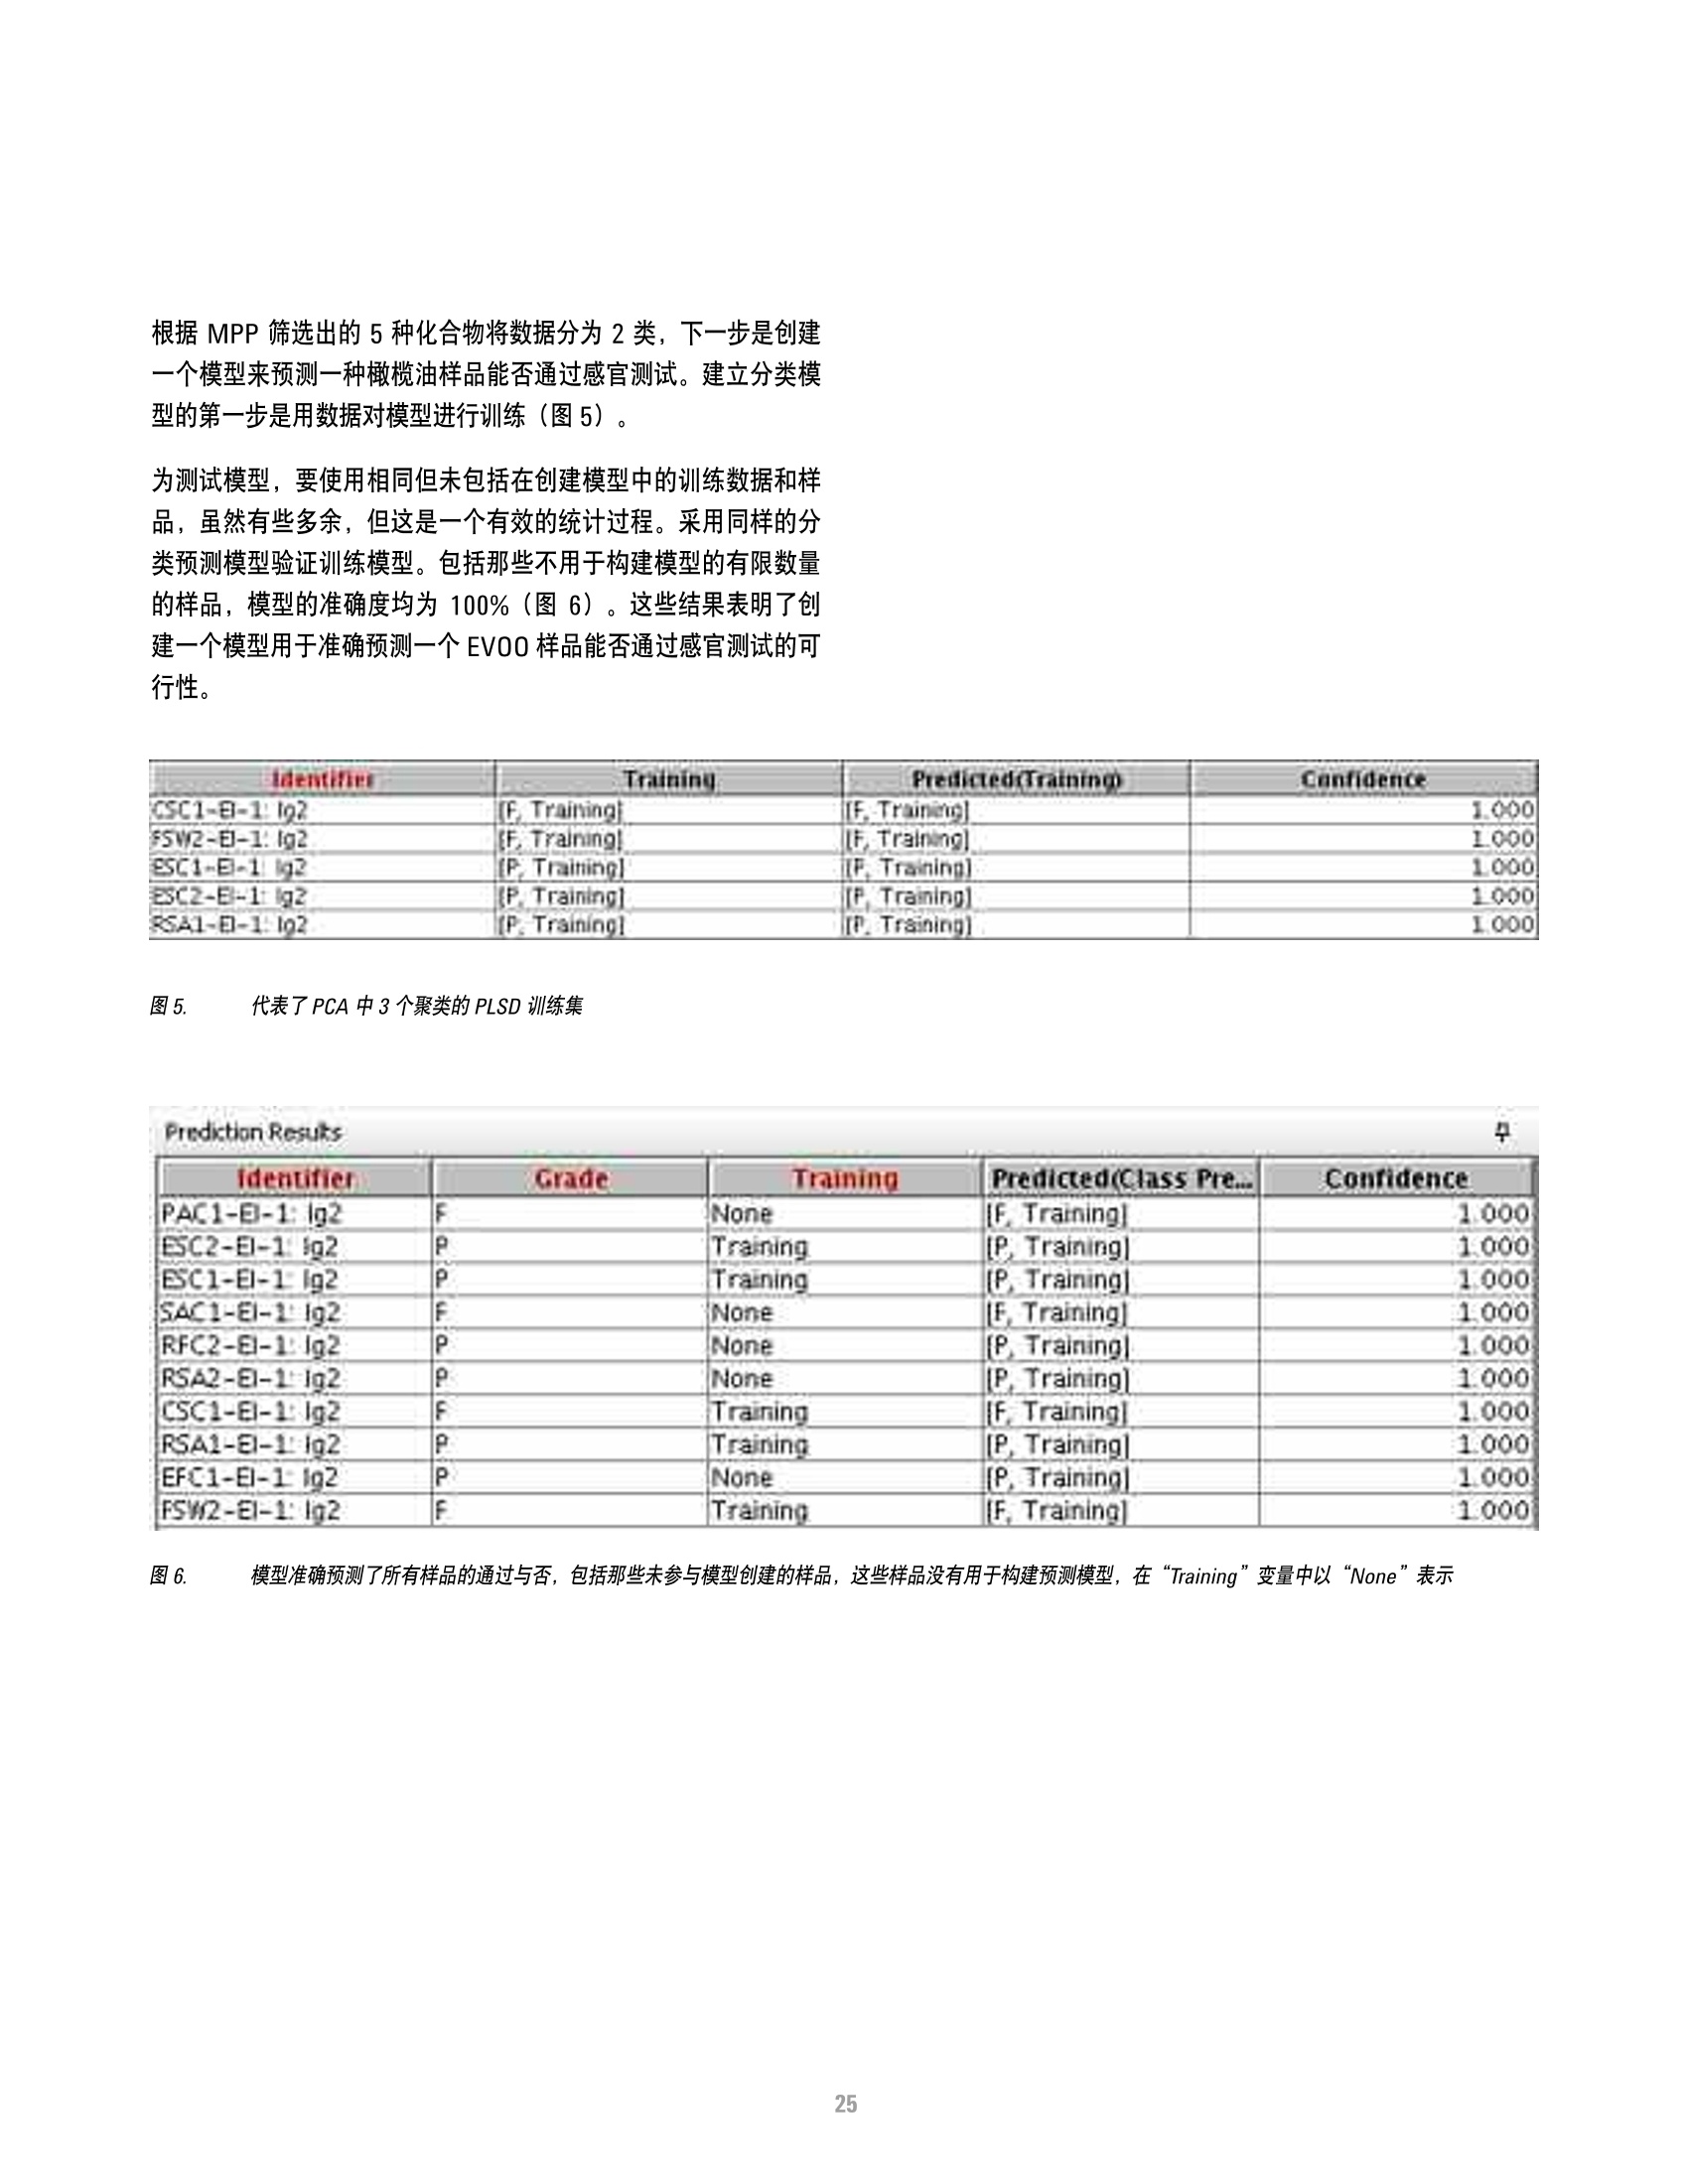
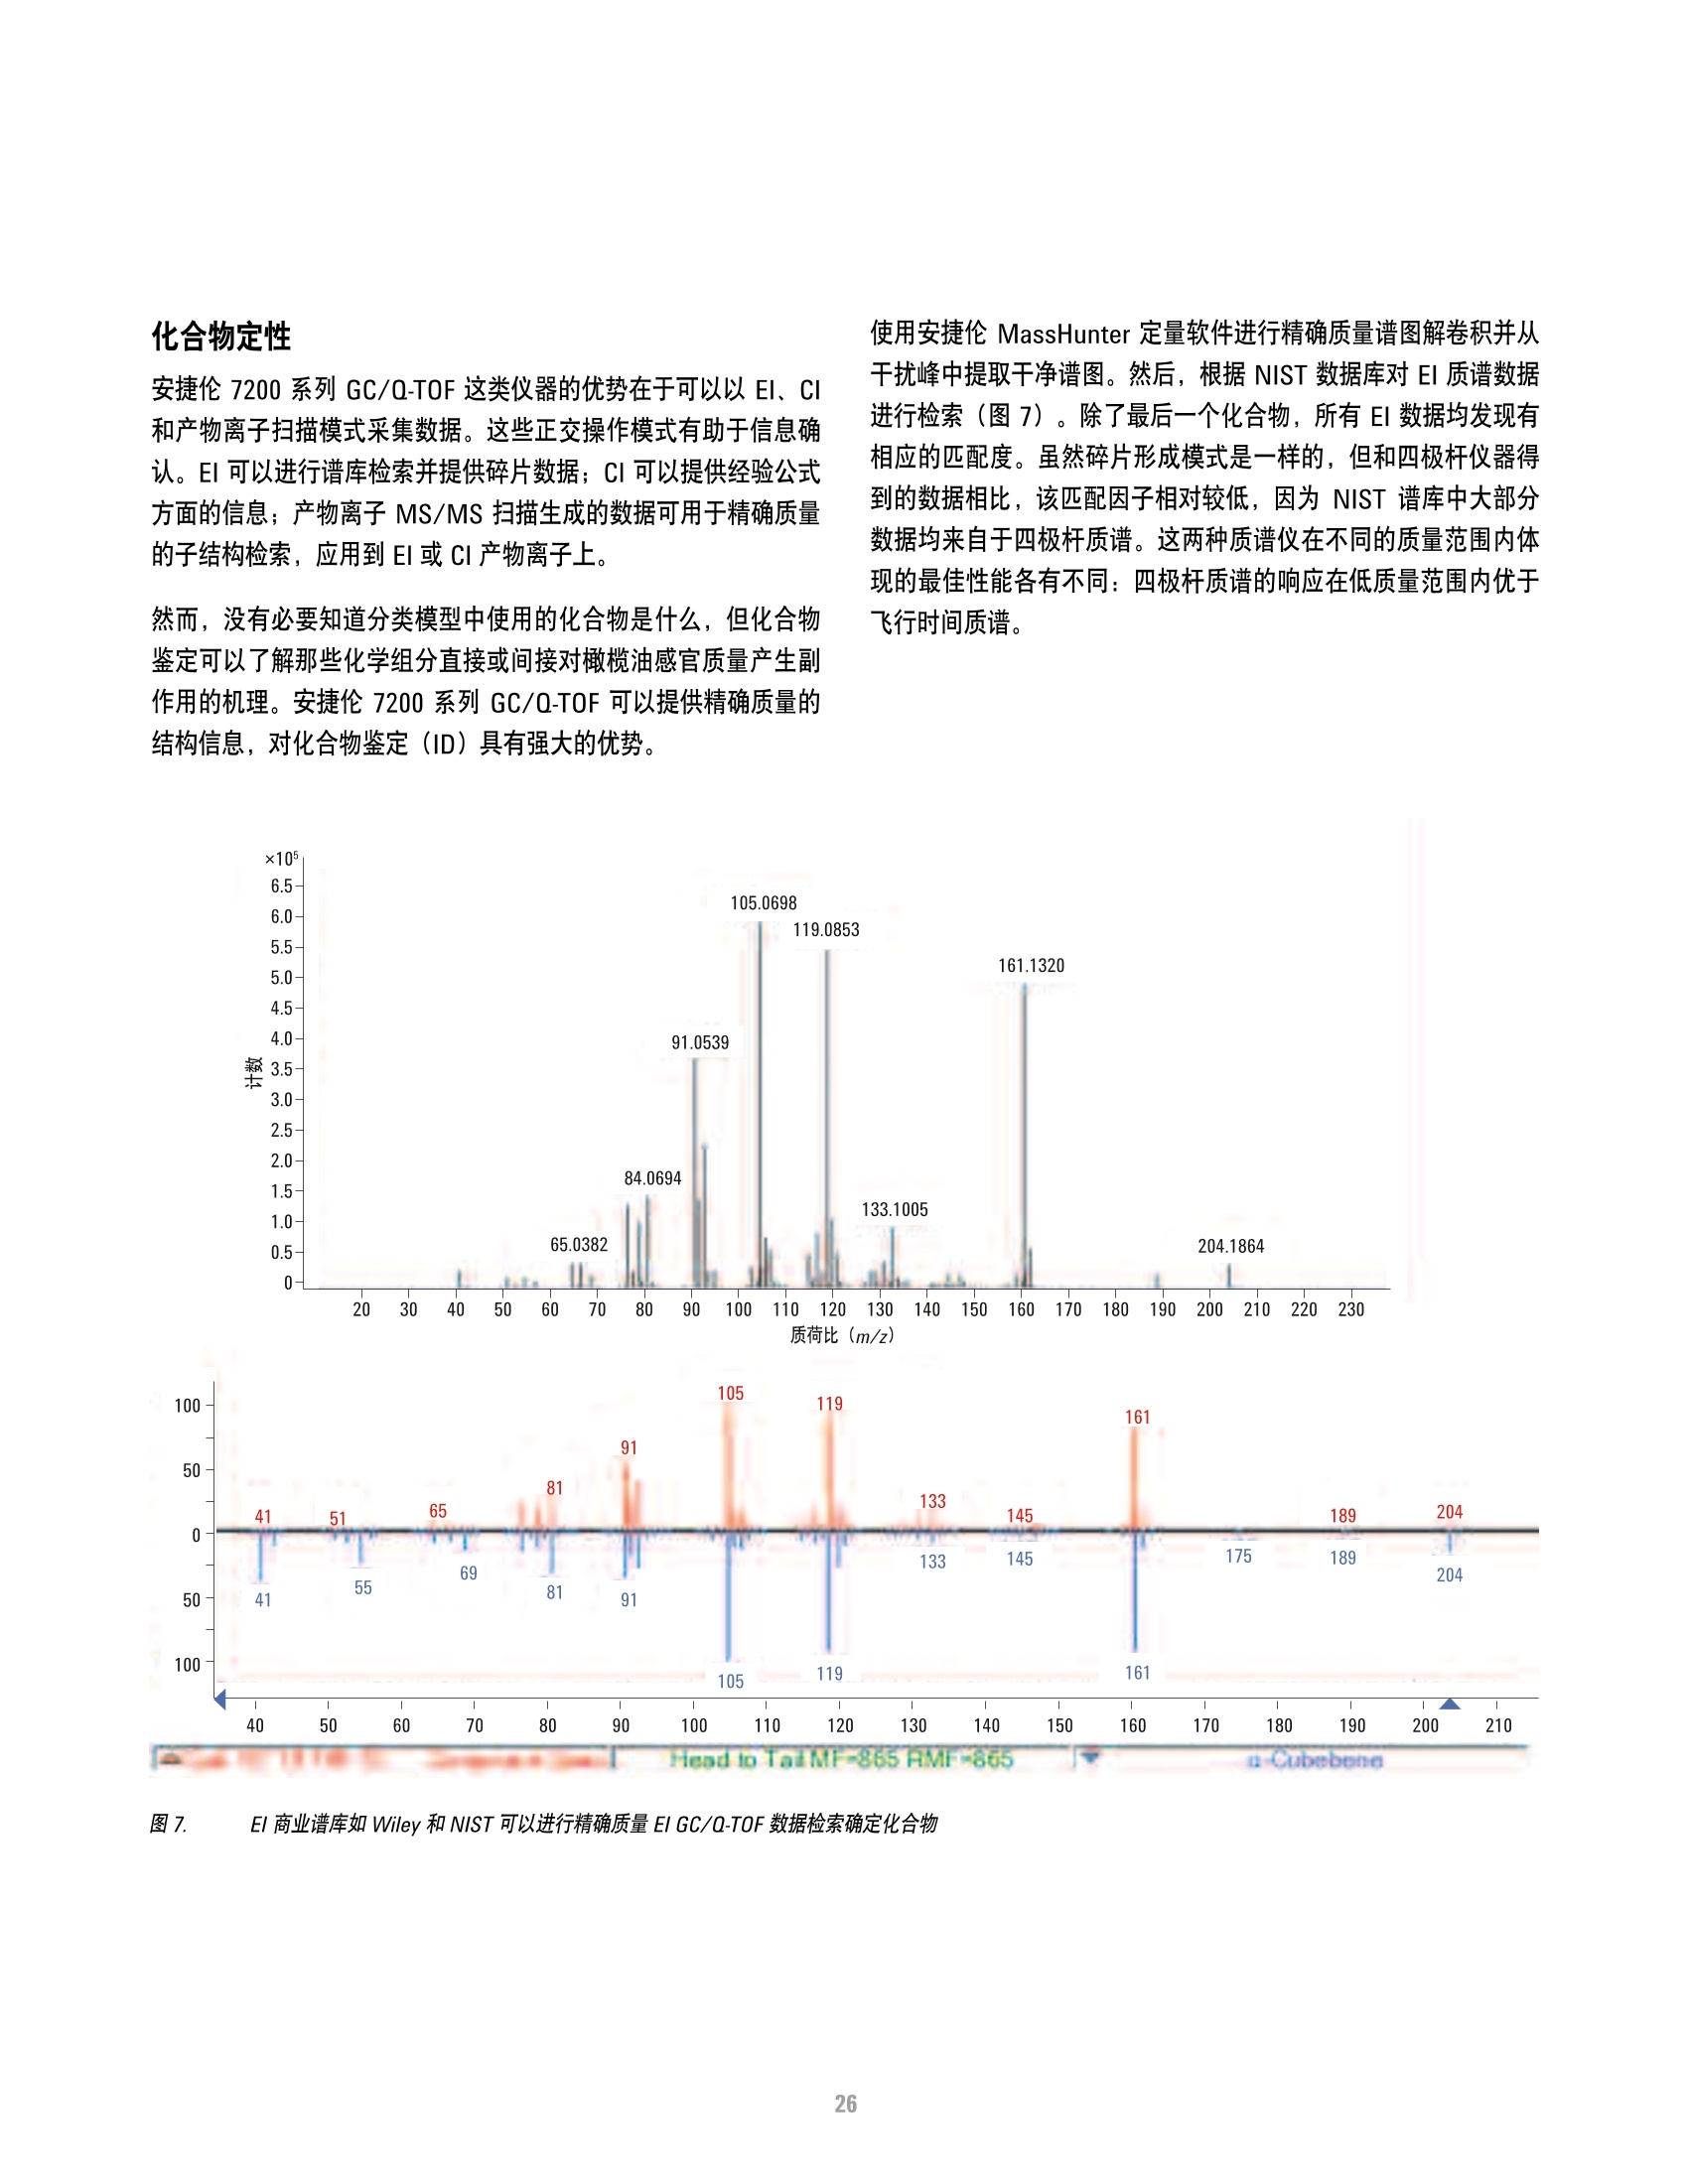
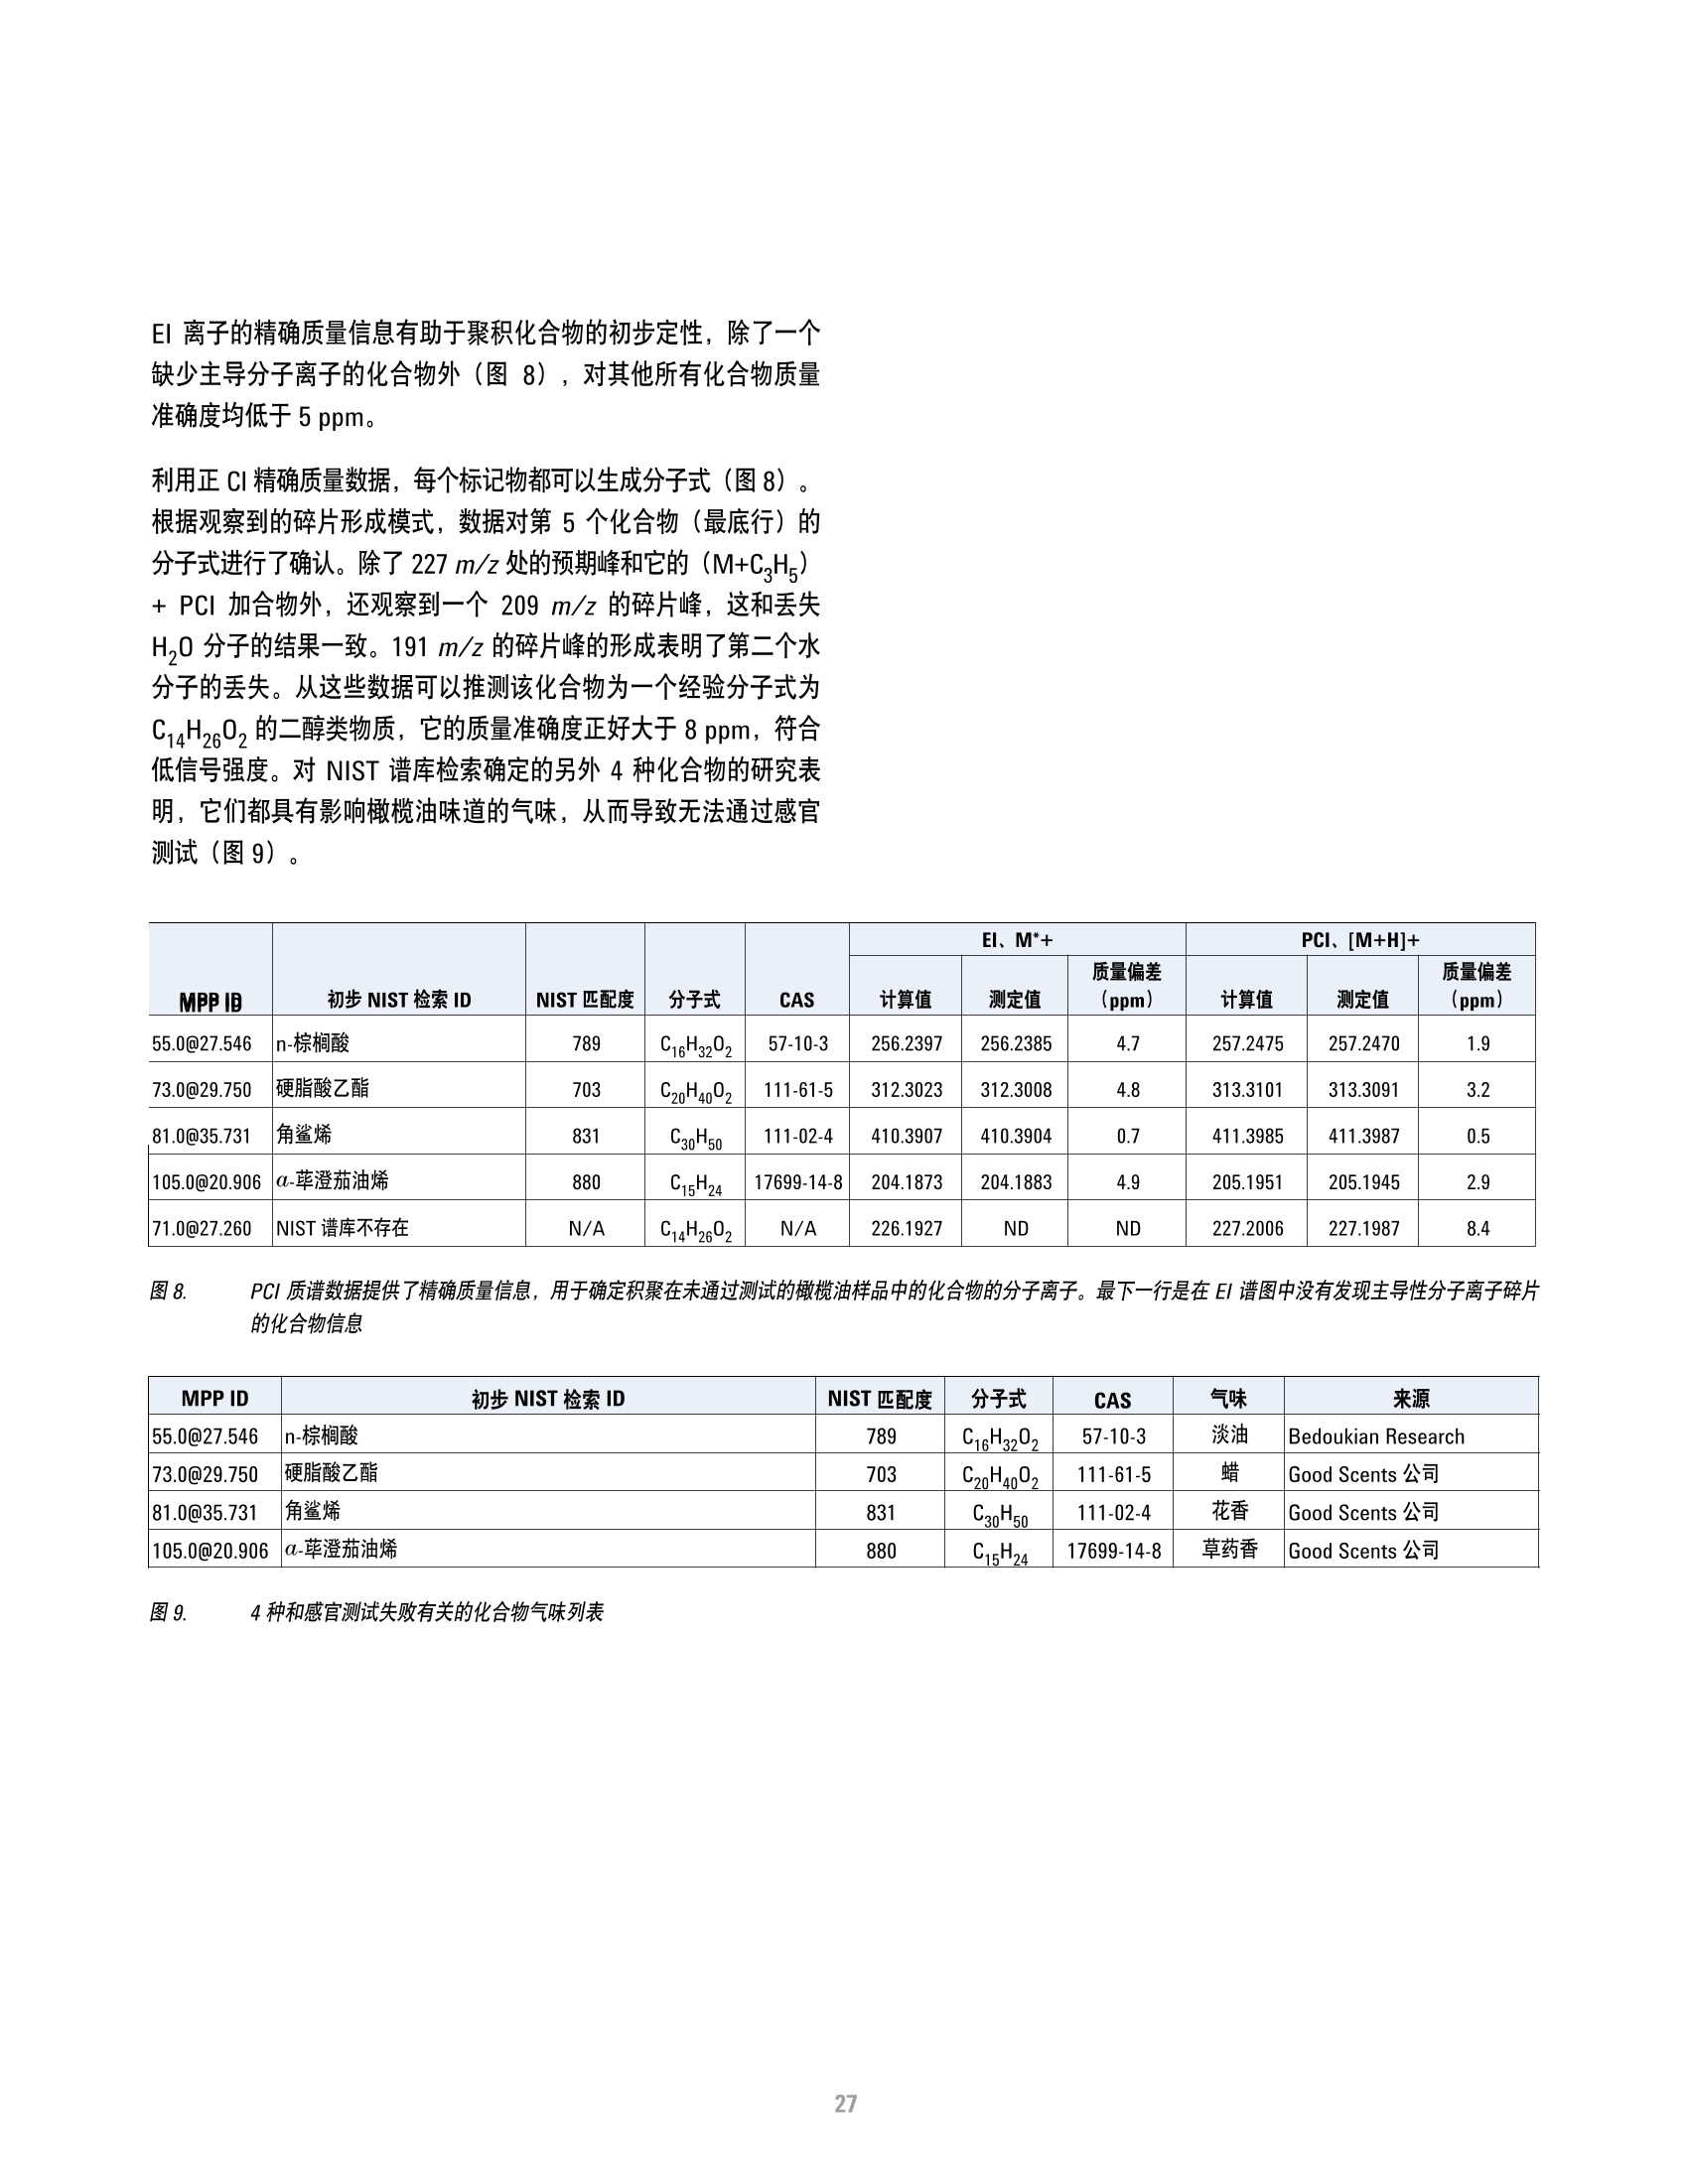
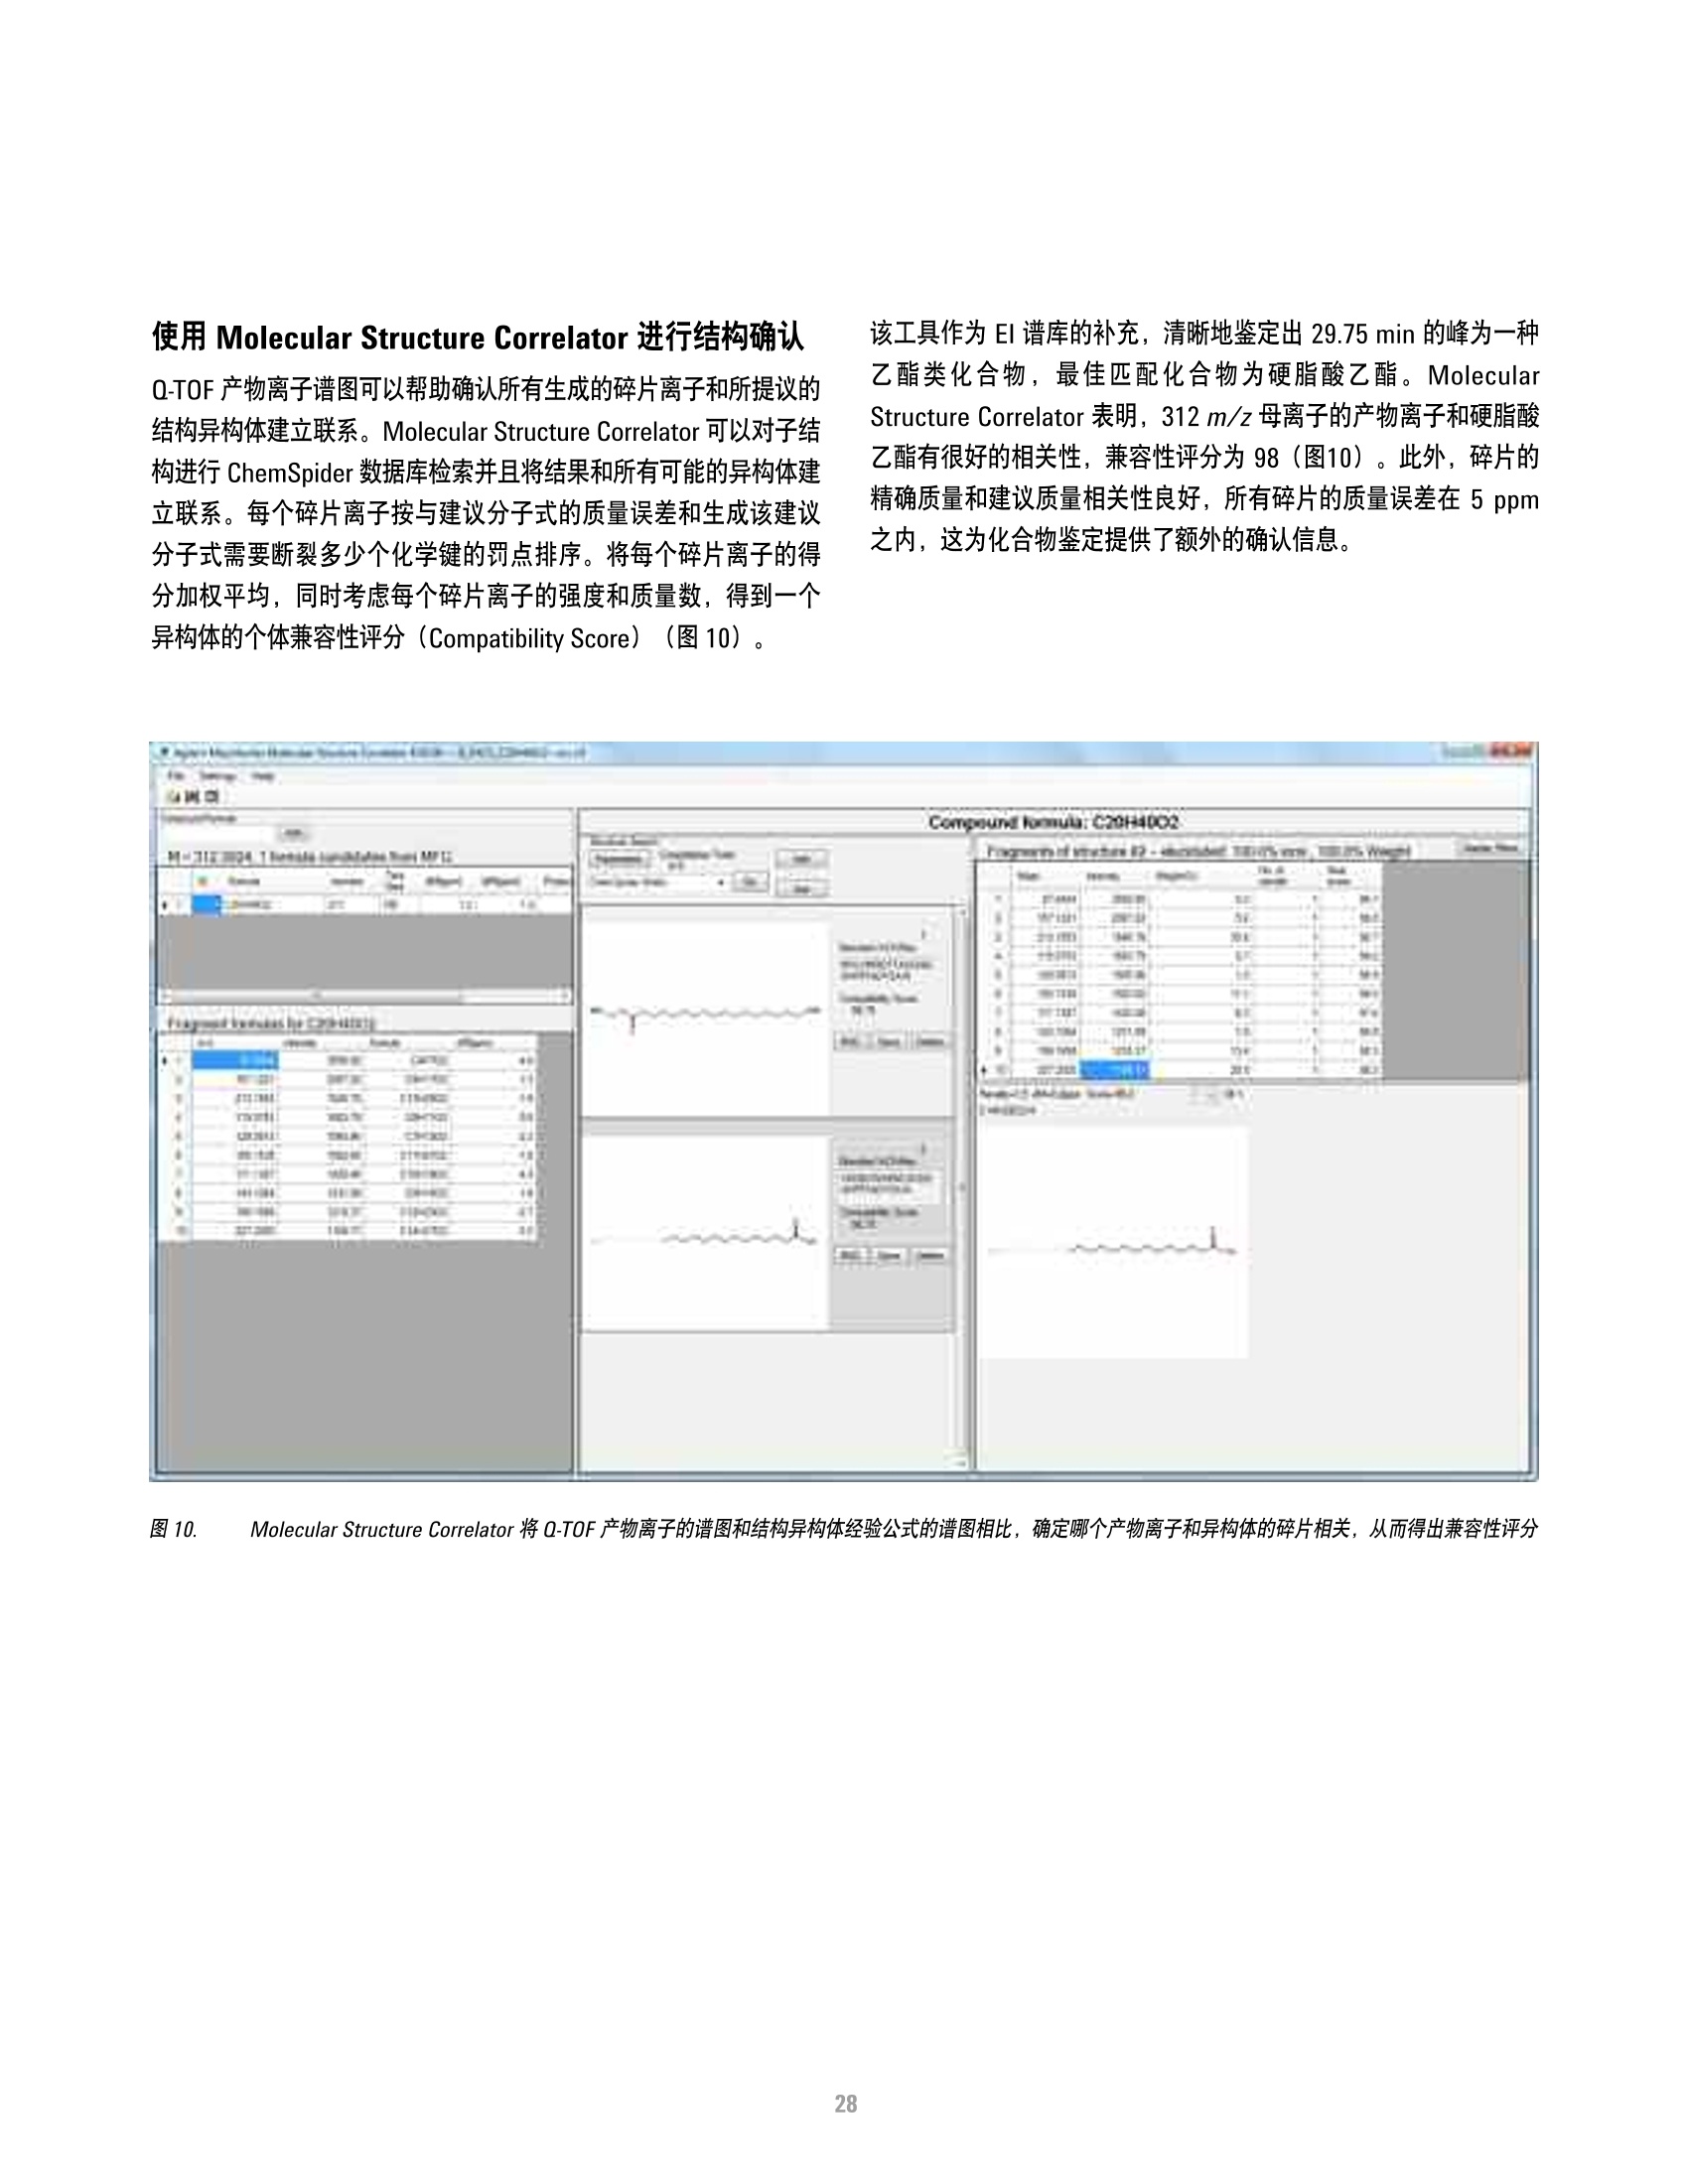
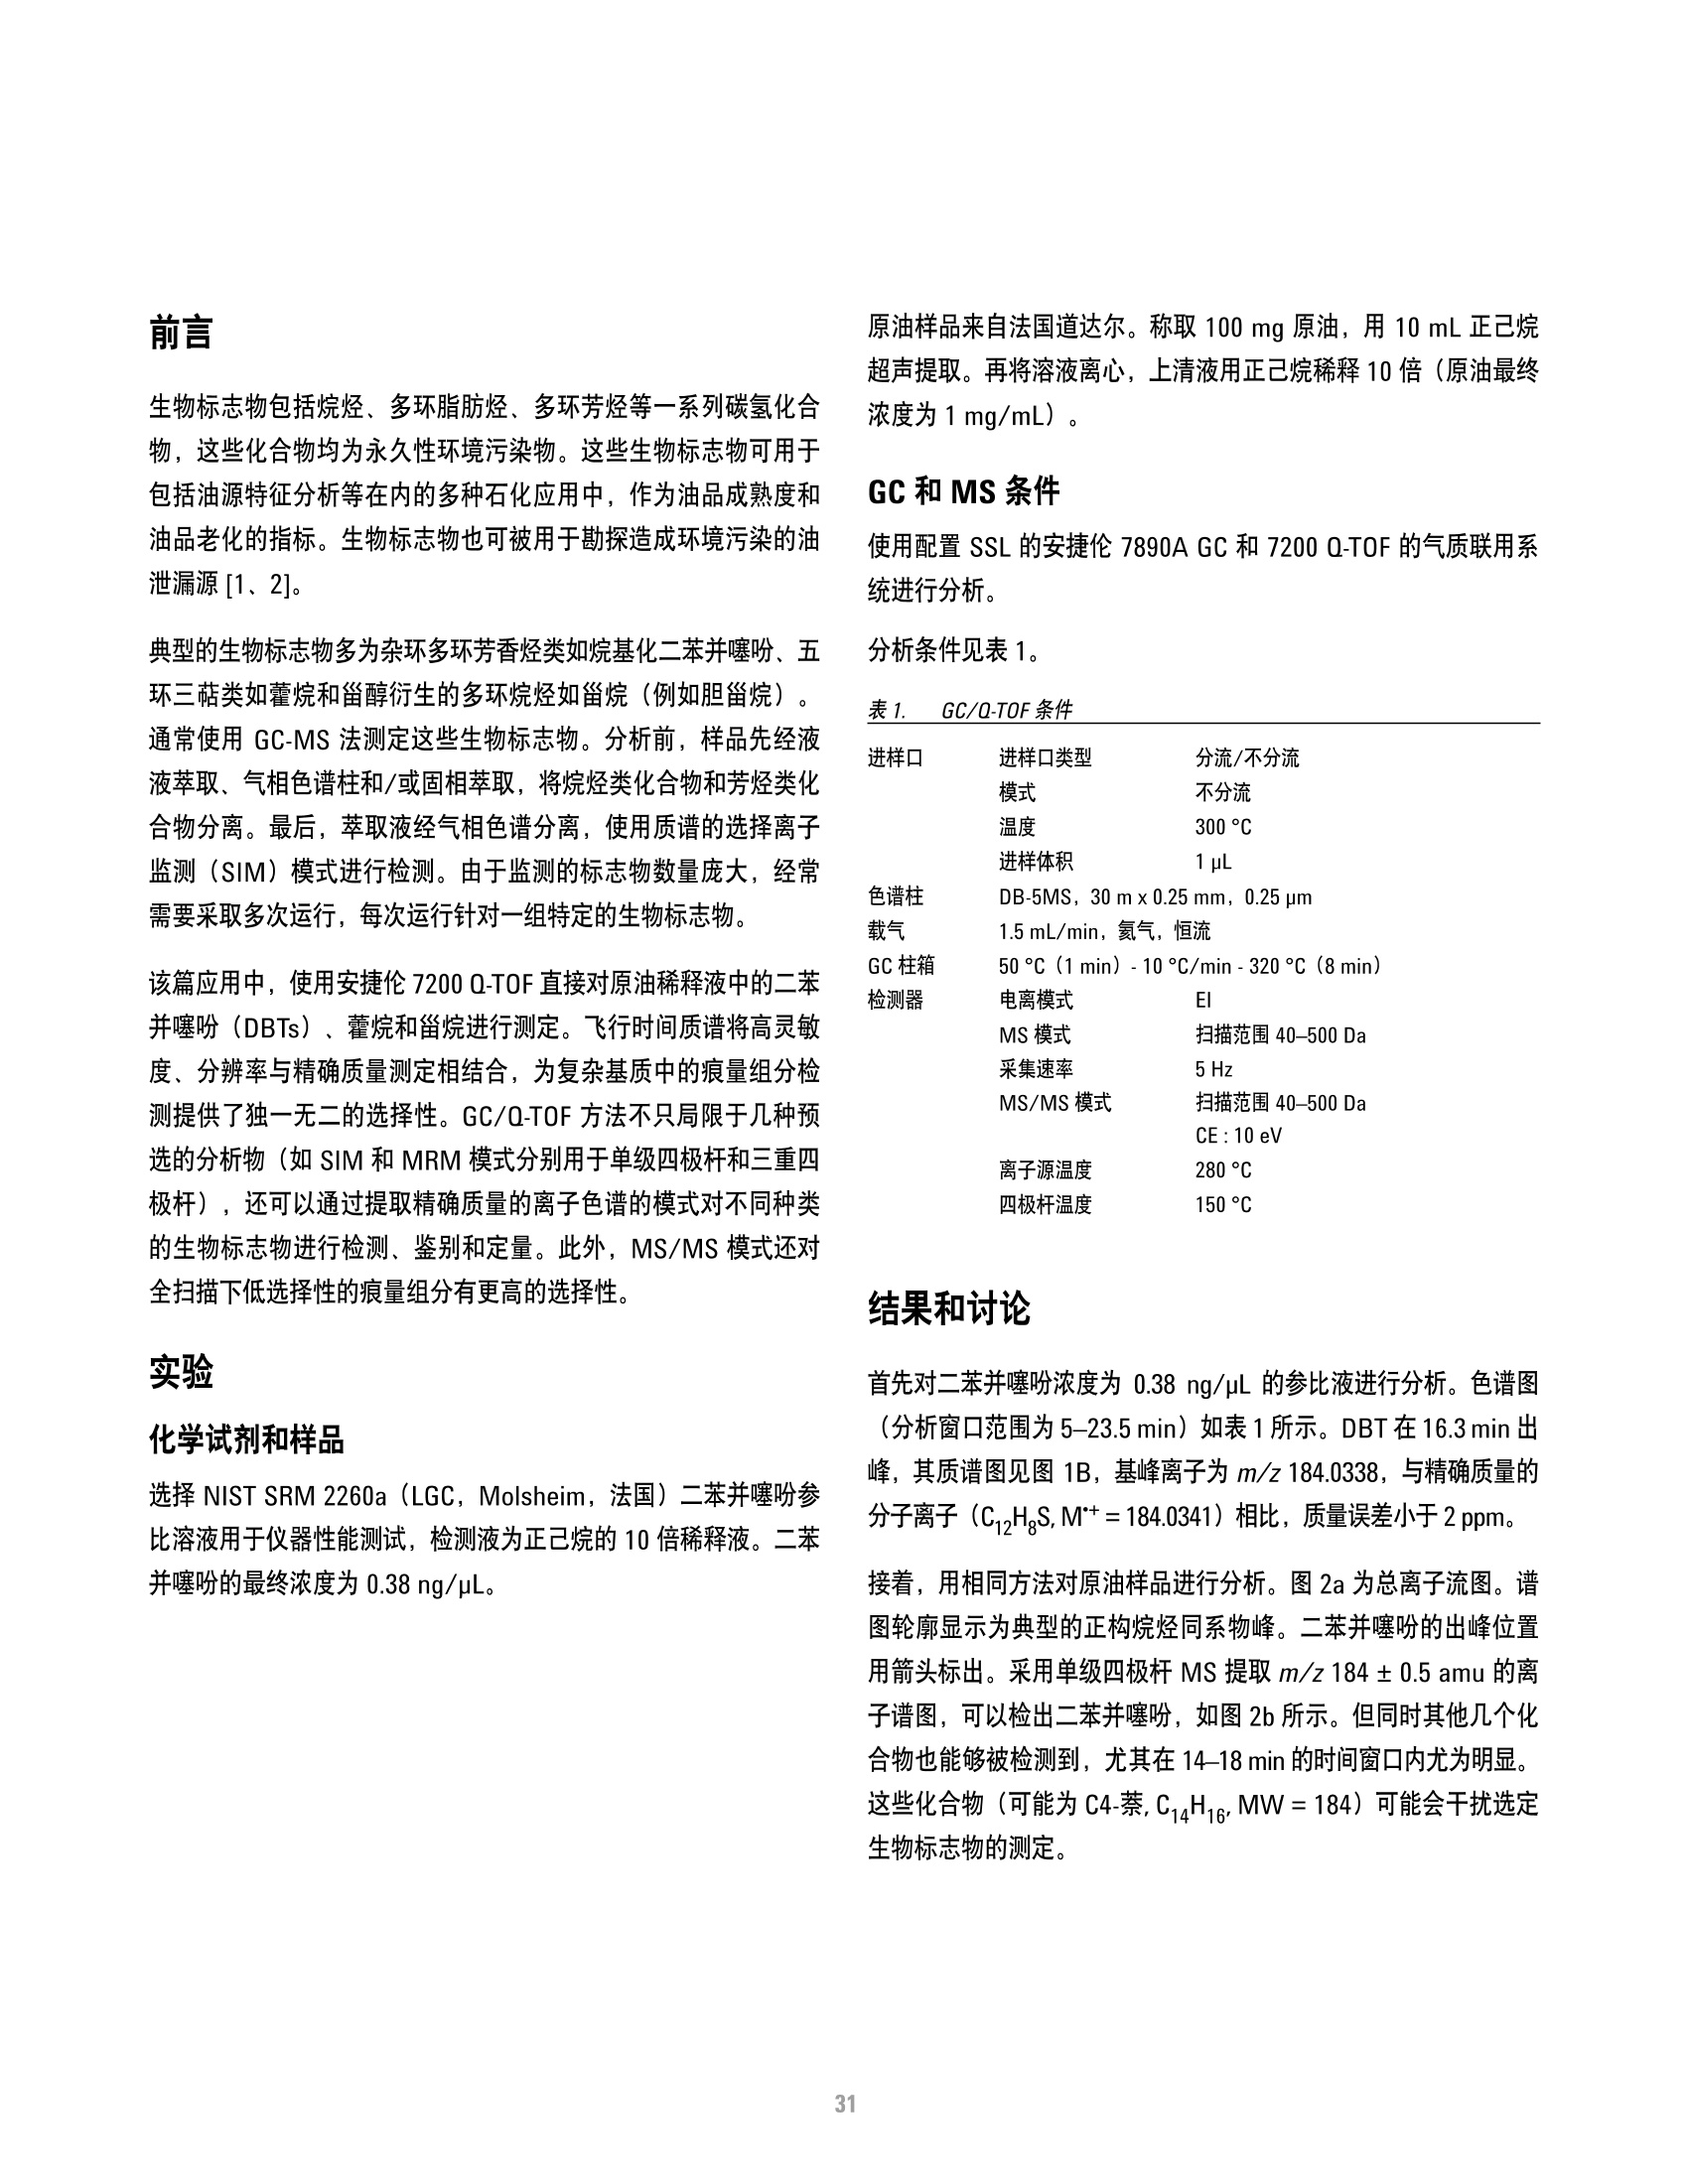
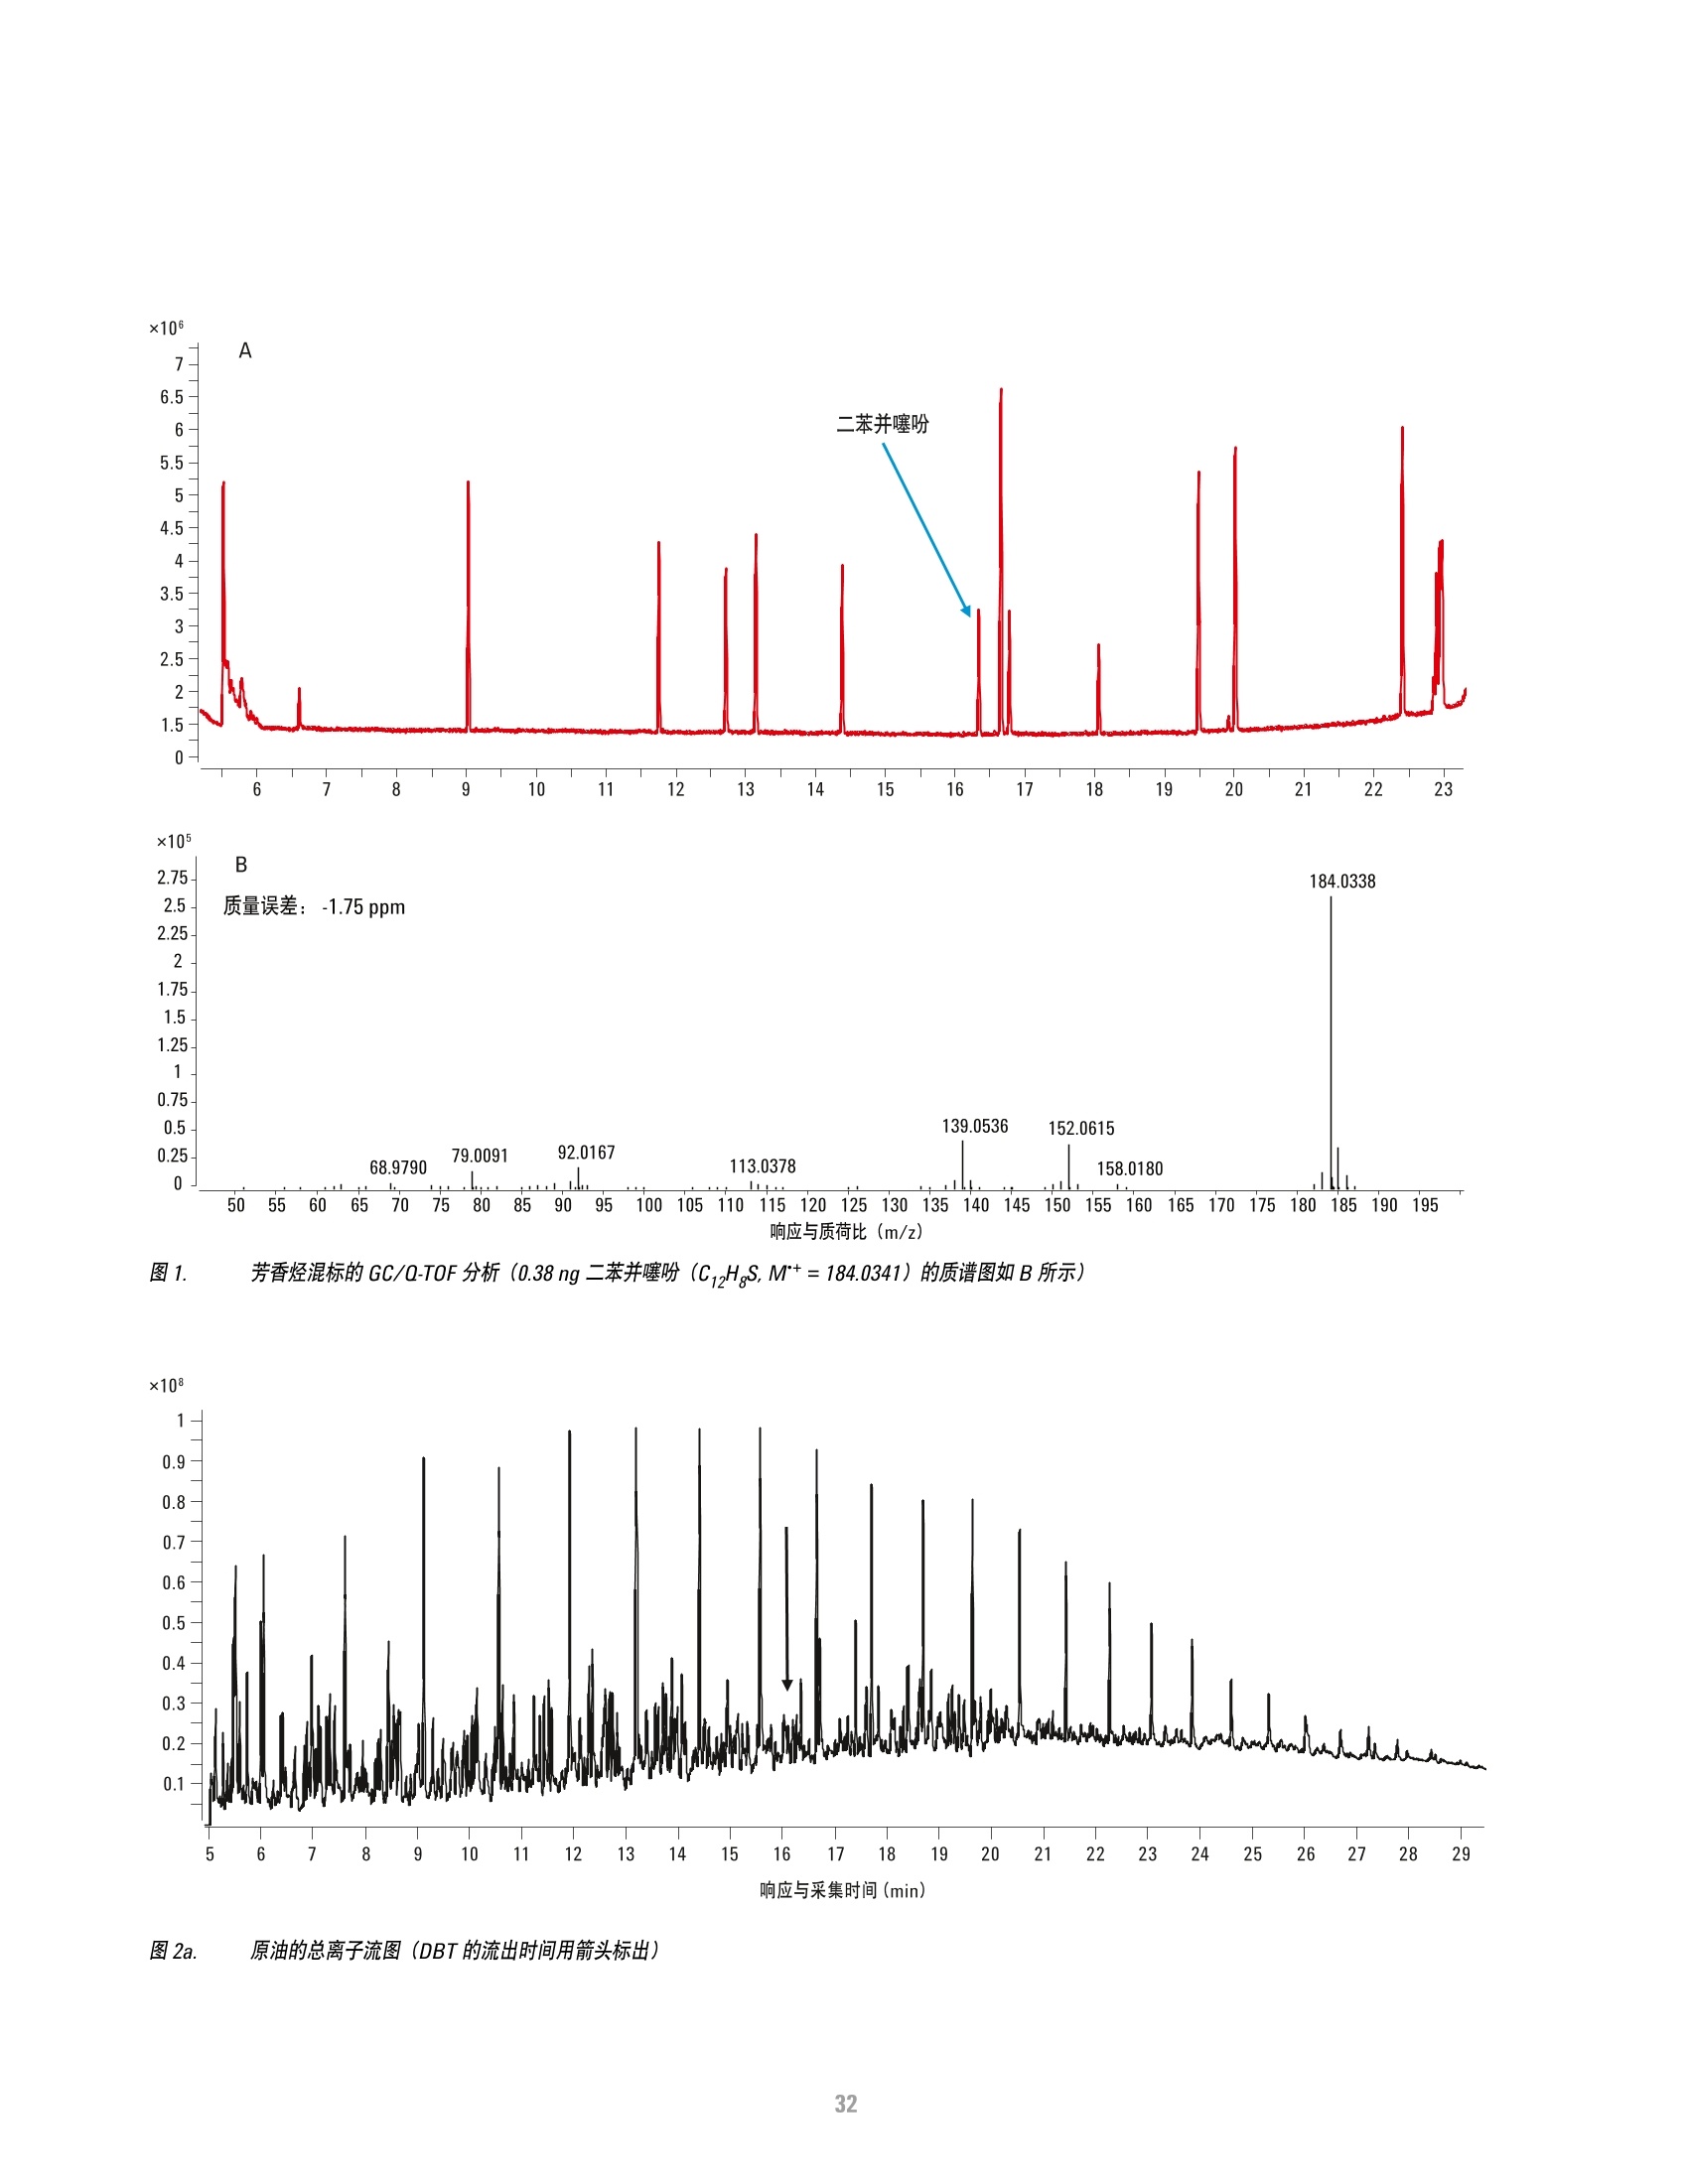
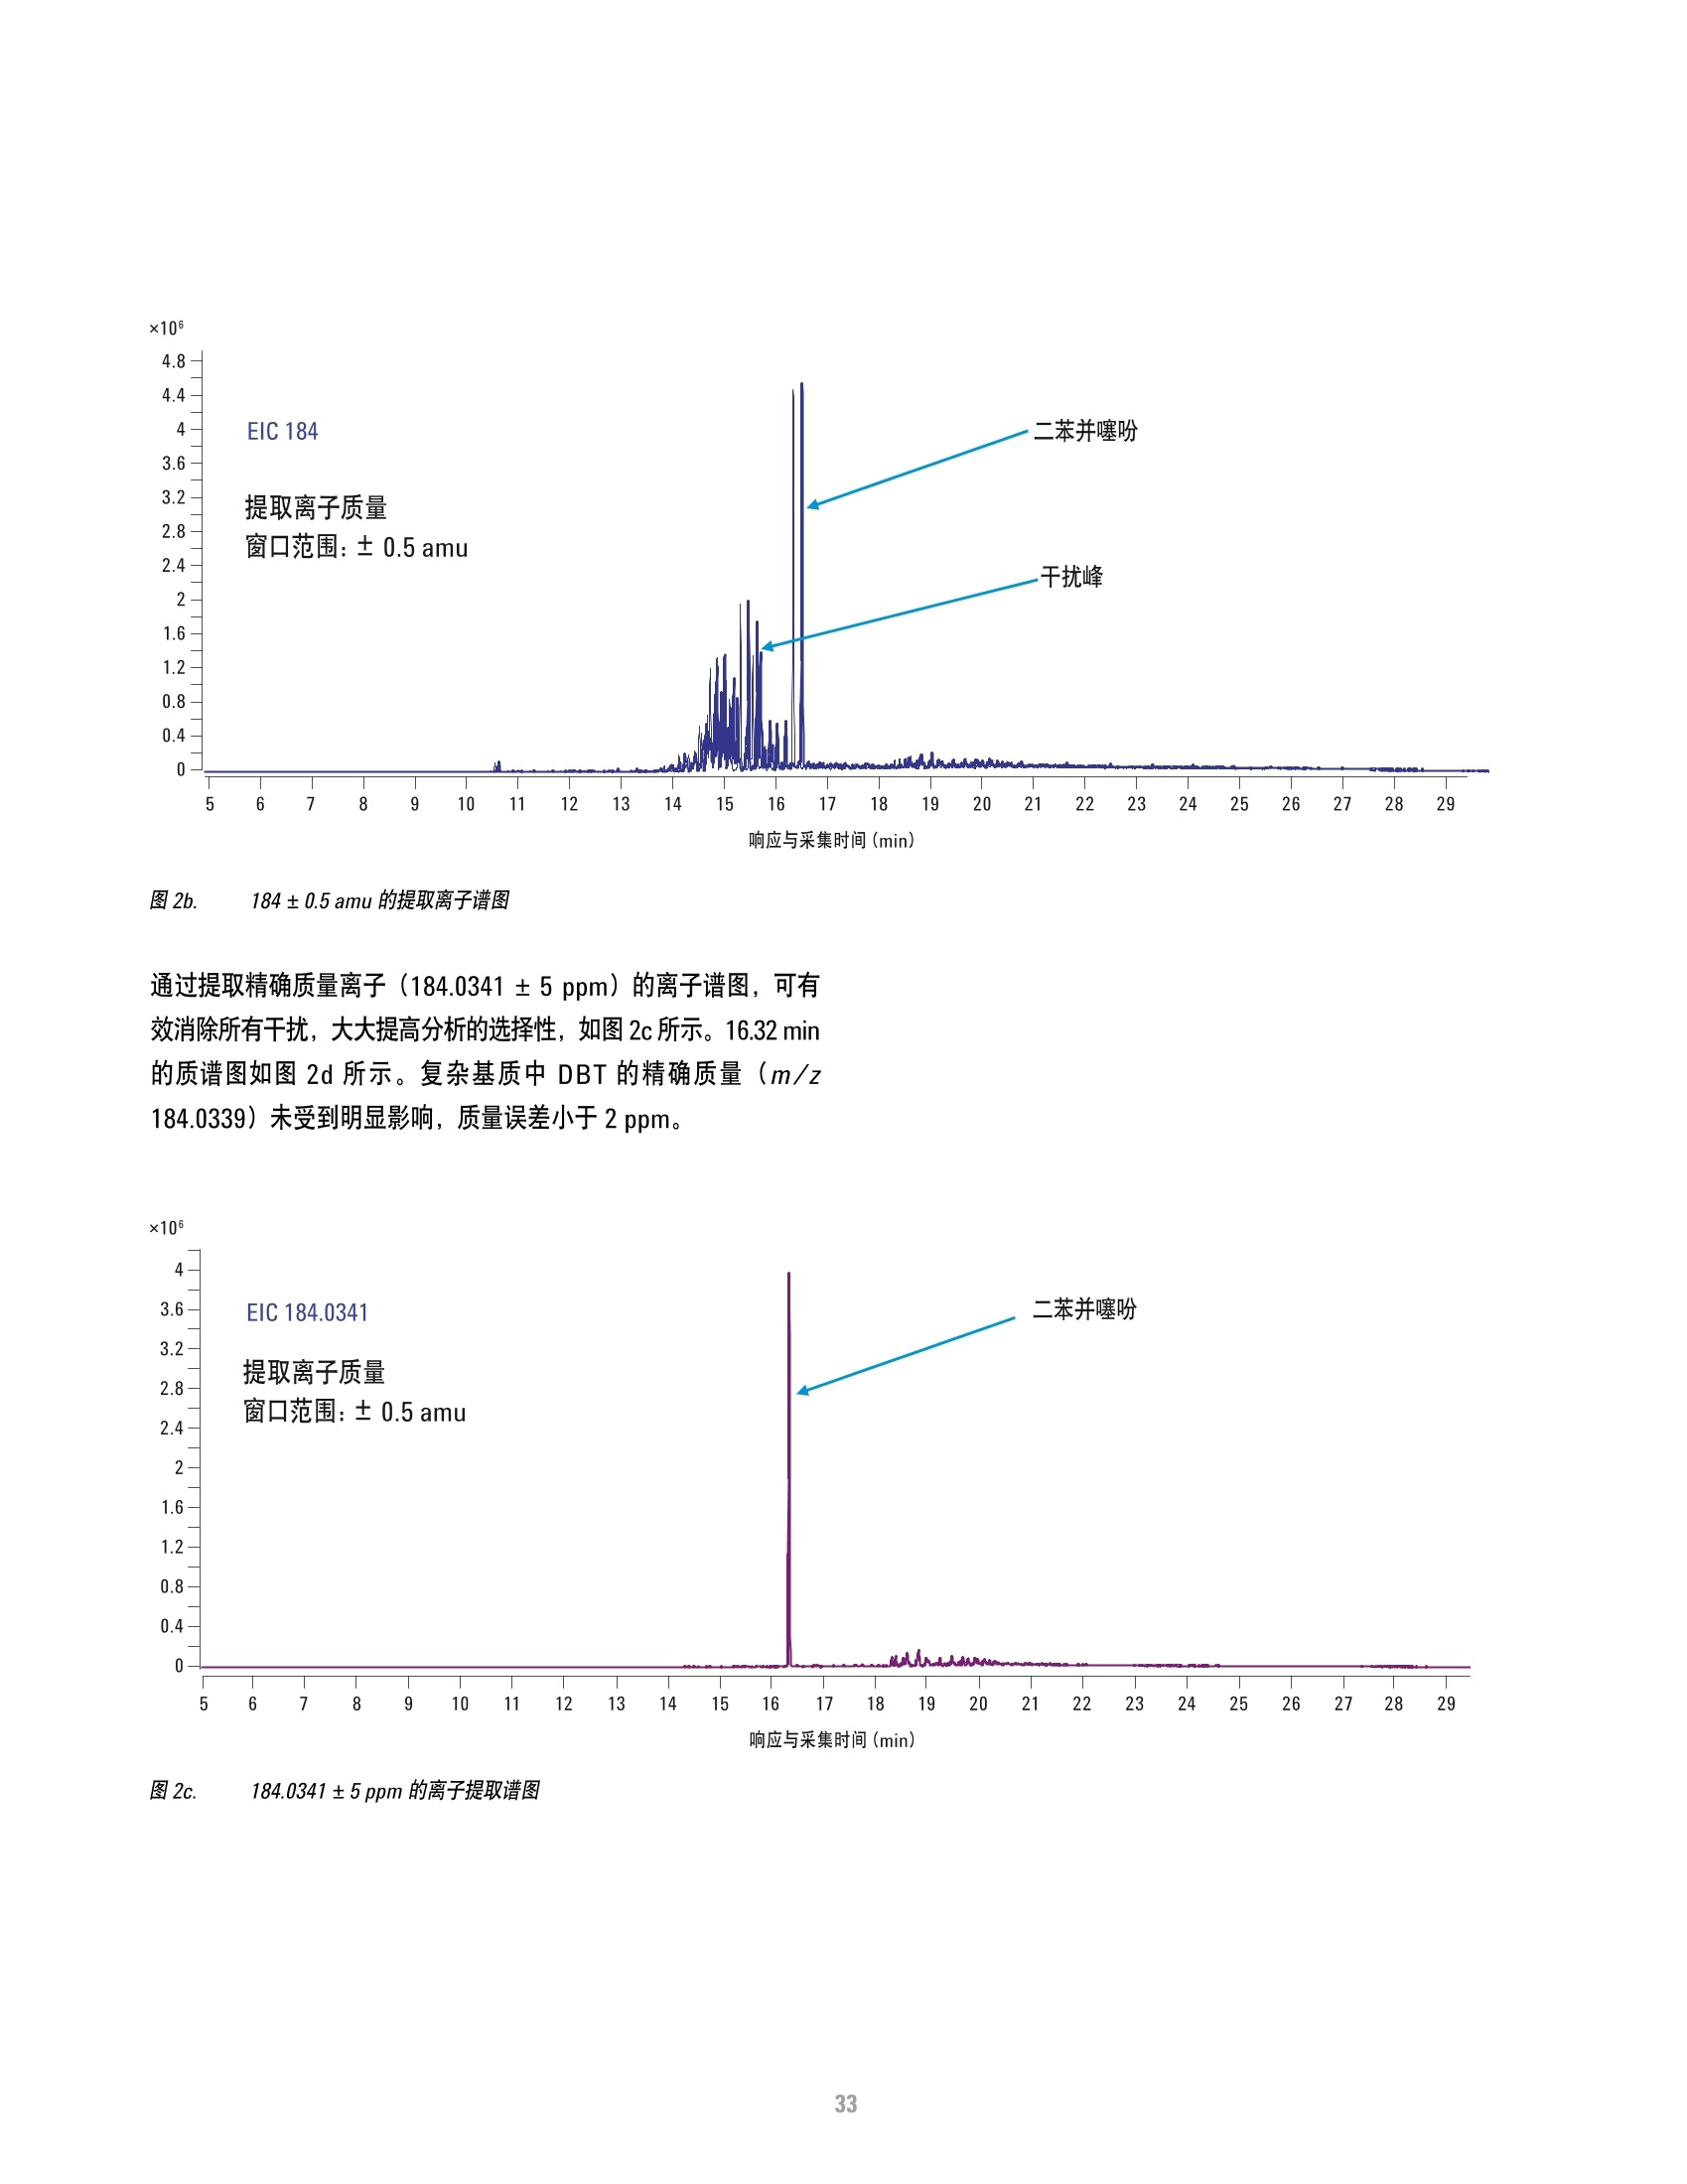
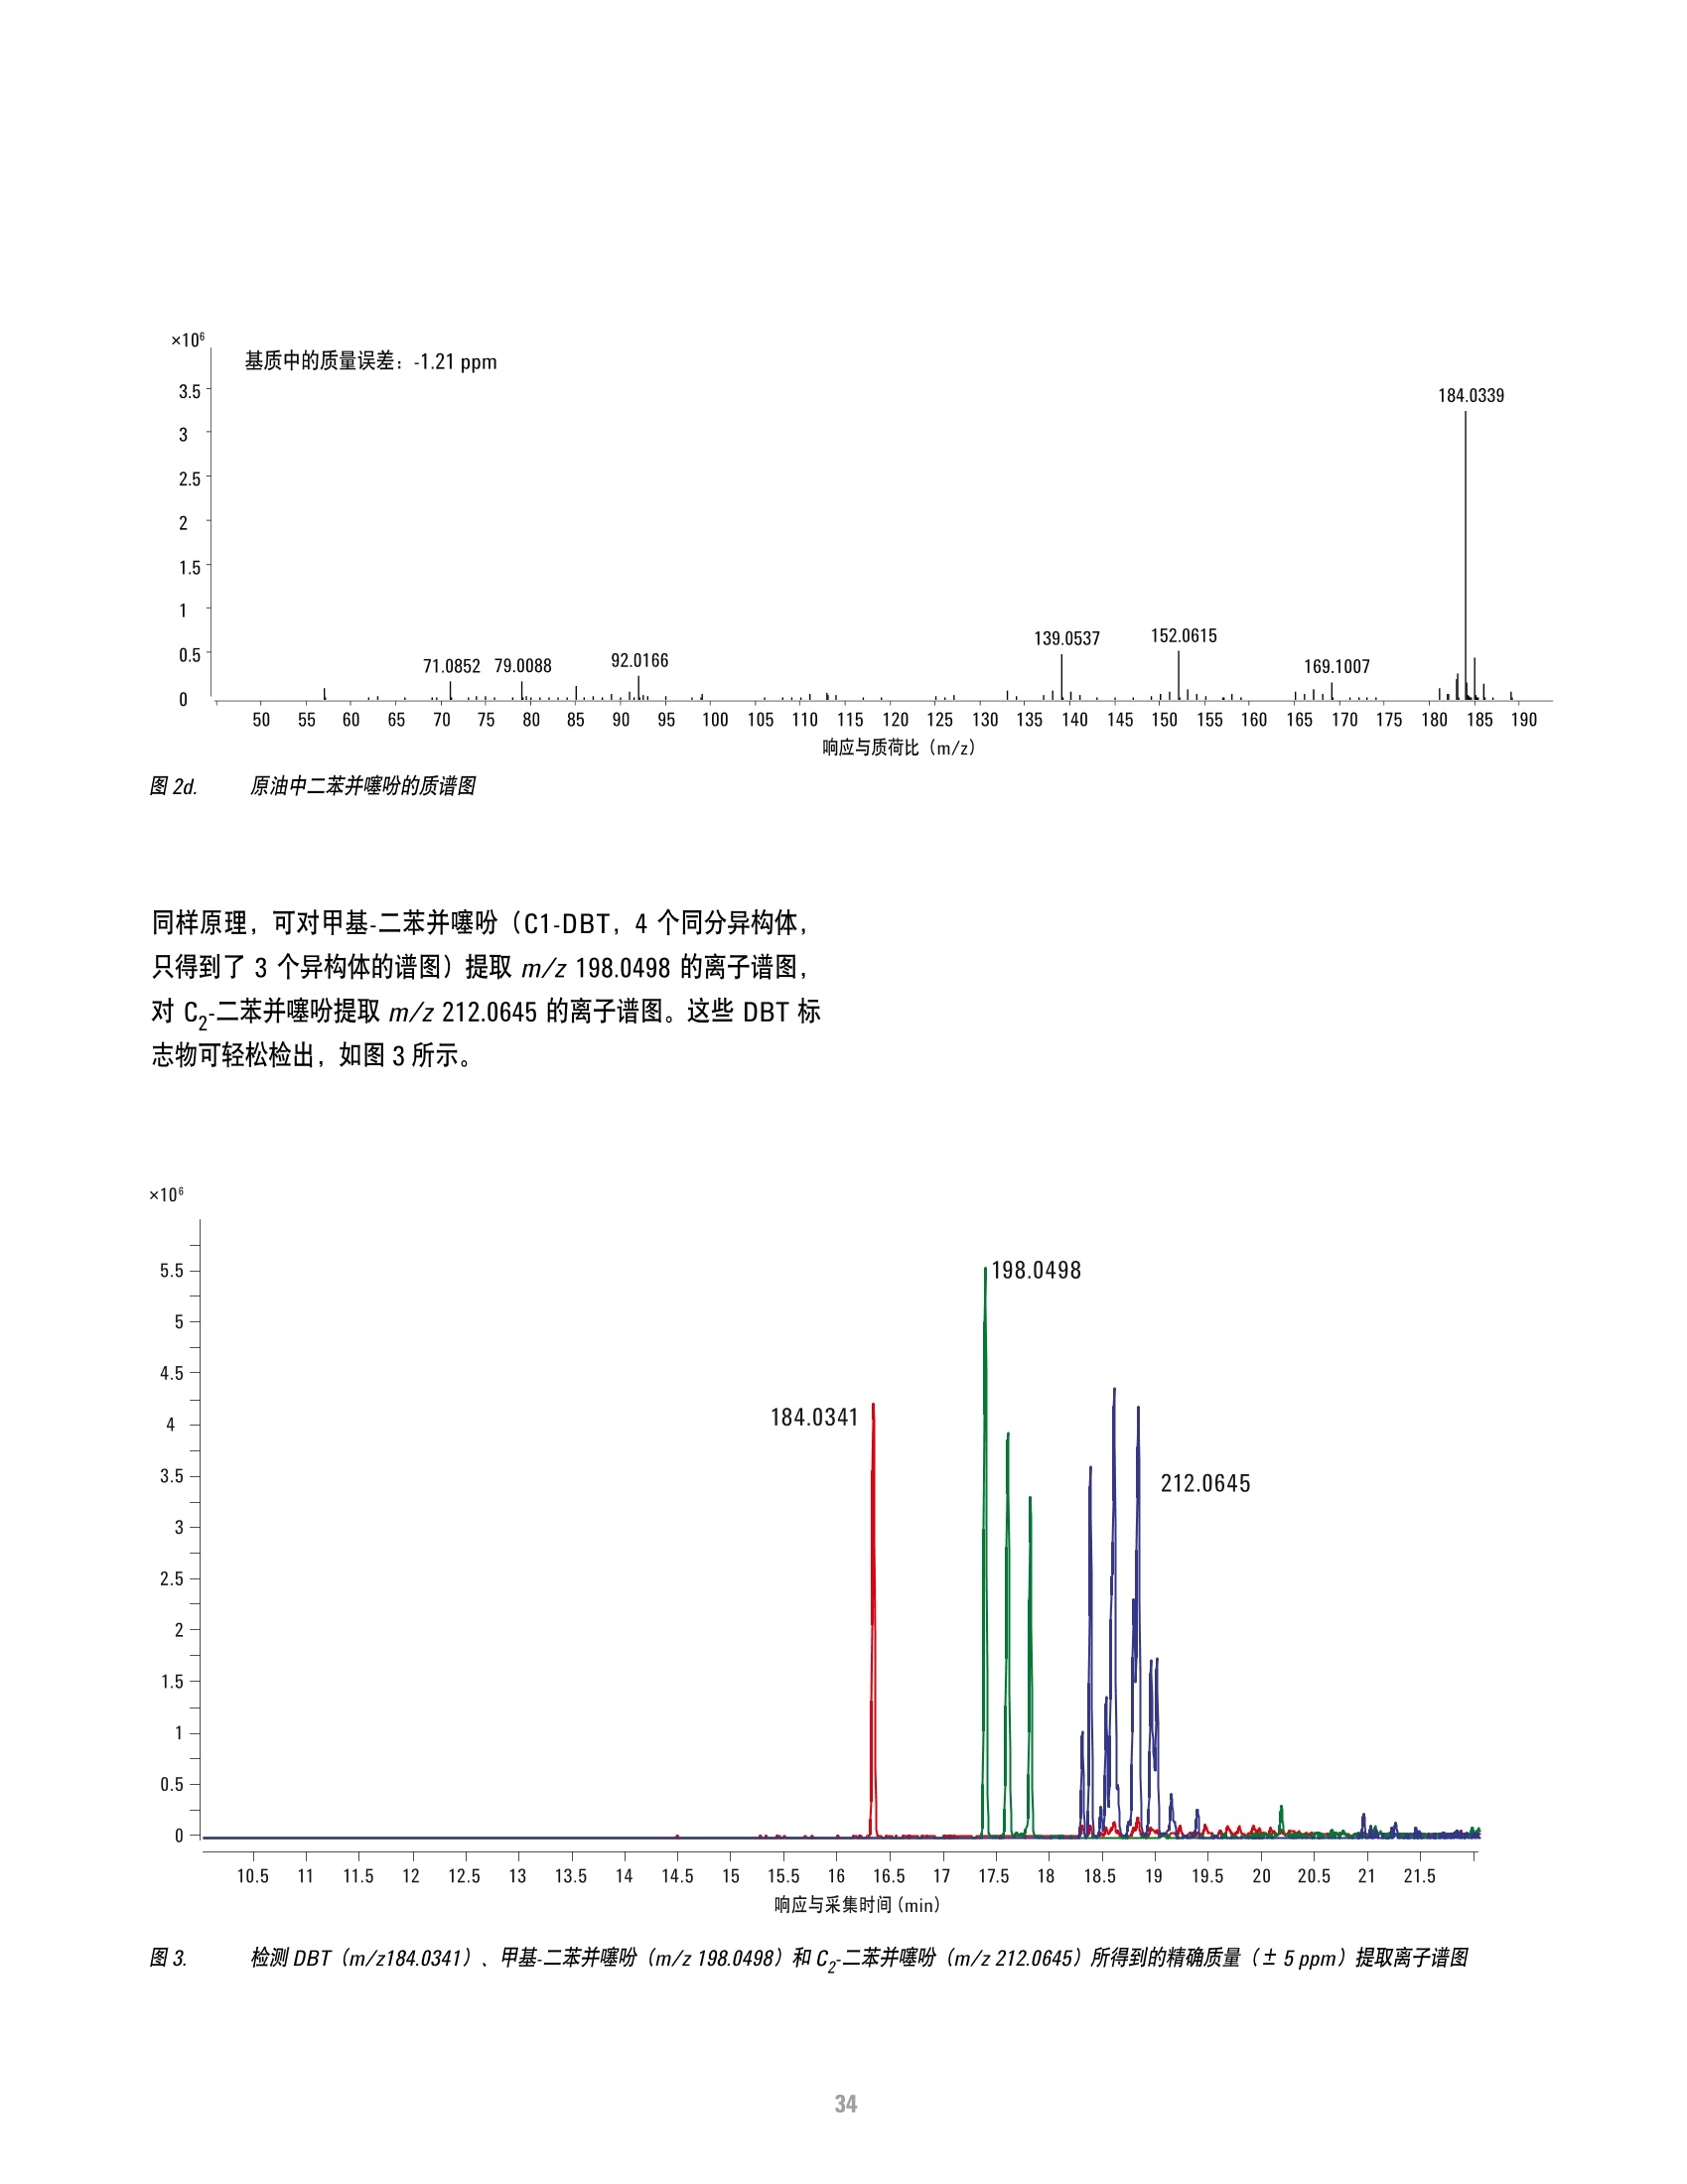
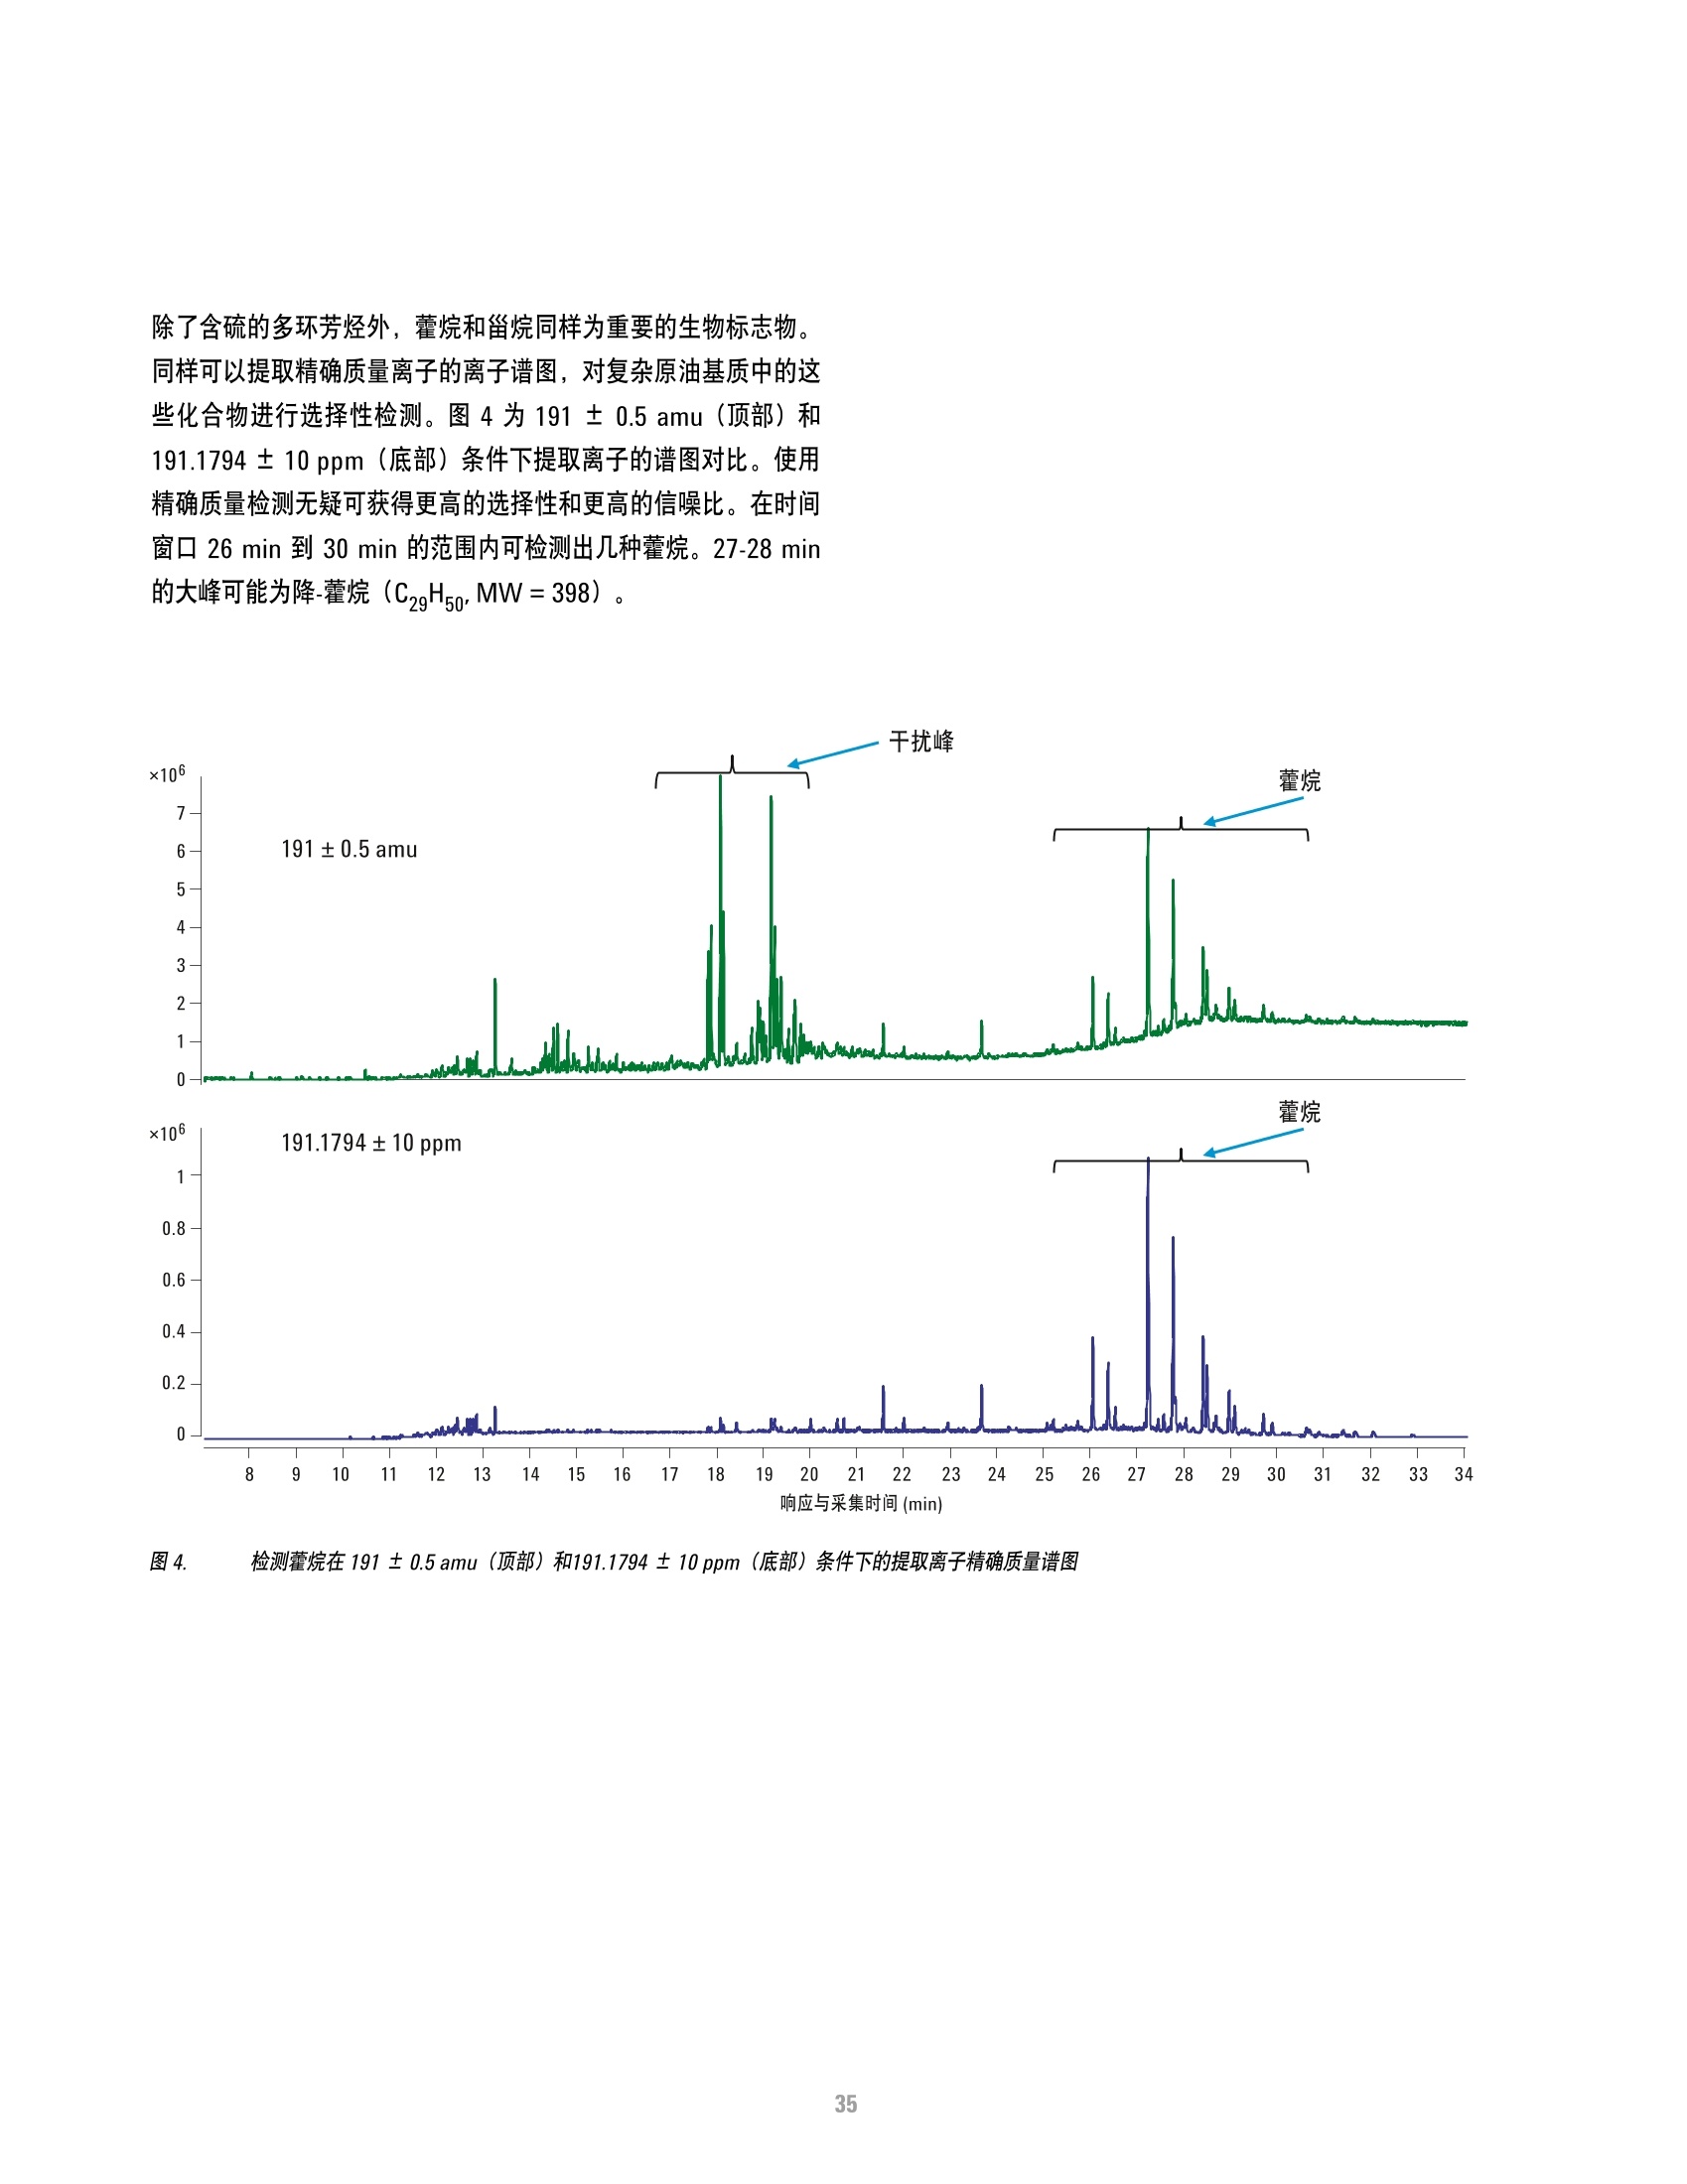
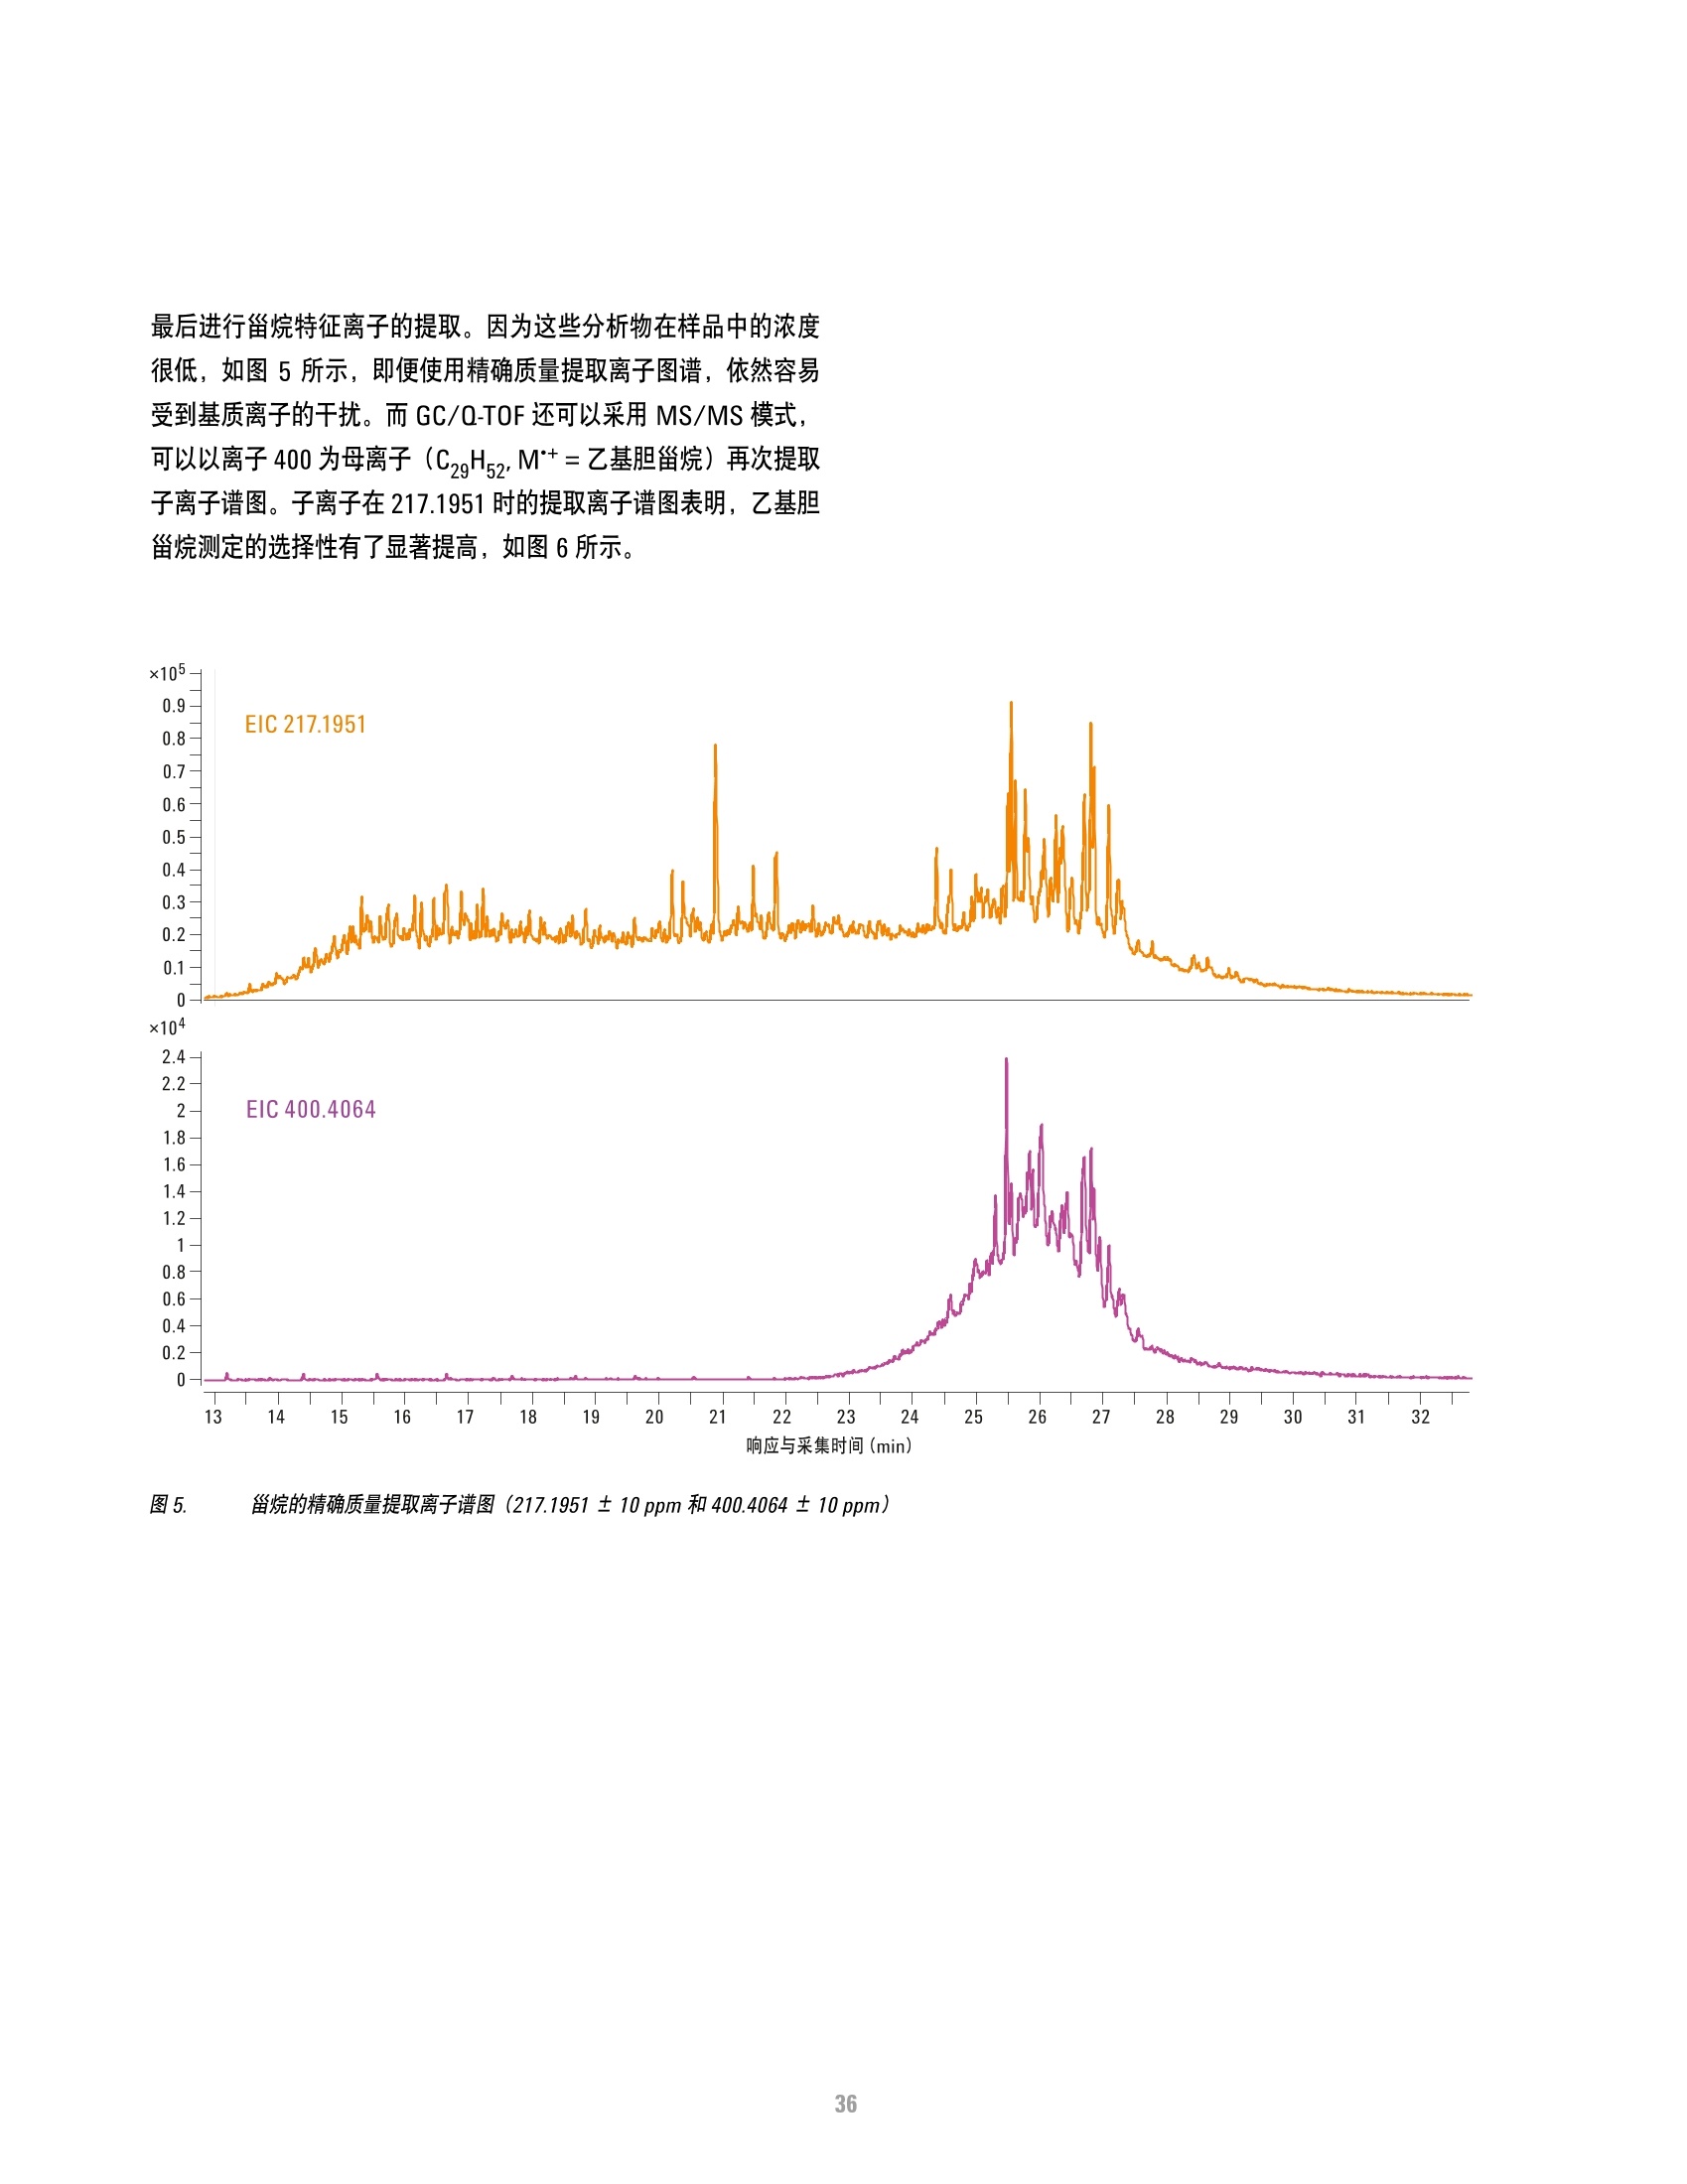
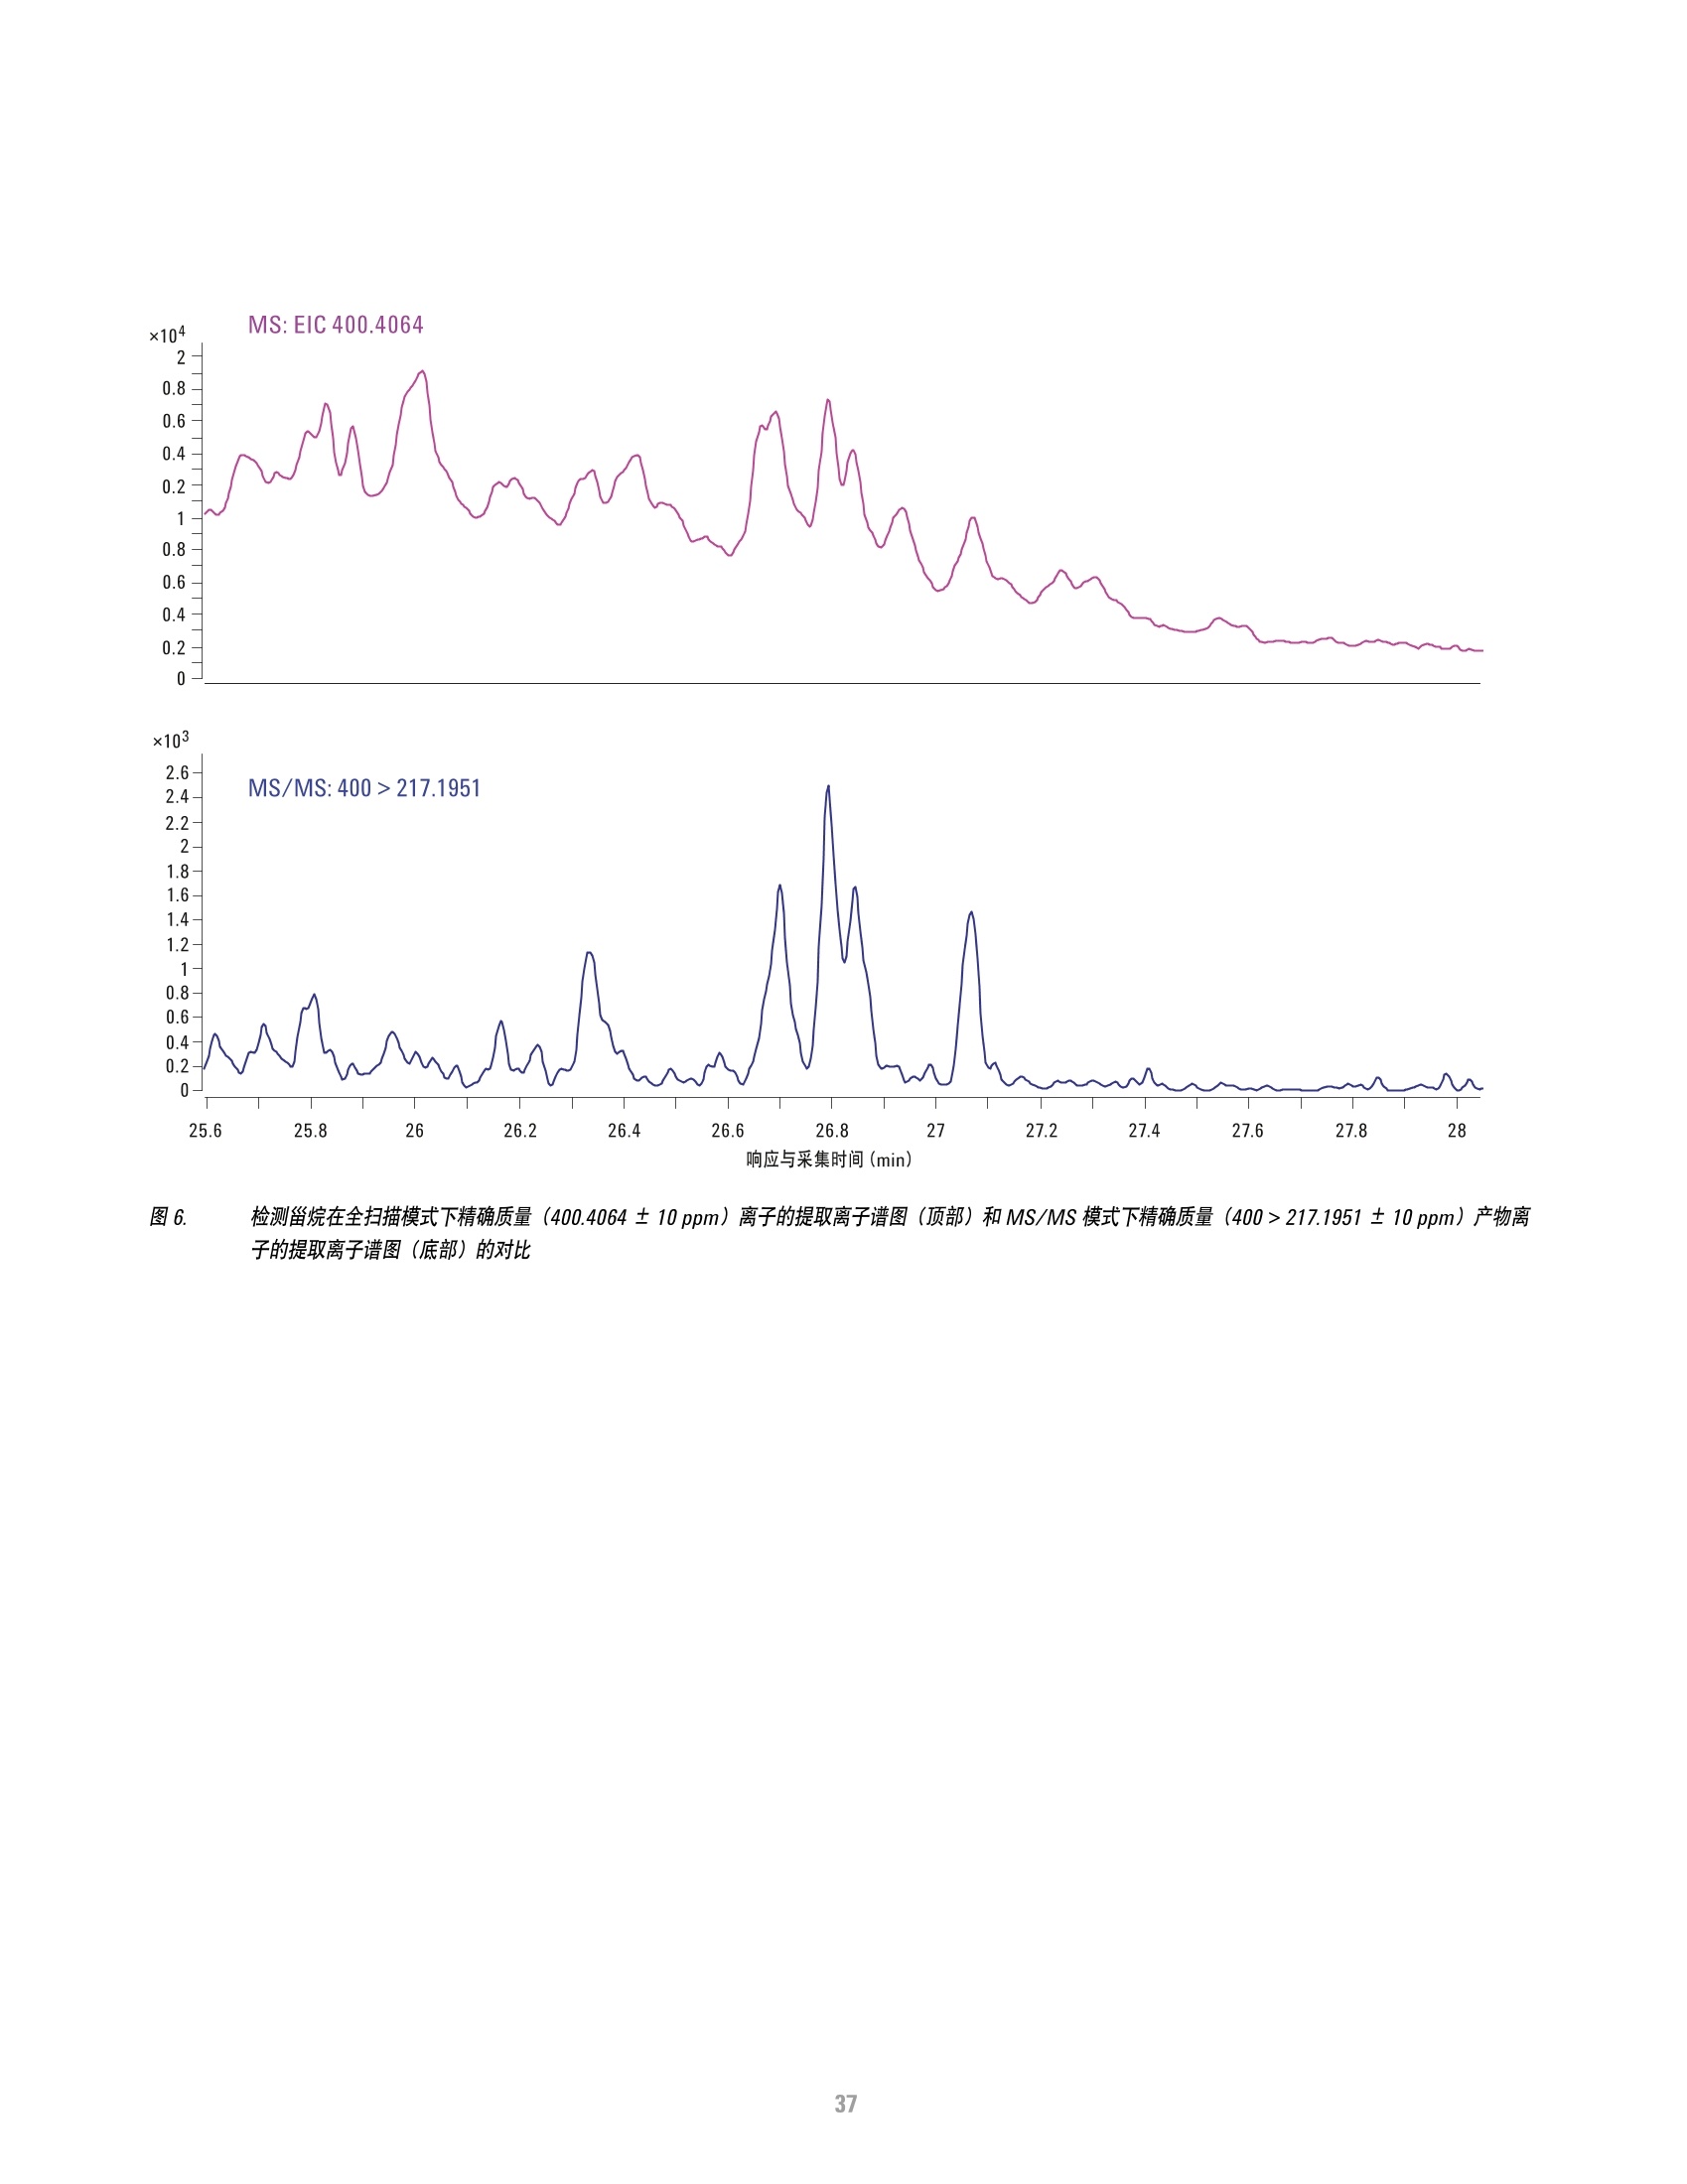
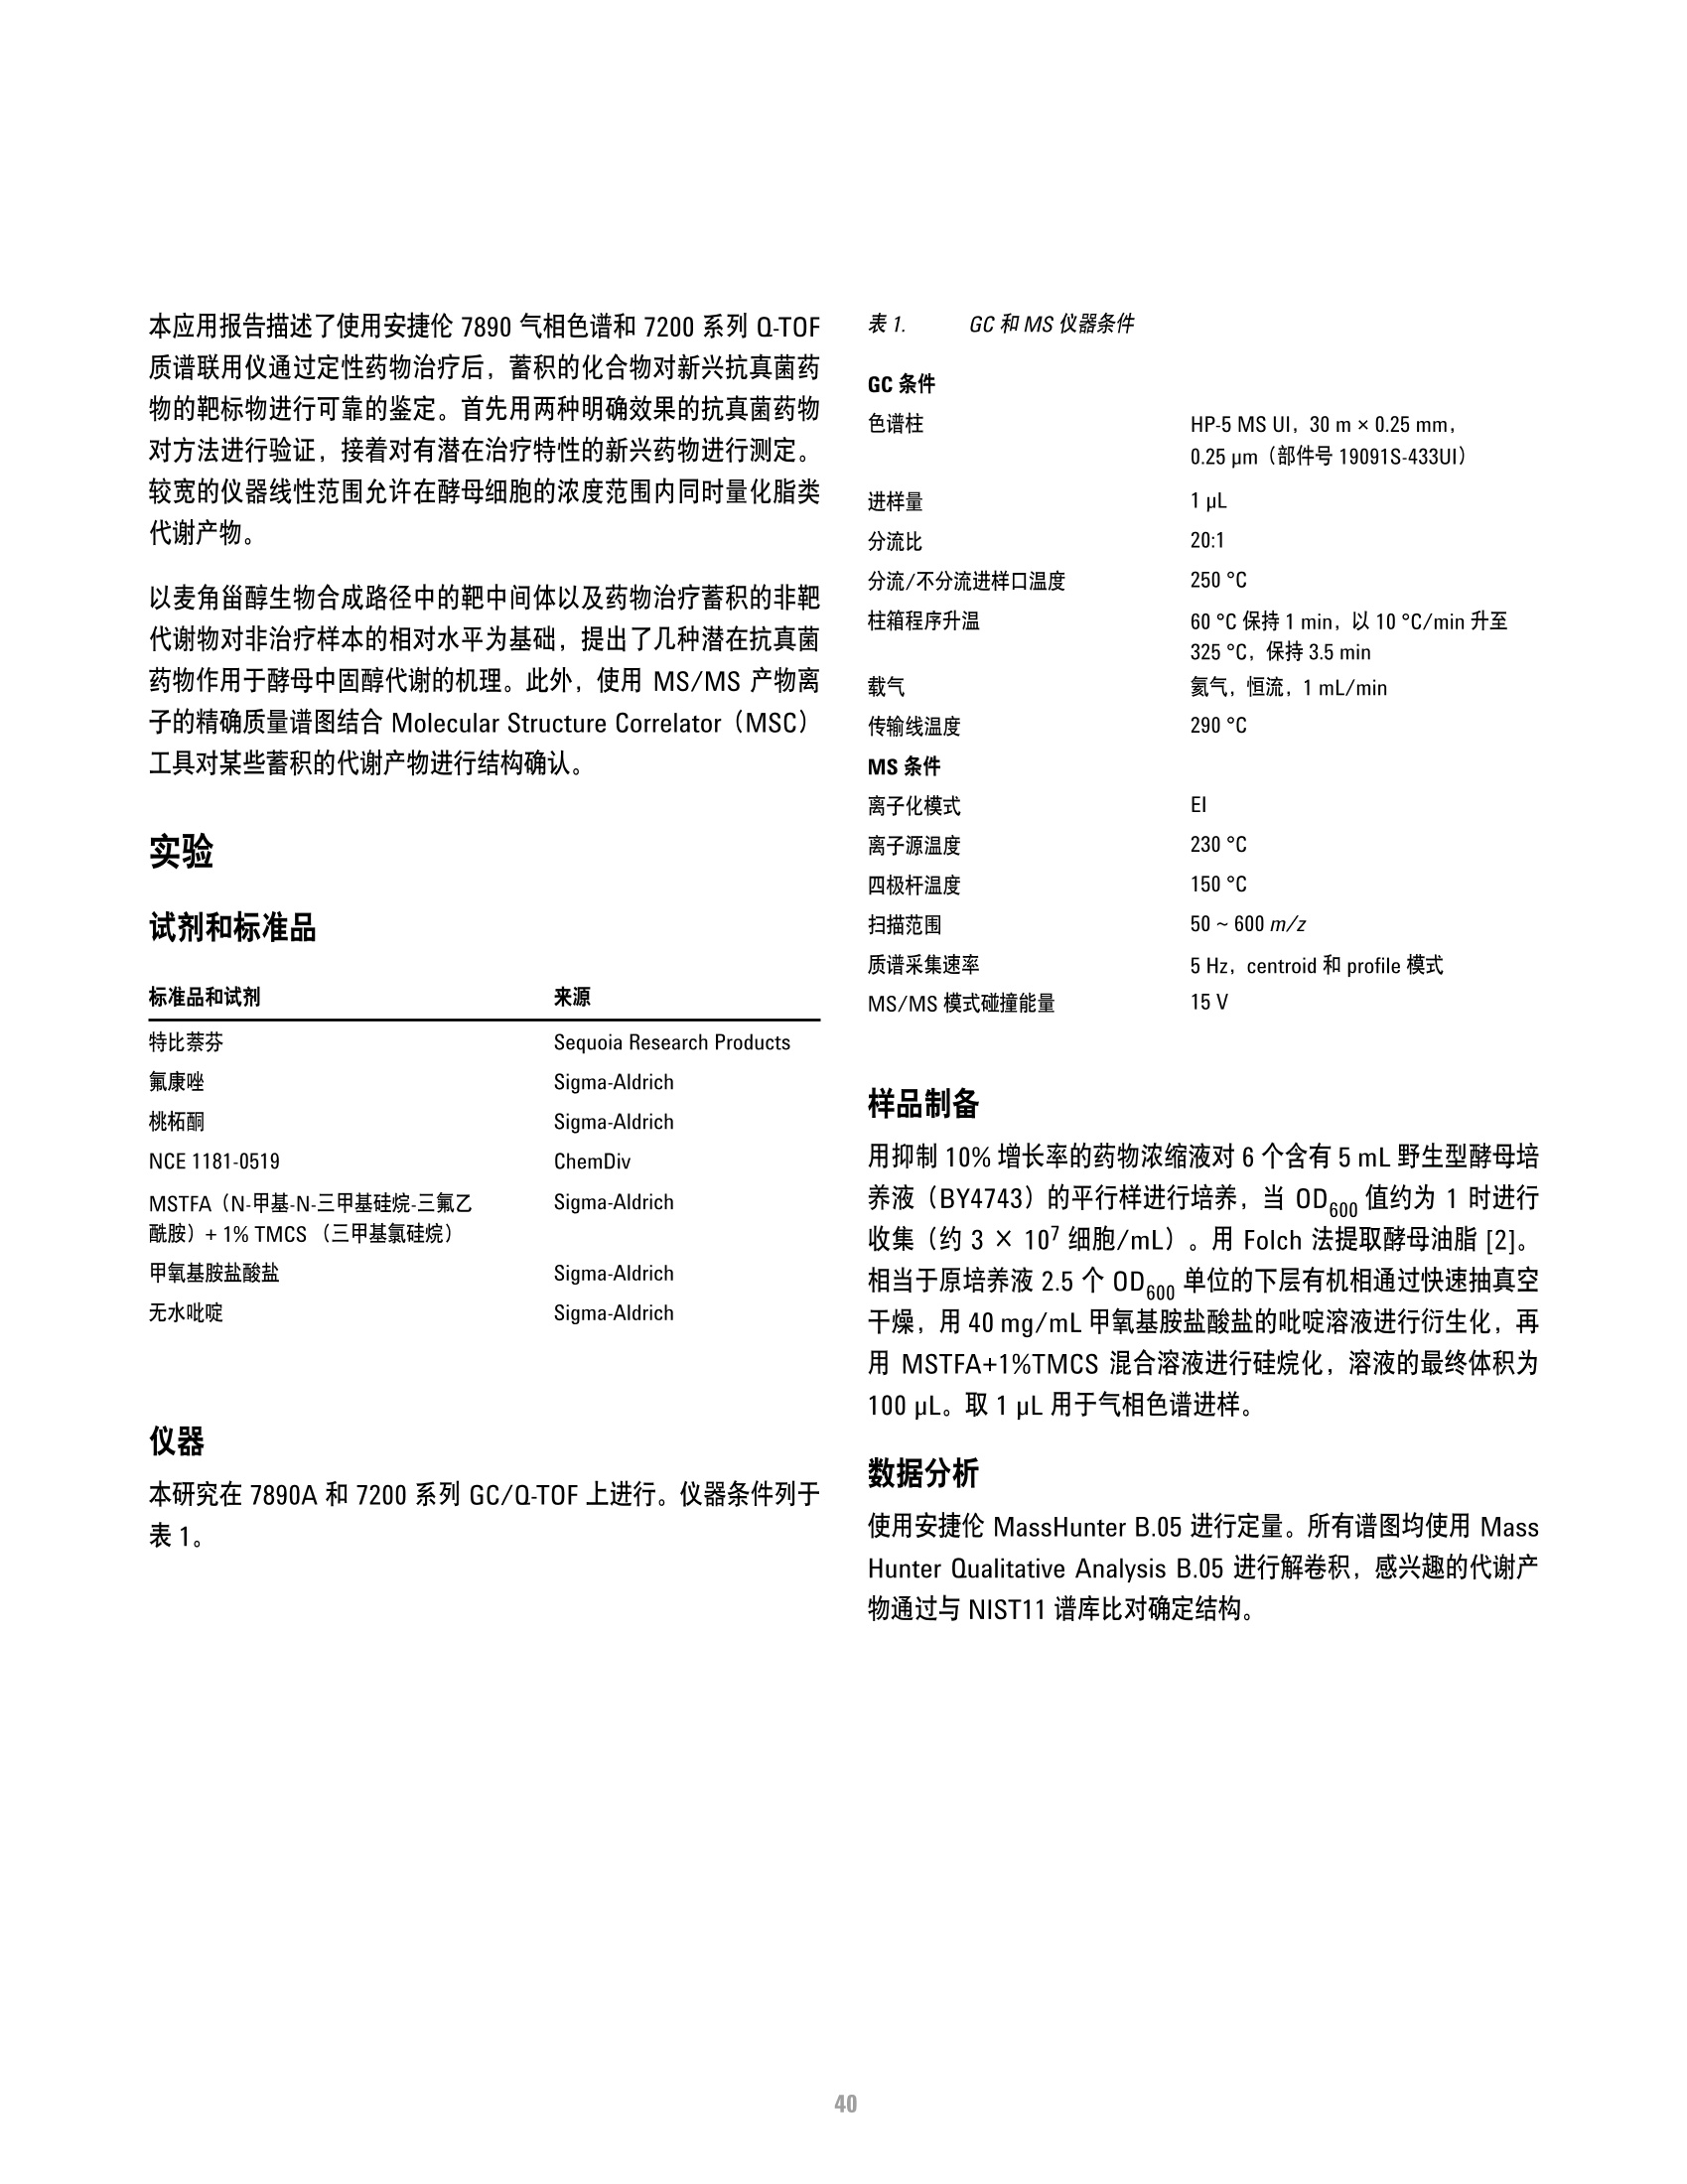
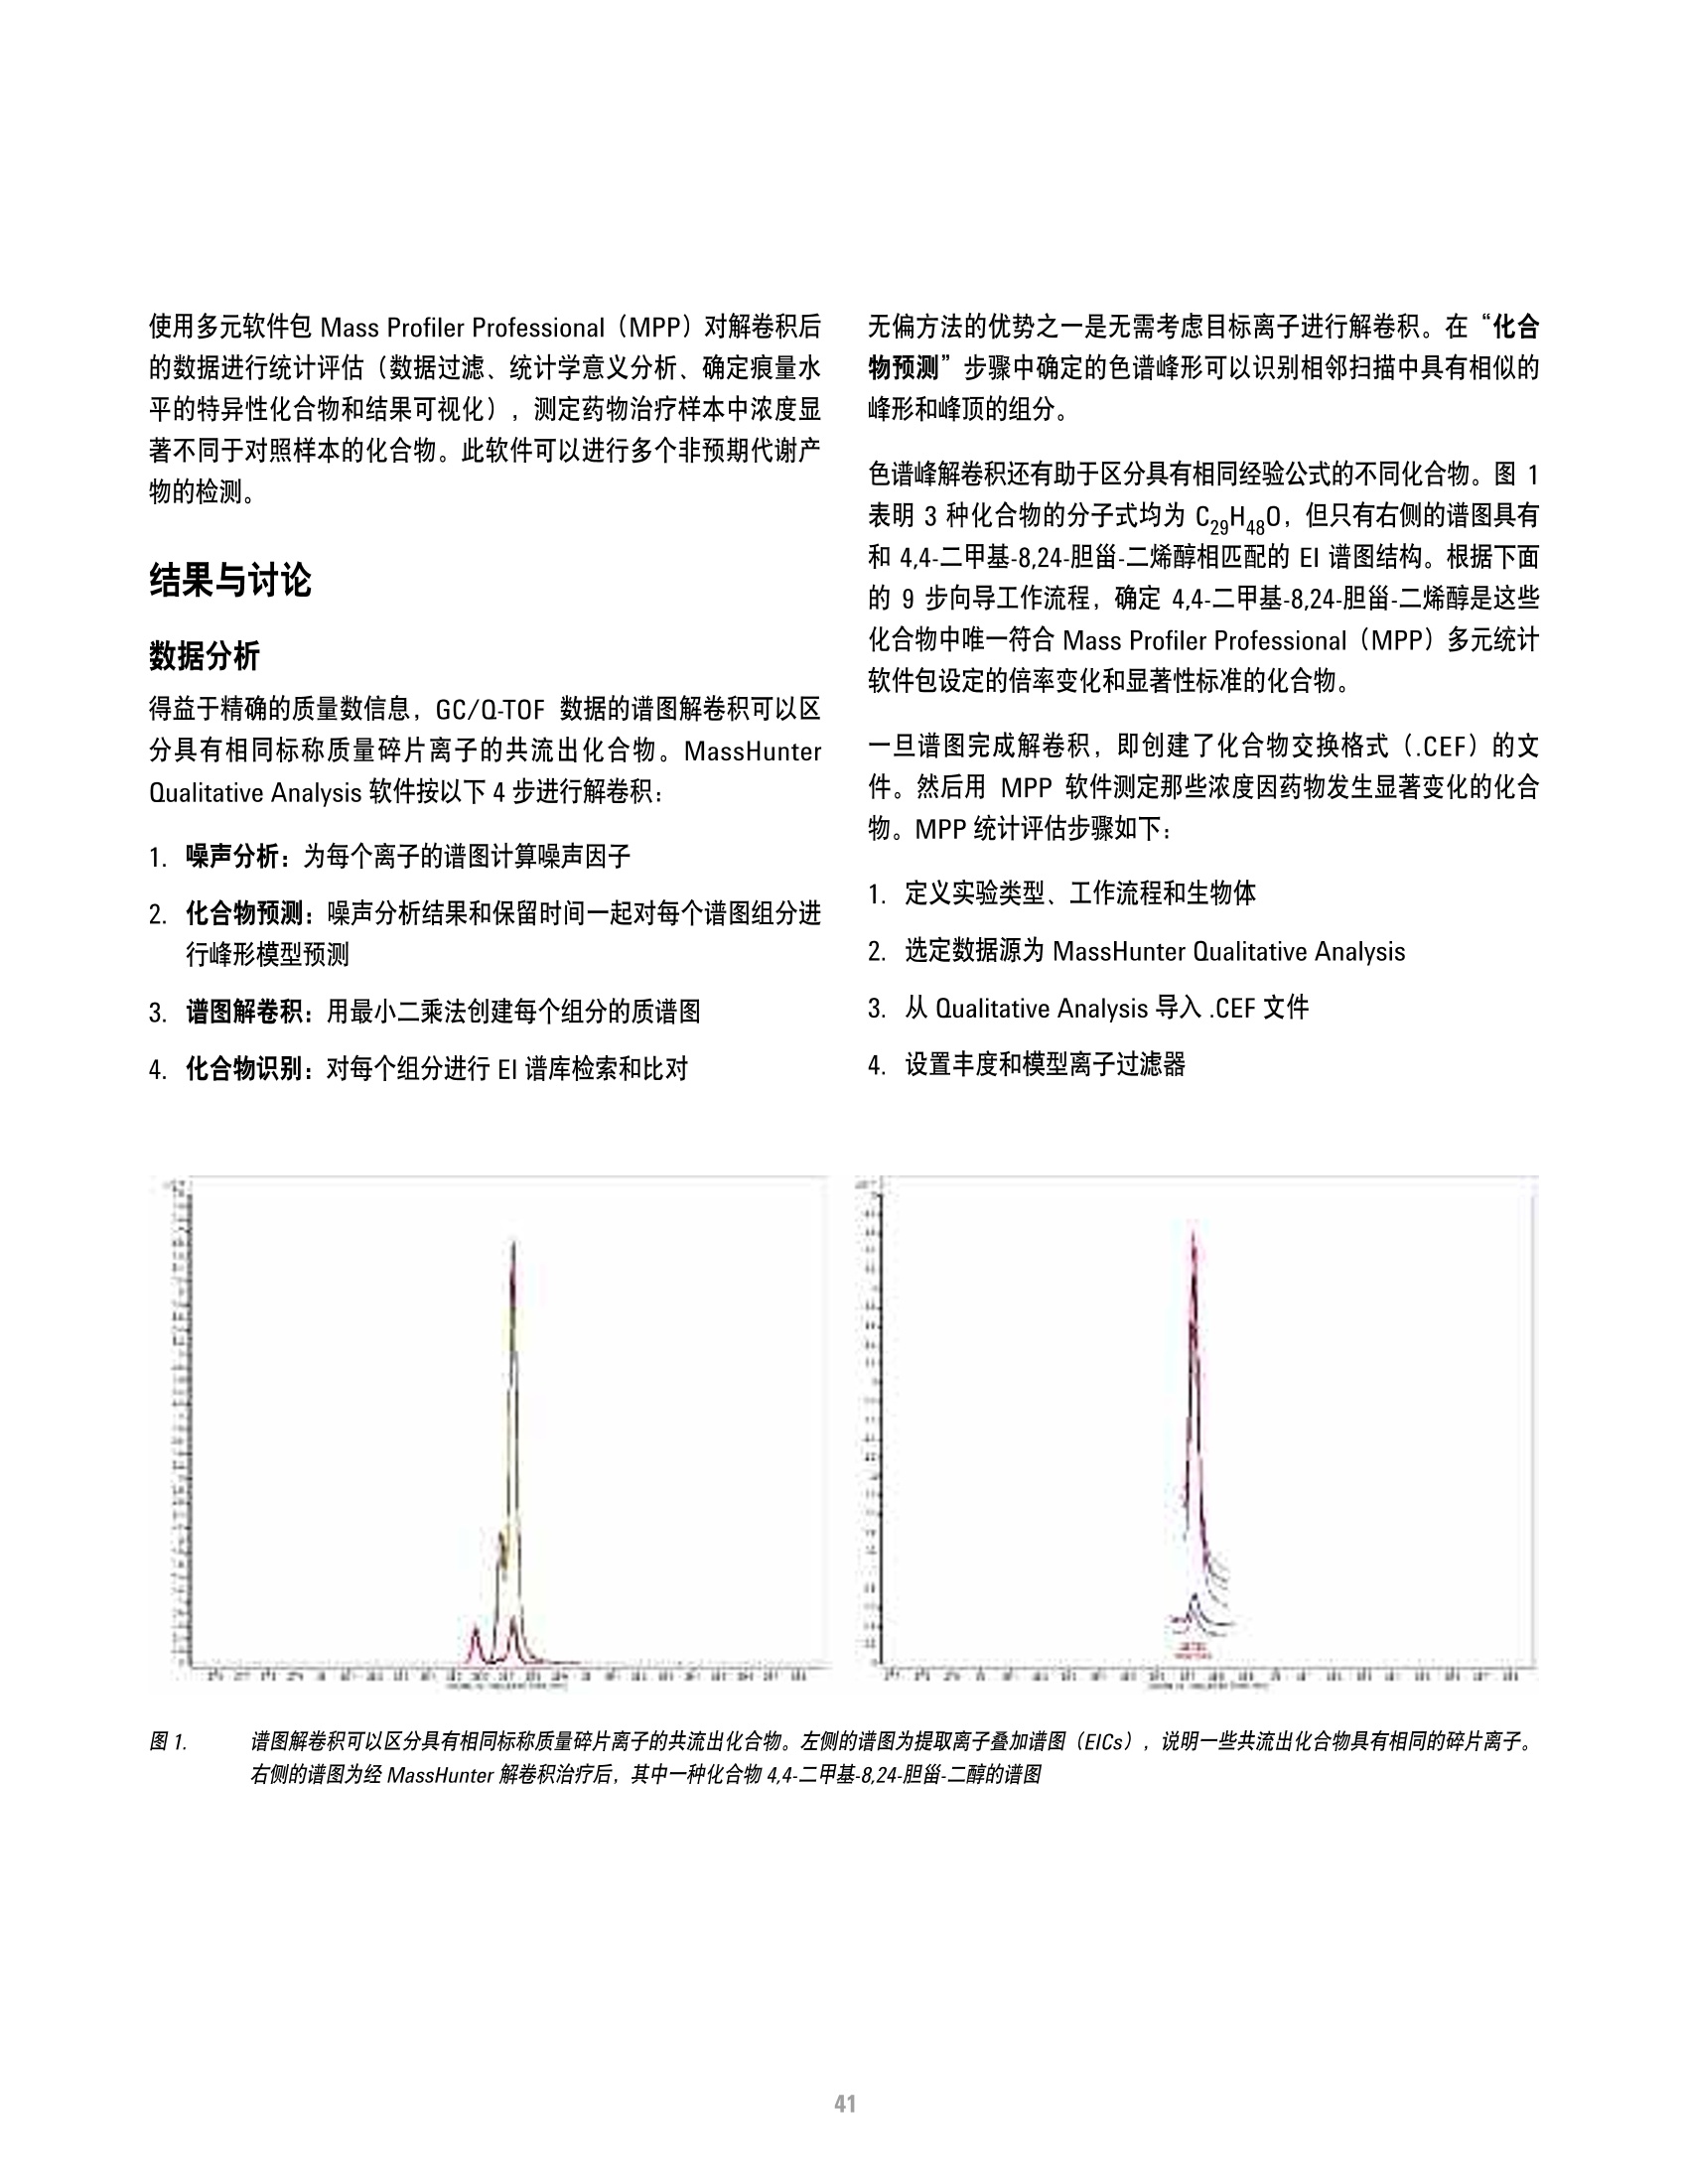
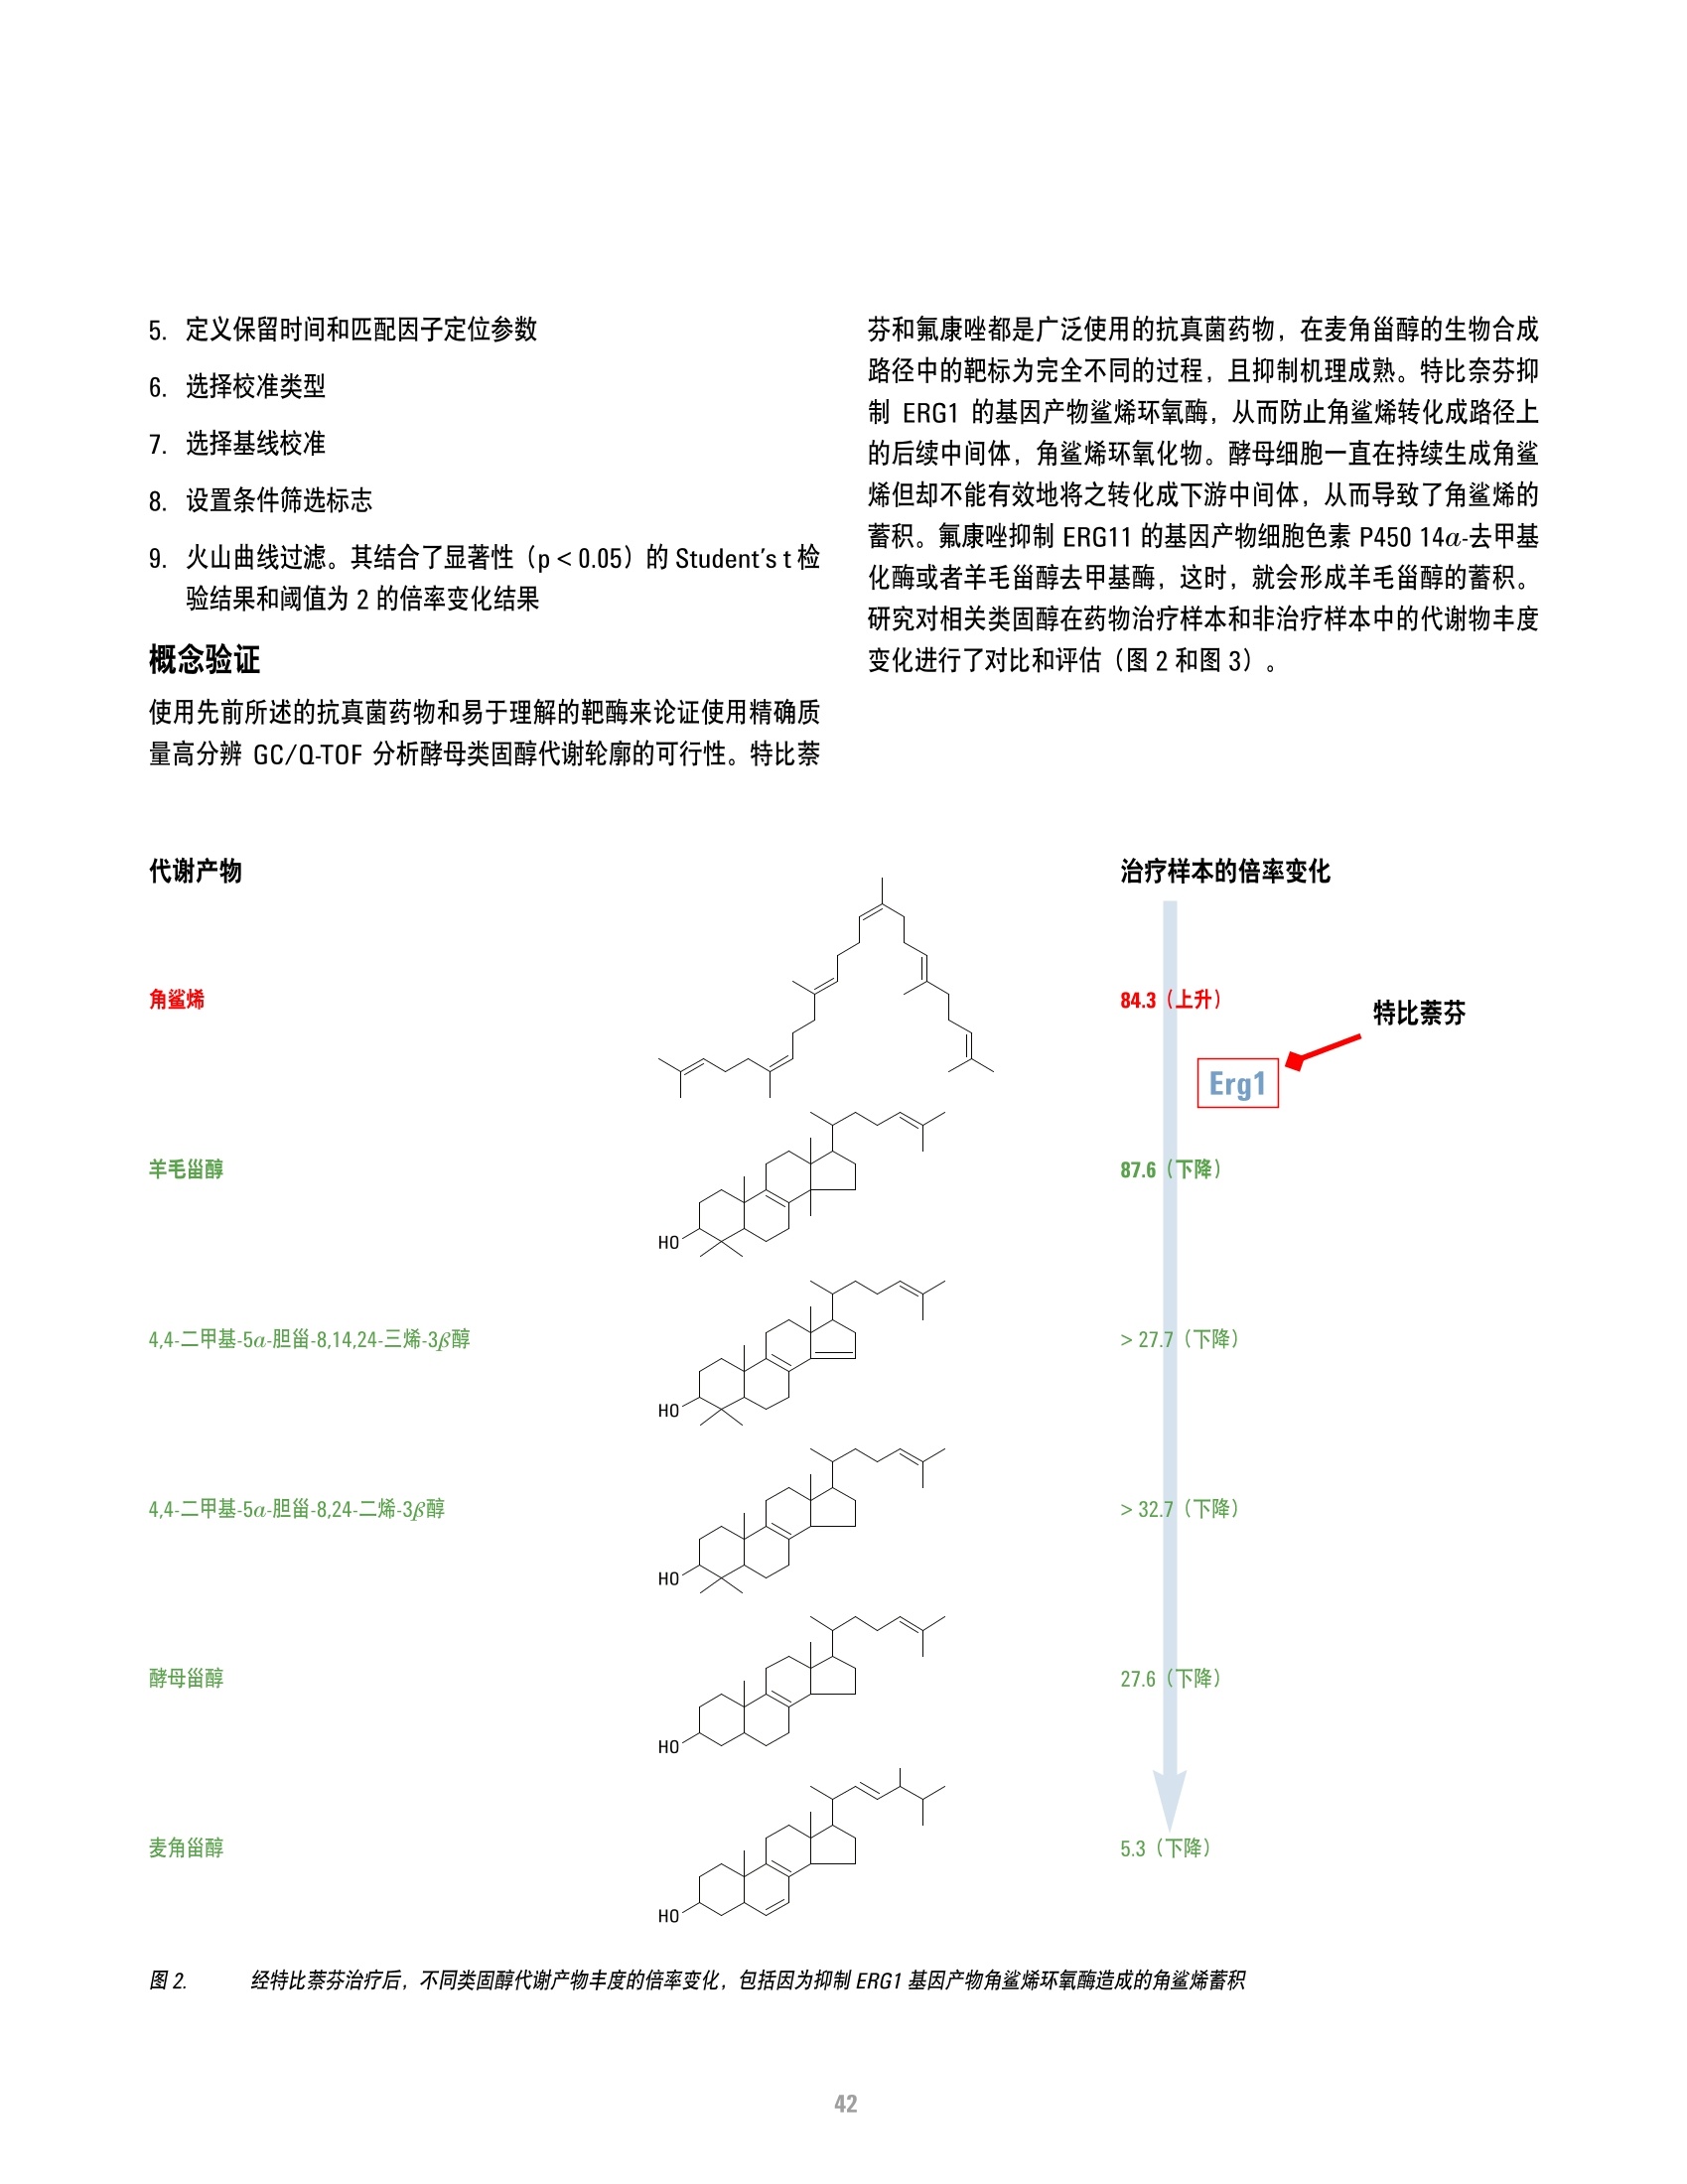
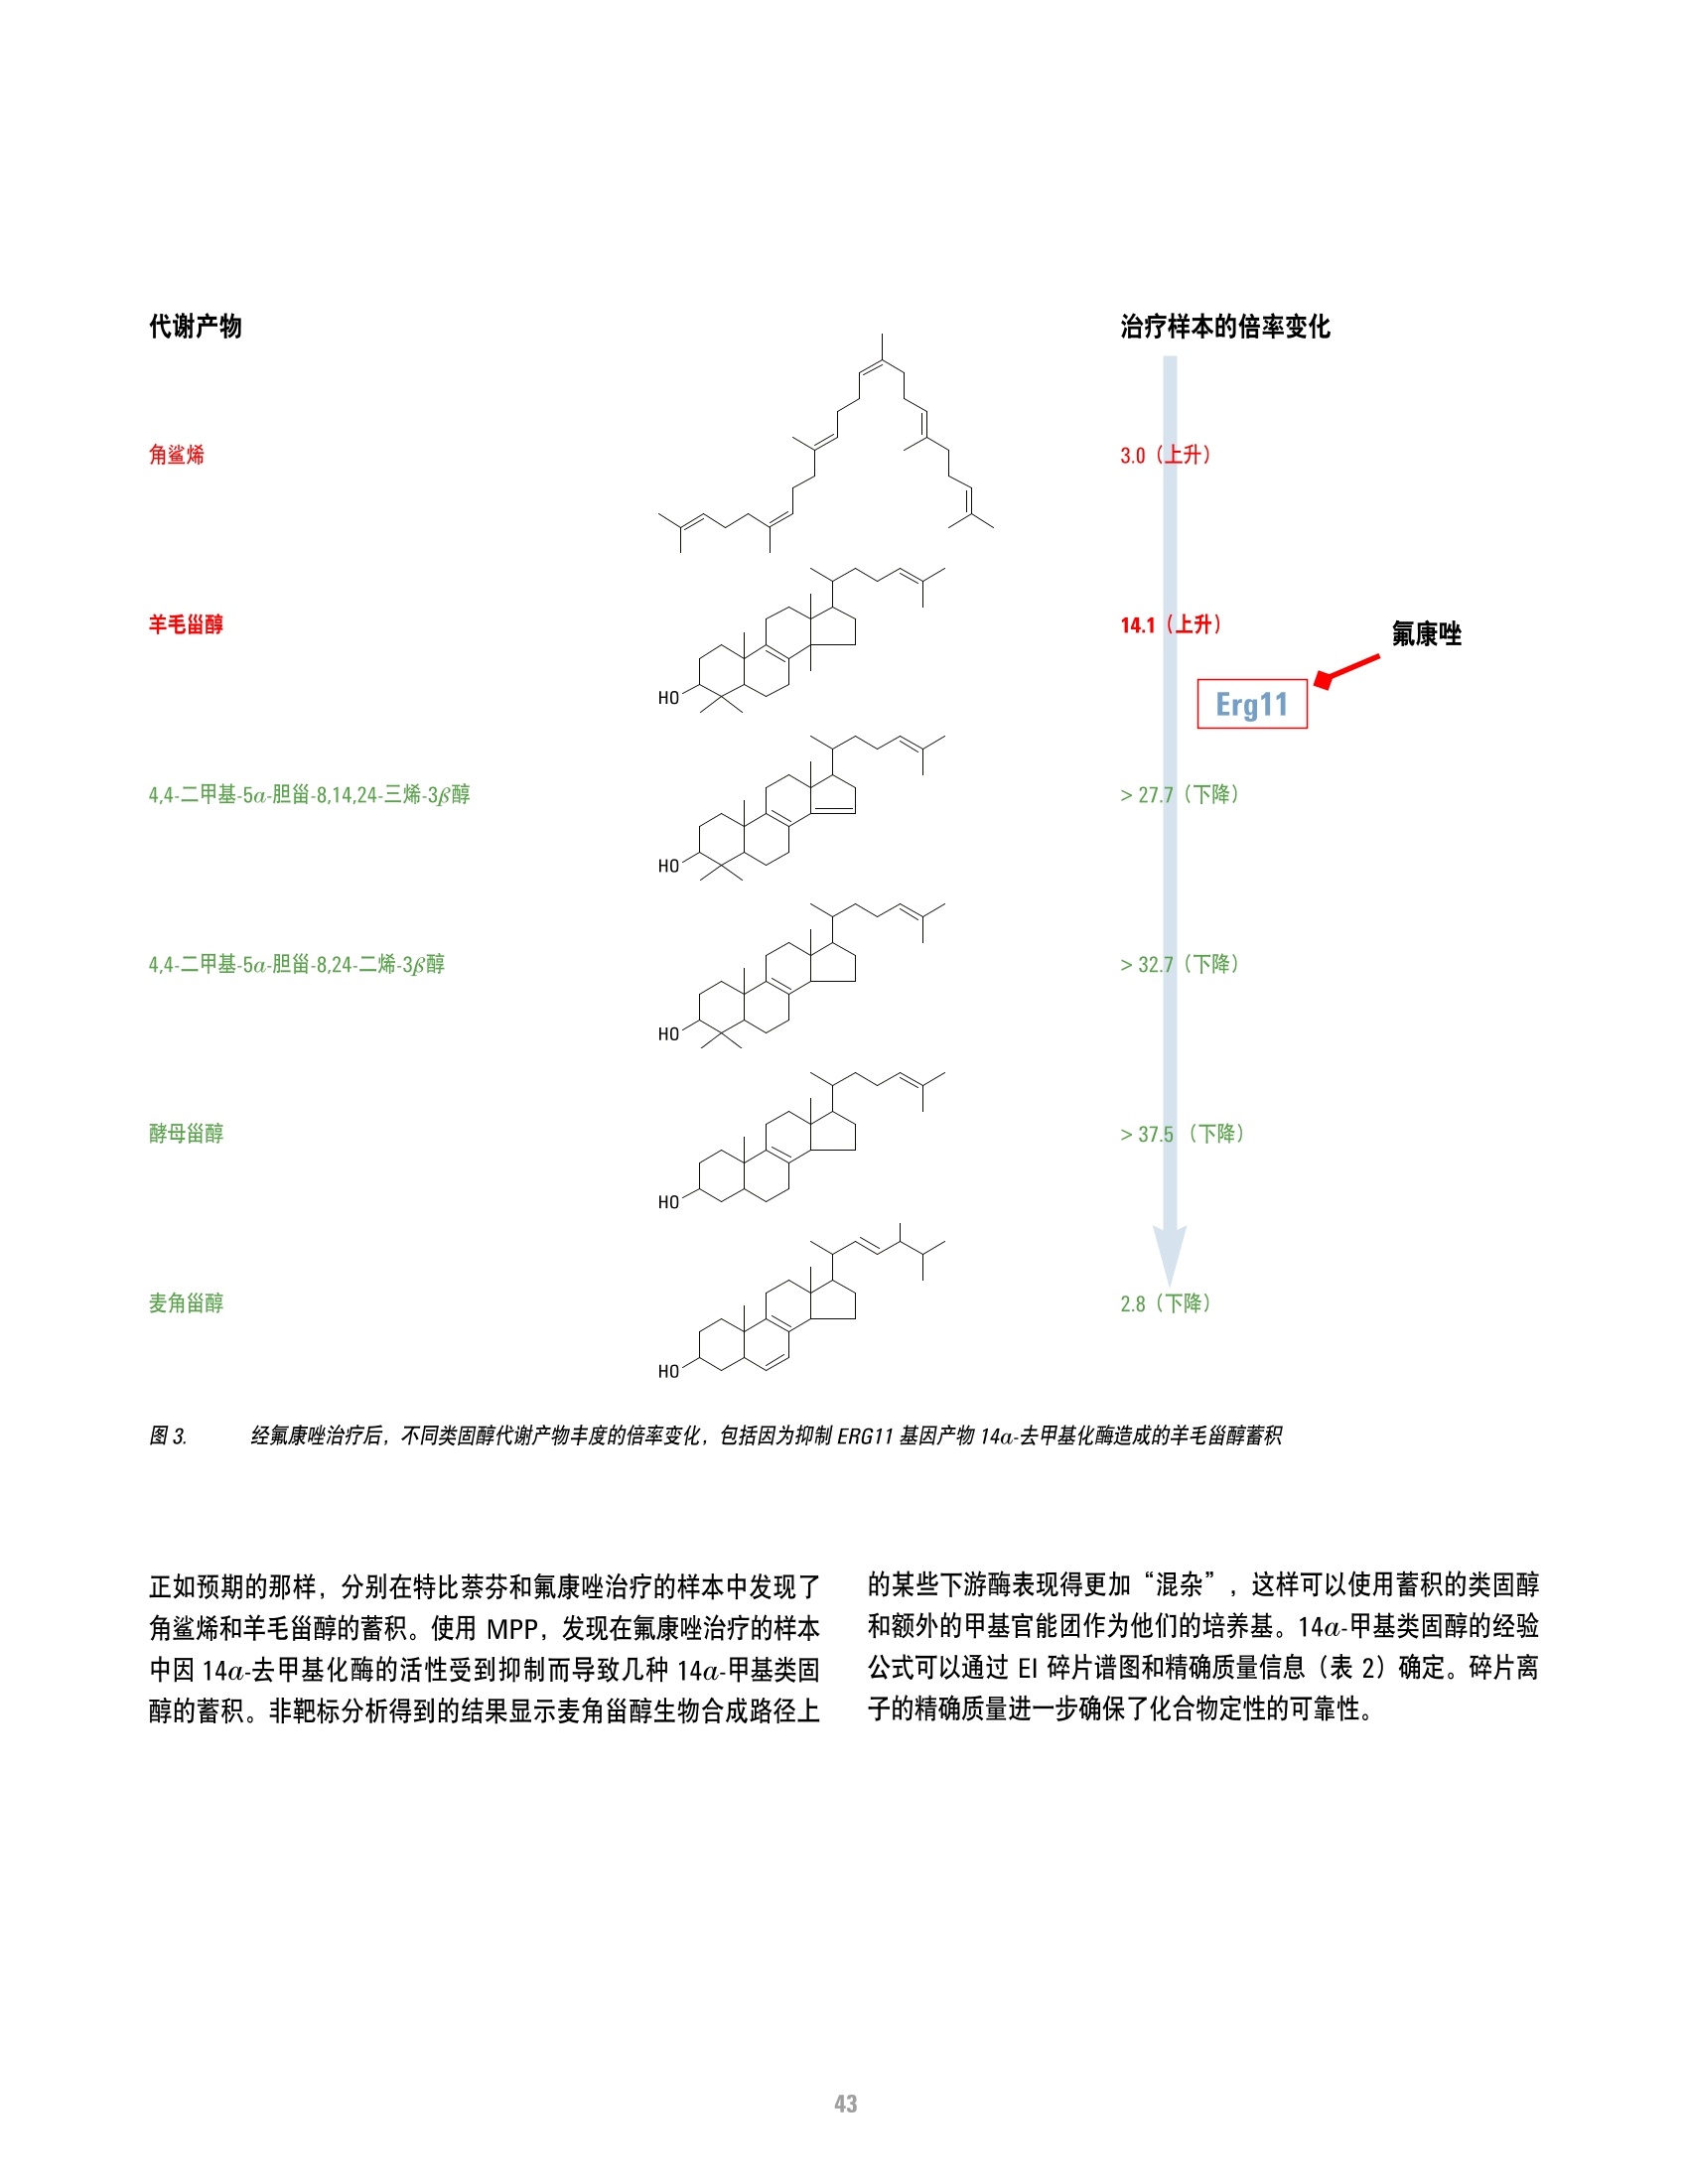
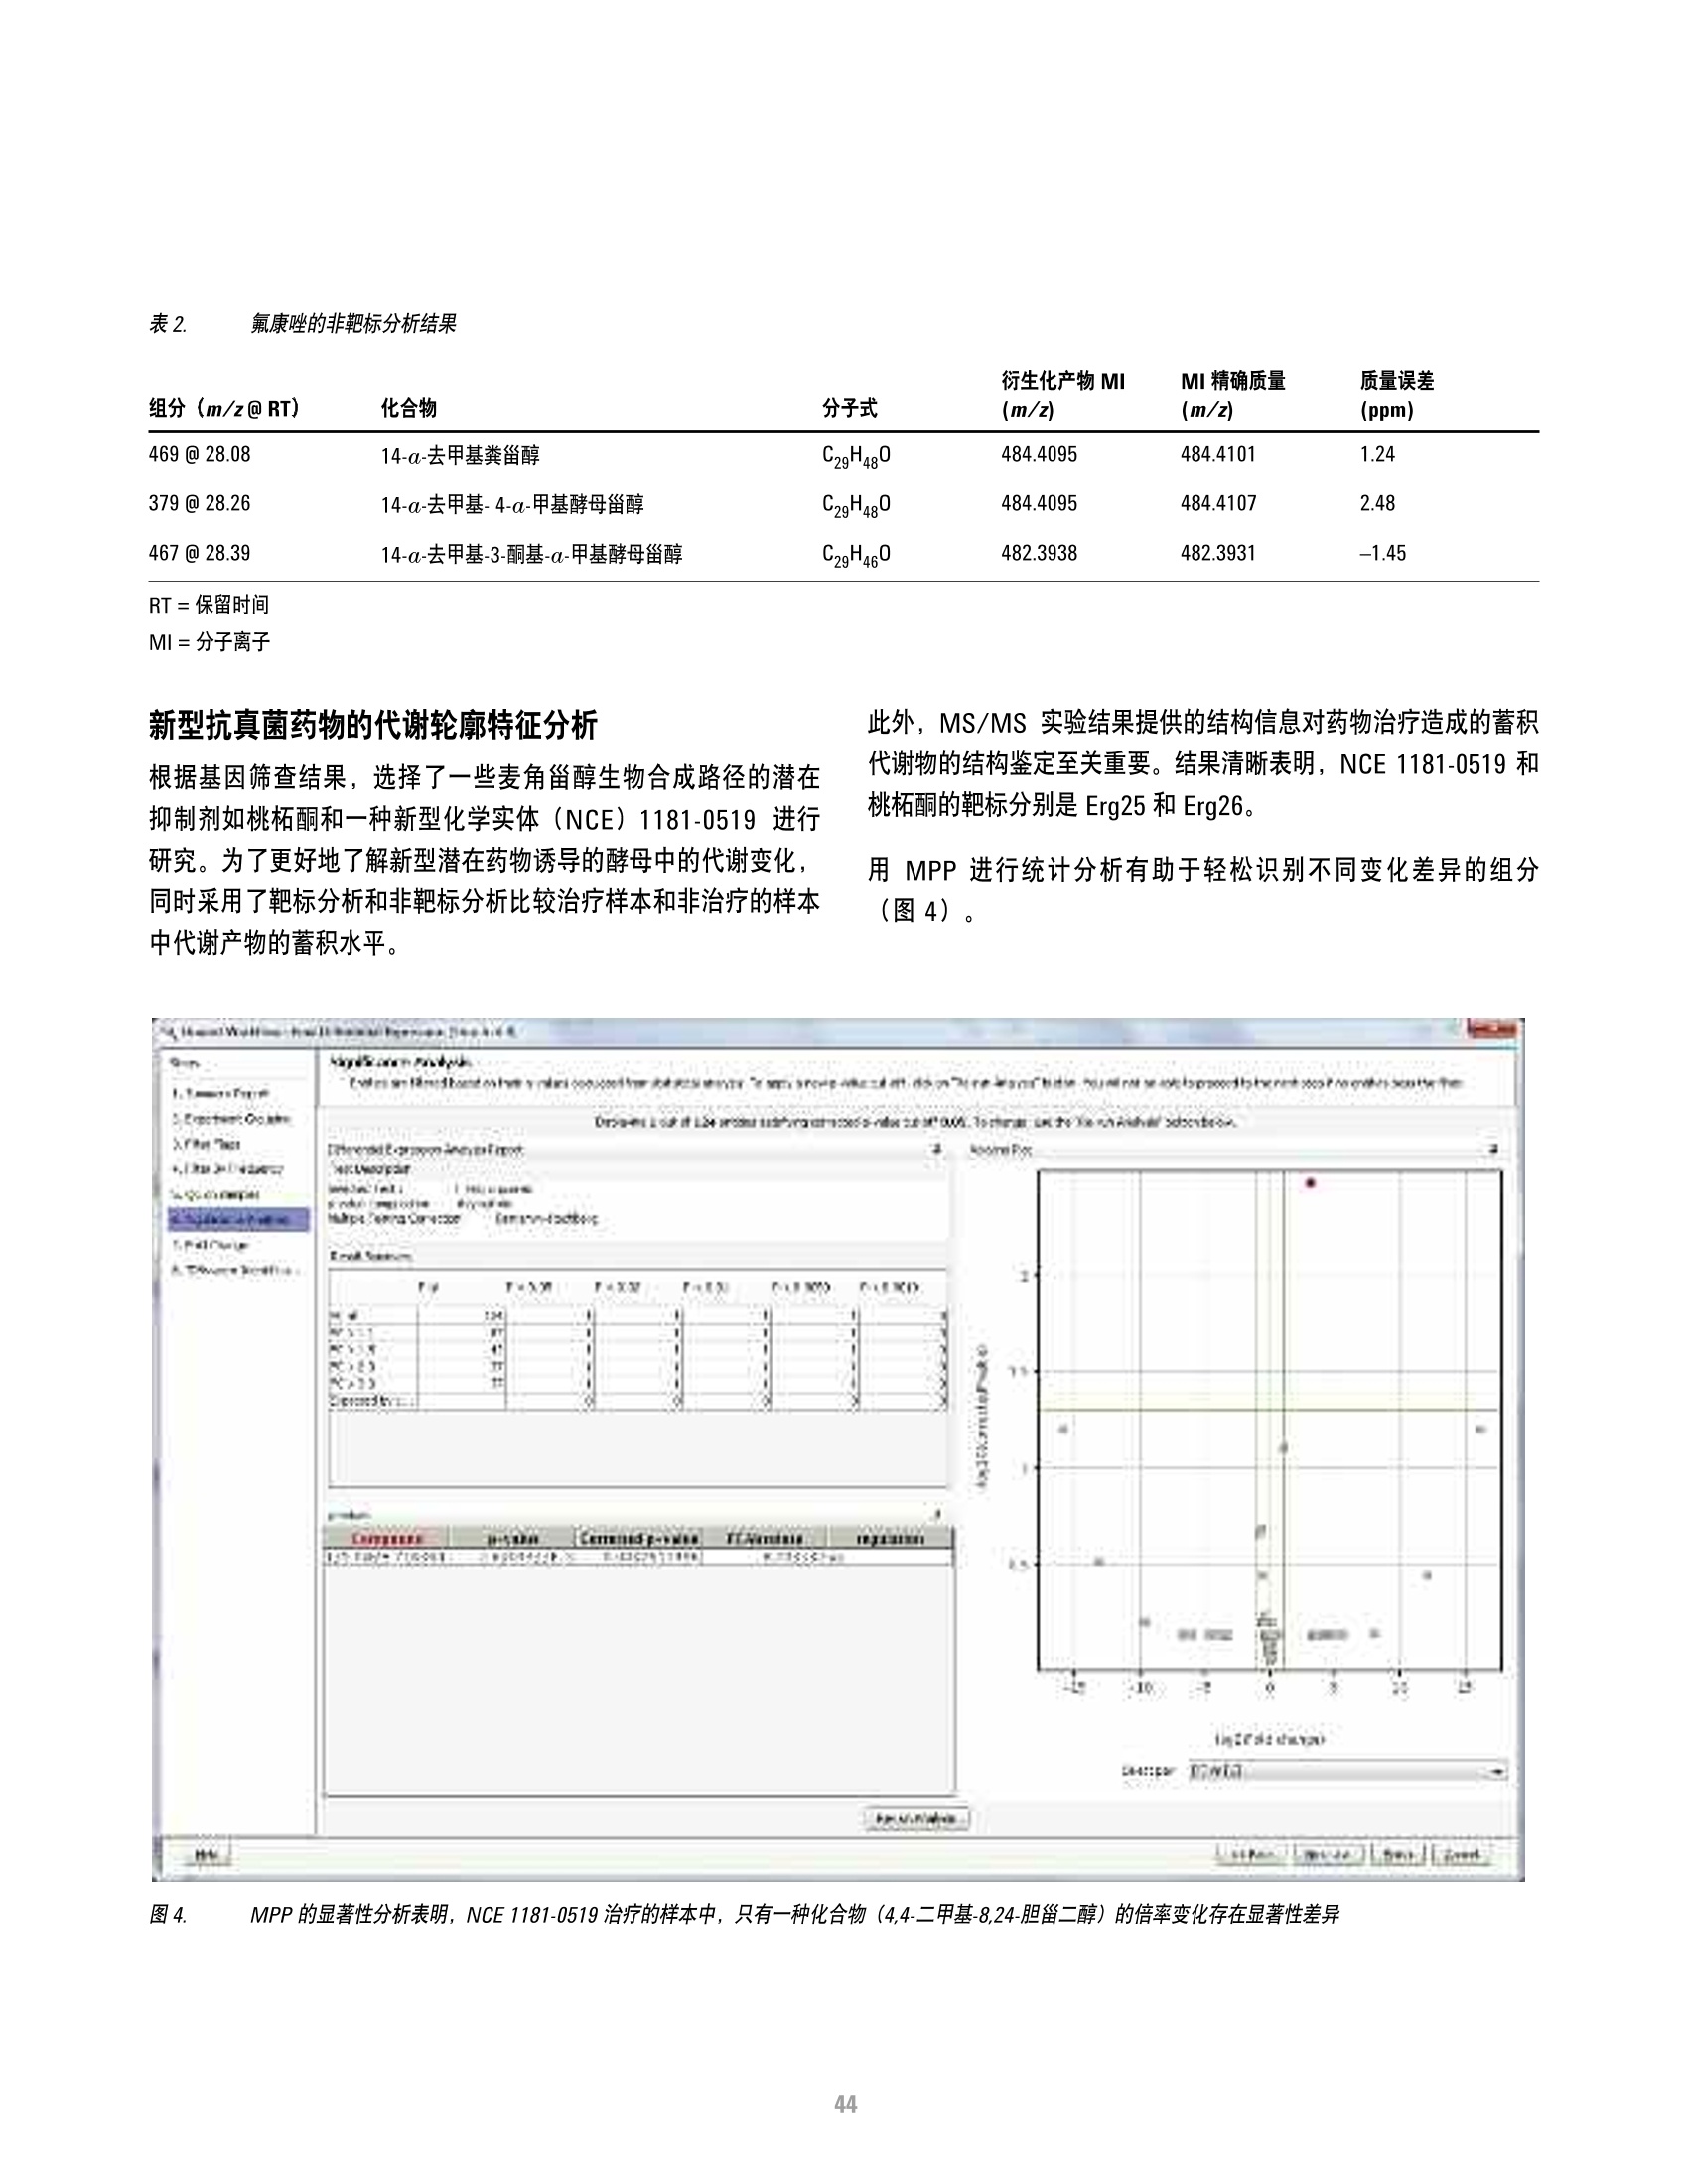
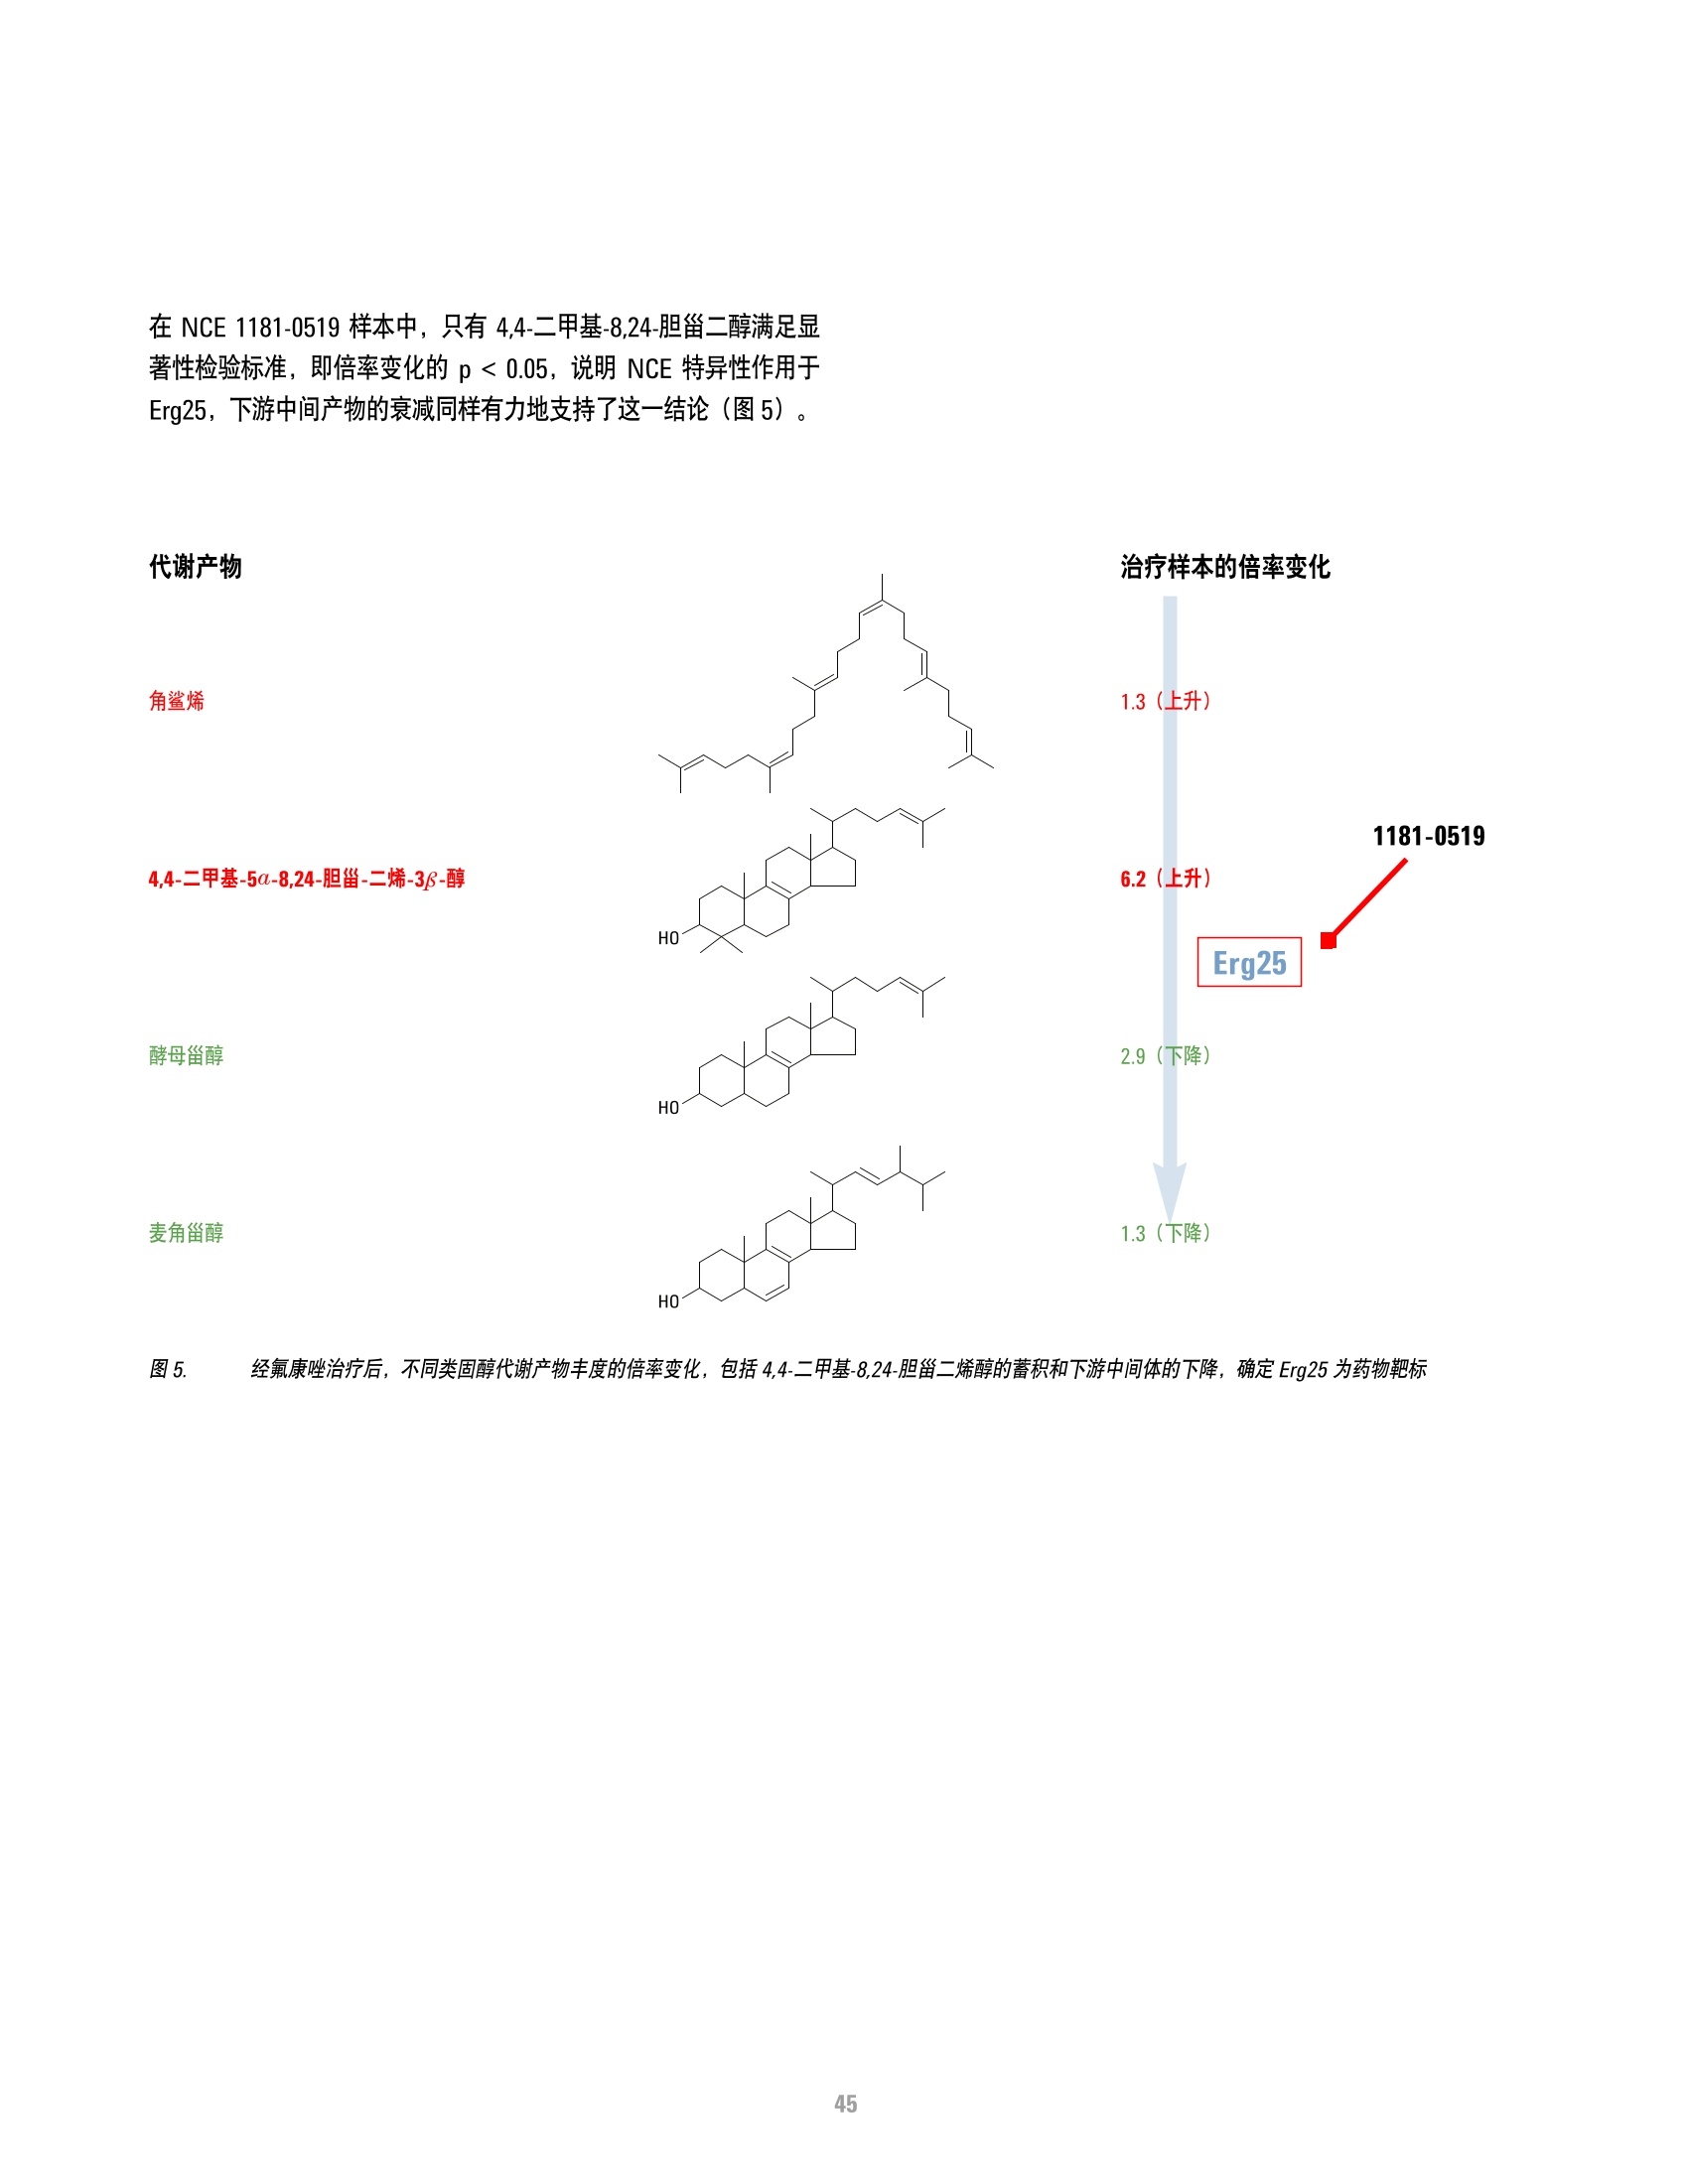
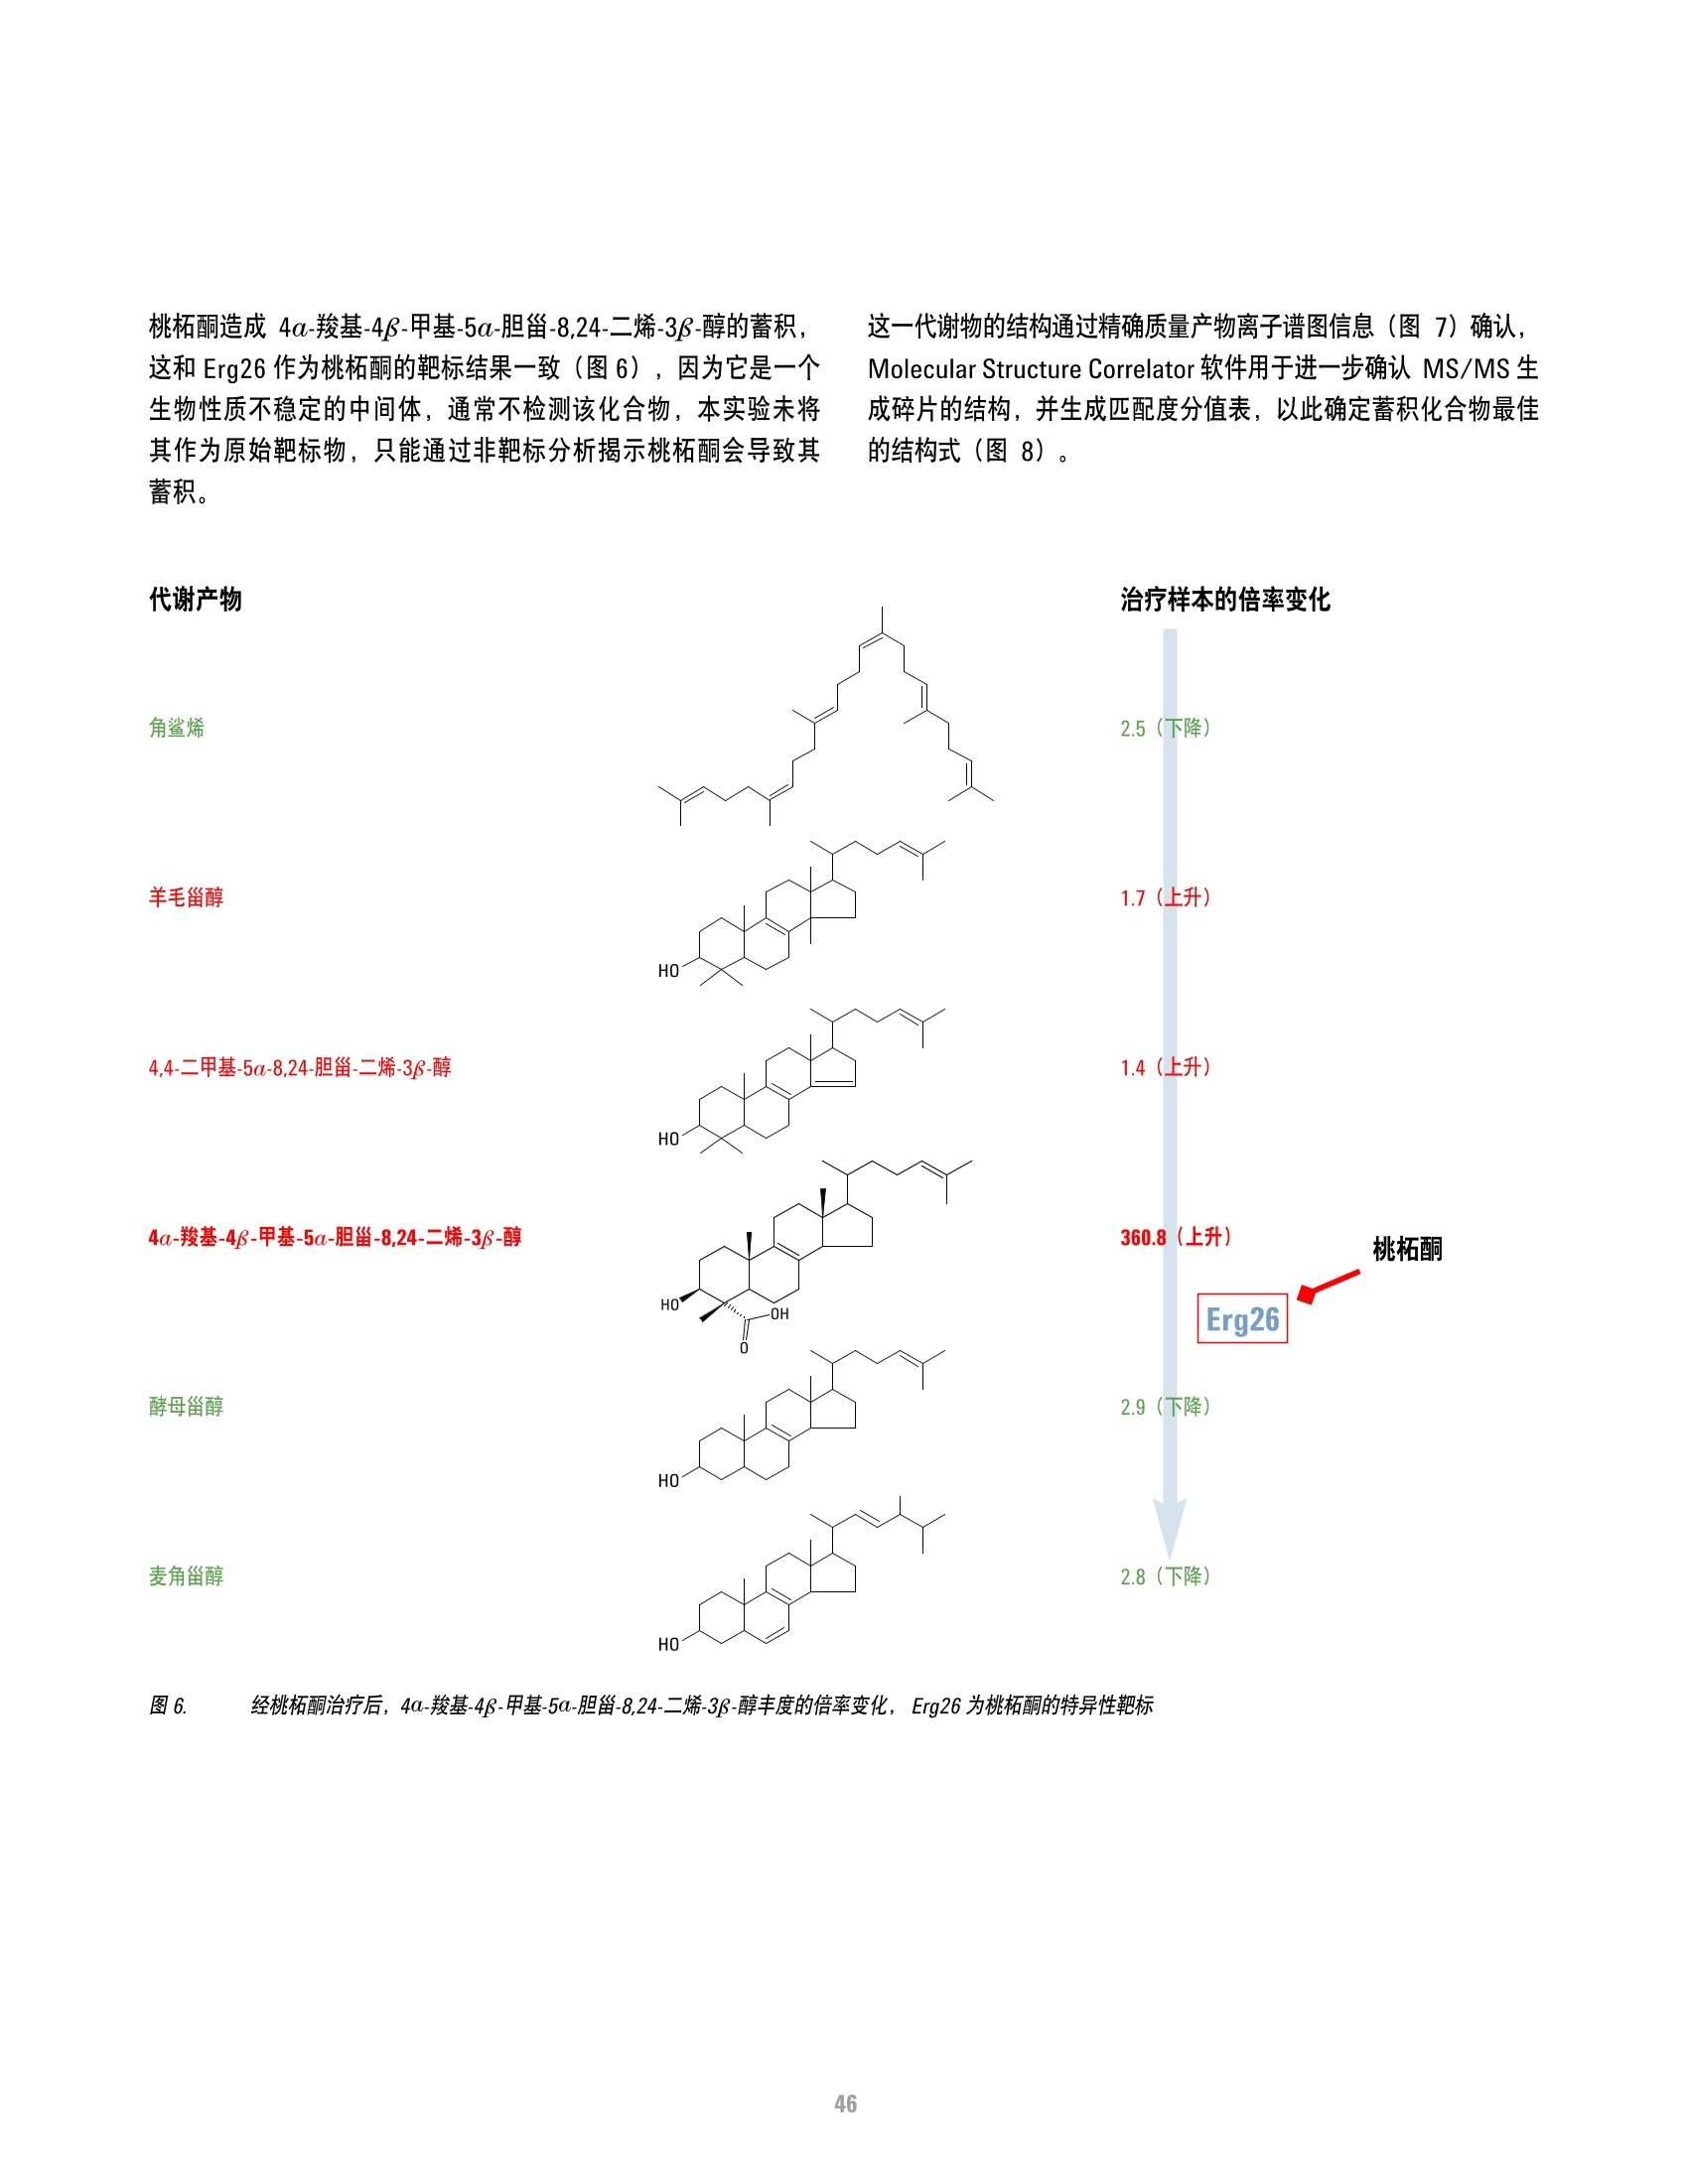
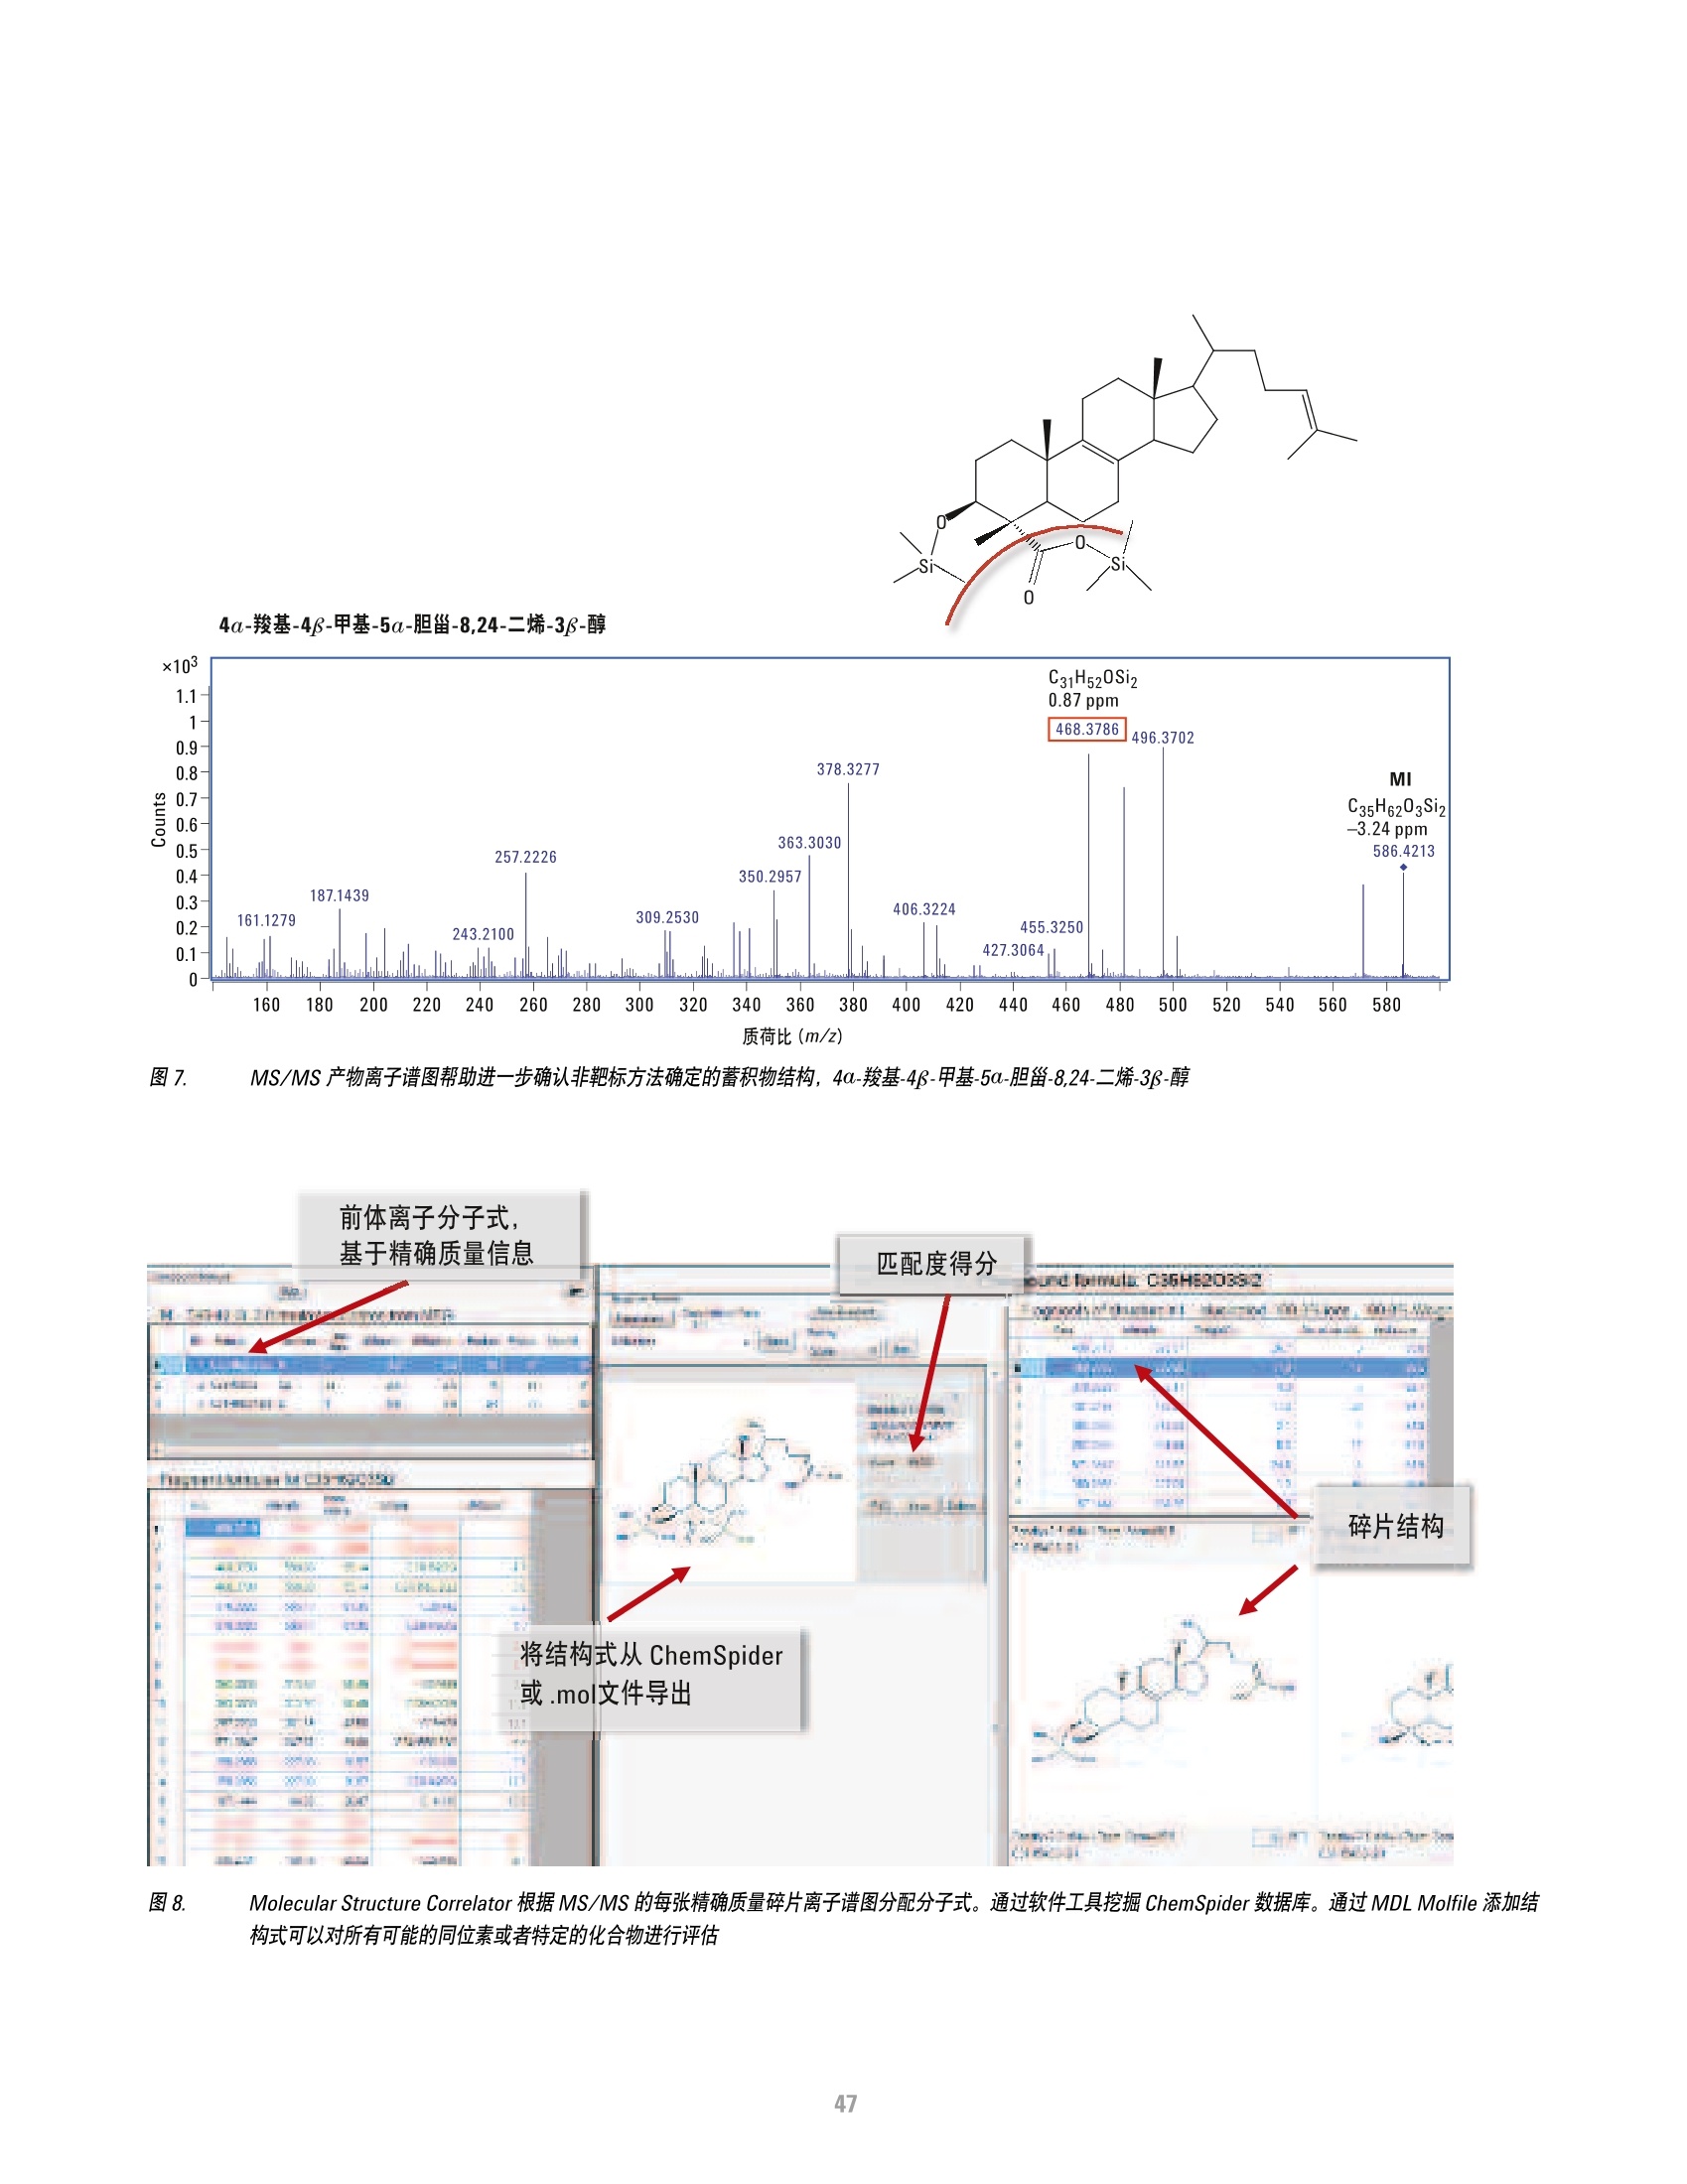
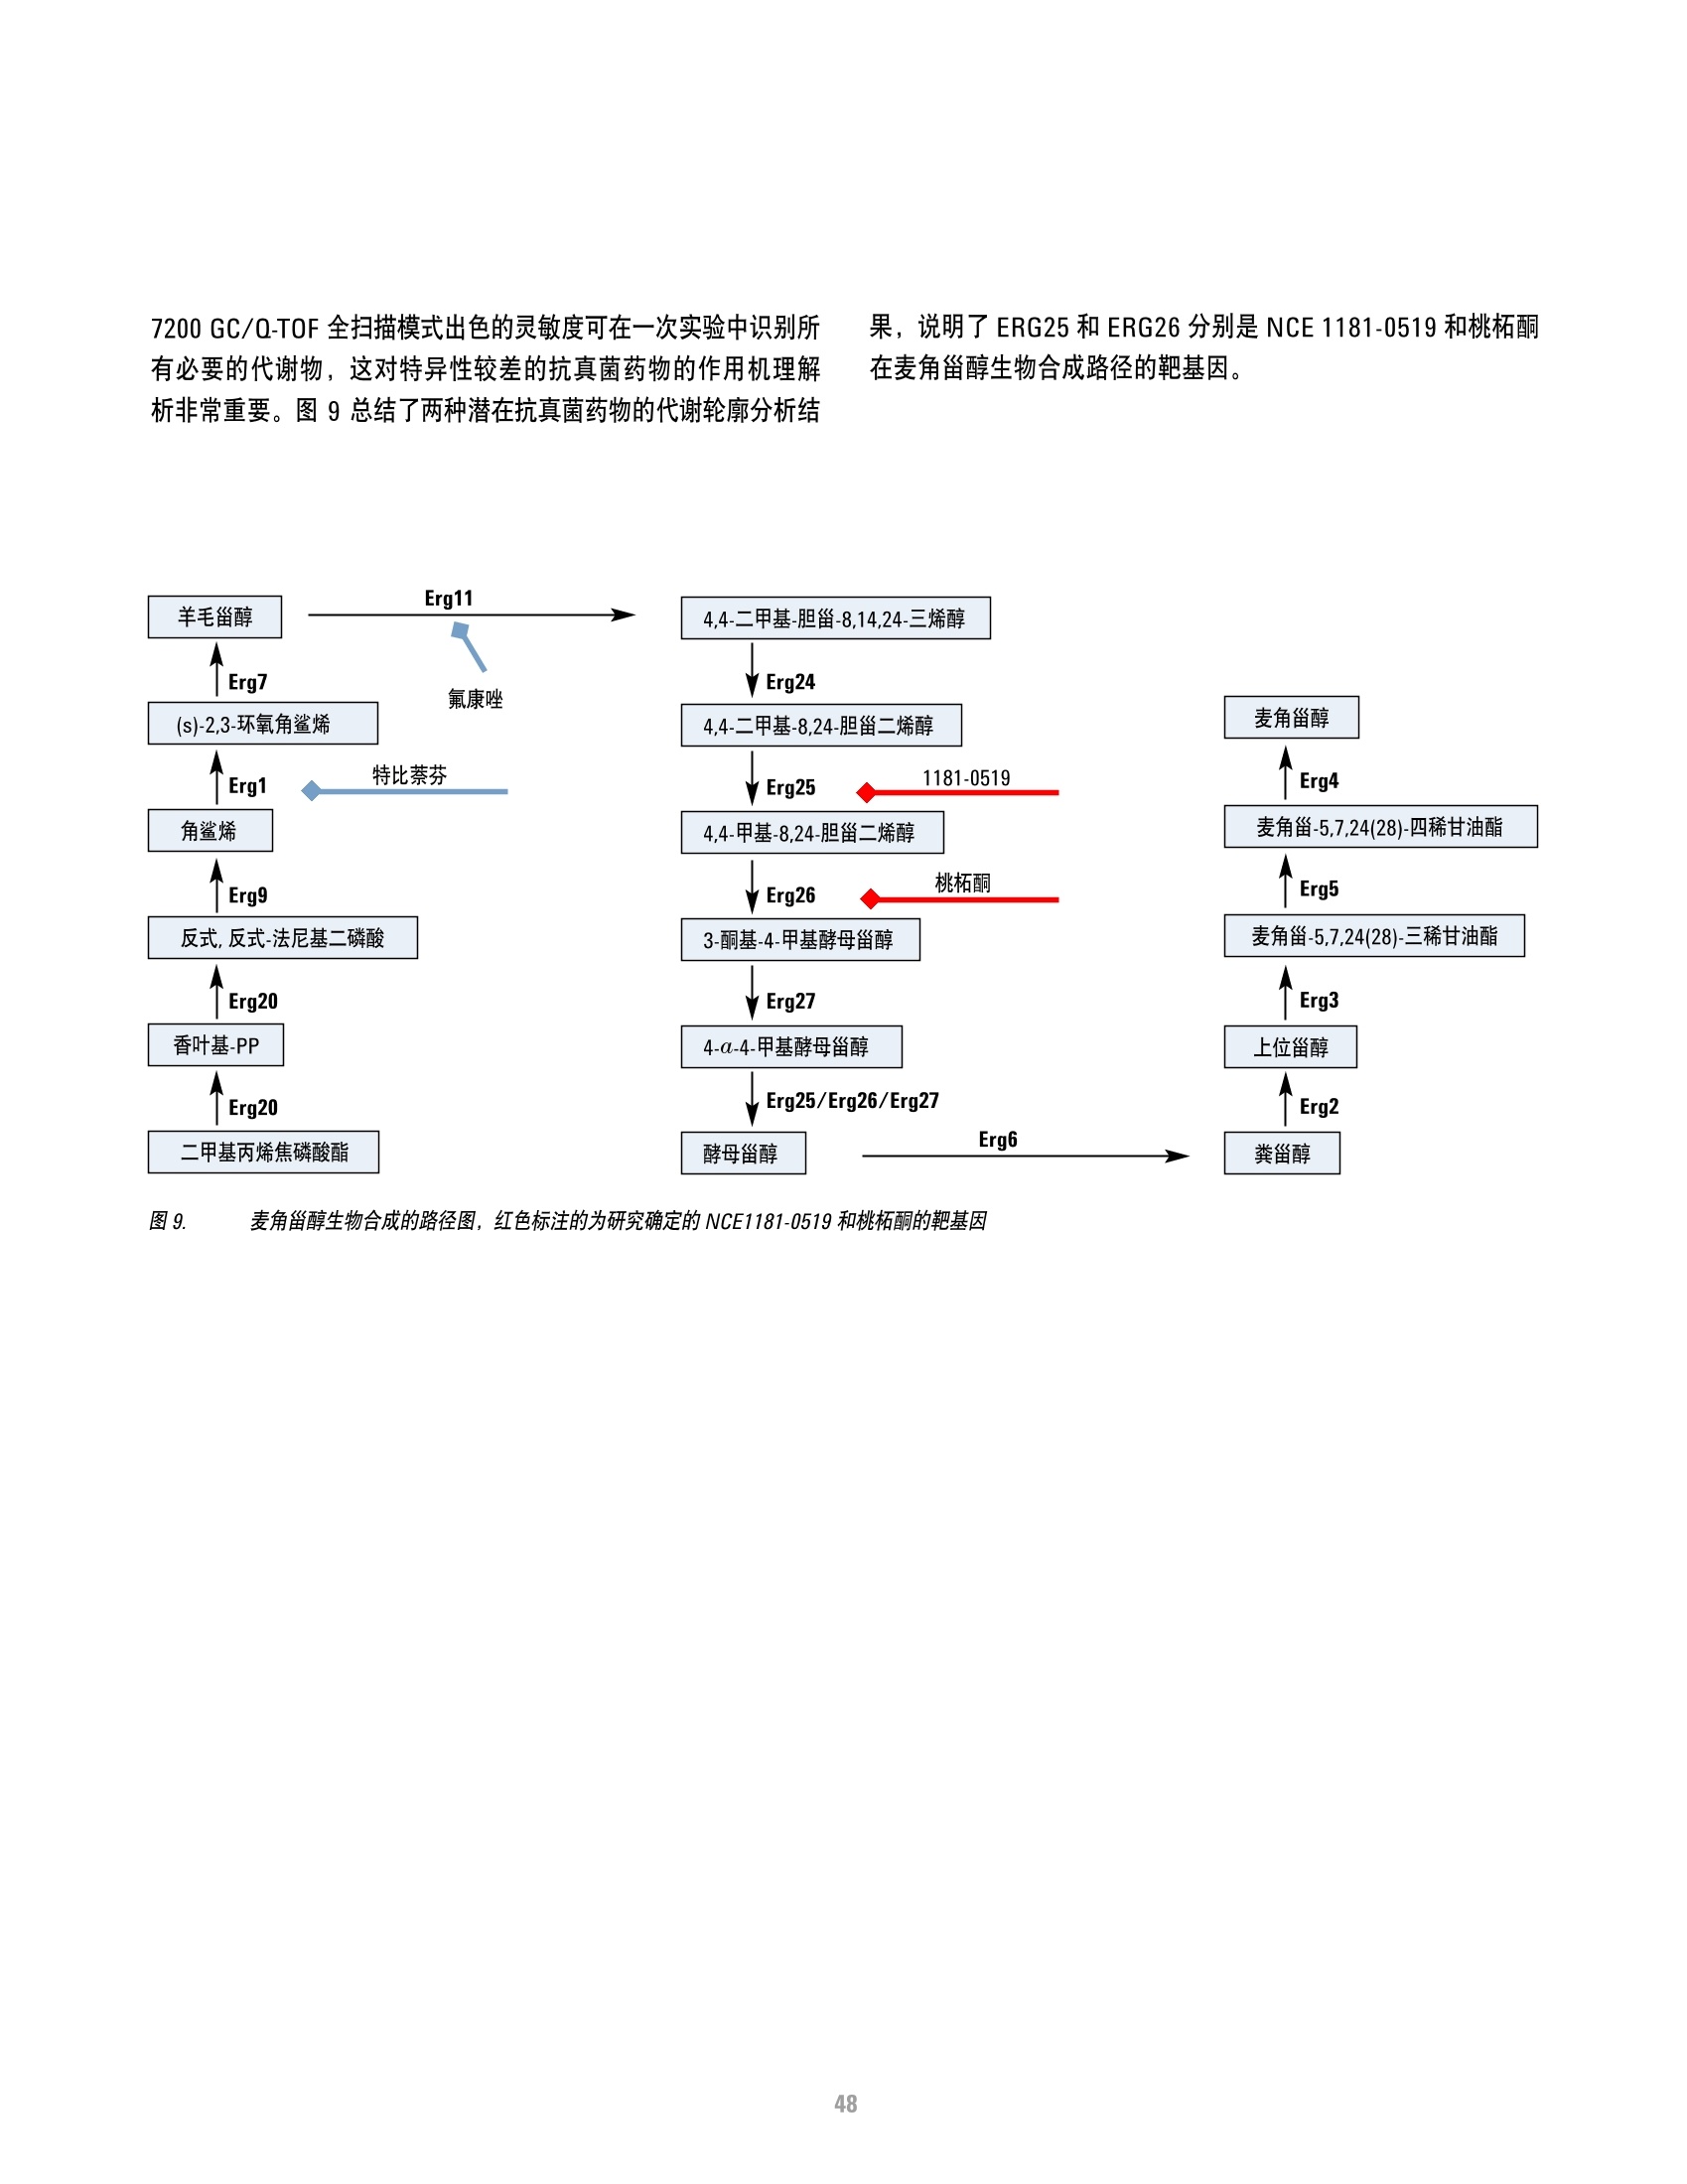


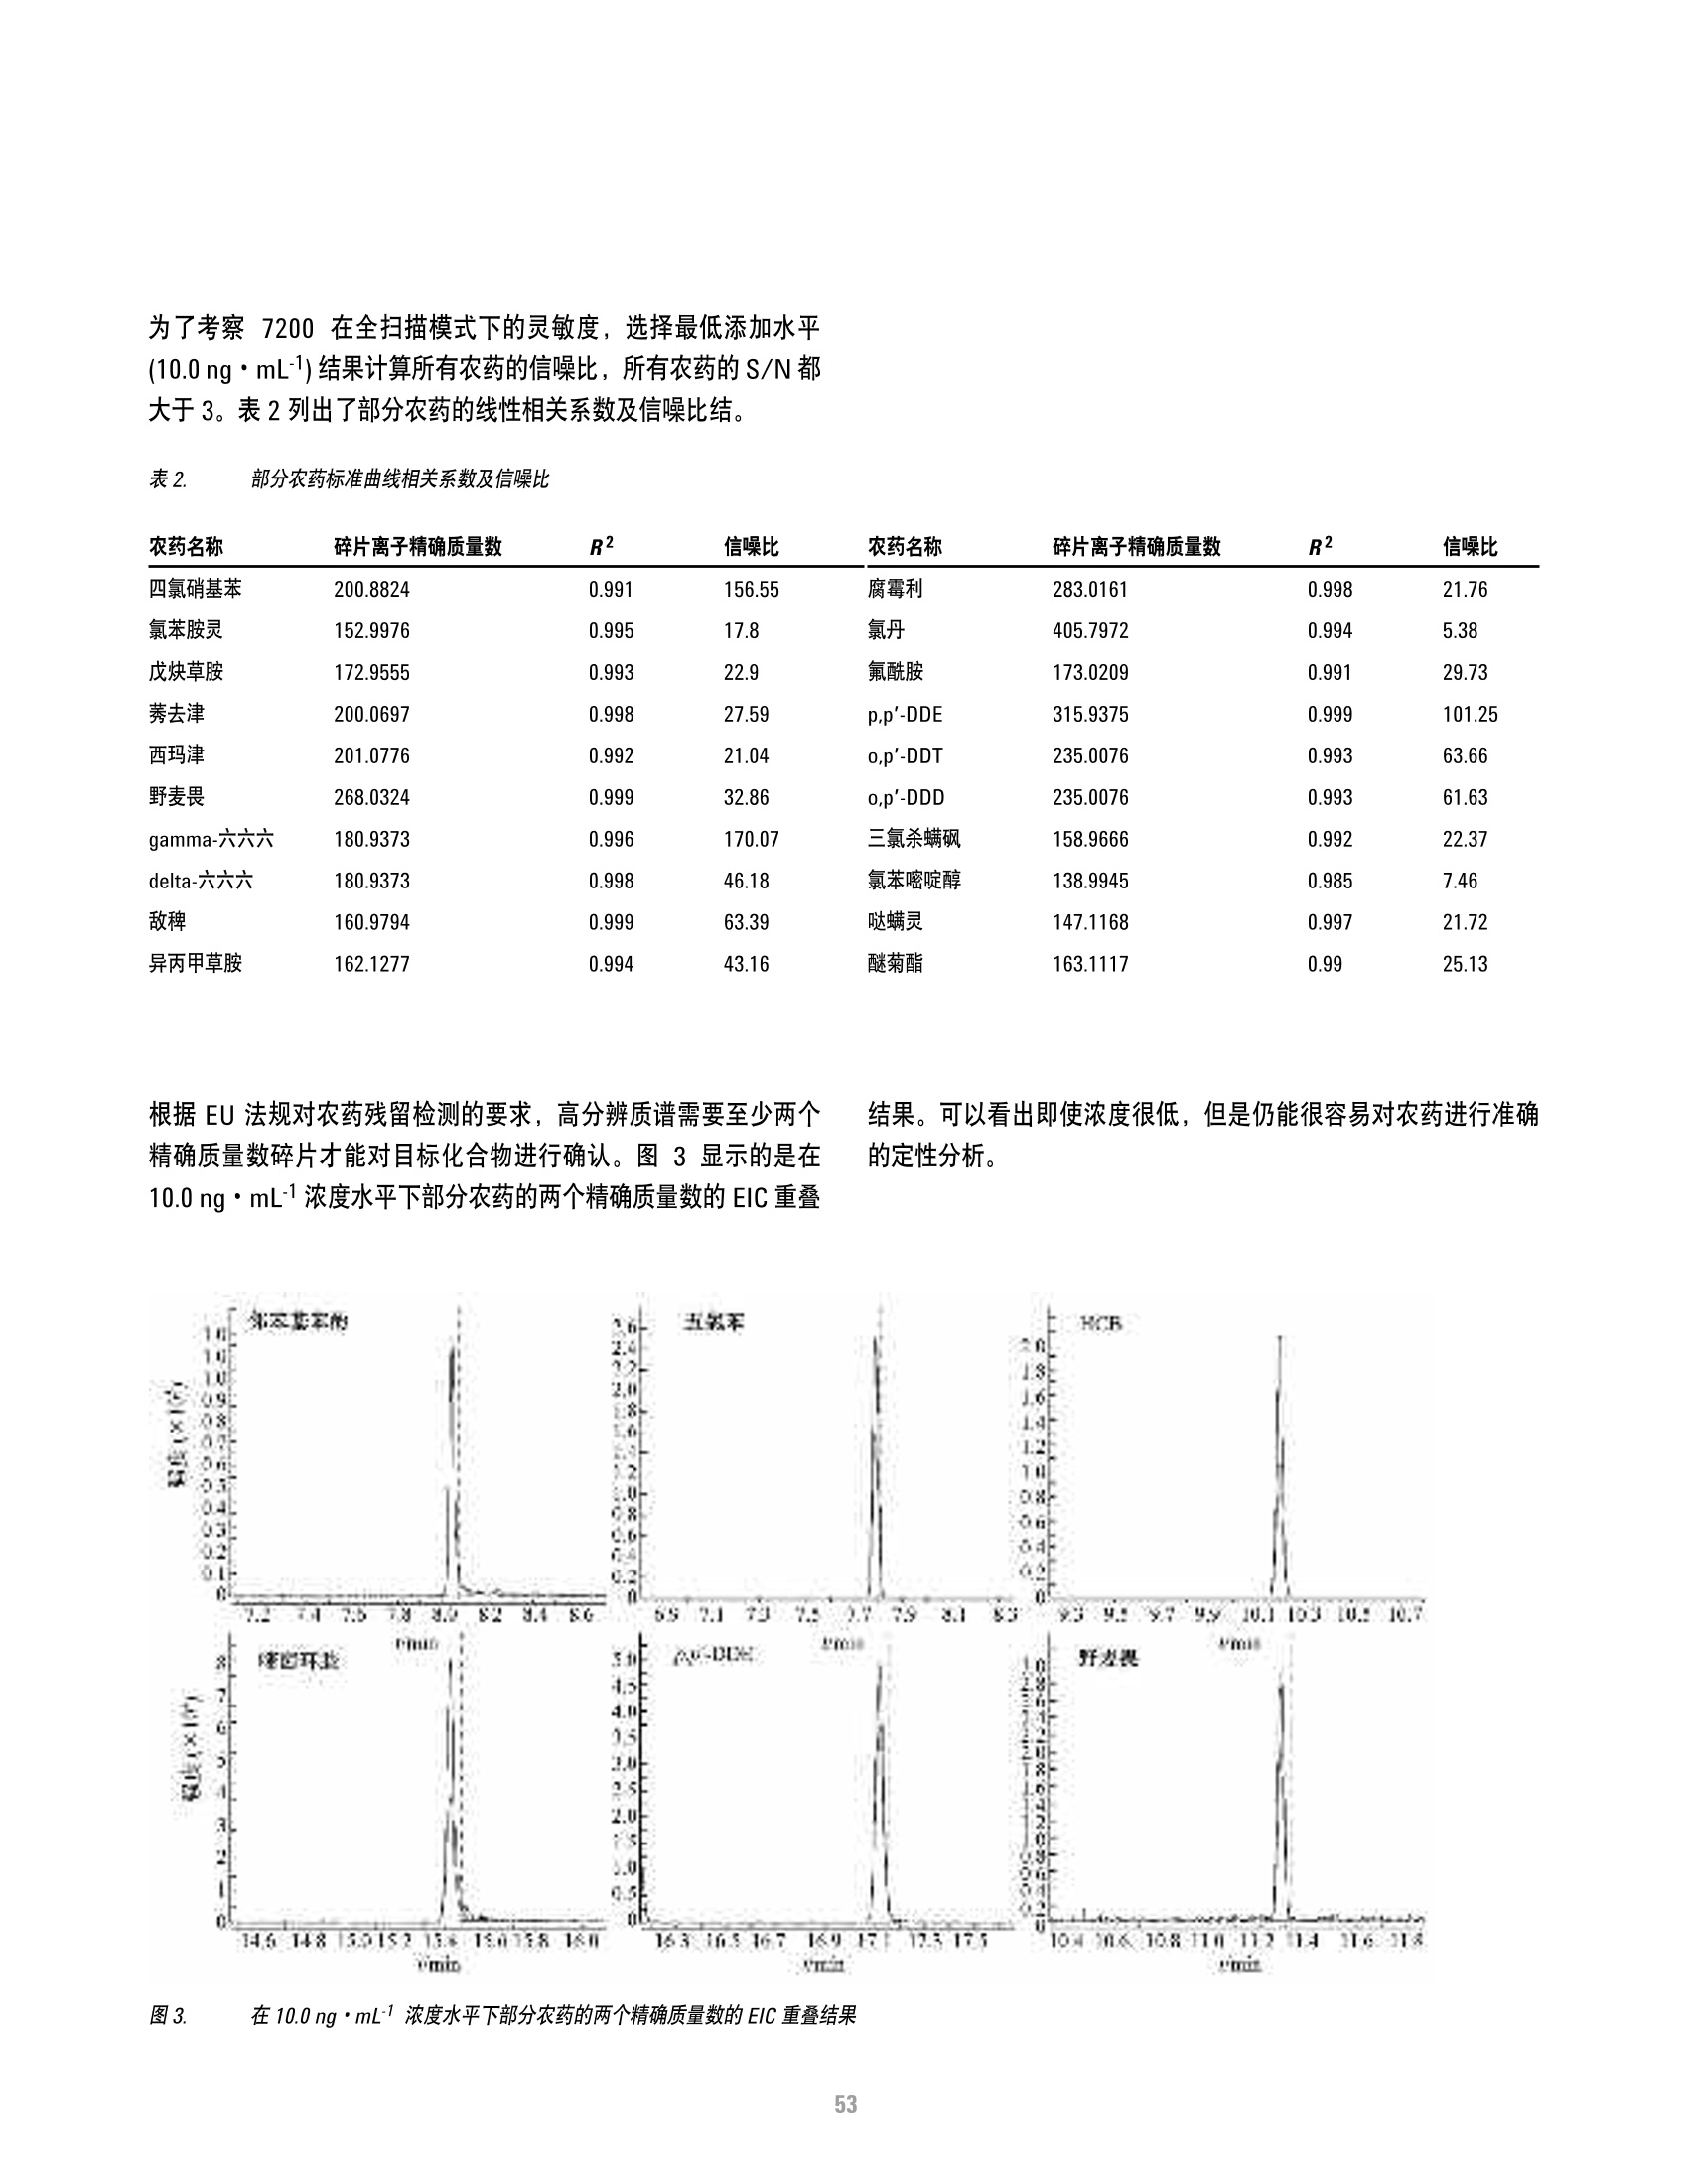
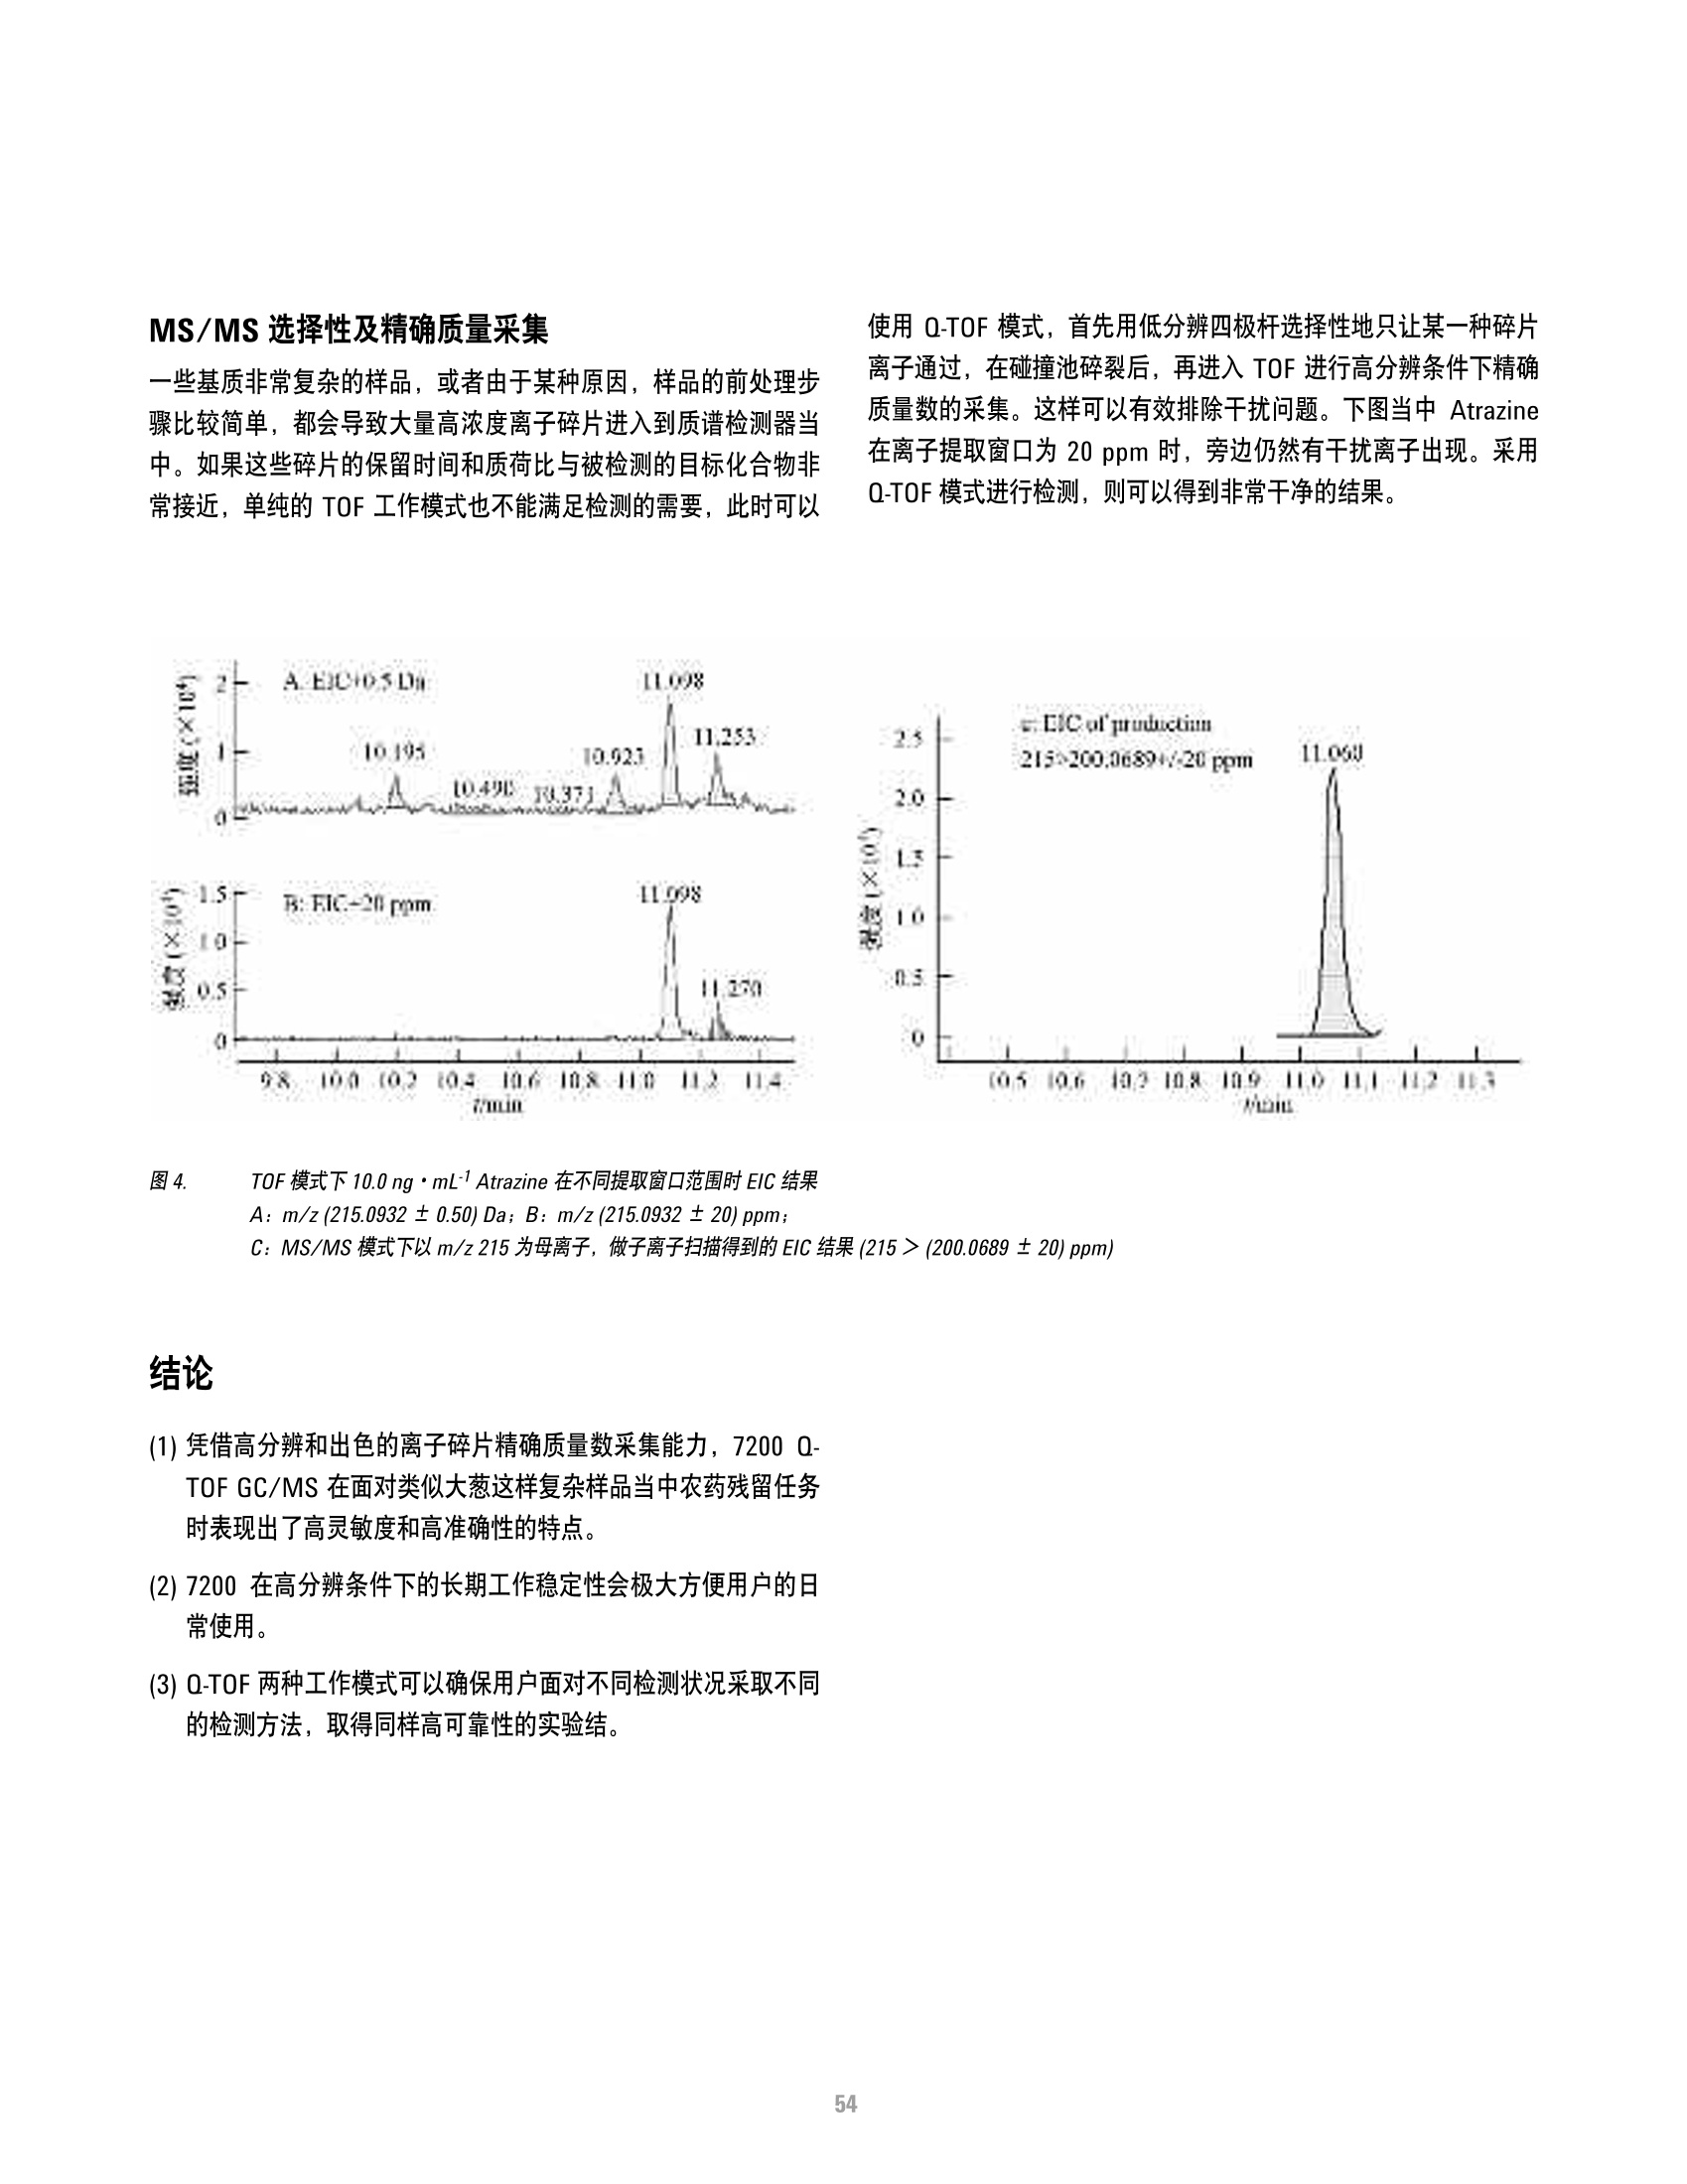
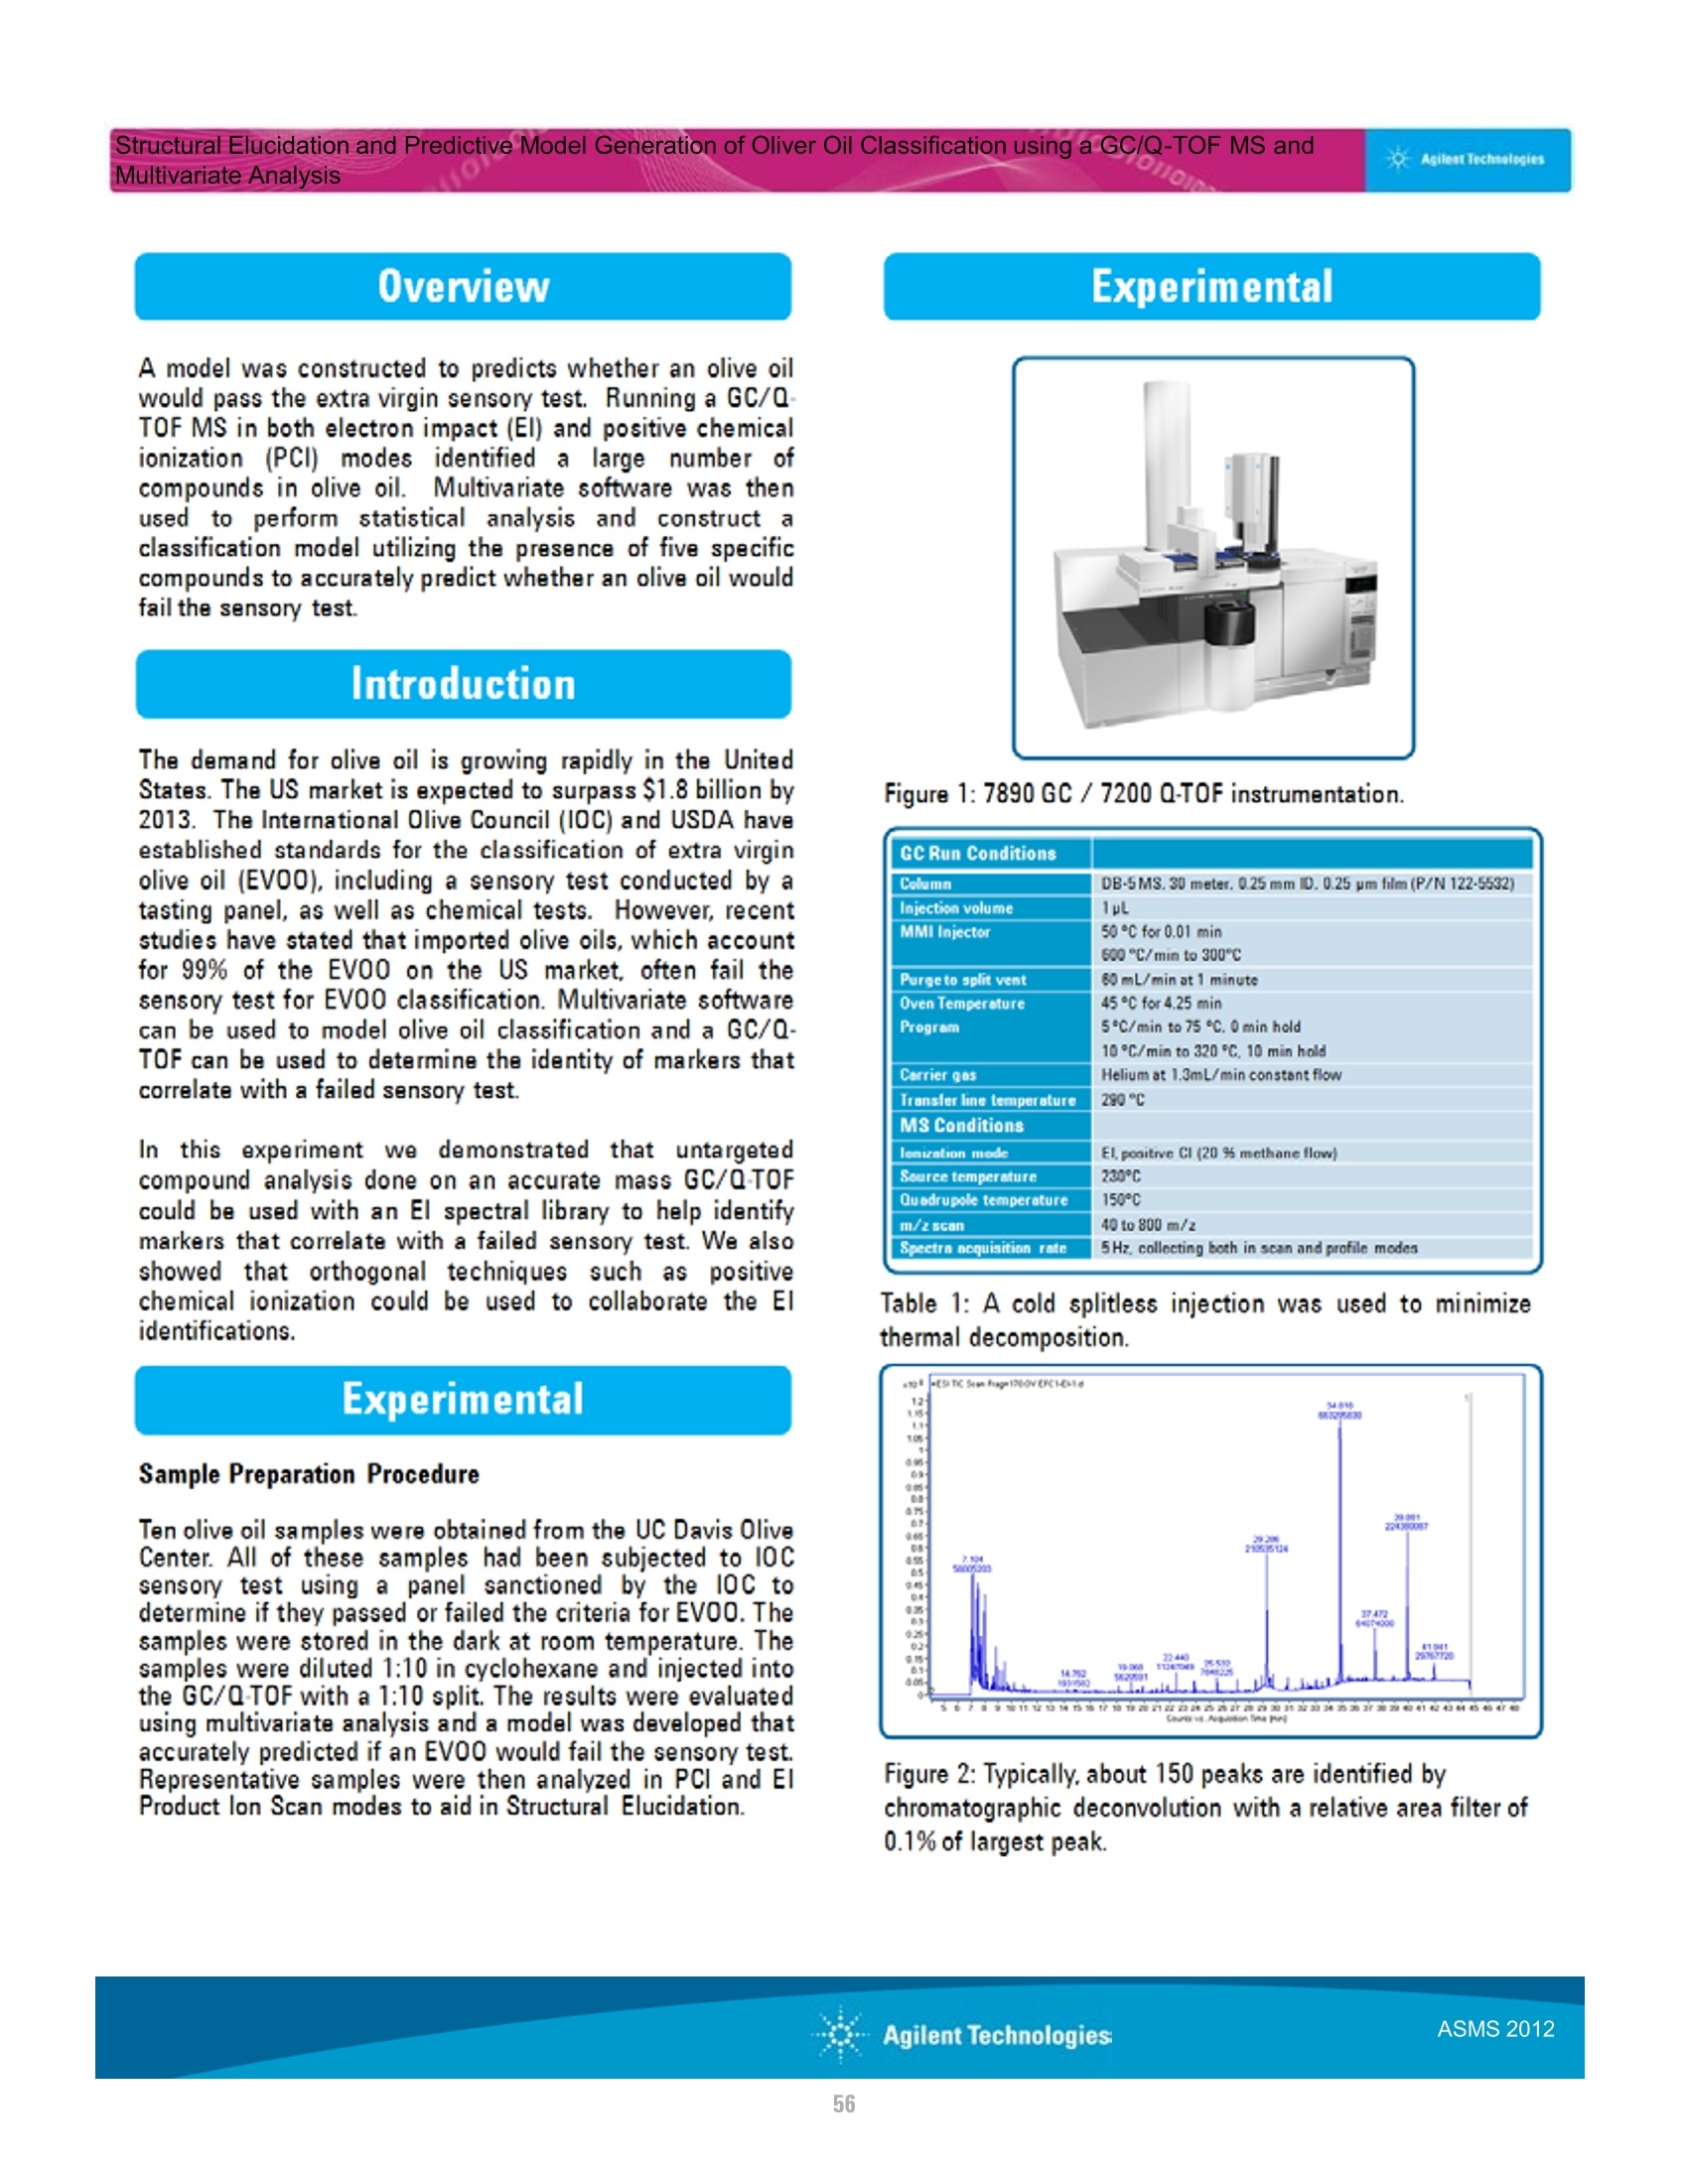
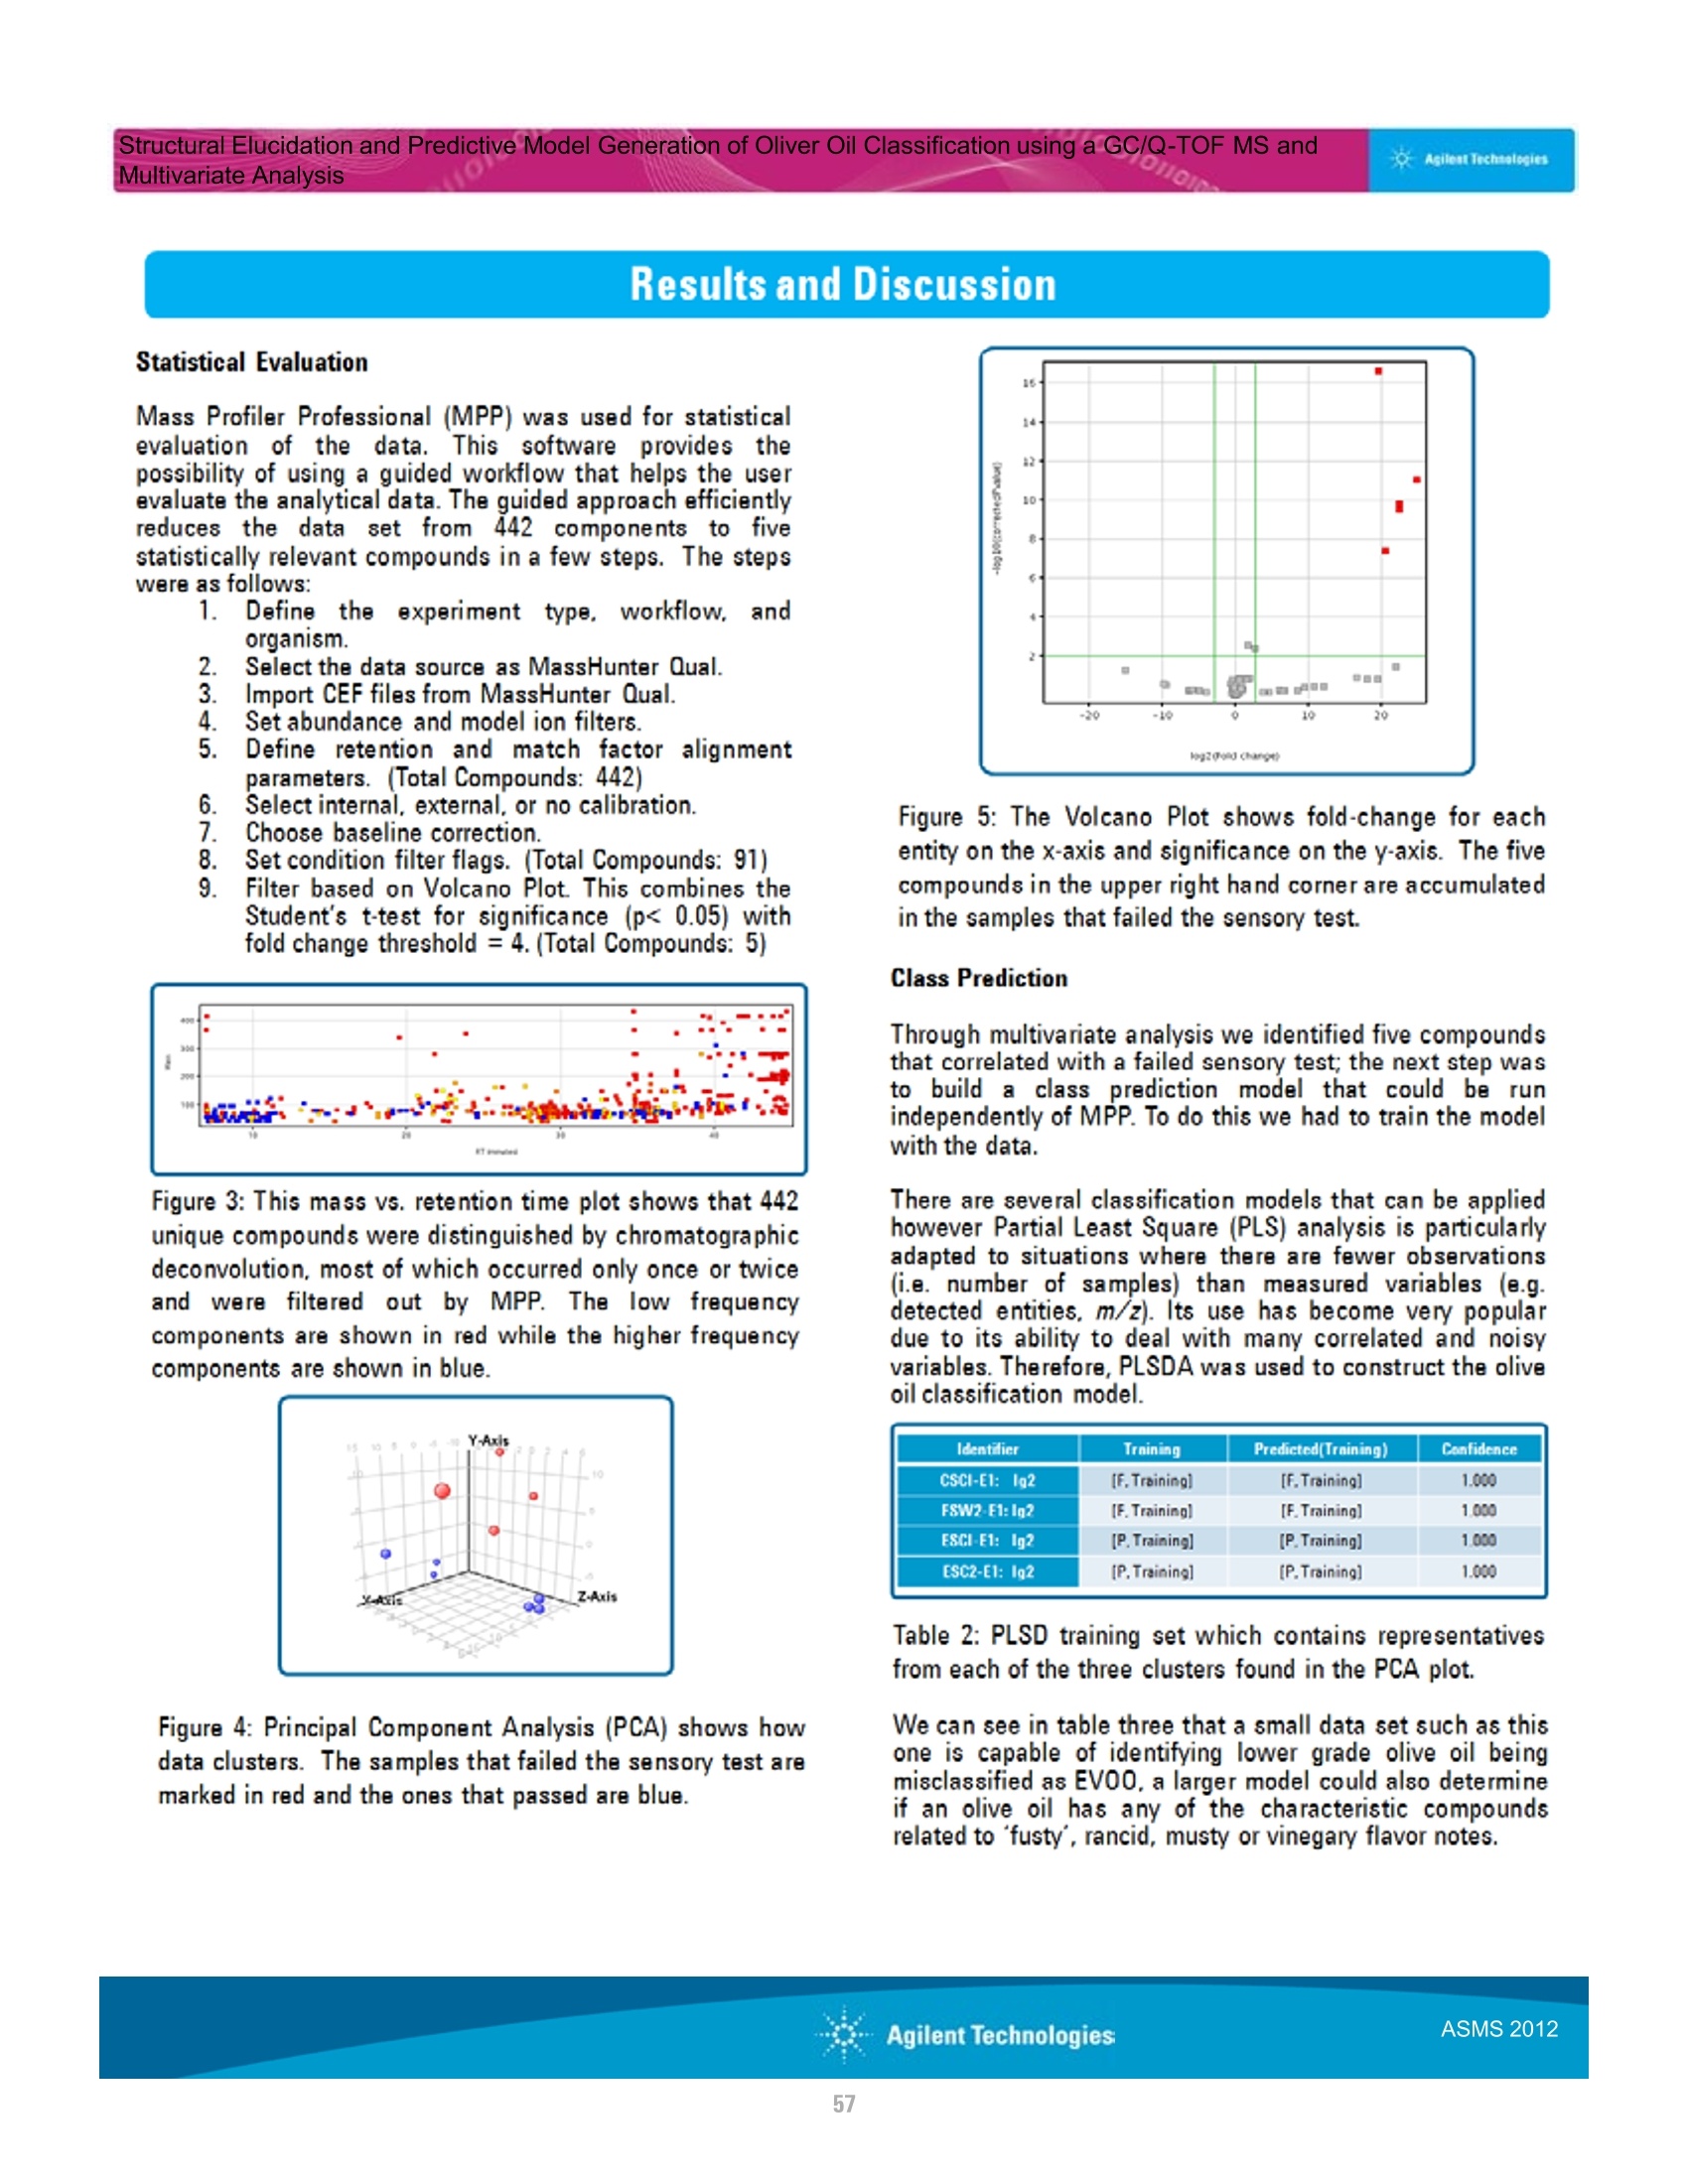


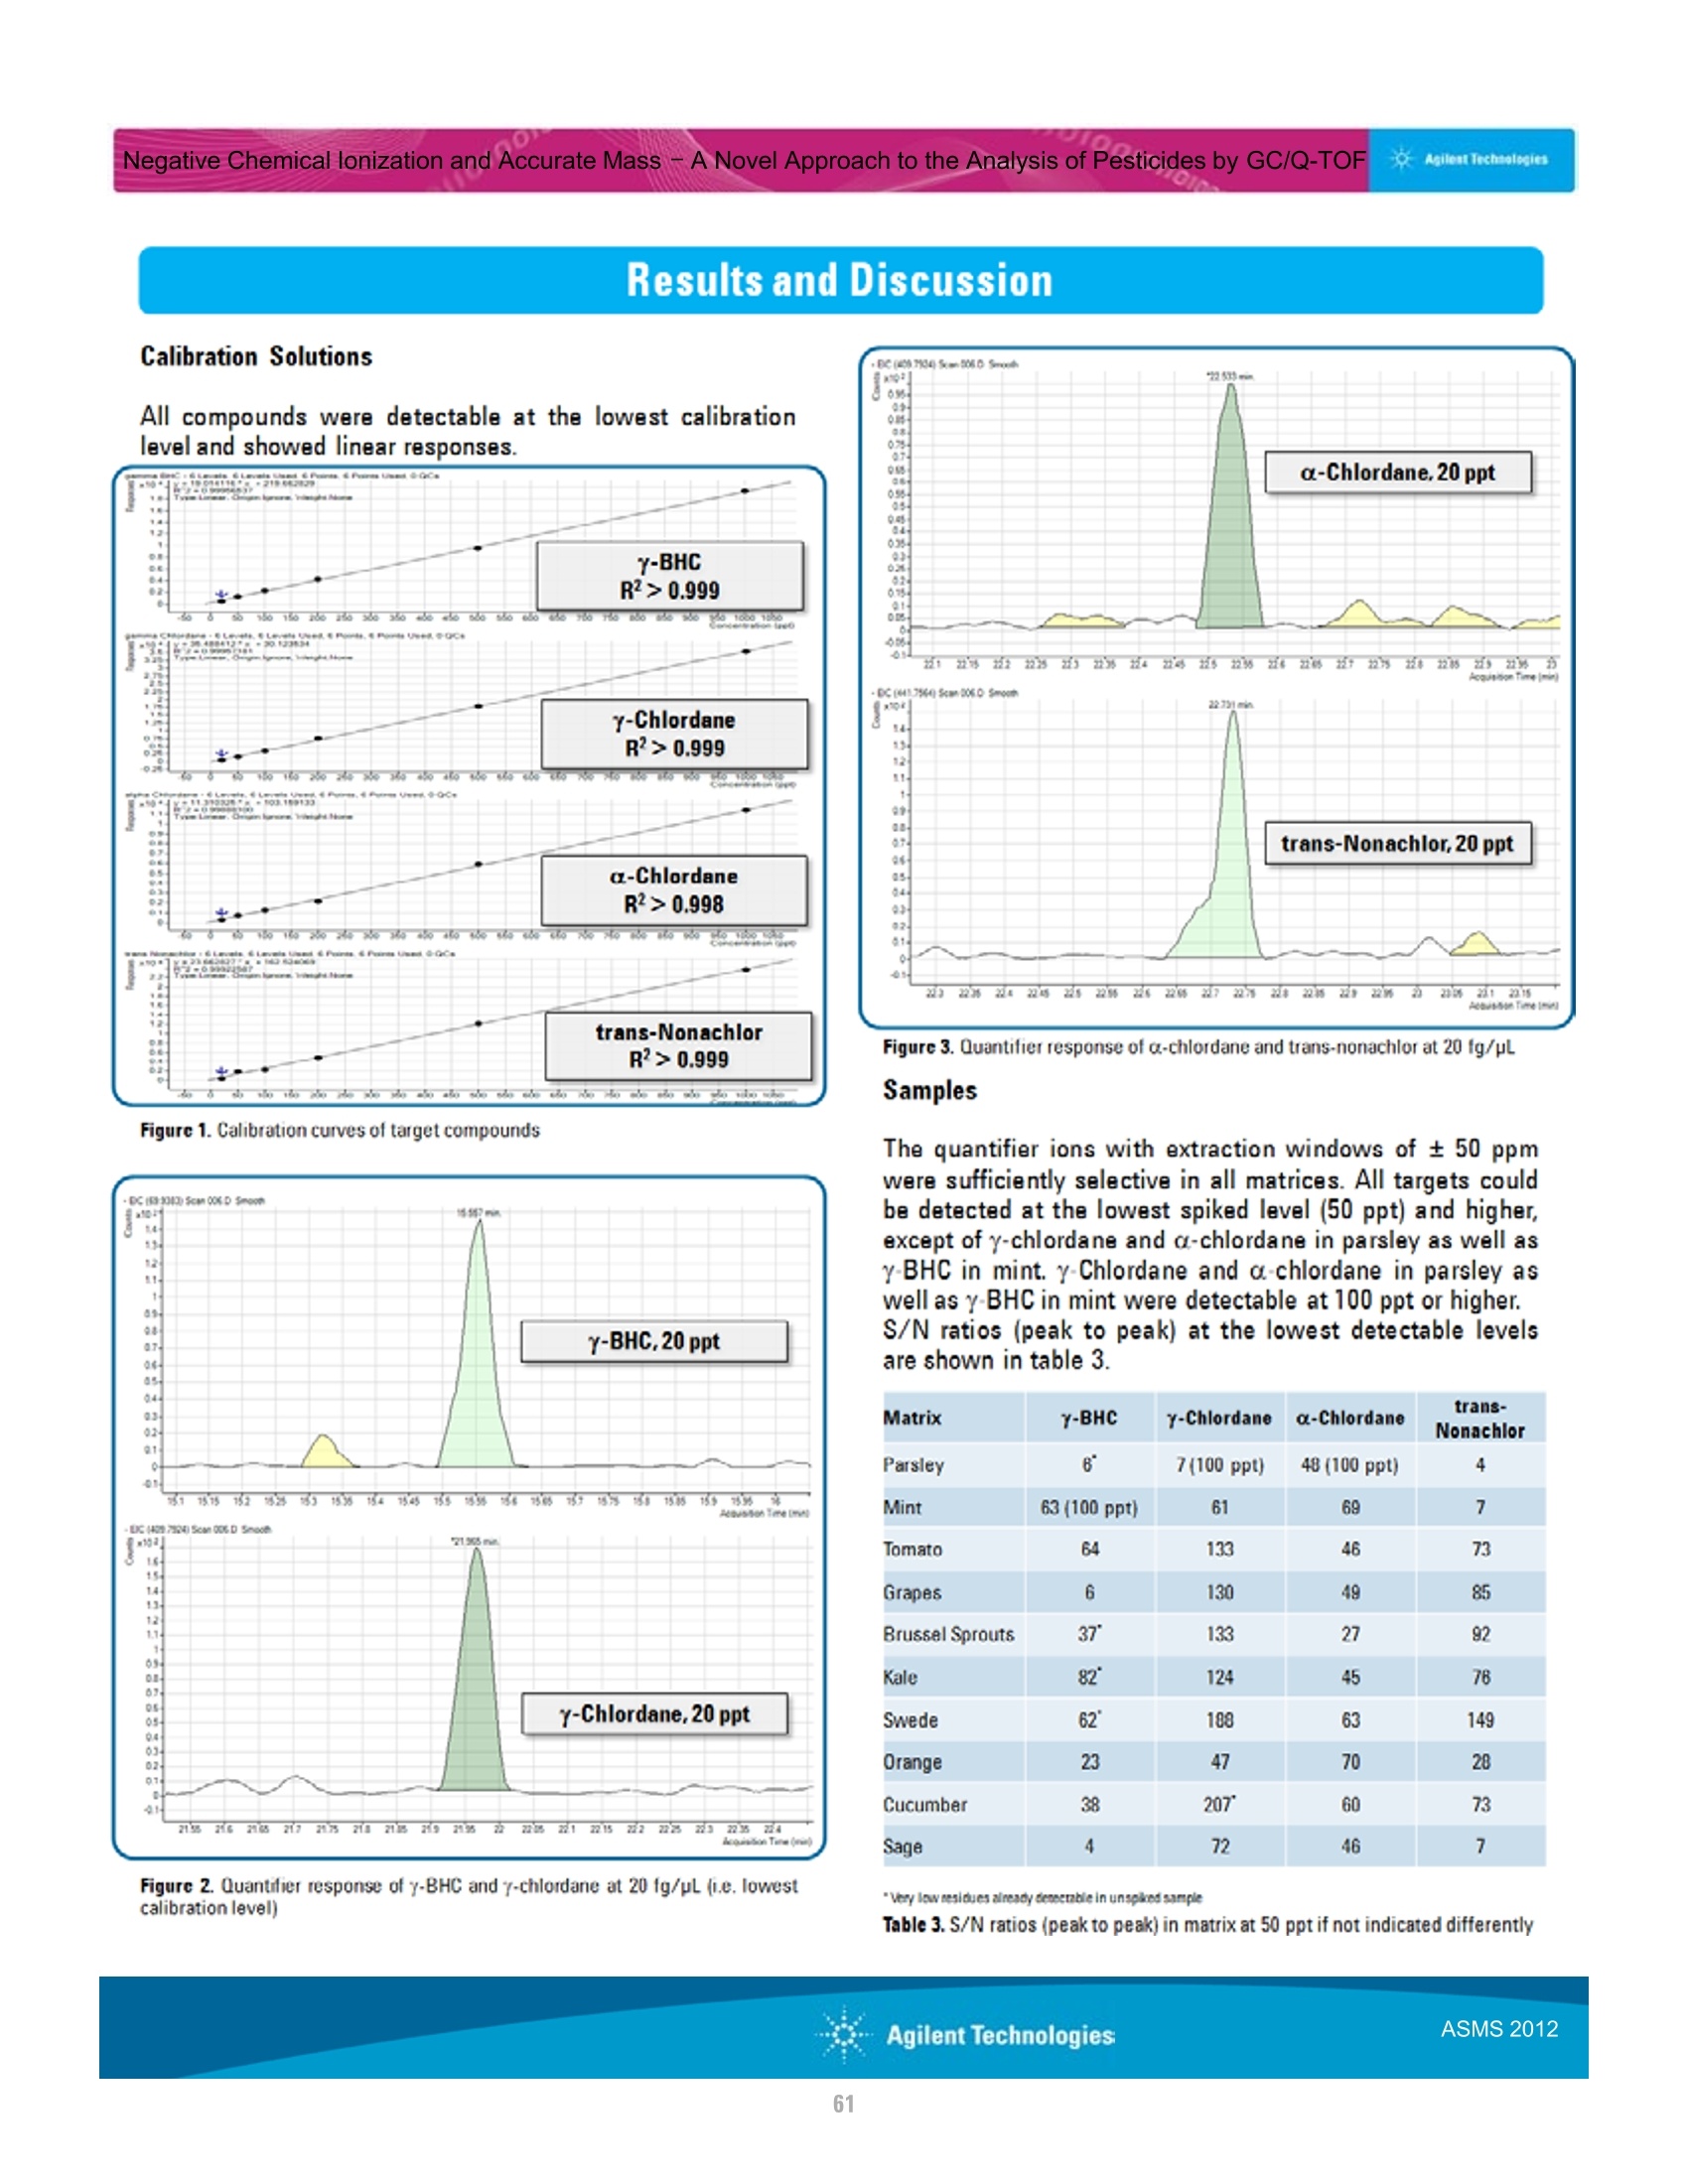
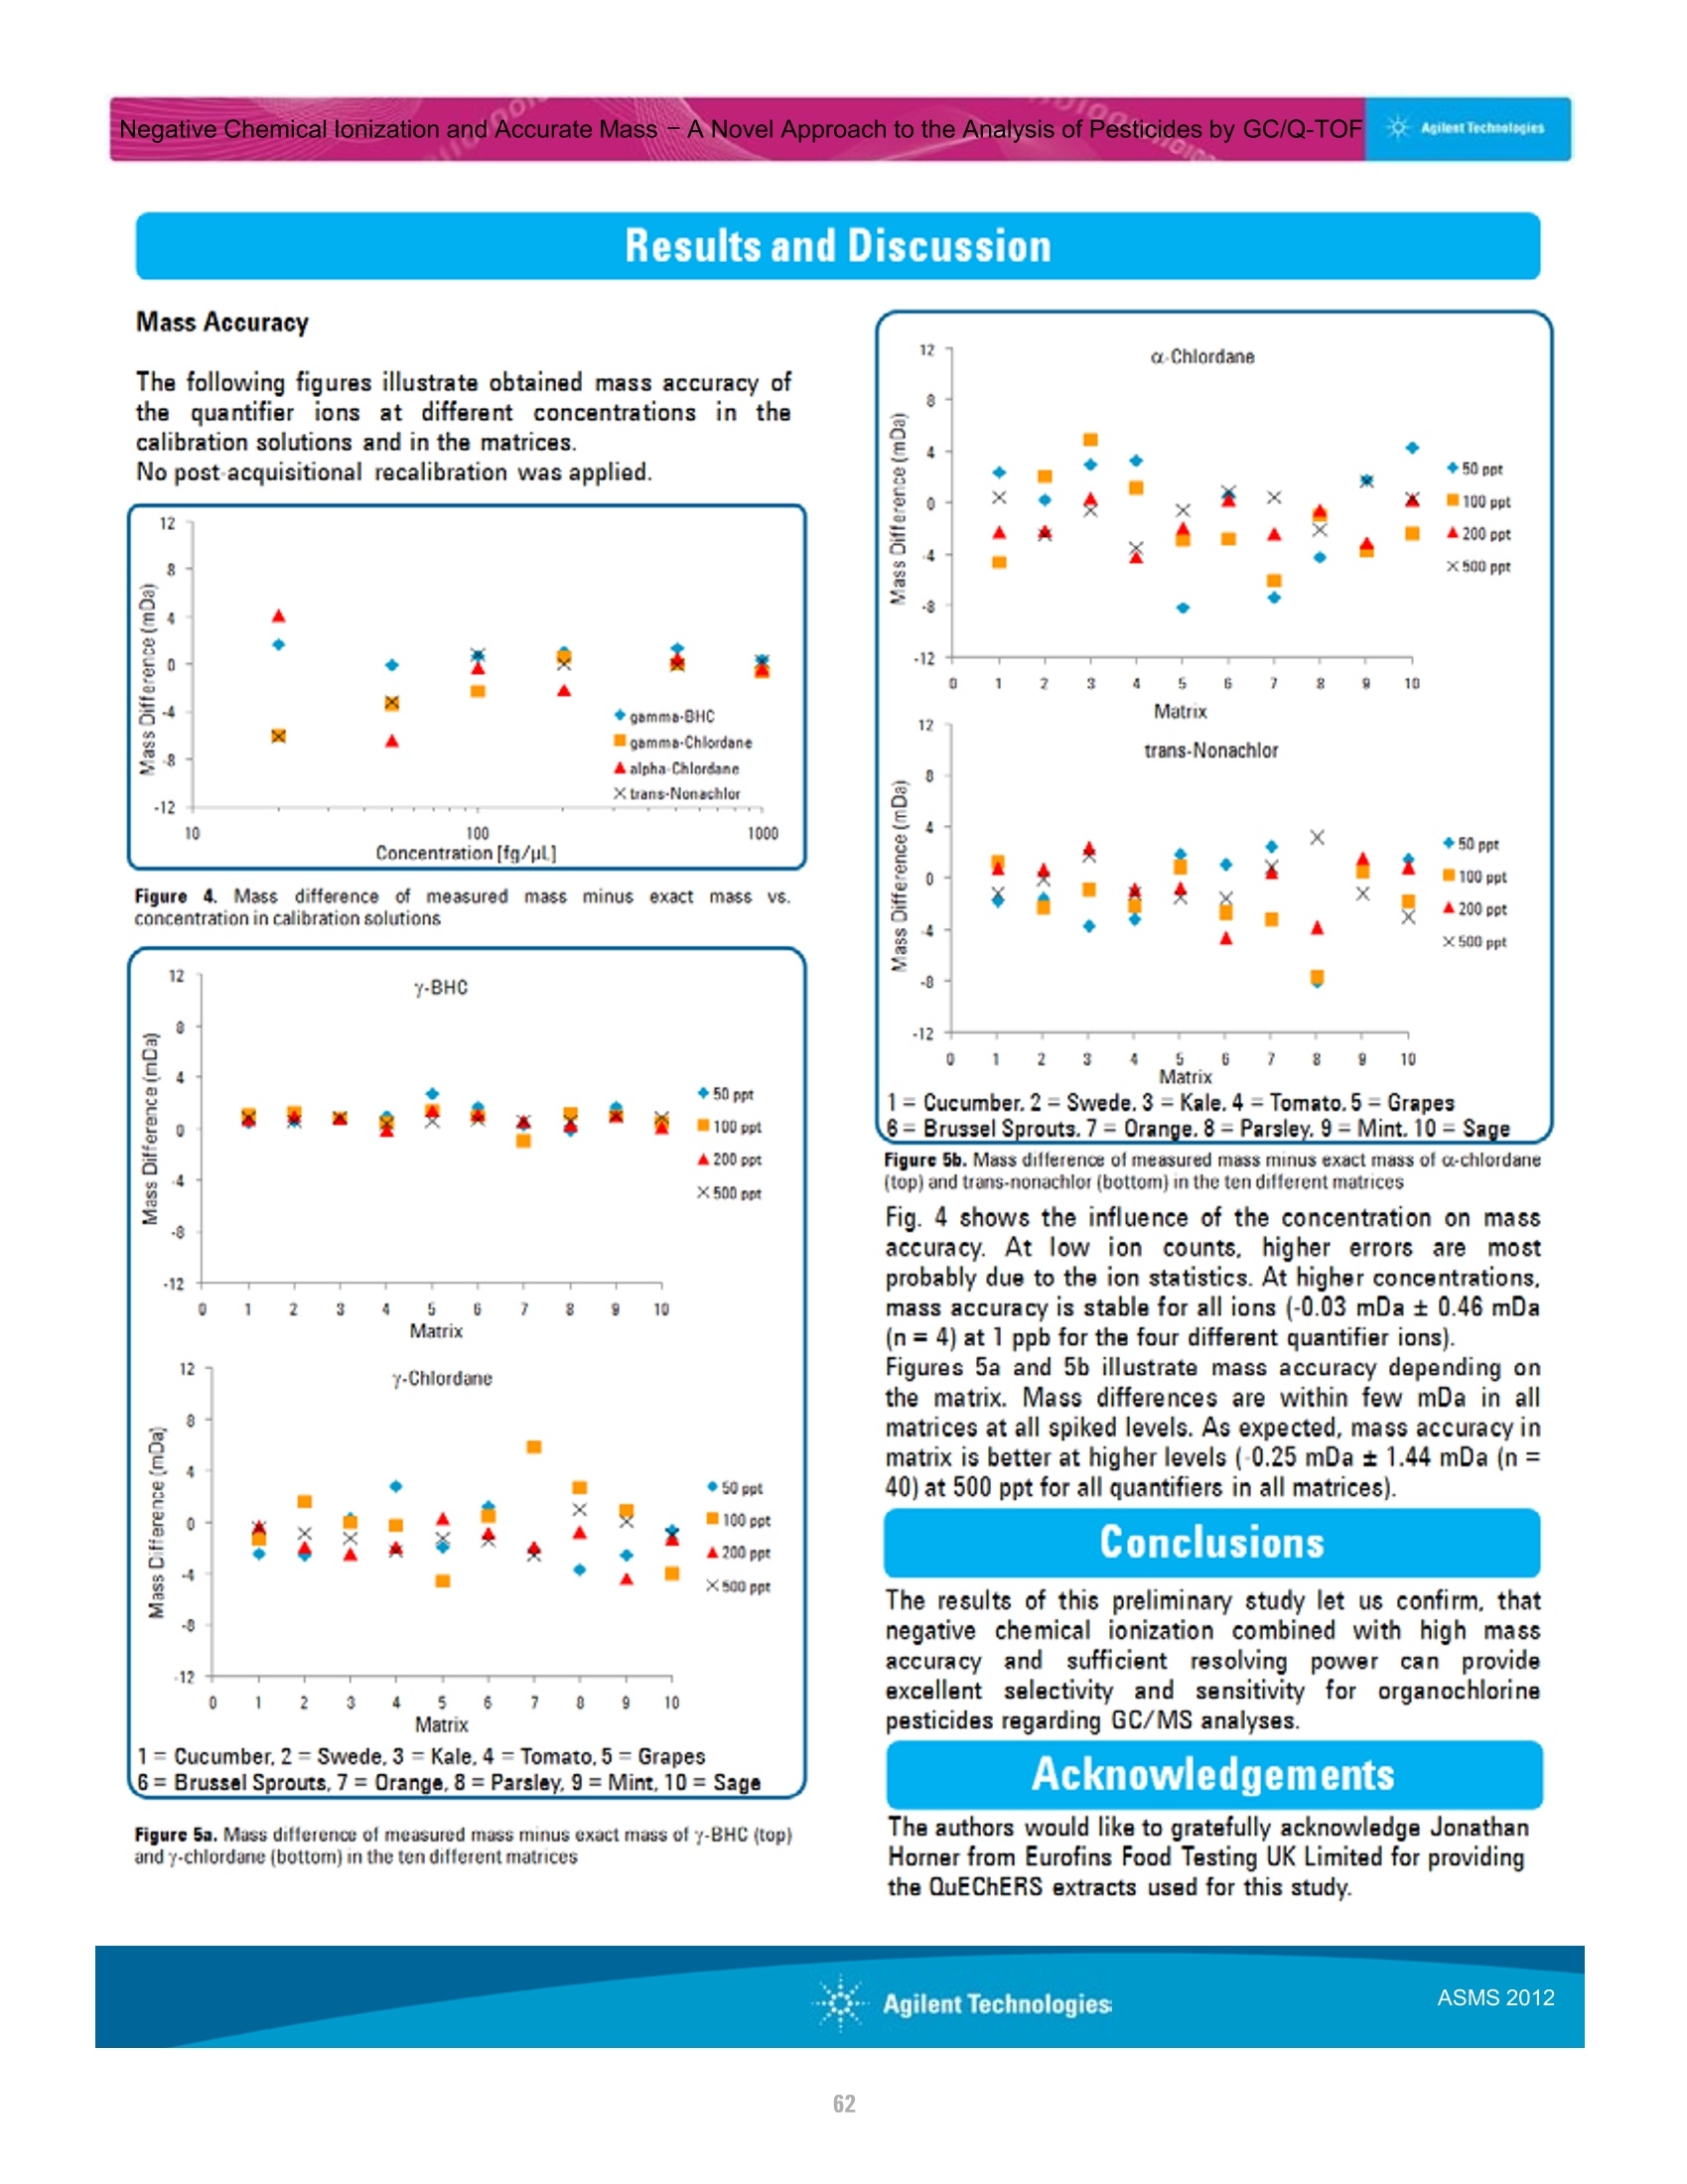
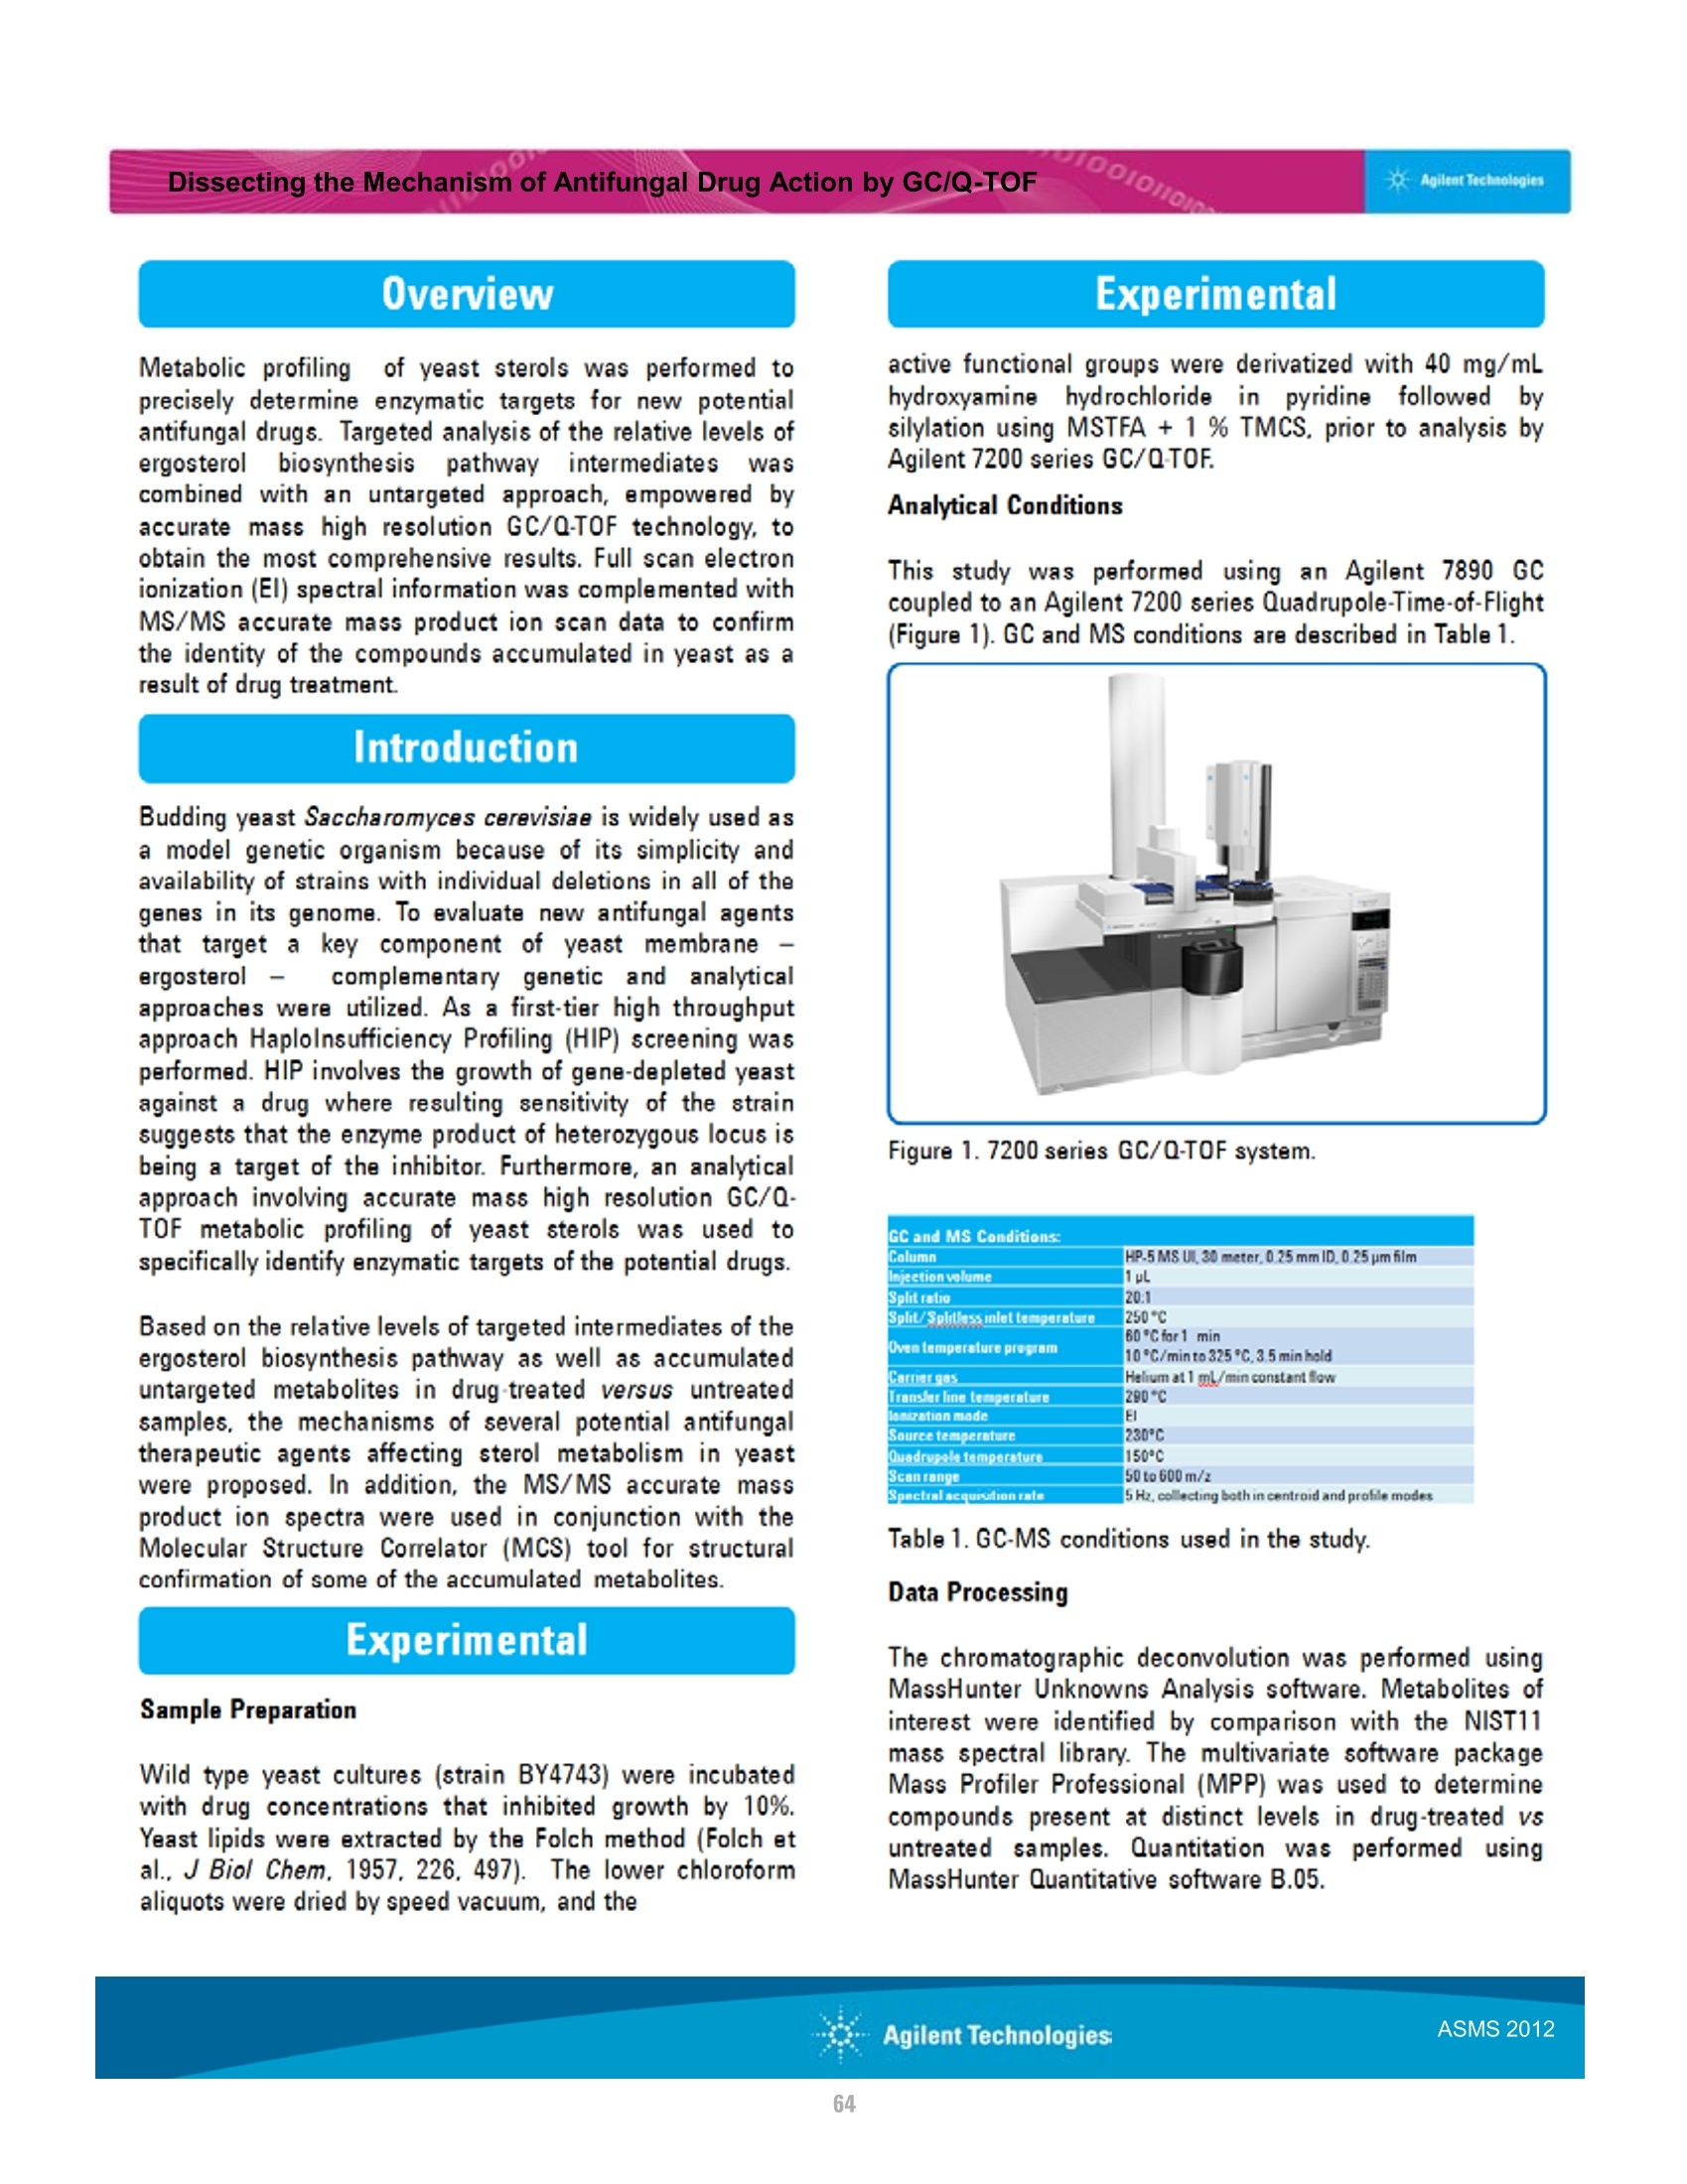
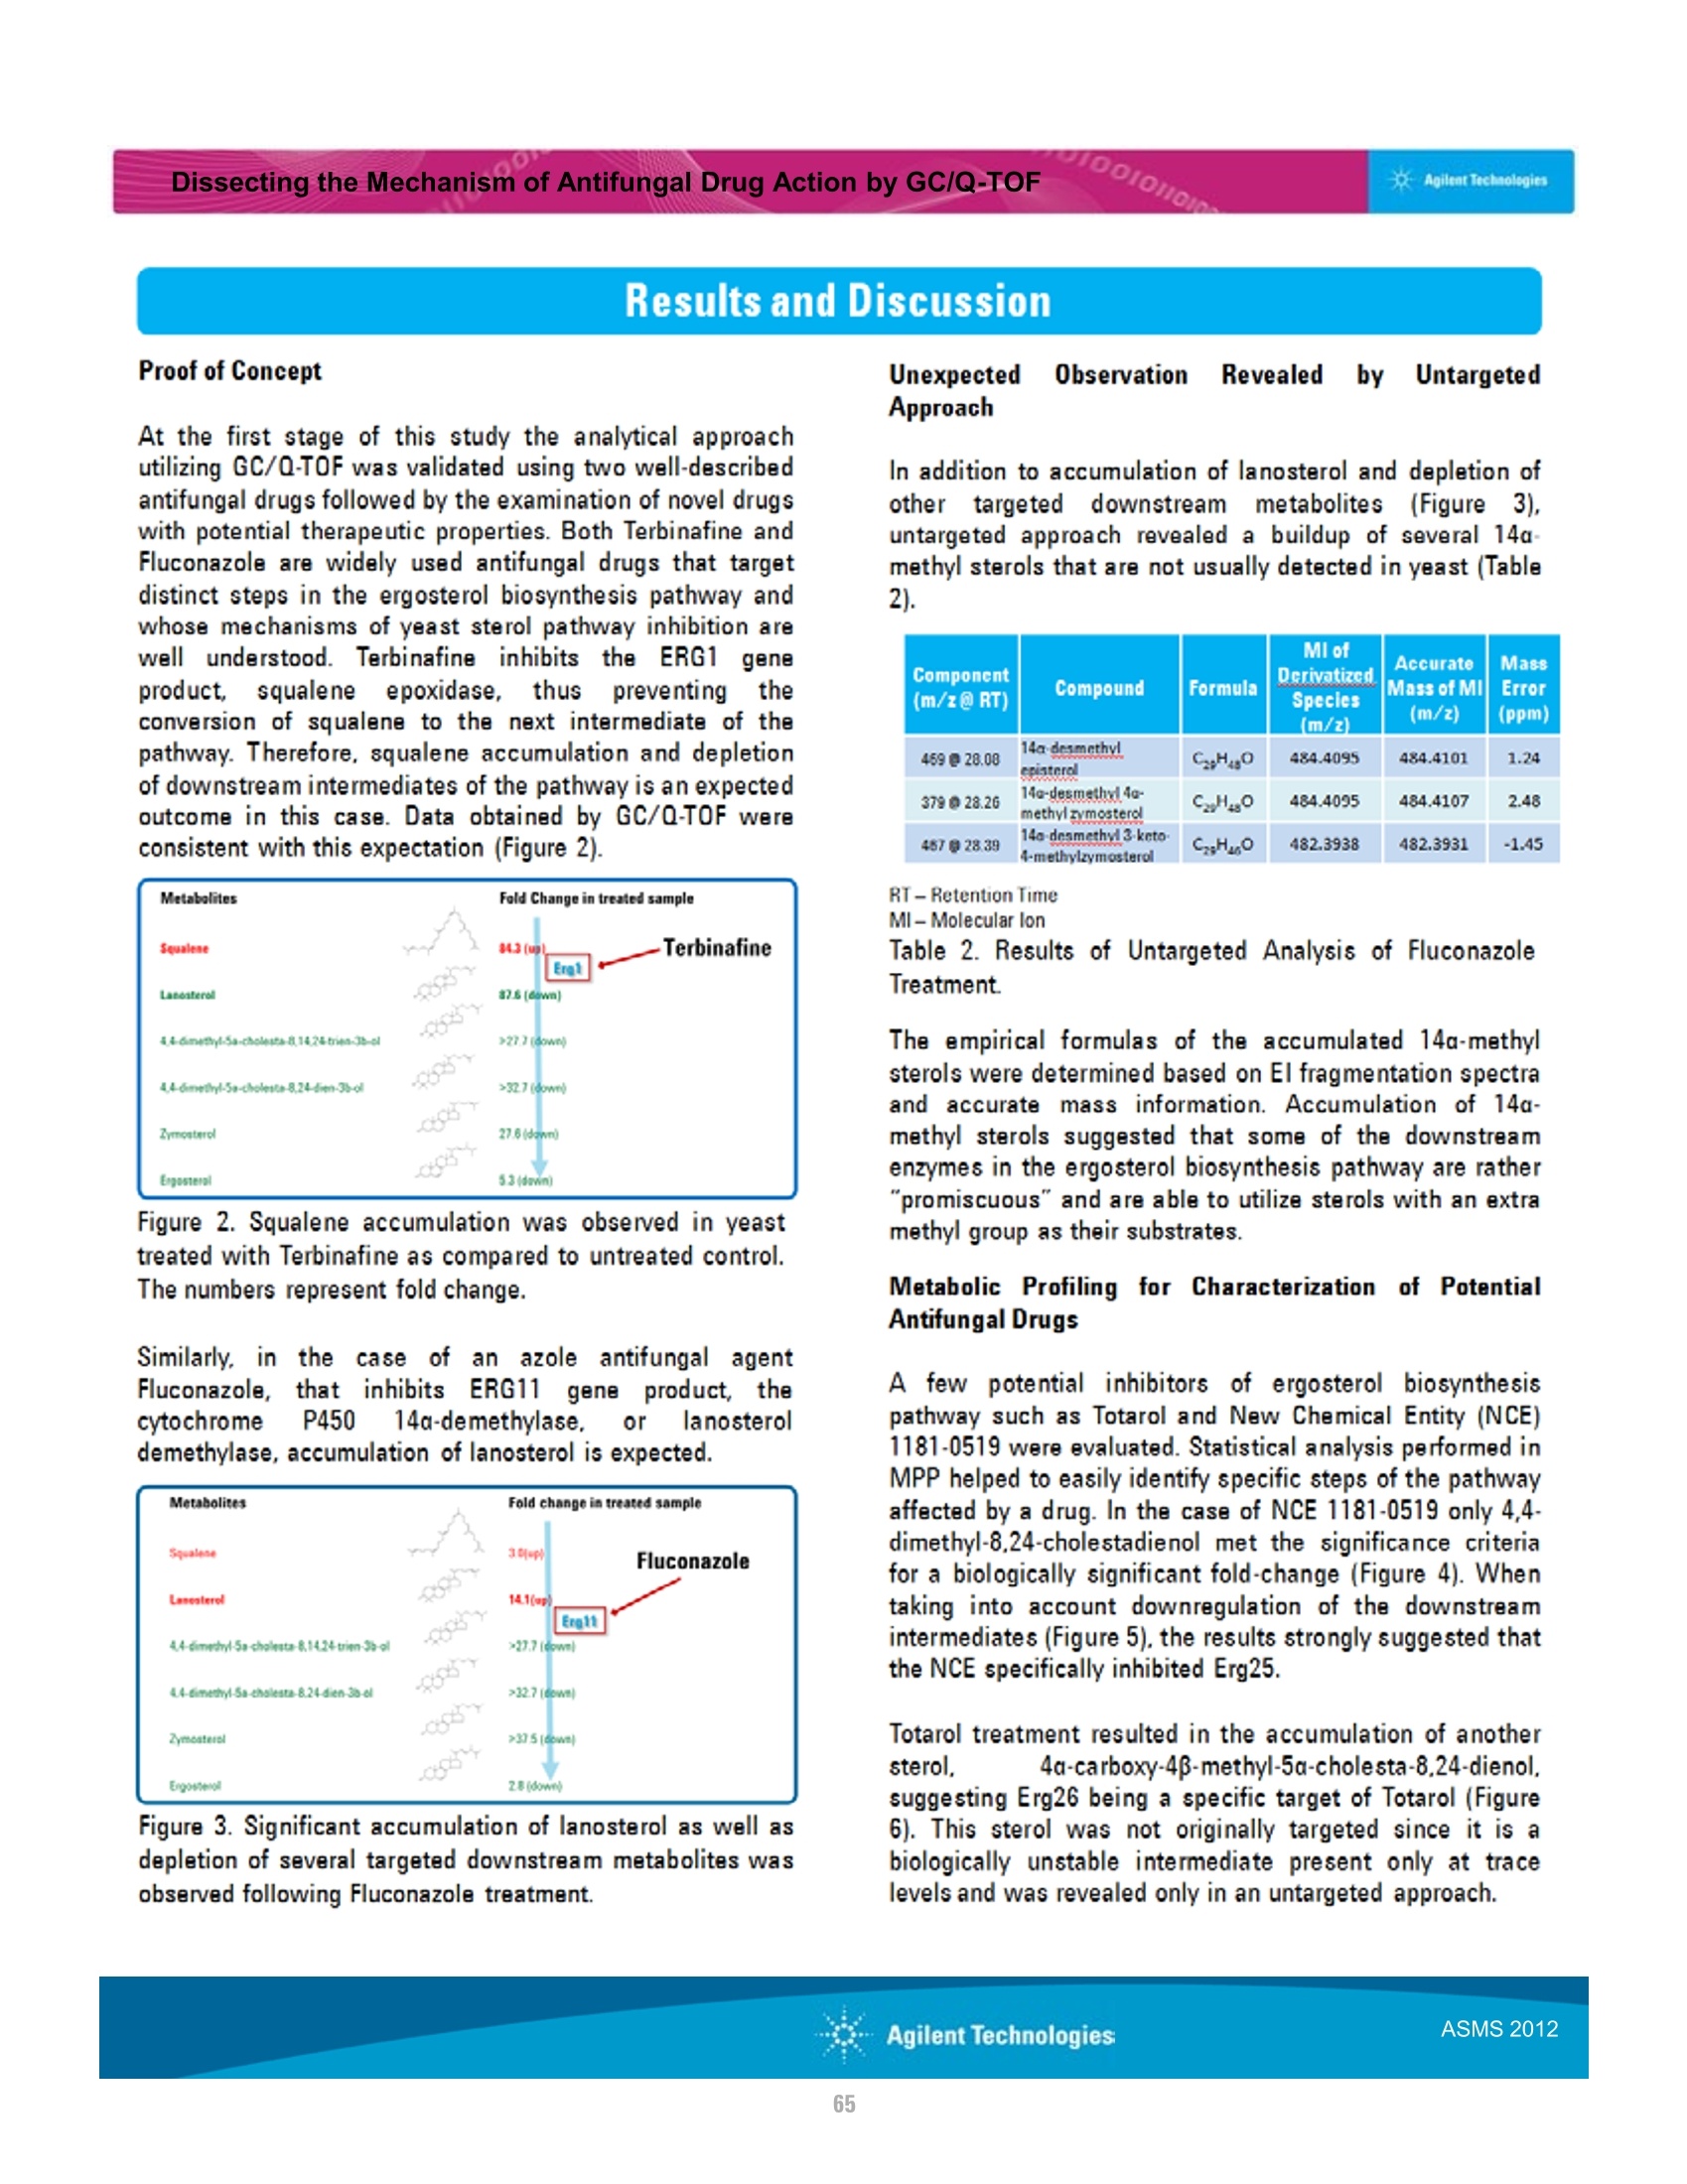

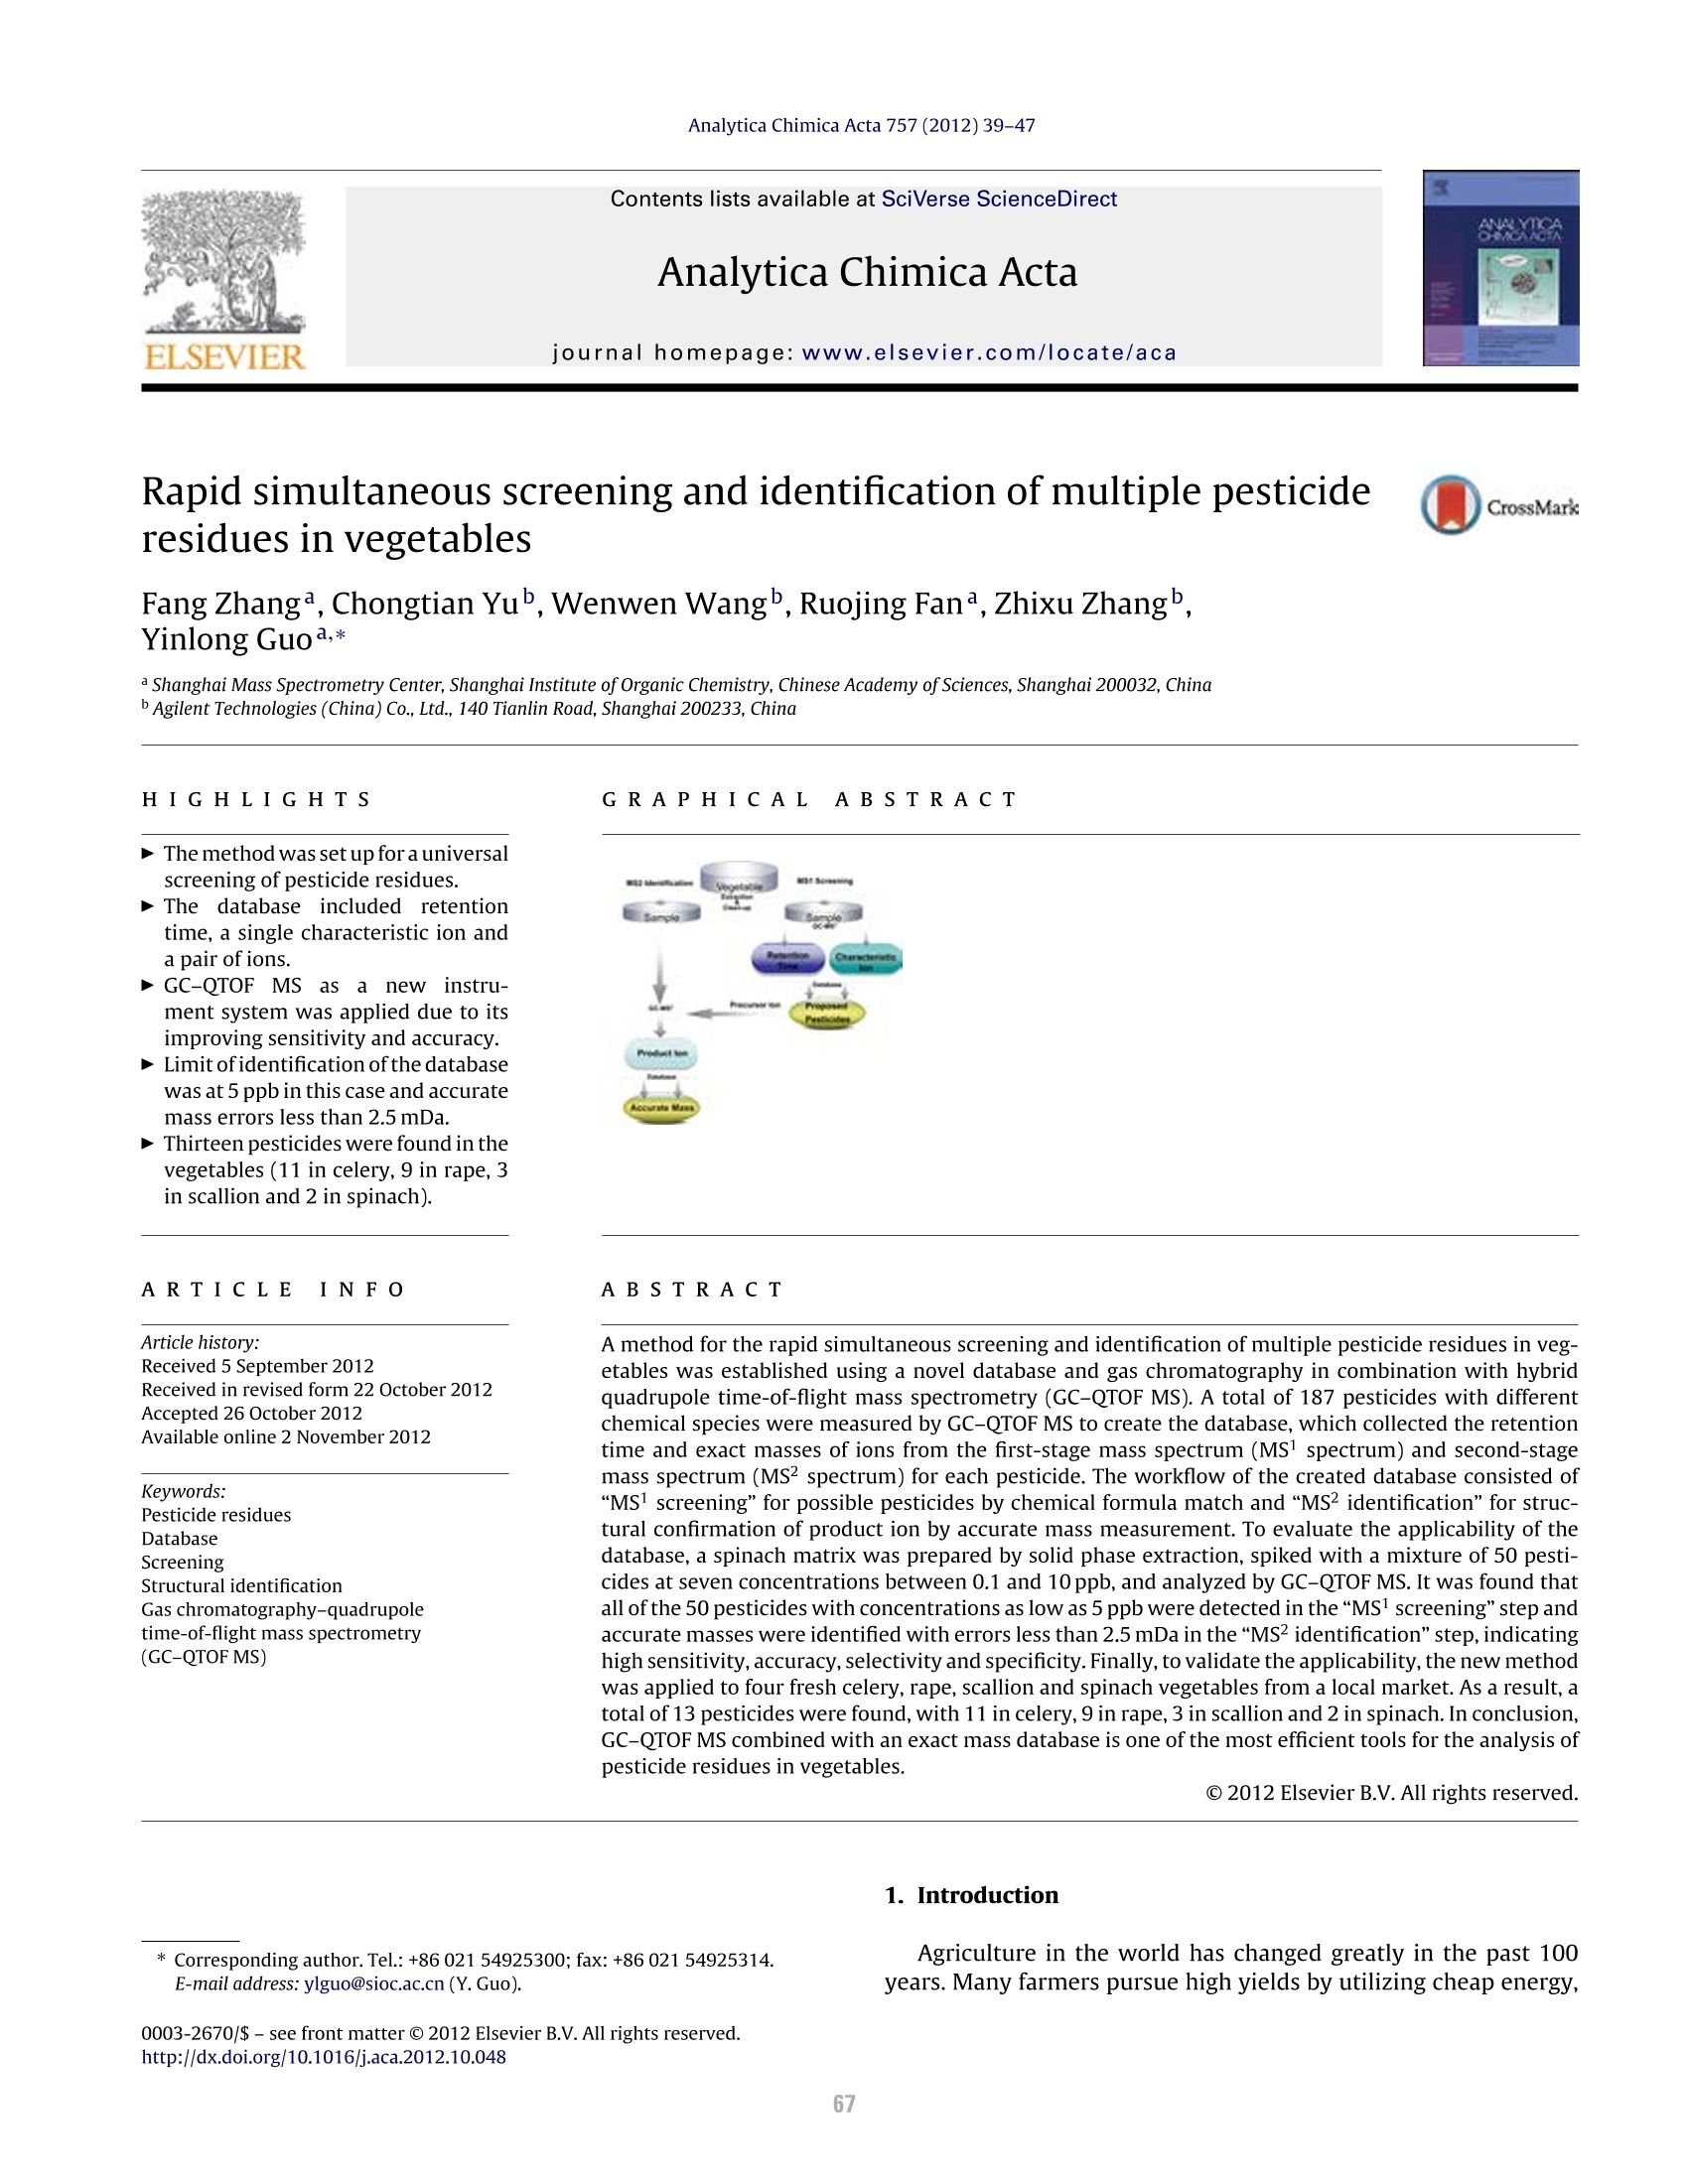


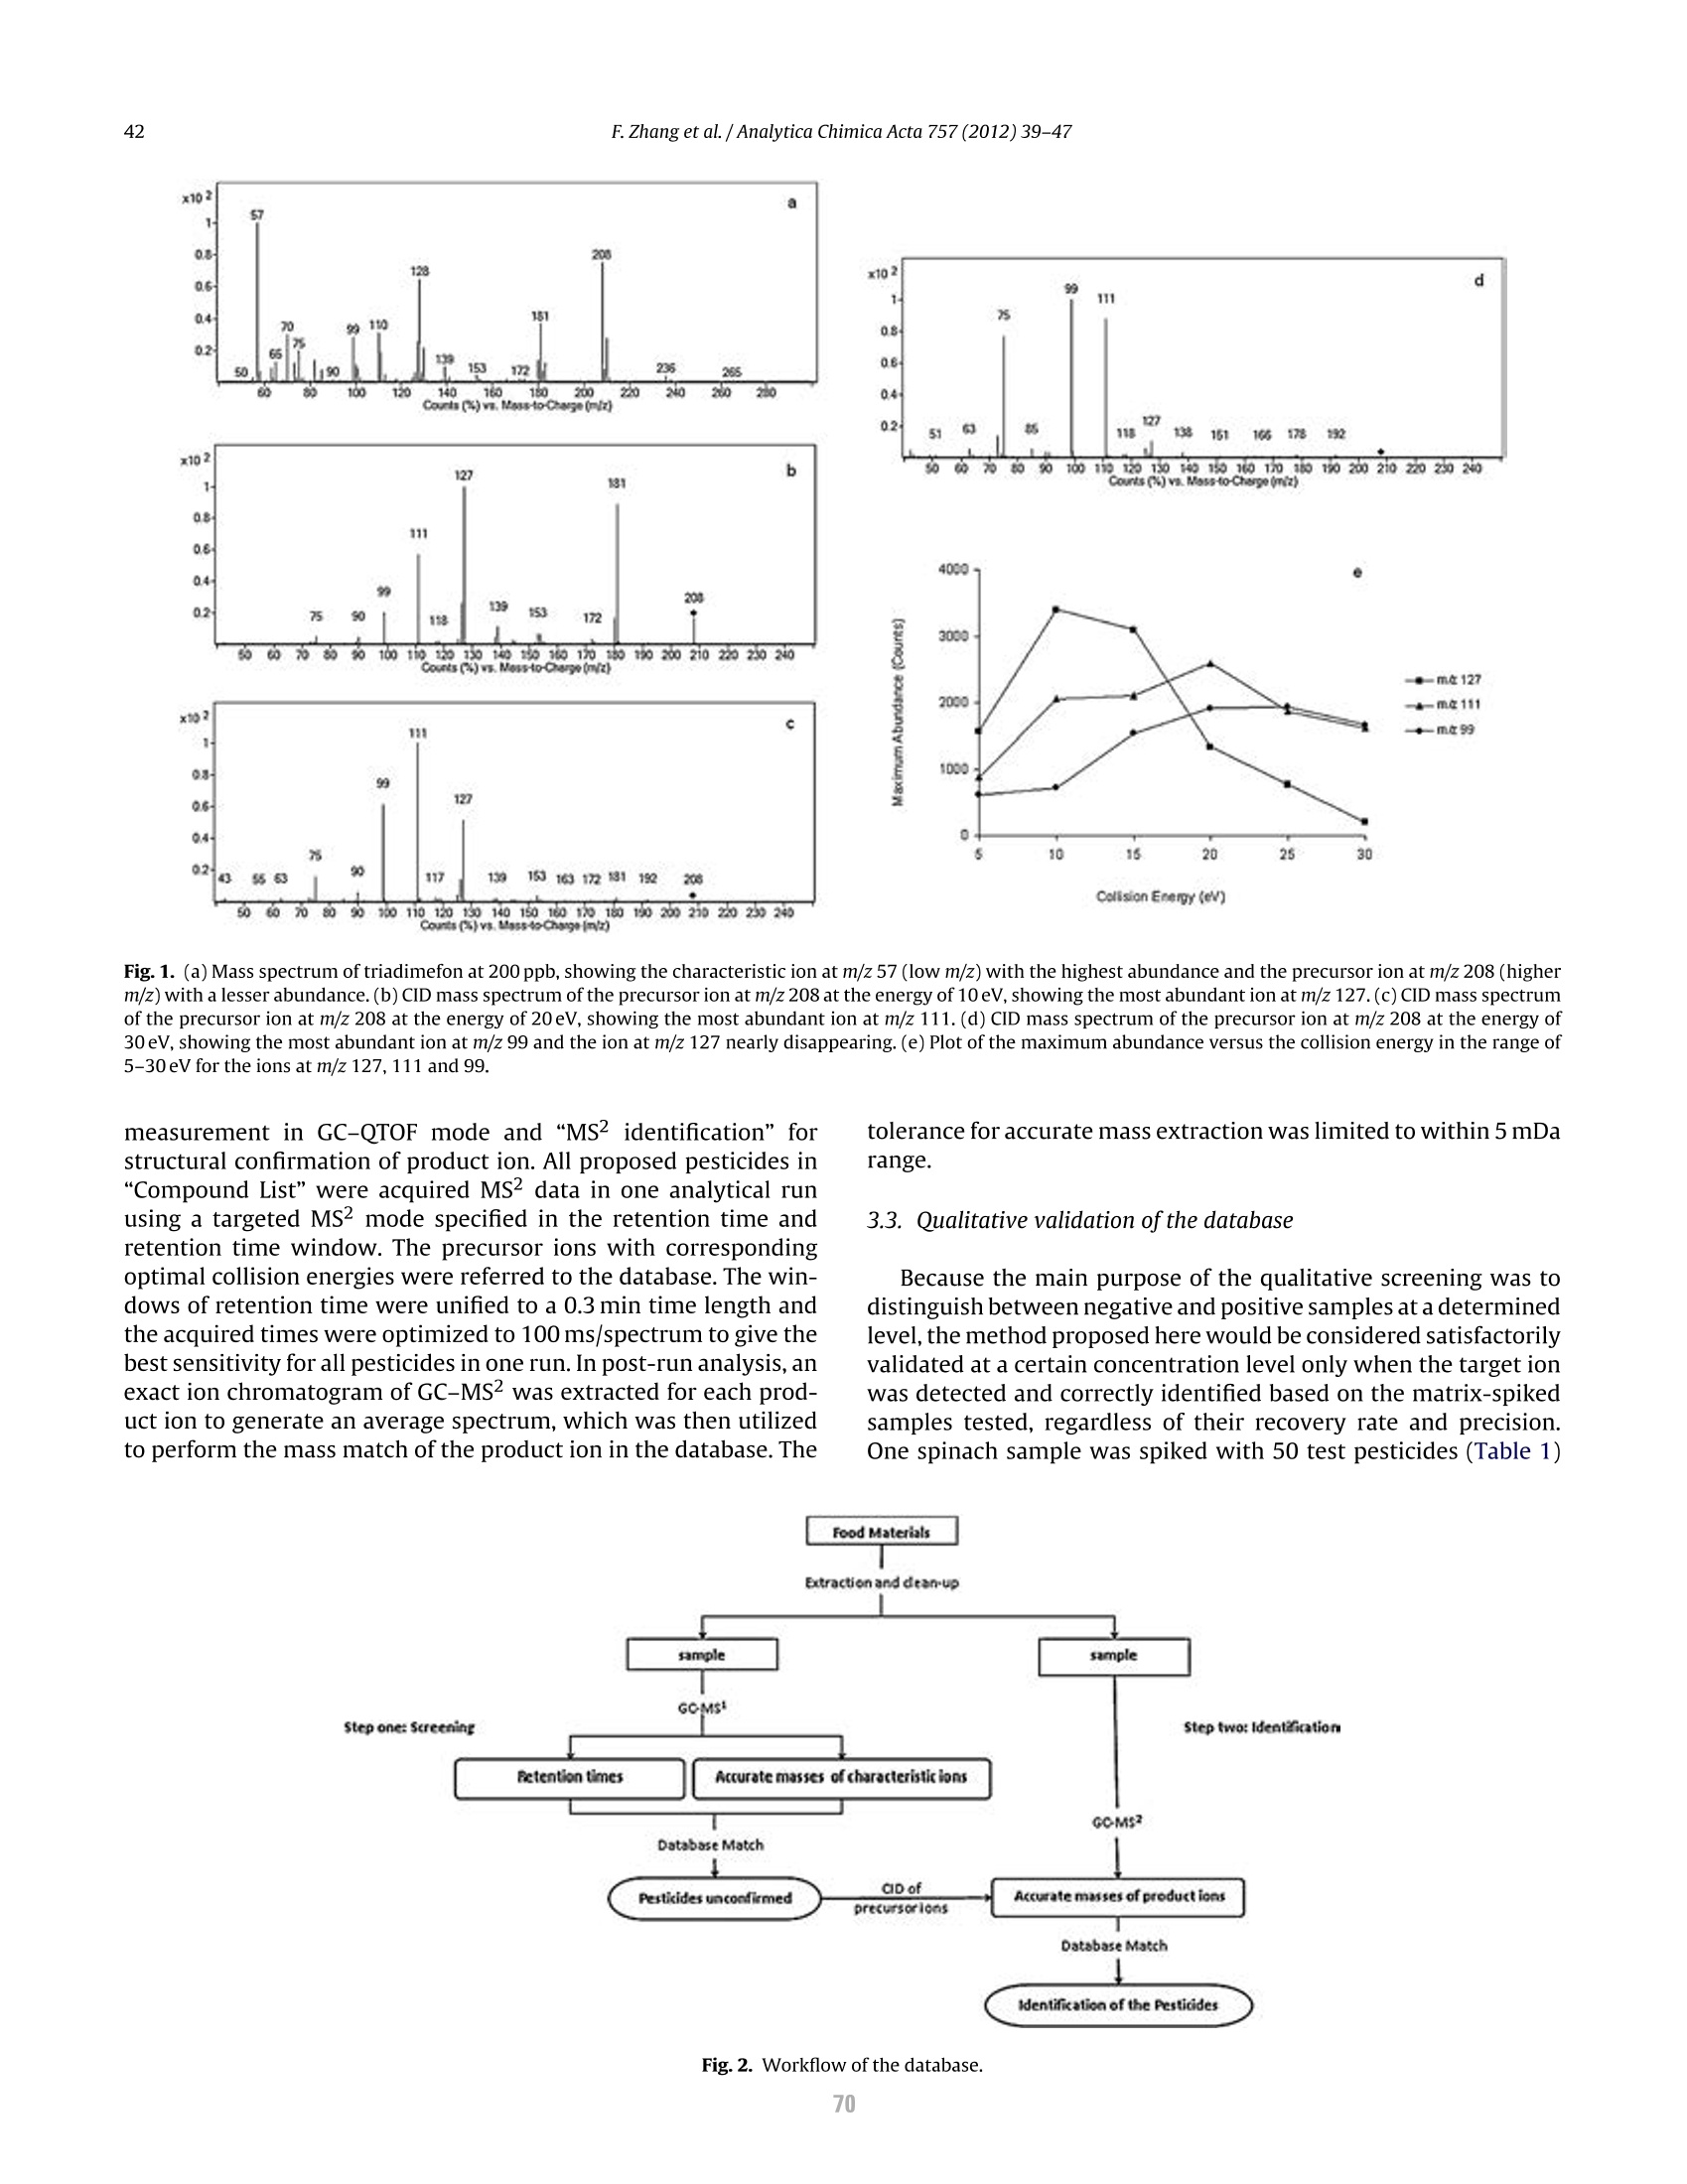
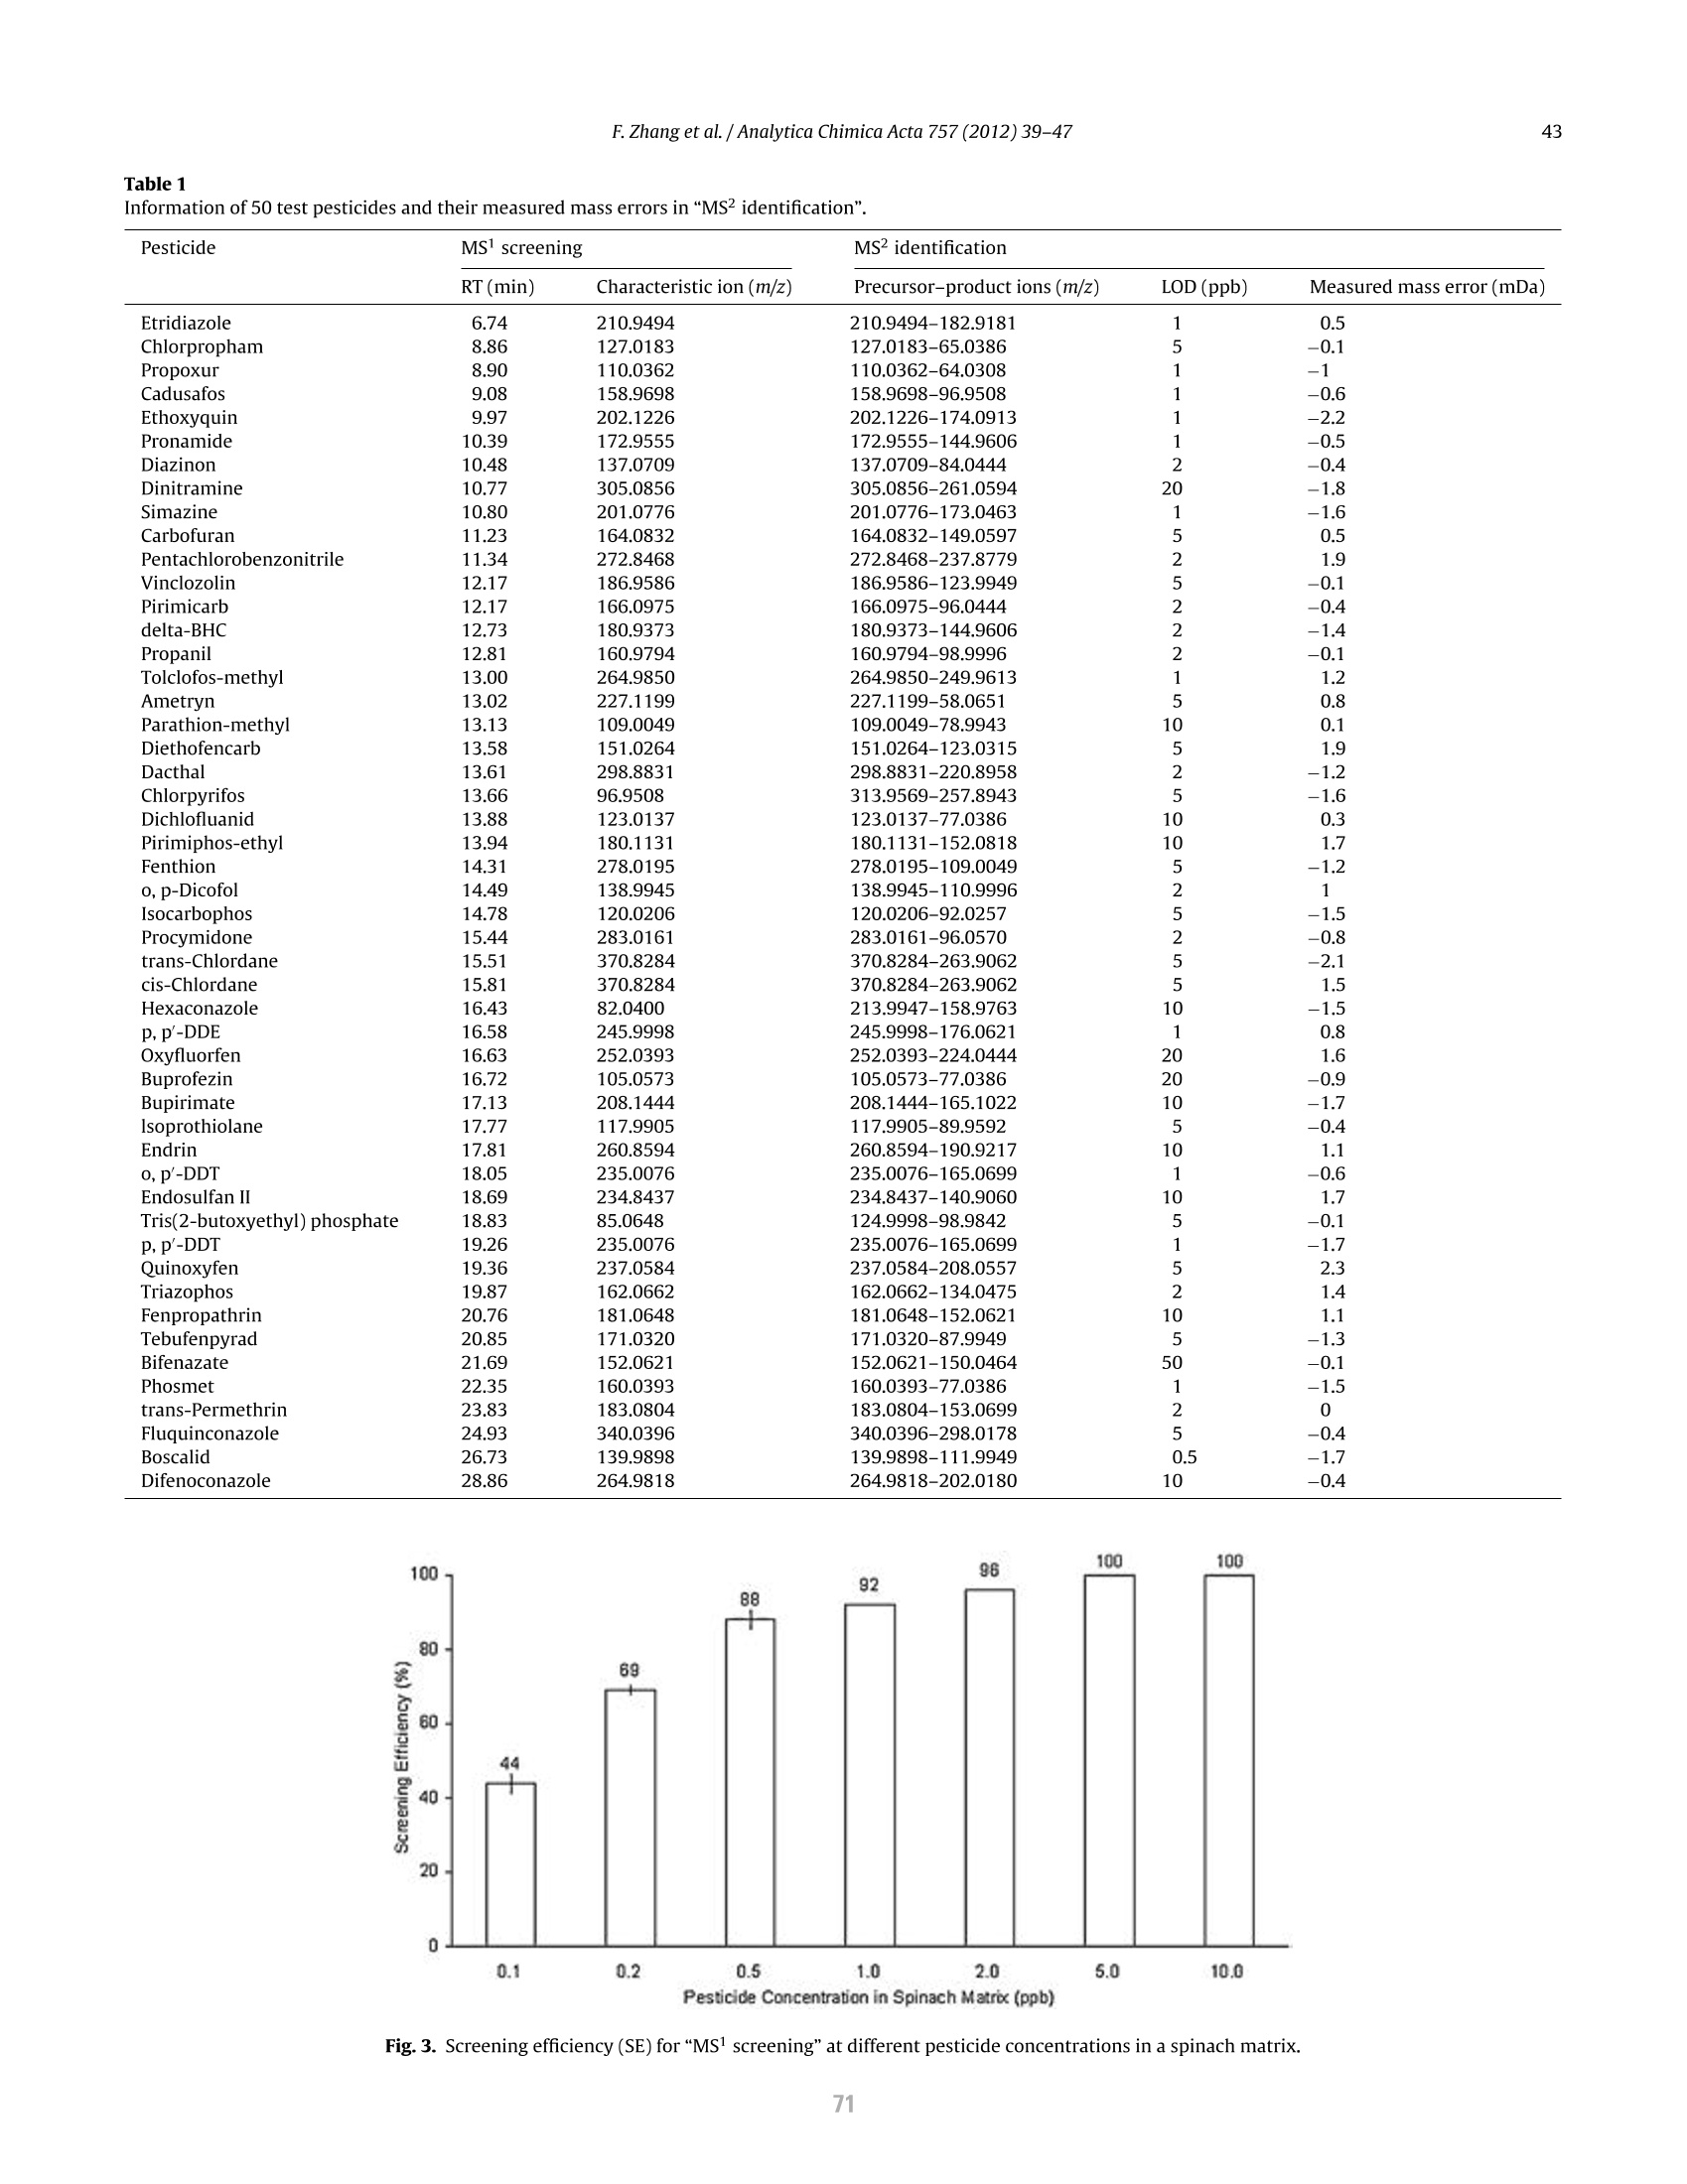
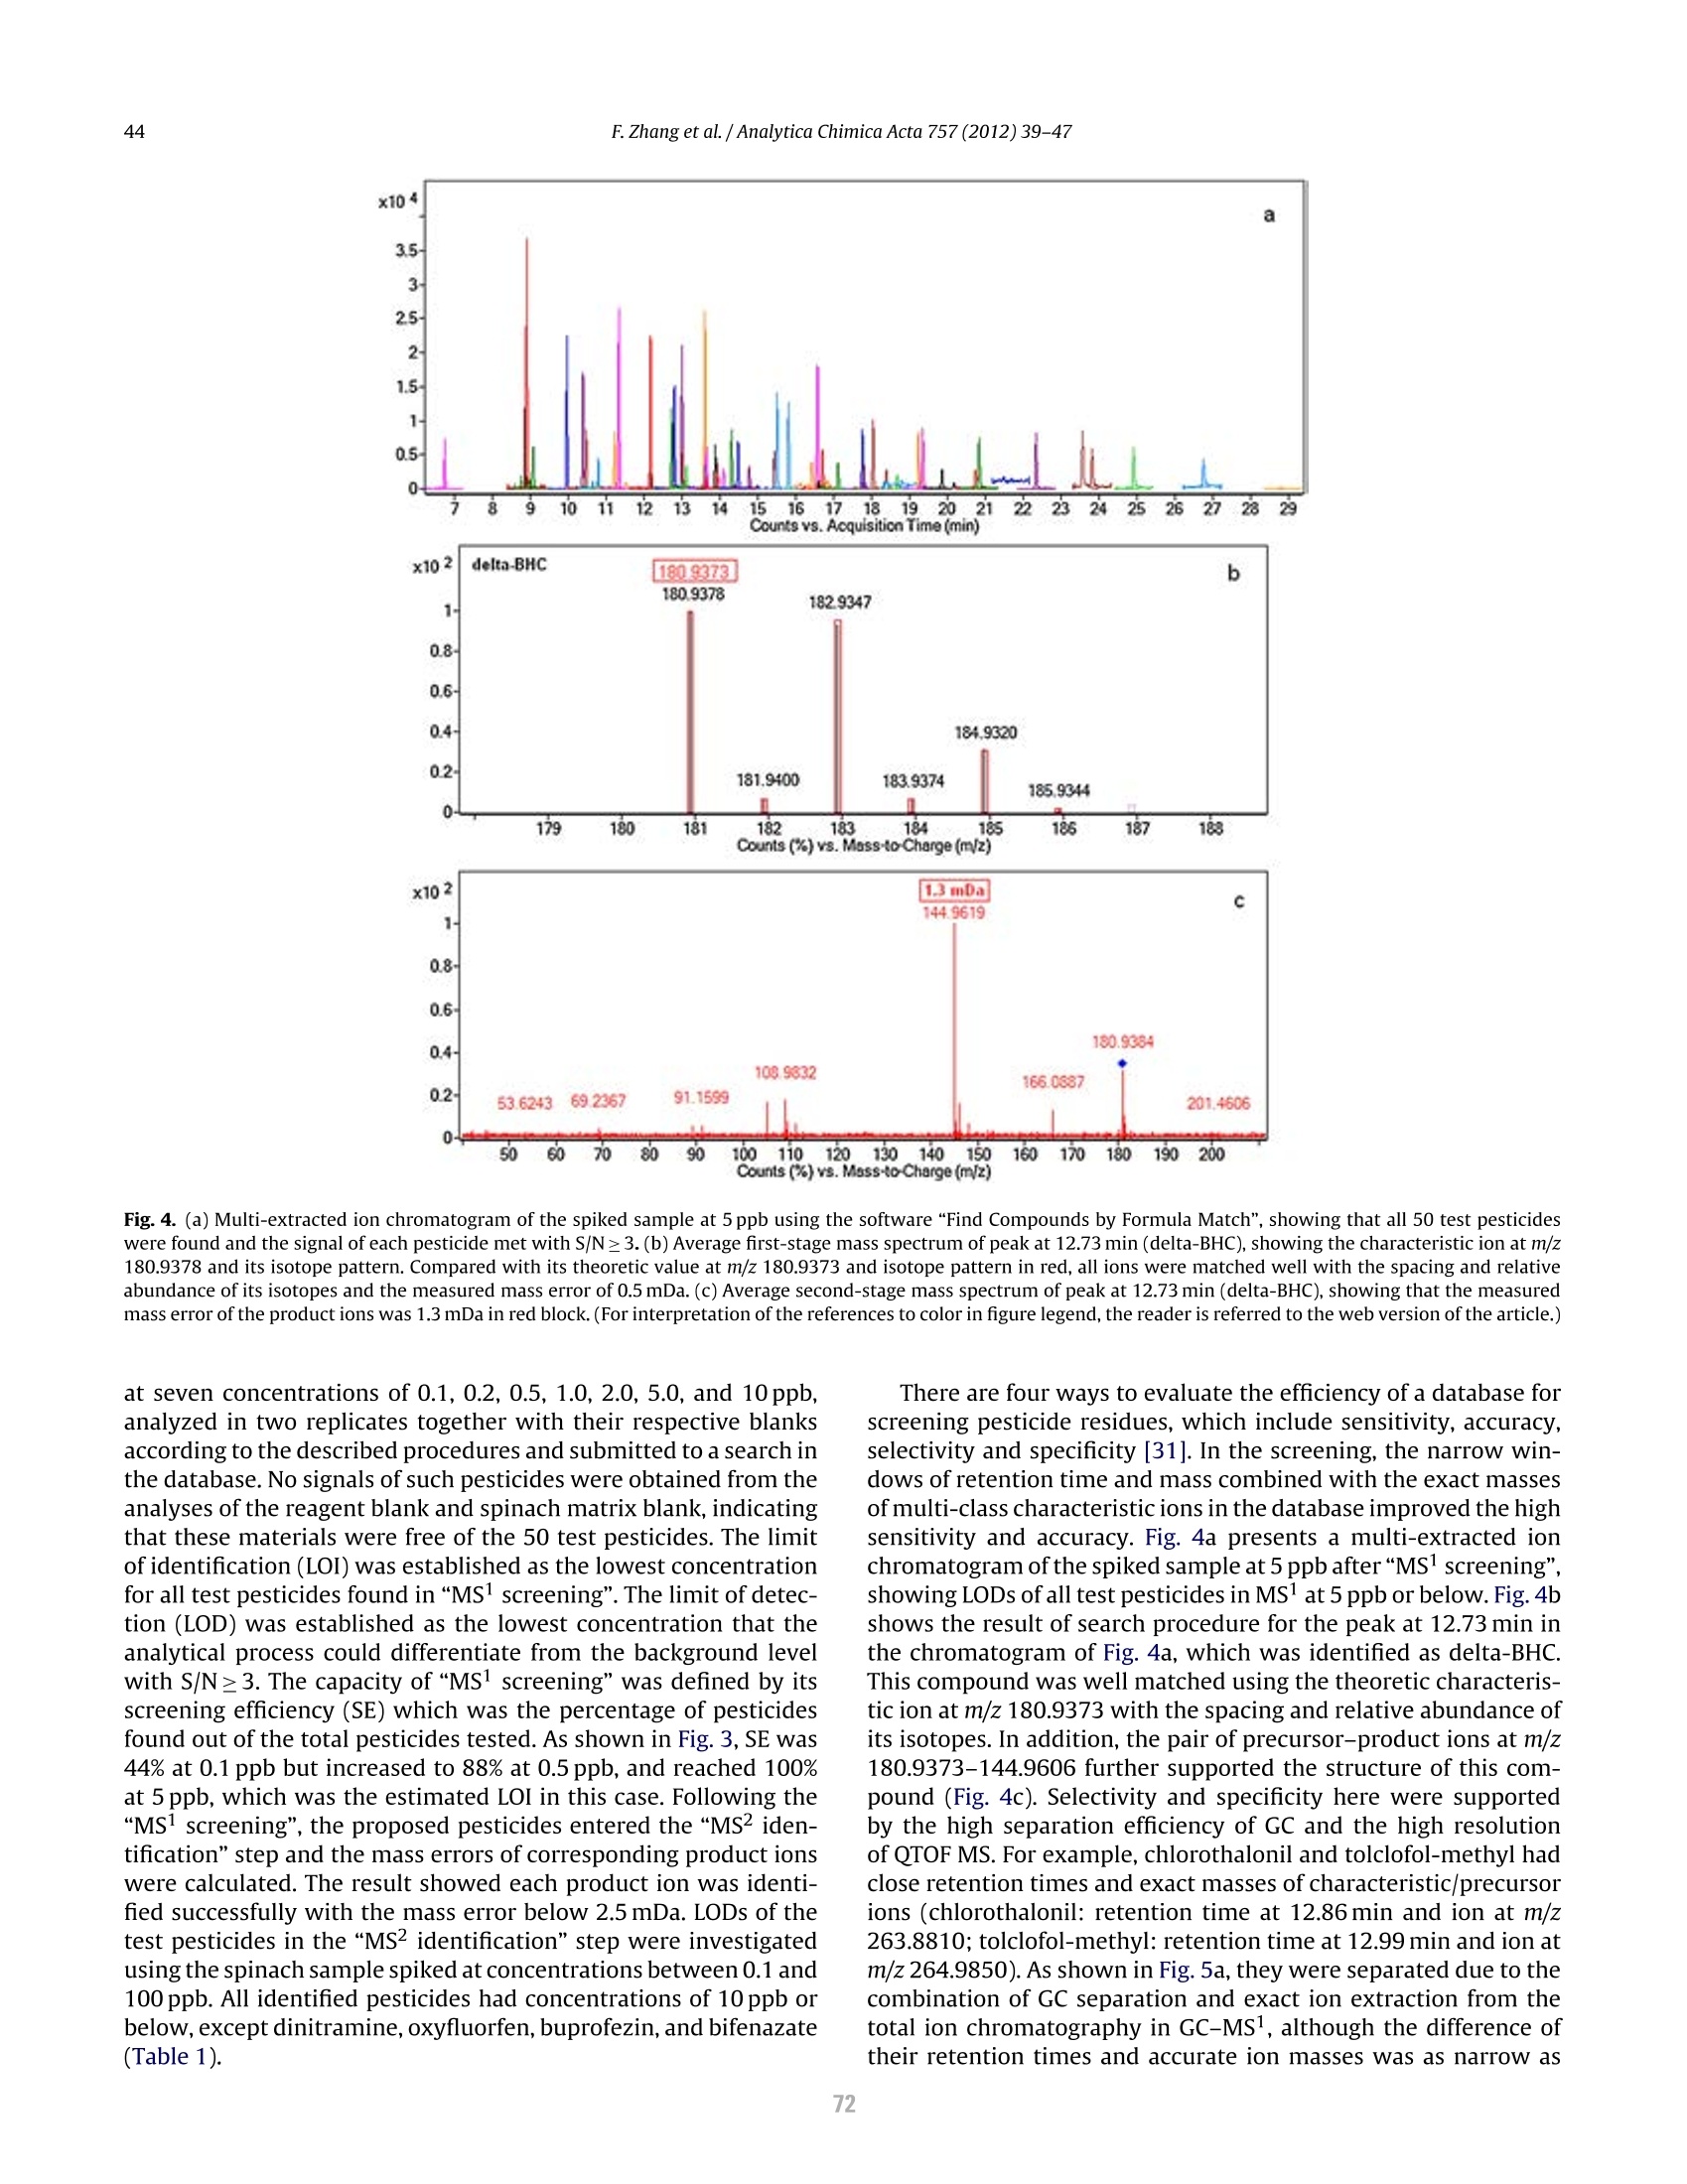
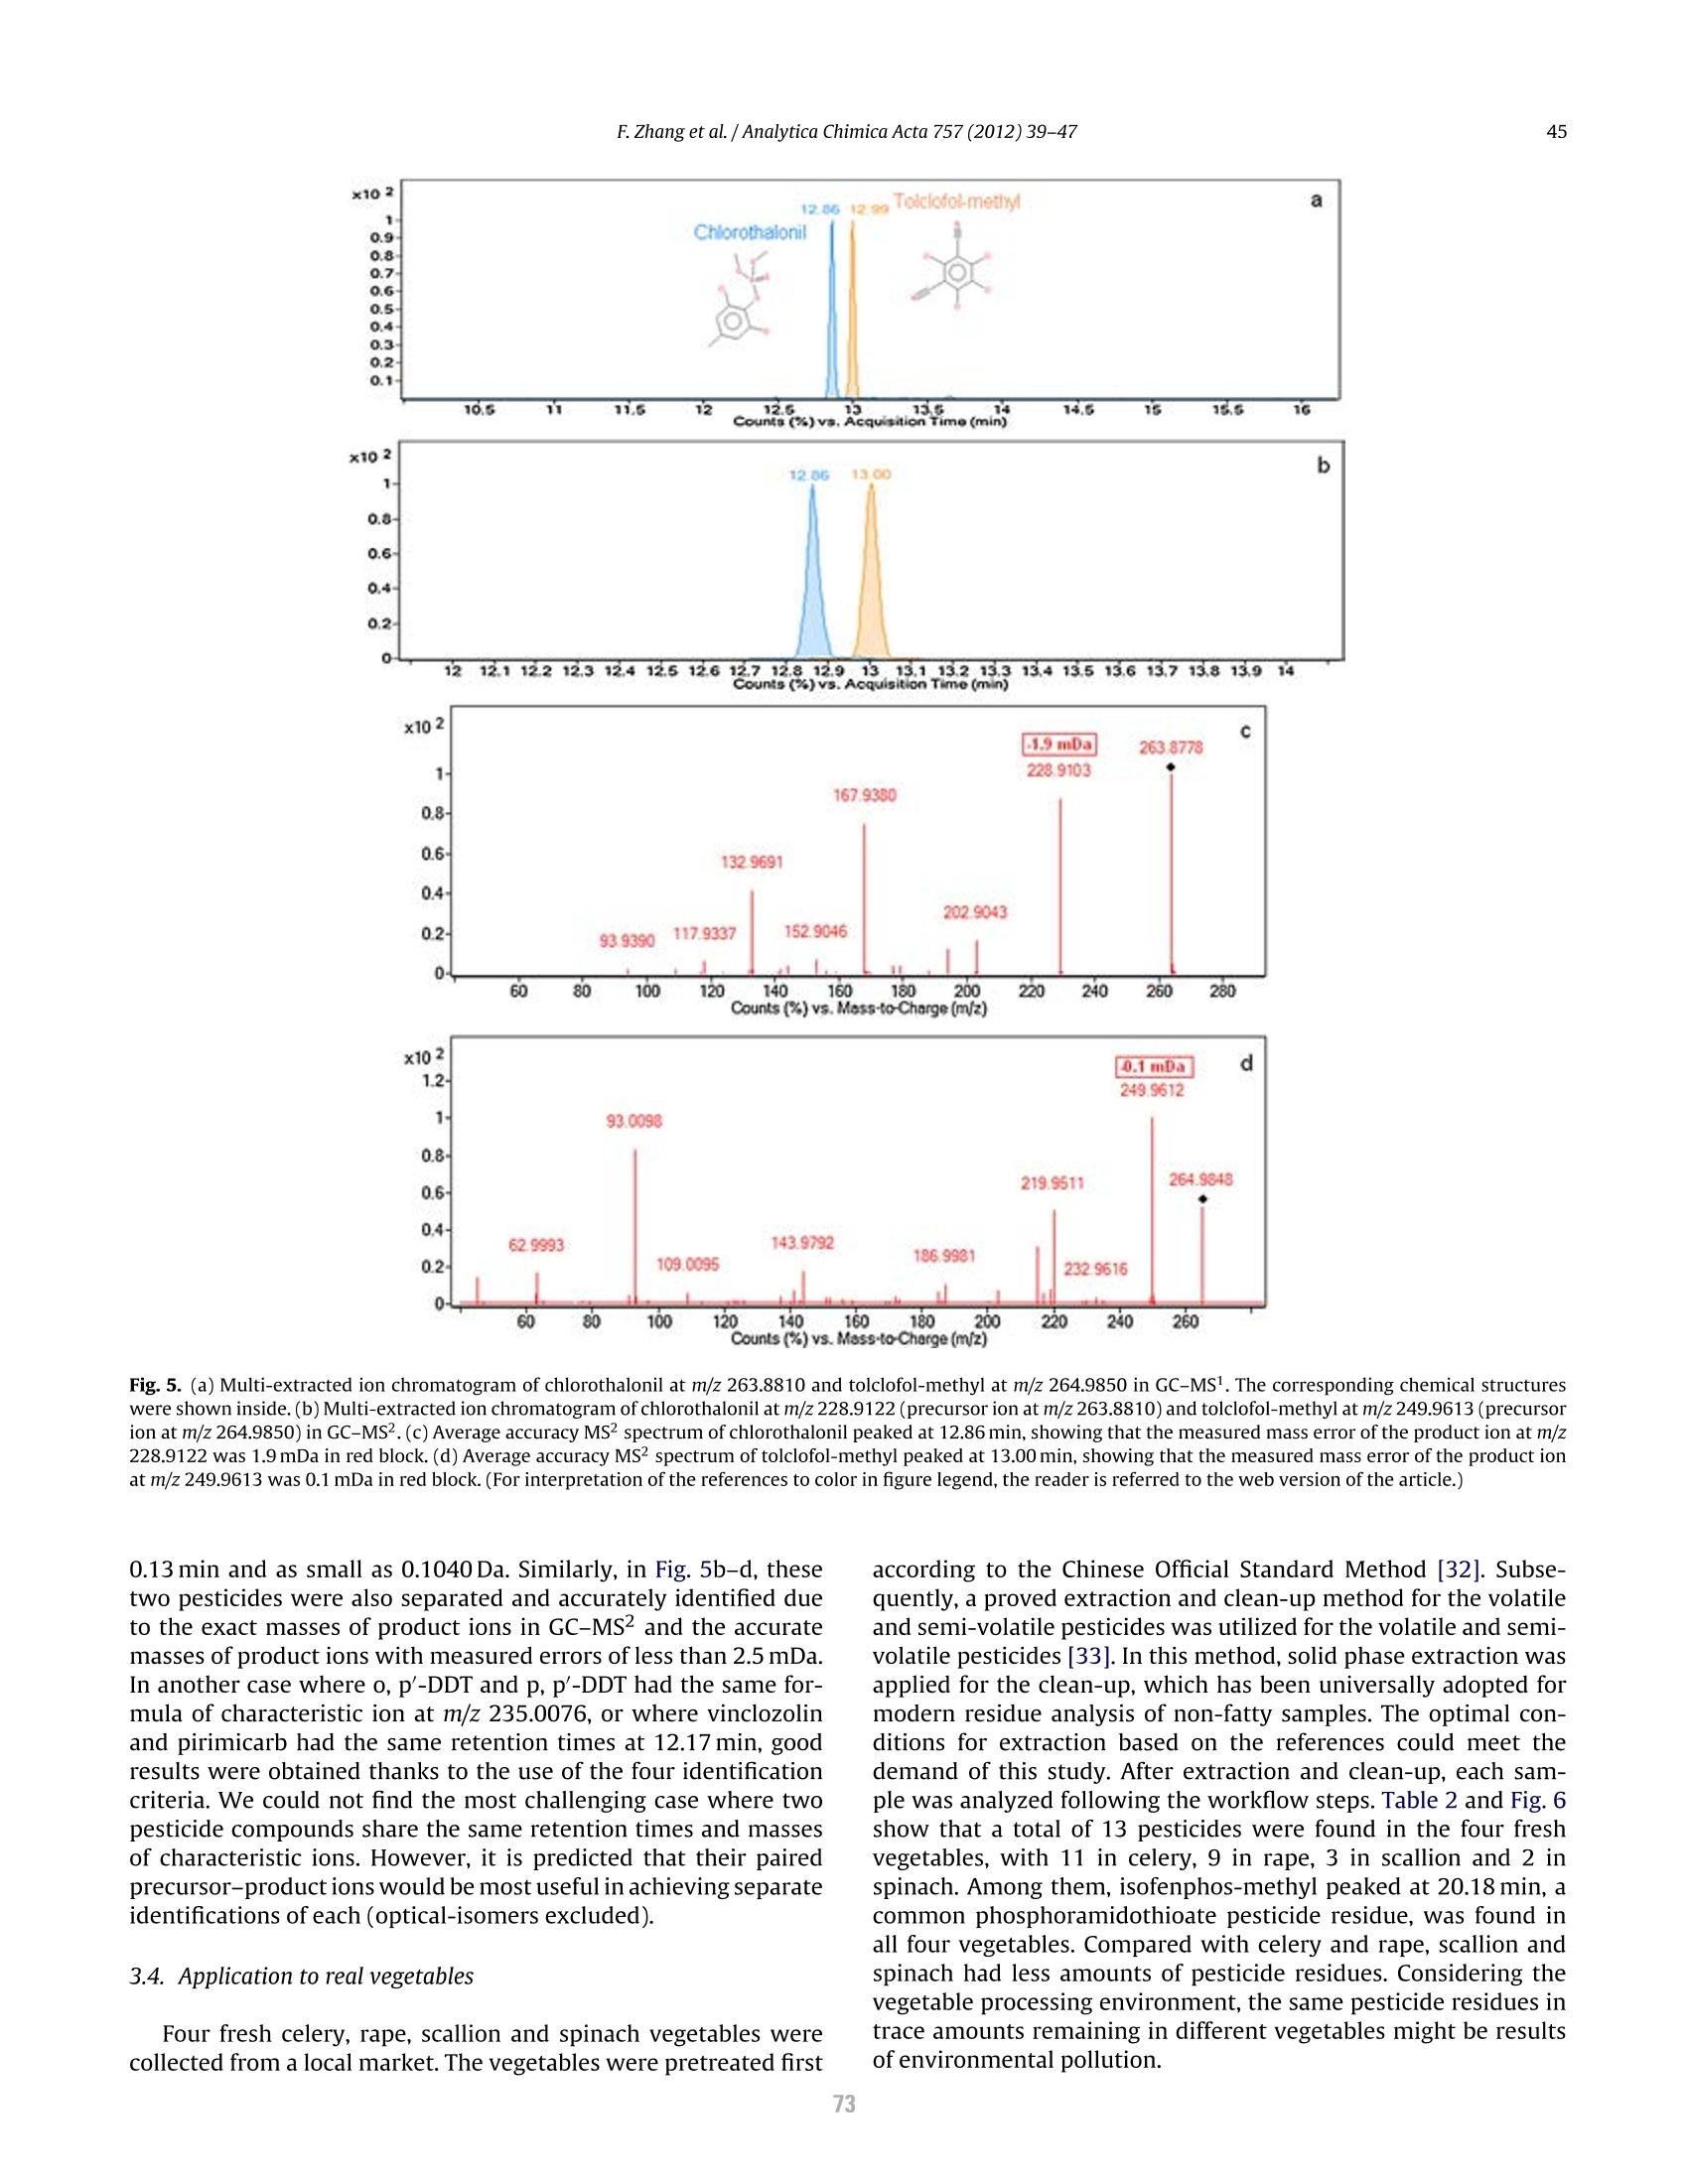
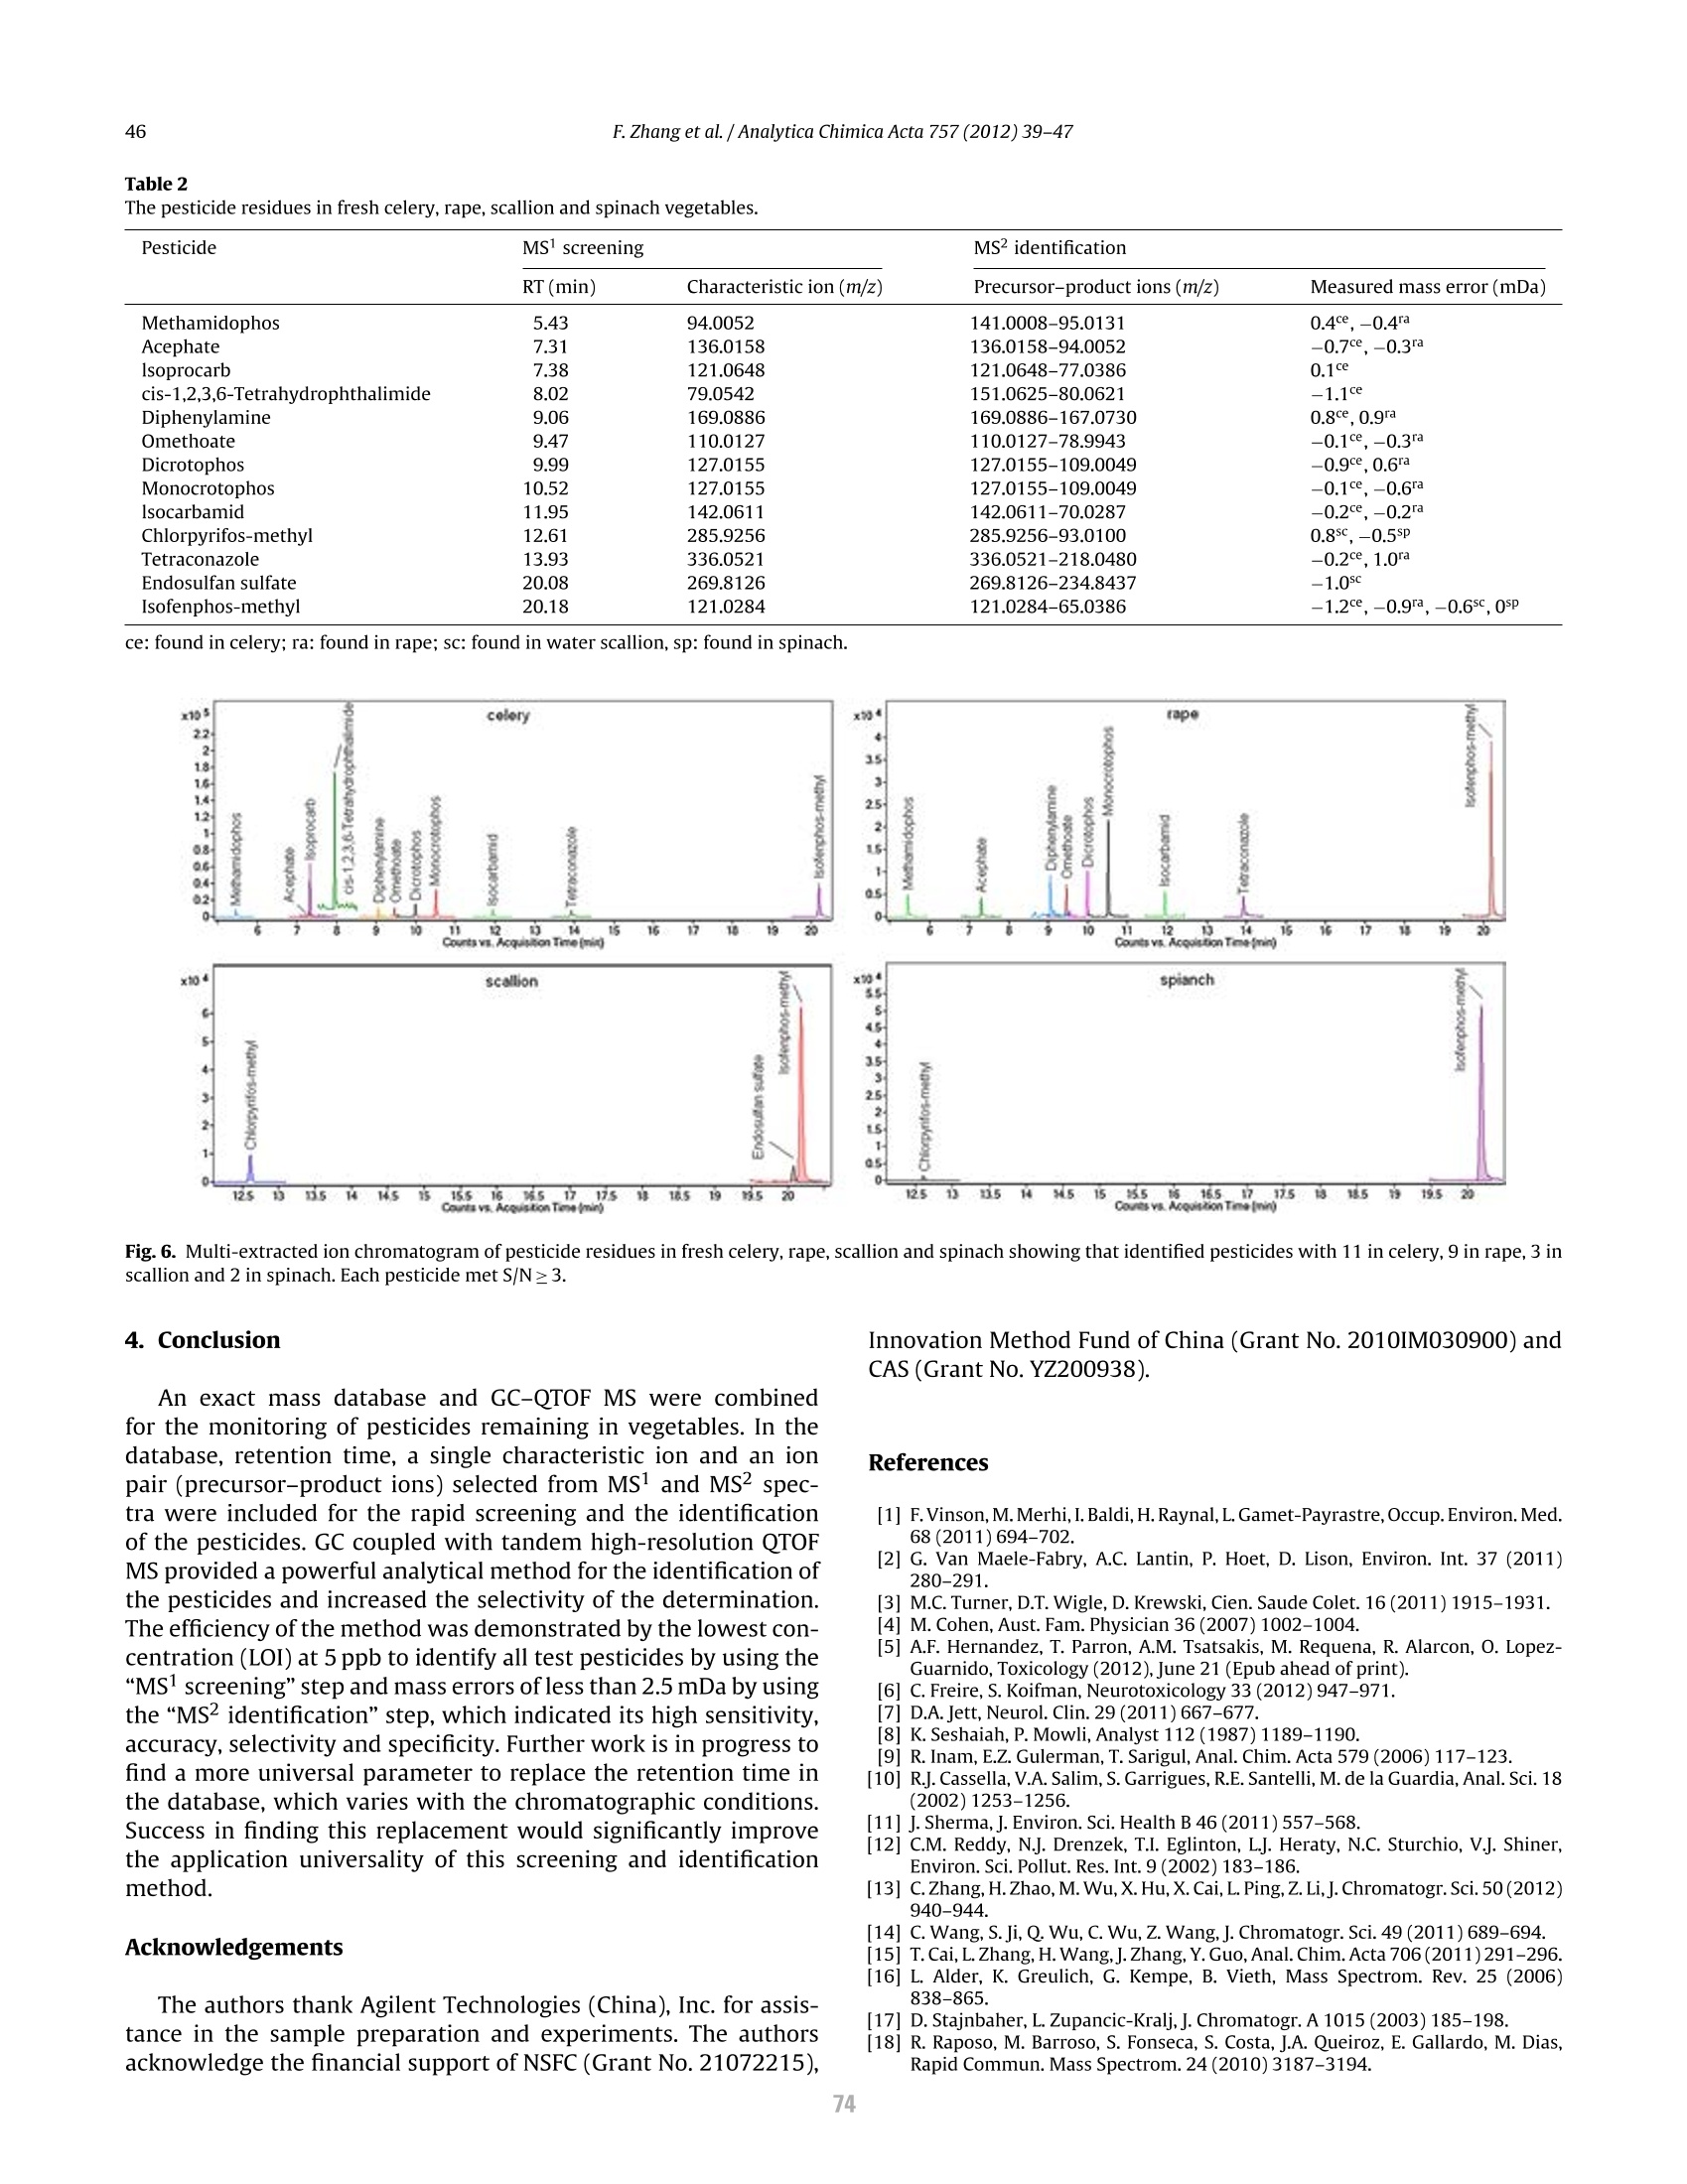
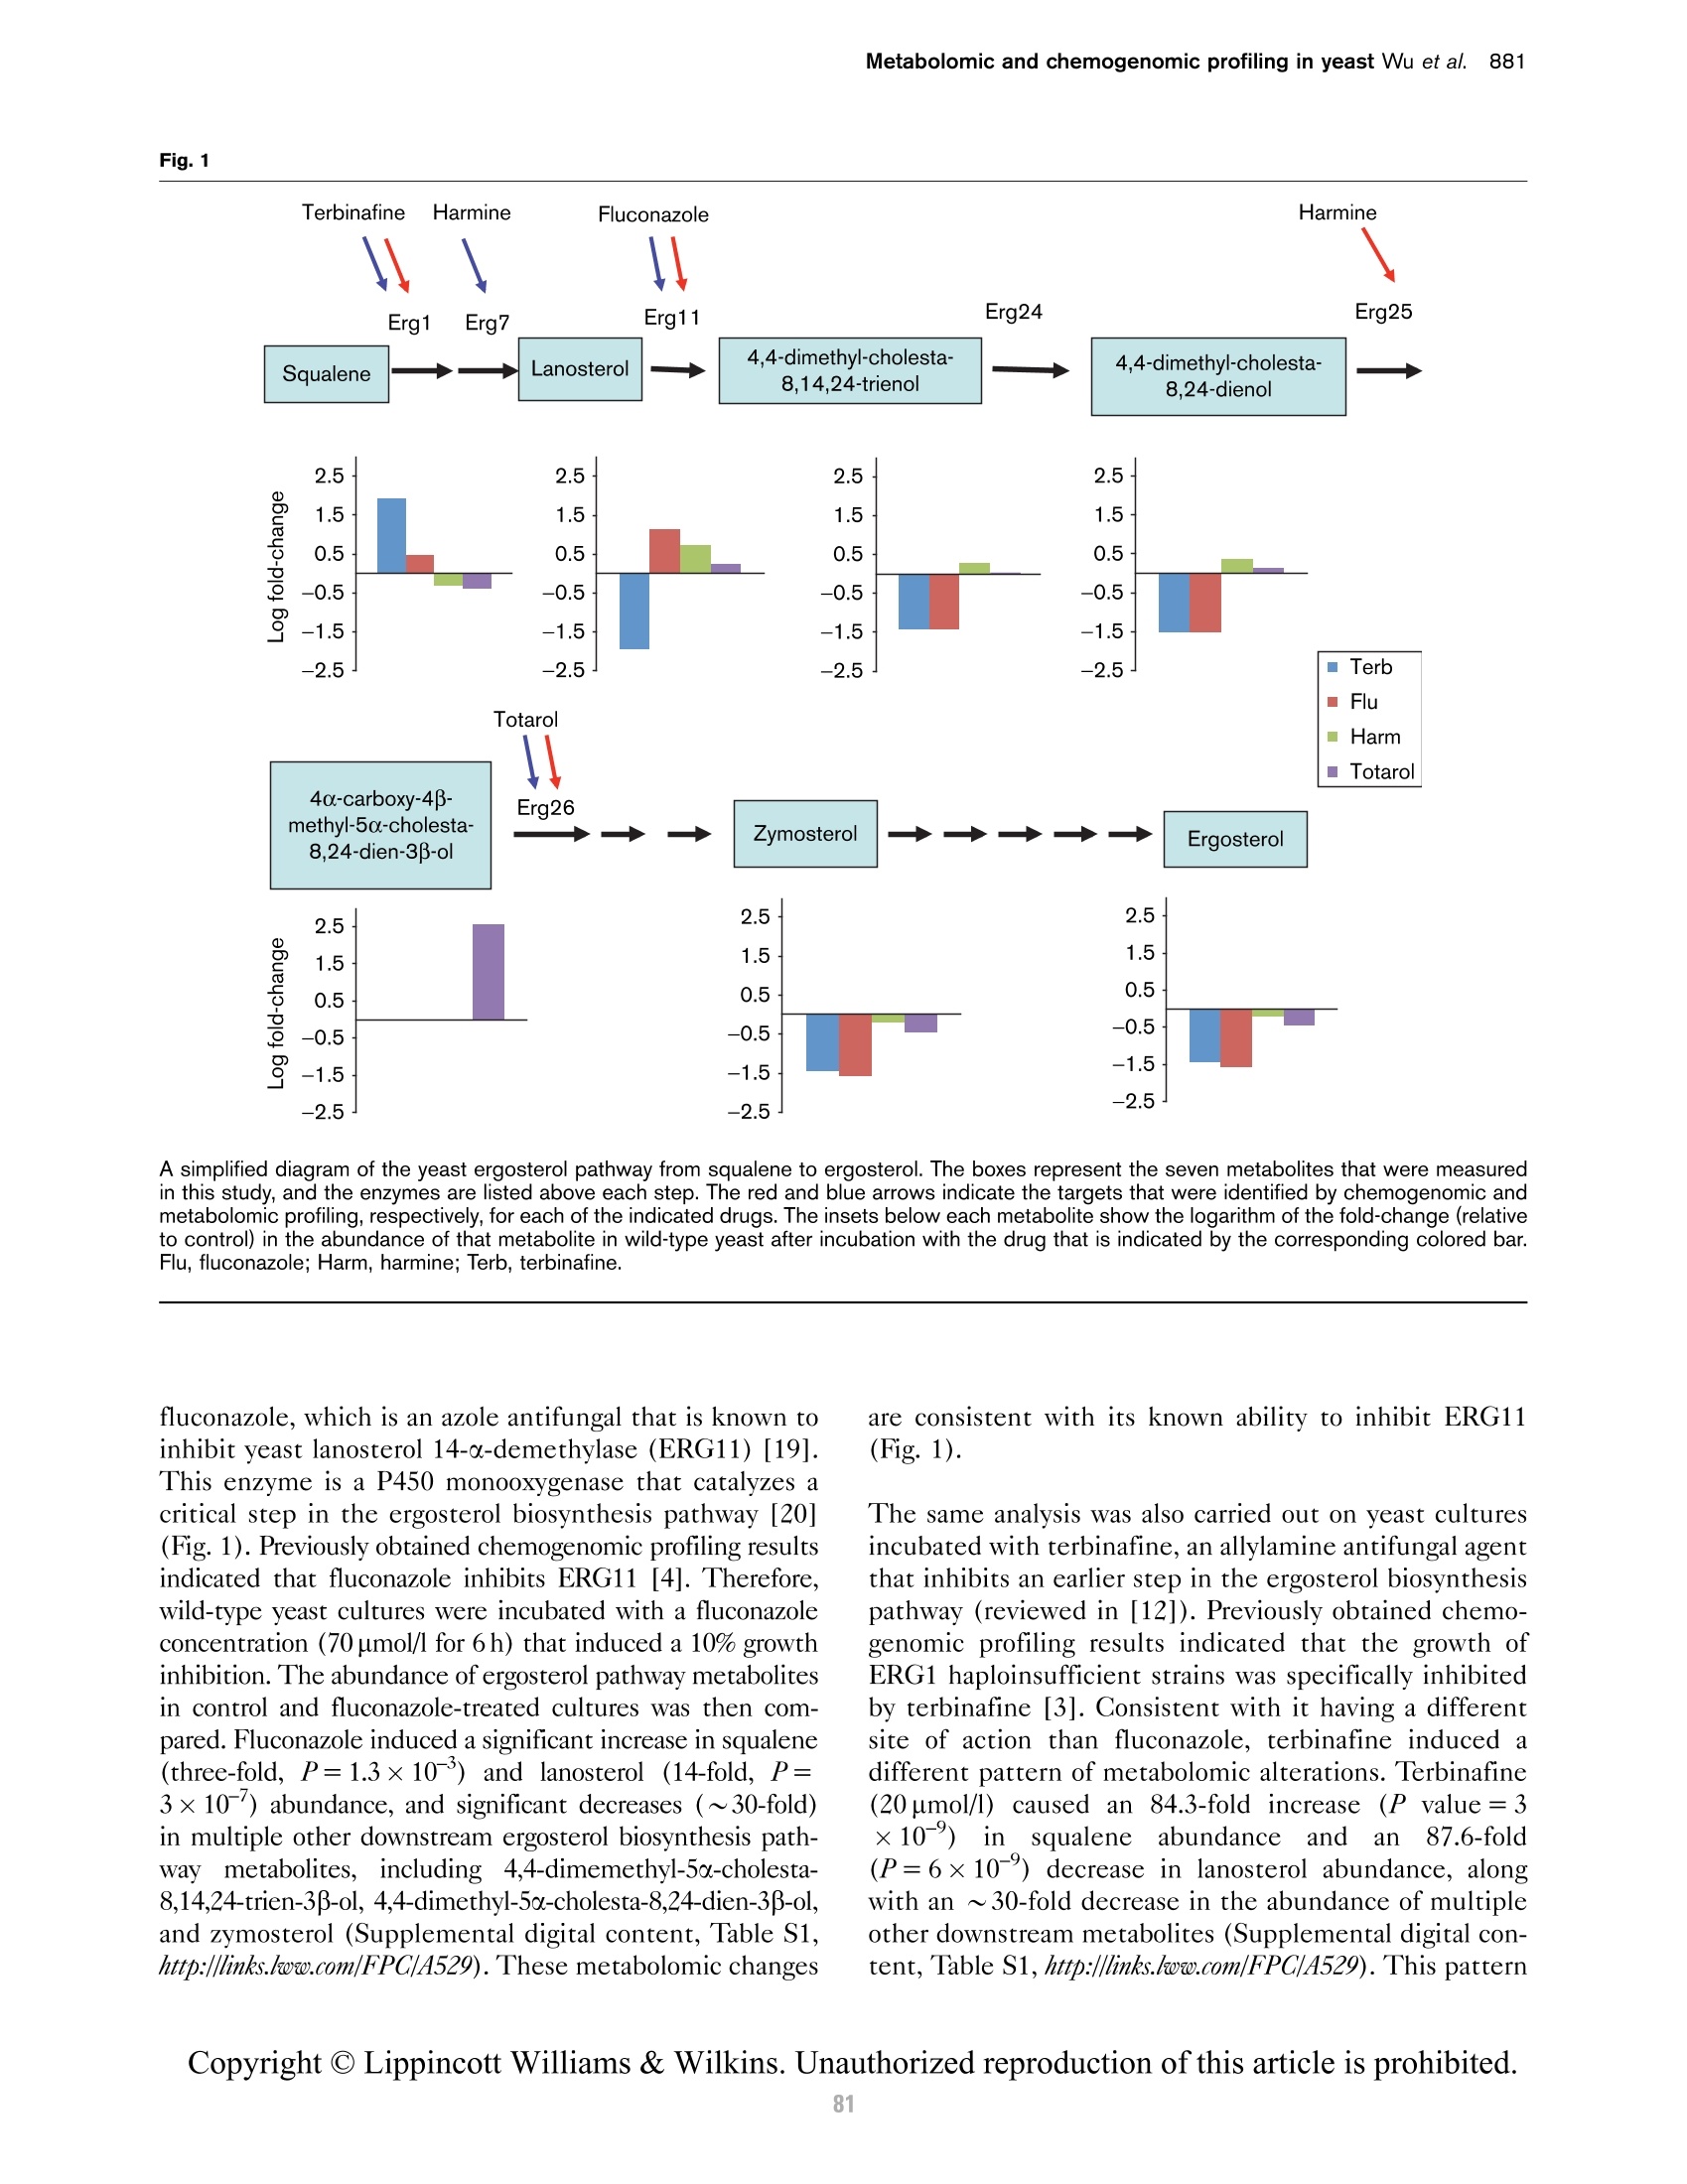
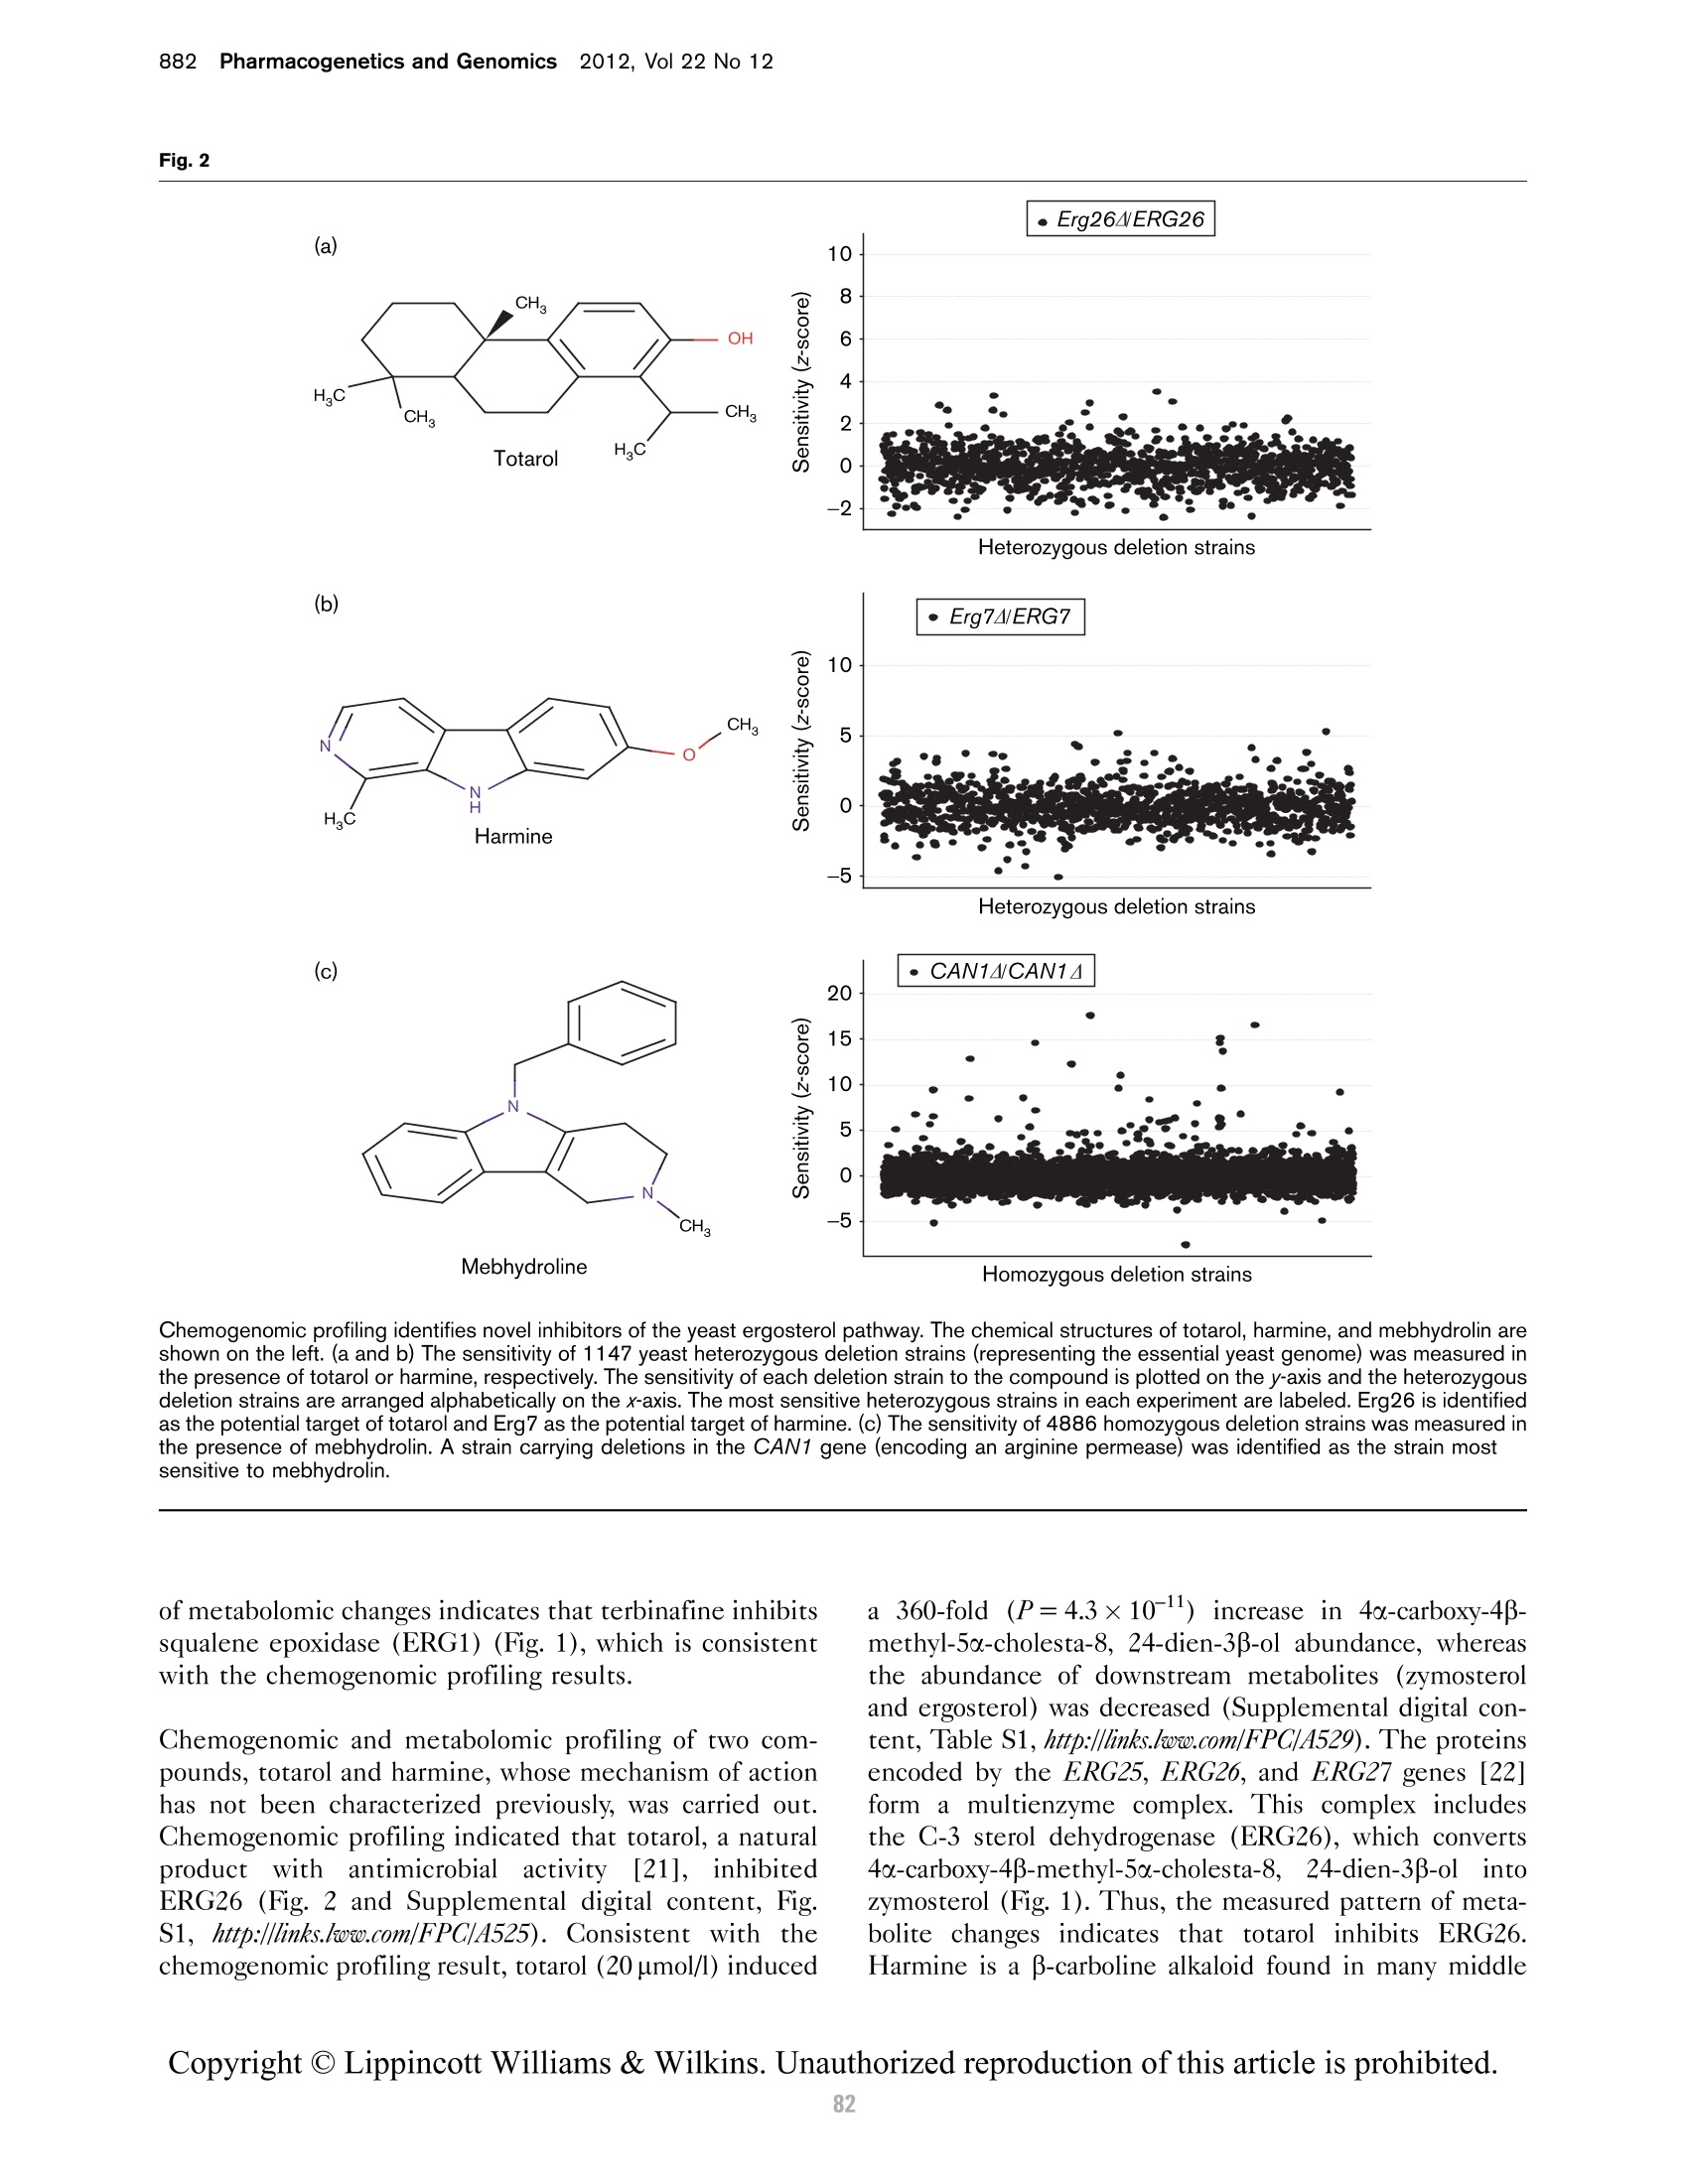
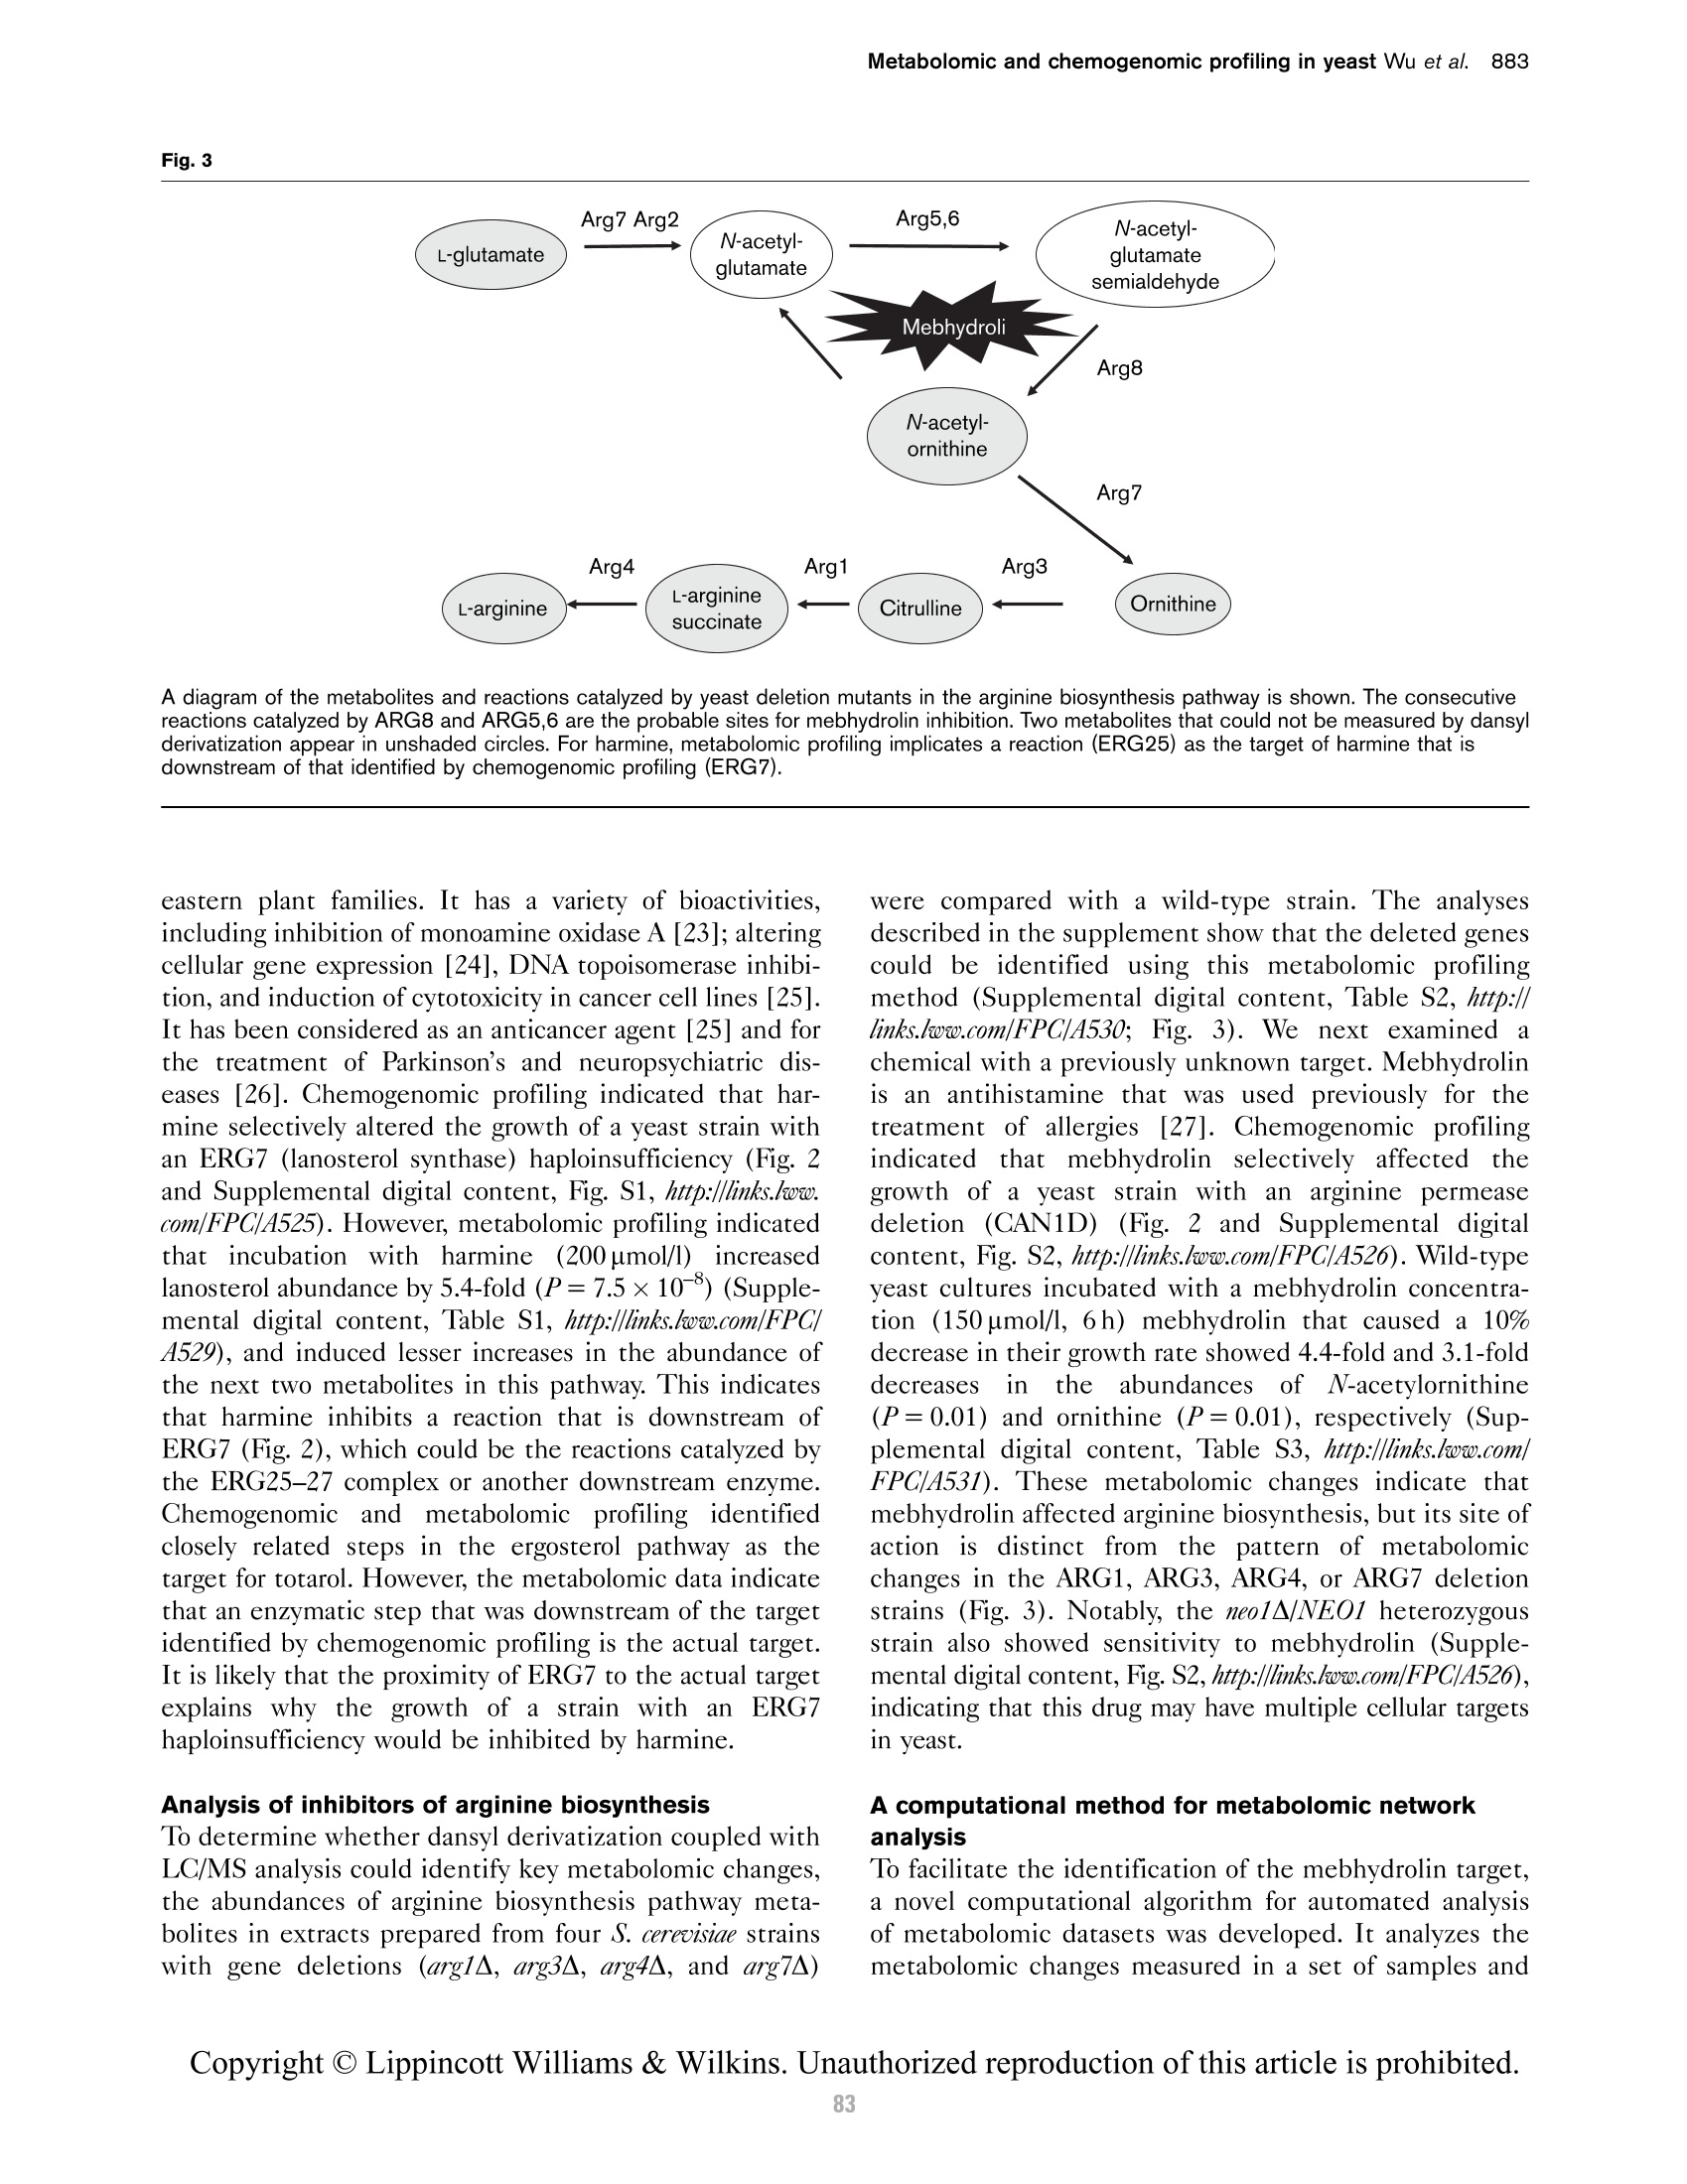
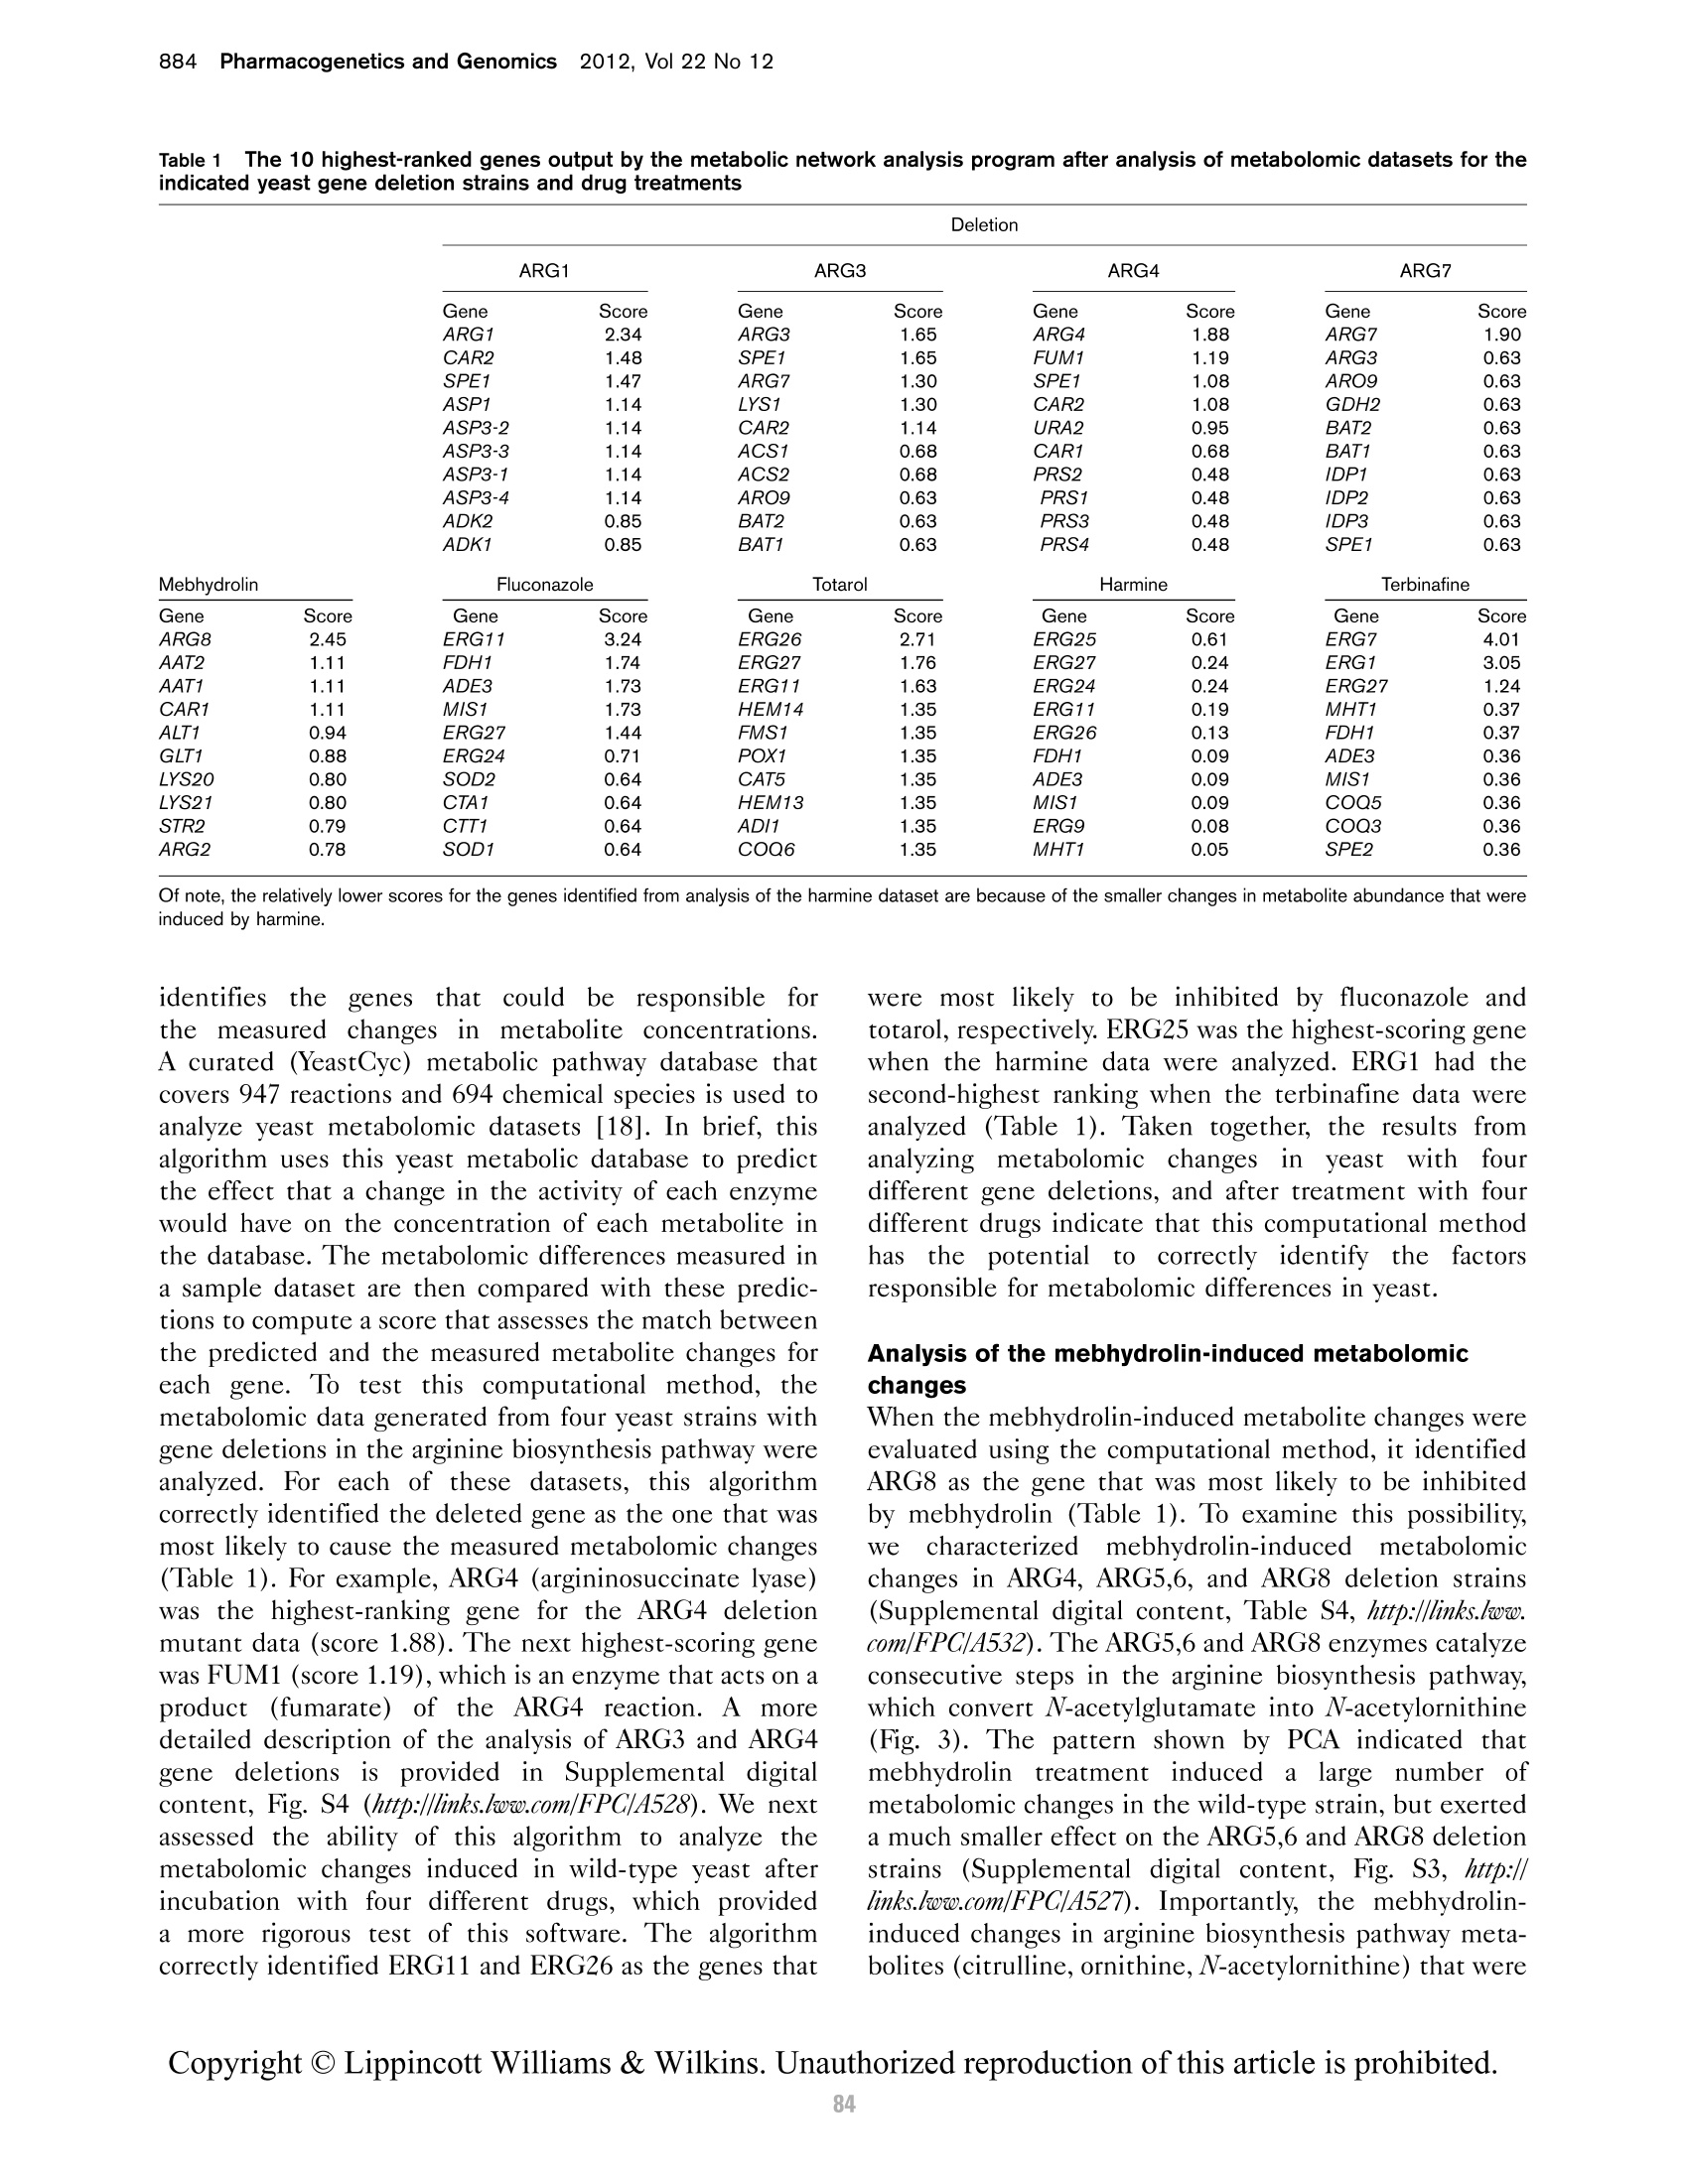

还剩86页未读,是否继续阅读?

产品配置单


安捷伦科技(中国)有限公司为您提供《橄榄油中5 种特定化合物检测方案(气质联用仪)》,该方案主要用于食用植物油中营养成分检测,参考标准--,《橄榄油中5 种特定化合物检测方案(气质联用仪)》用到的仪器有Agilent 7890B 气相色谱仪、认证翻新 7200 Q-TOF 气质联用系统
推荐专场
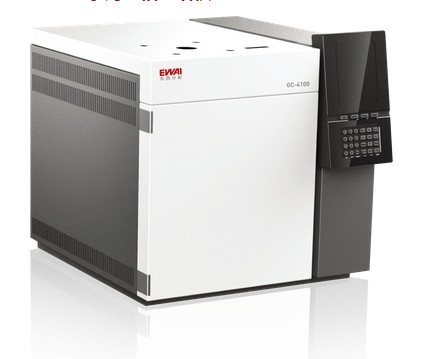
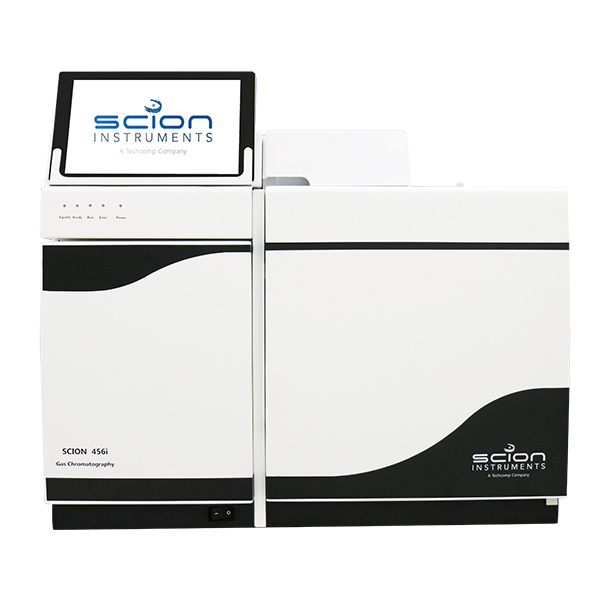
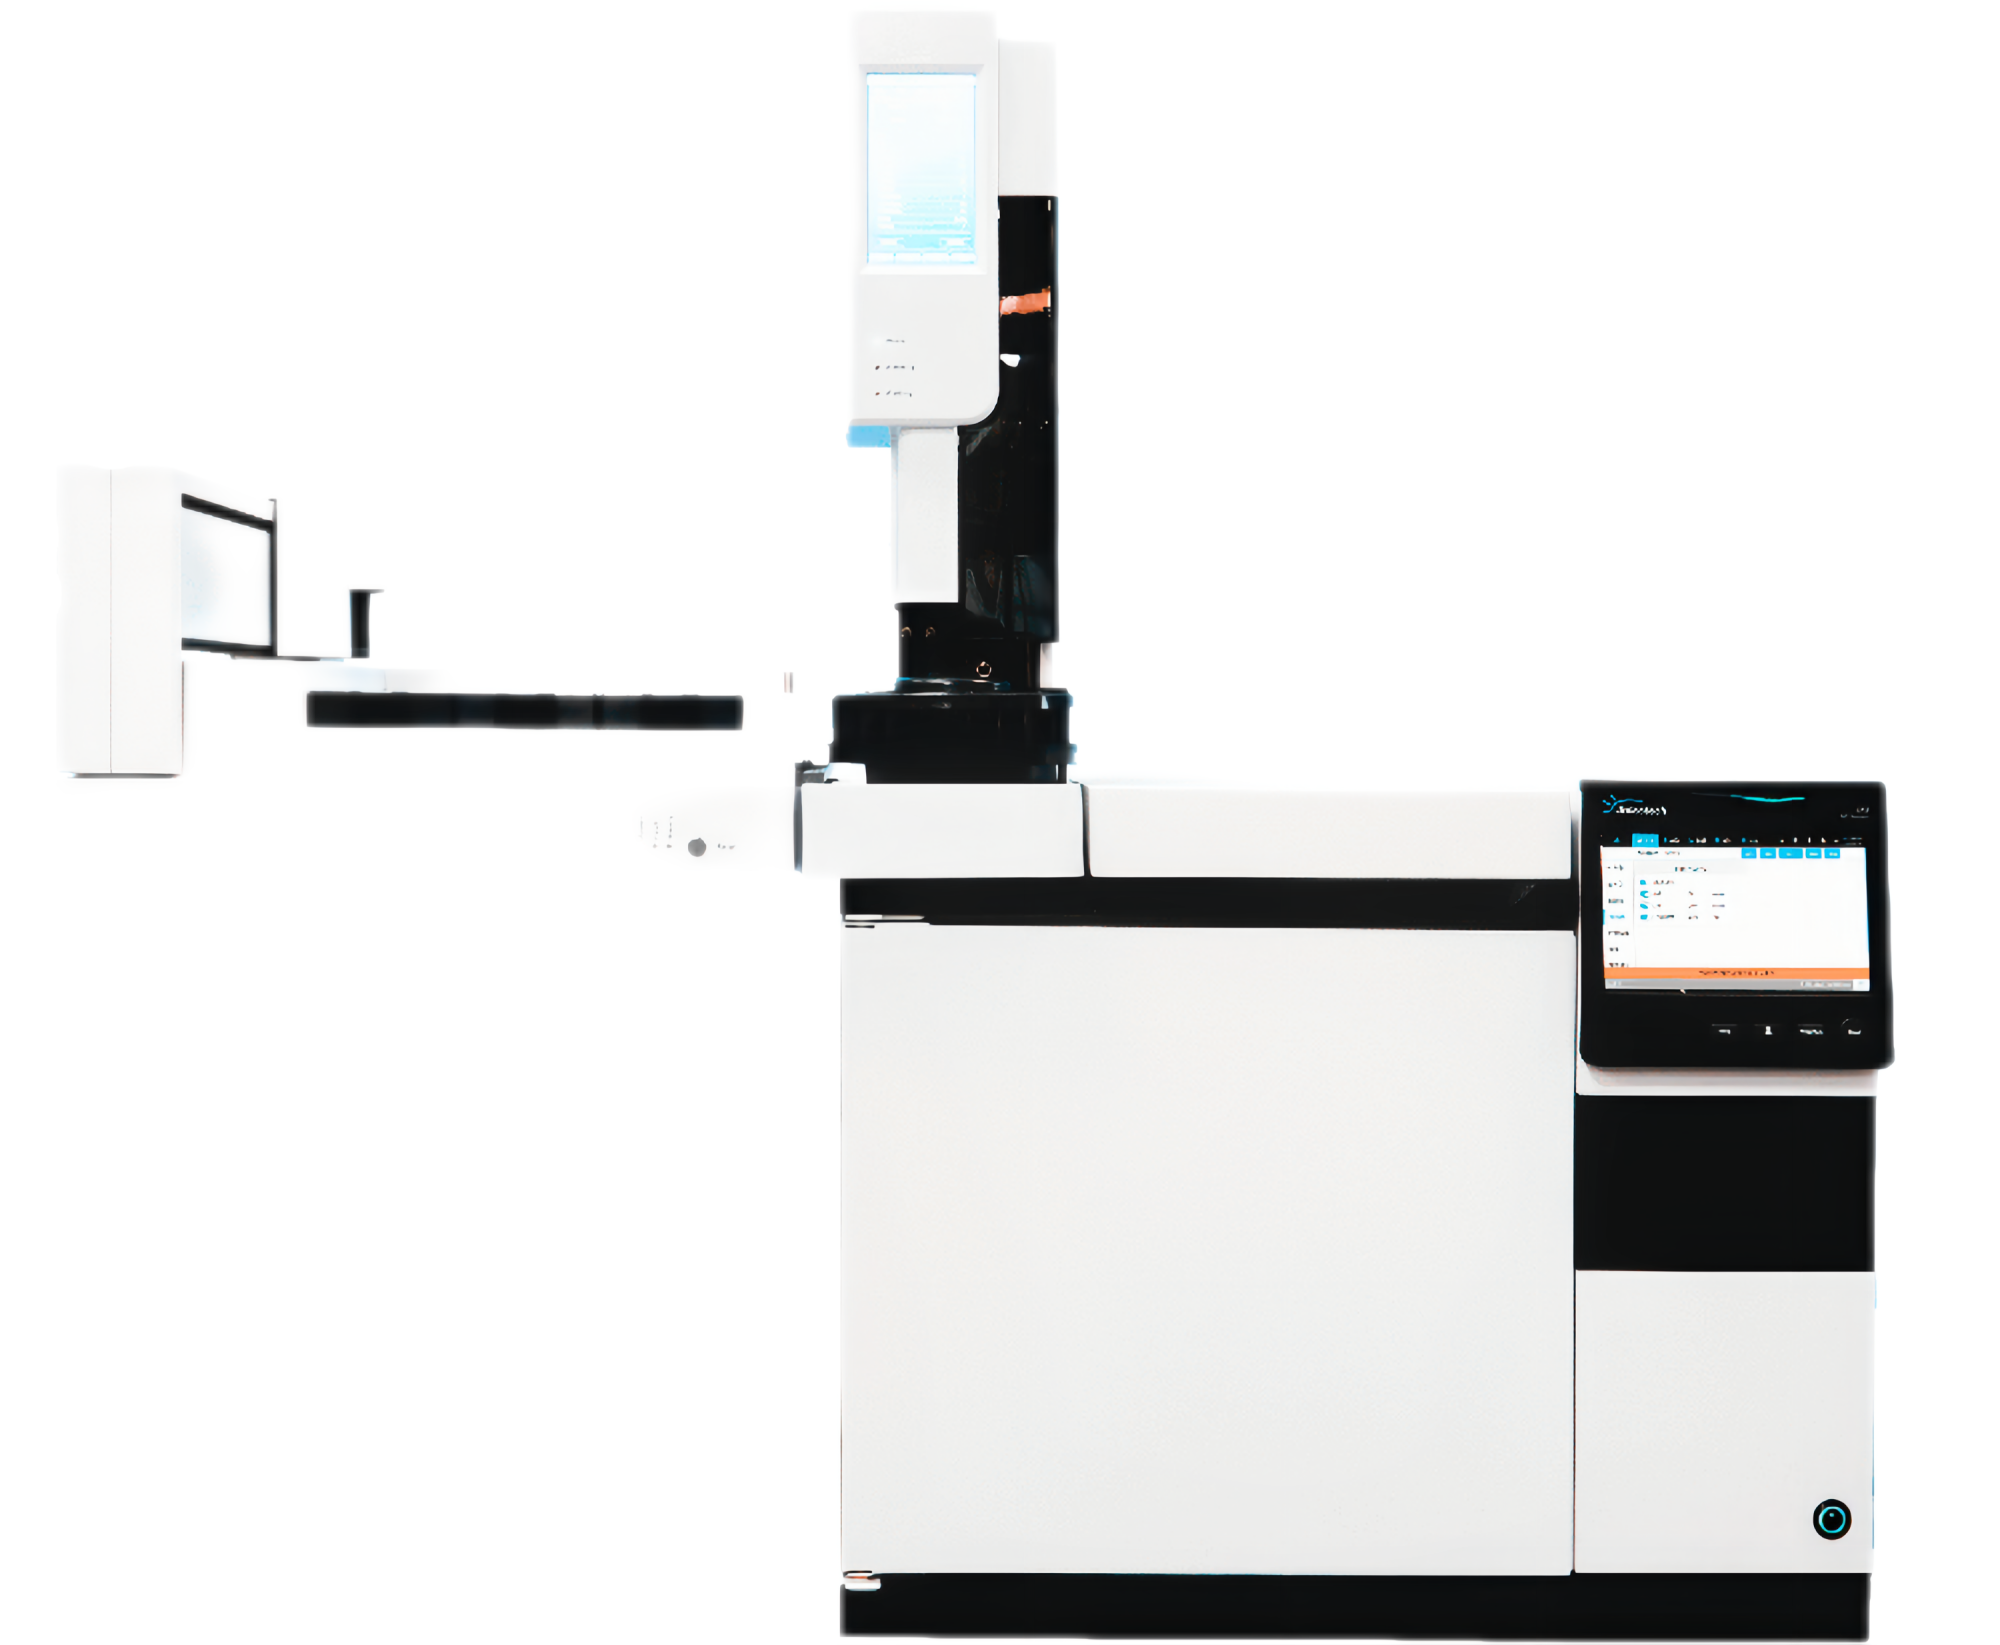
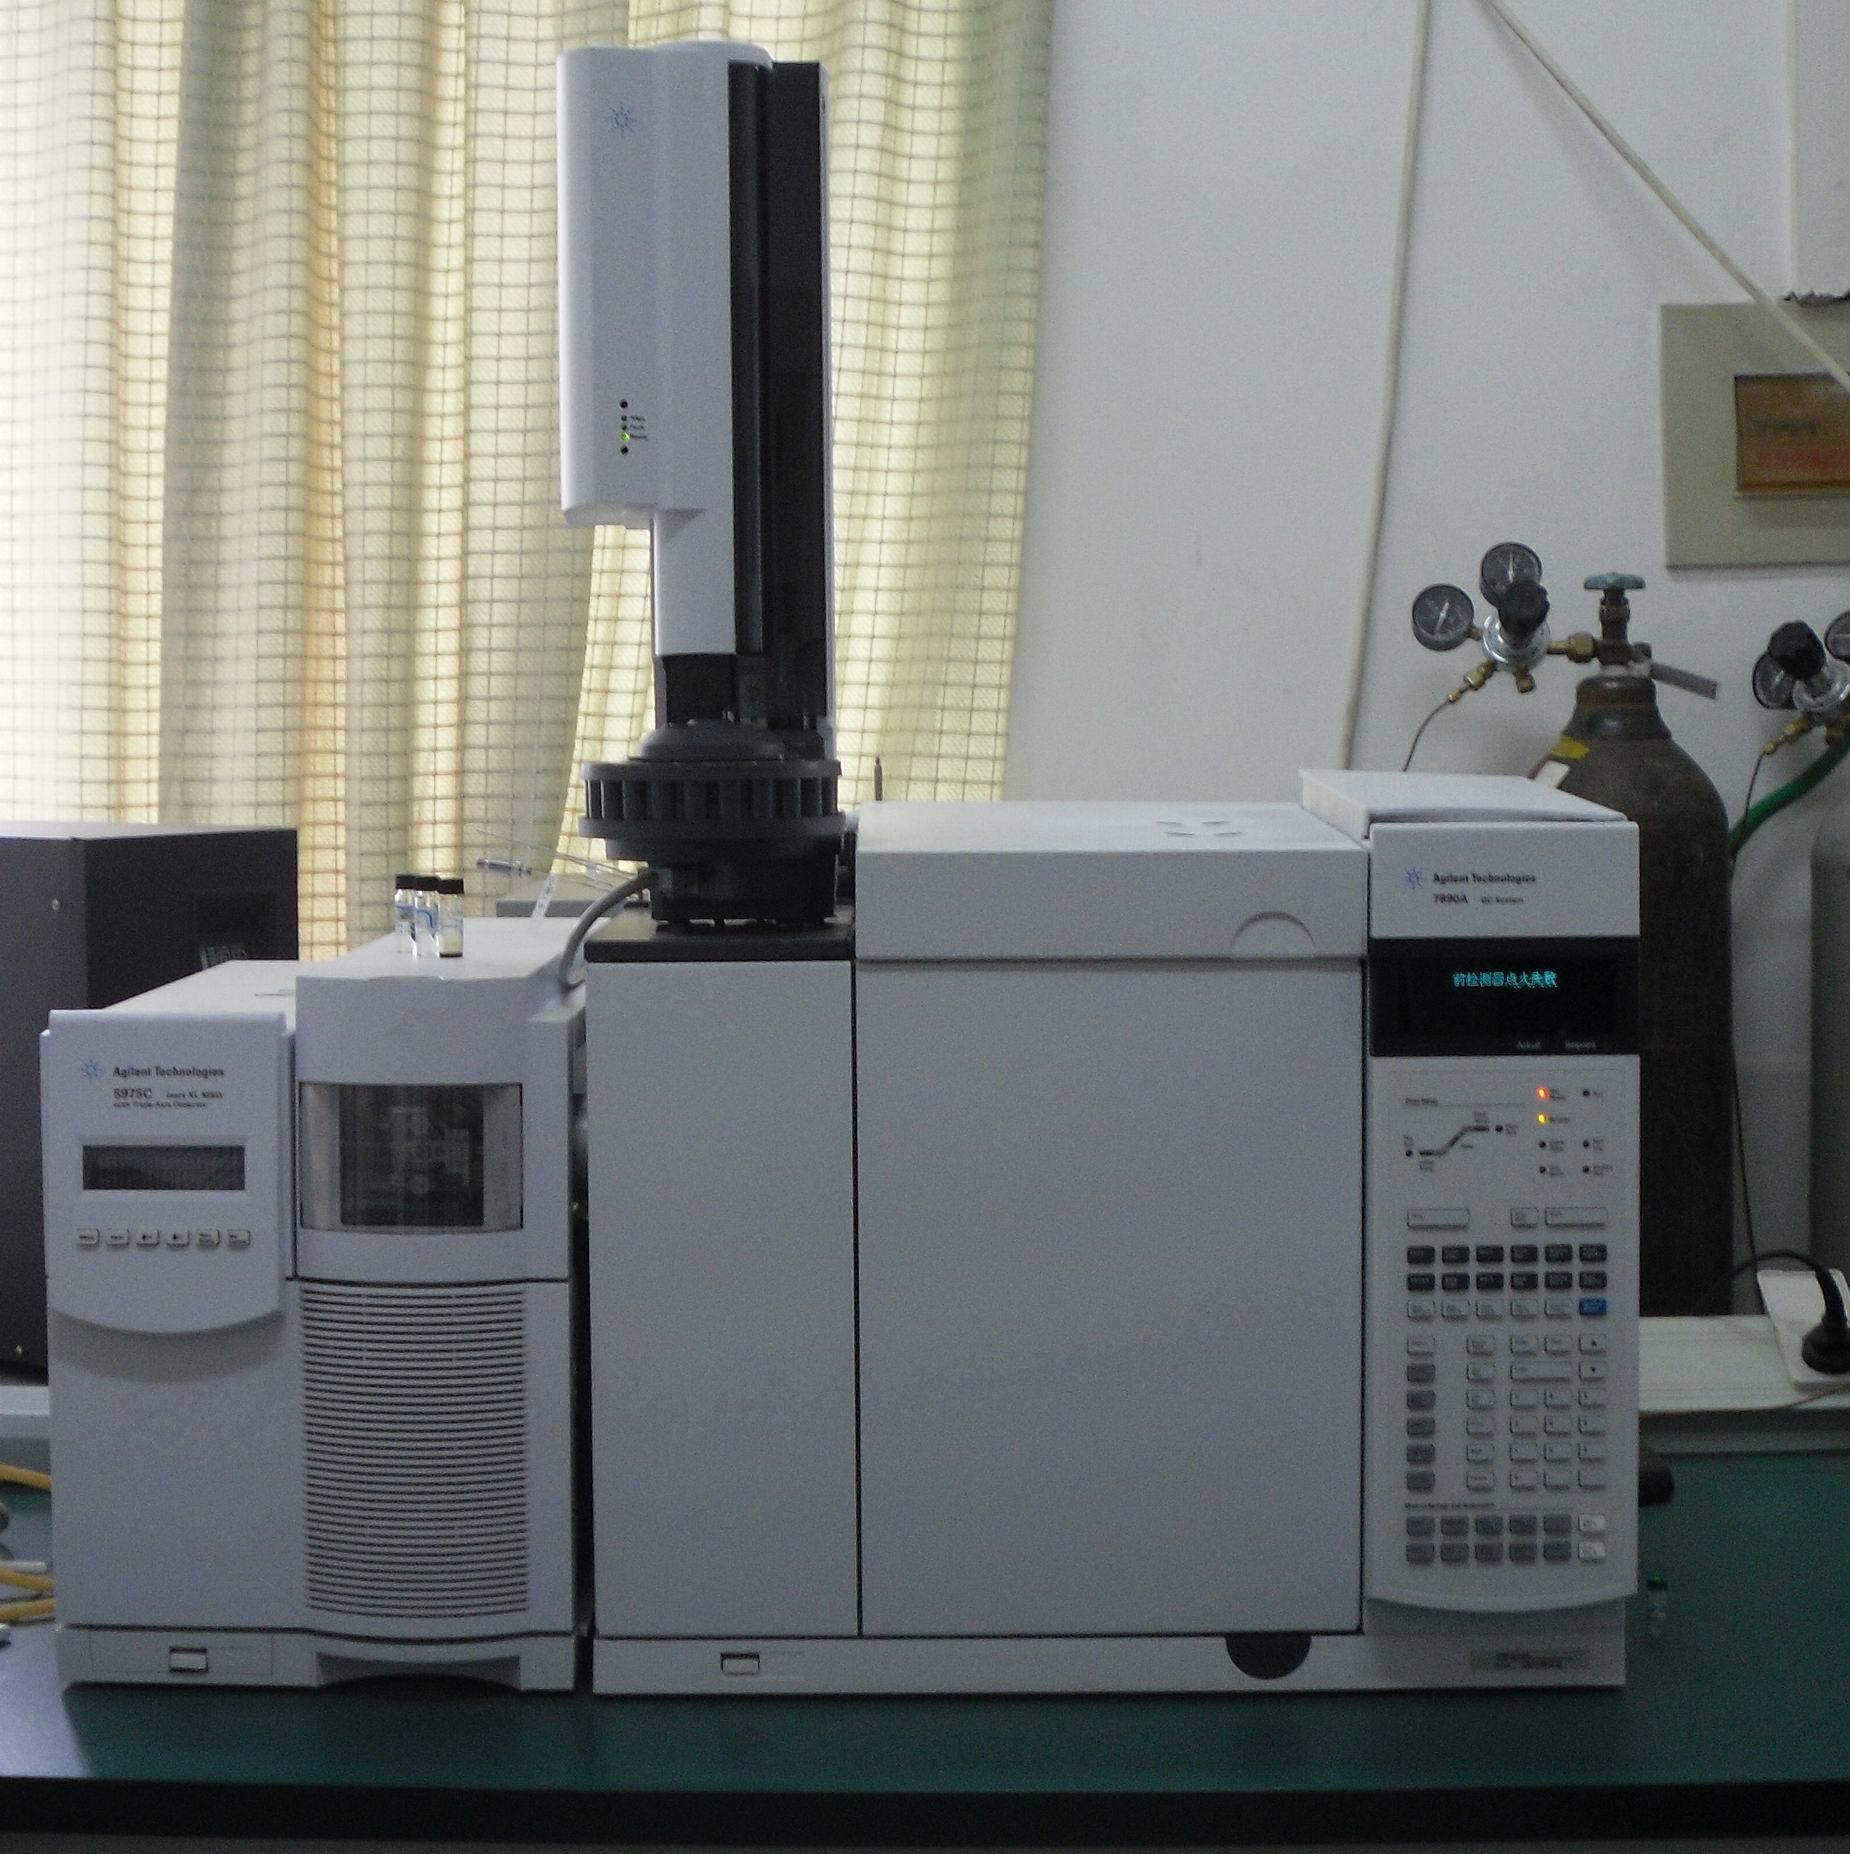
相关方案
更多
该厂商其他方案
更多