


方案详情
文
应用范围
测定地下水中的水溶性六价铬(如CrO2-4),这种方法的检测下限为0.4μg/L。样品中如果含有大量的阴离子物质如硫酸或氯离子可能会引起色谱柱过载。样品如果含有大量有机物或硫离子可能会引起可溶性的六价铬快速还原为三价铬。样品贮存在4℃,在24小时内分析。方法采用离子色谱法分析。
方法要点:
水样经0.45μm滤膜过滤后,用浓缓冲溶液调节pH为9-9.5。样品的测量体积为50-250μL进样到离子色谱。保护柱去除样品中的有机物,六价铬以CrO2-4形式,在高容量的阴离子交换分离柱上分离,六价铬用双苯基苄巴脲柱后衍生,然后在530nm波长下检测有色络合物。
建议采用的仪器条件
保护柱:Dionex IonPac NG1或与之相同的色谱柱
分离柱:Dionex IonPac AS7或与之相同的色谱柱
阴离子抑制器装置:Dionex Anion MicroMembrane Suppressor,其它抑制器必须有足够低的检测限和足够的基线稳定性。
色谱条件:
色谱柱:保护柱-Dionex IonPac NG1, 分离柱-Dionex IonPac AS7
淋洗液:250mM (NH4)2SO4, 100mM NH4OH, 流速=1.5 mL/min
柱后试剂:2mM双苯基苄巴脲,10% v/v甲醇,1N 硫酸,流速=0.5 mL/min
检测器:可见光530nm
保留时间:3.8 分钟
方案详情

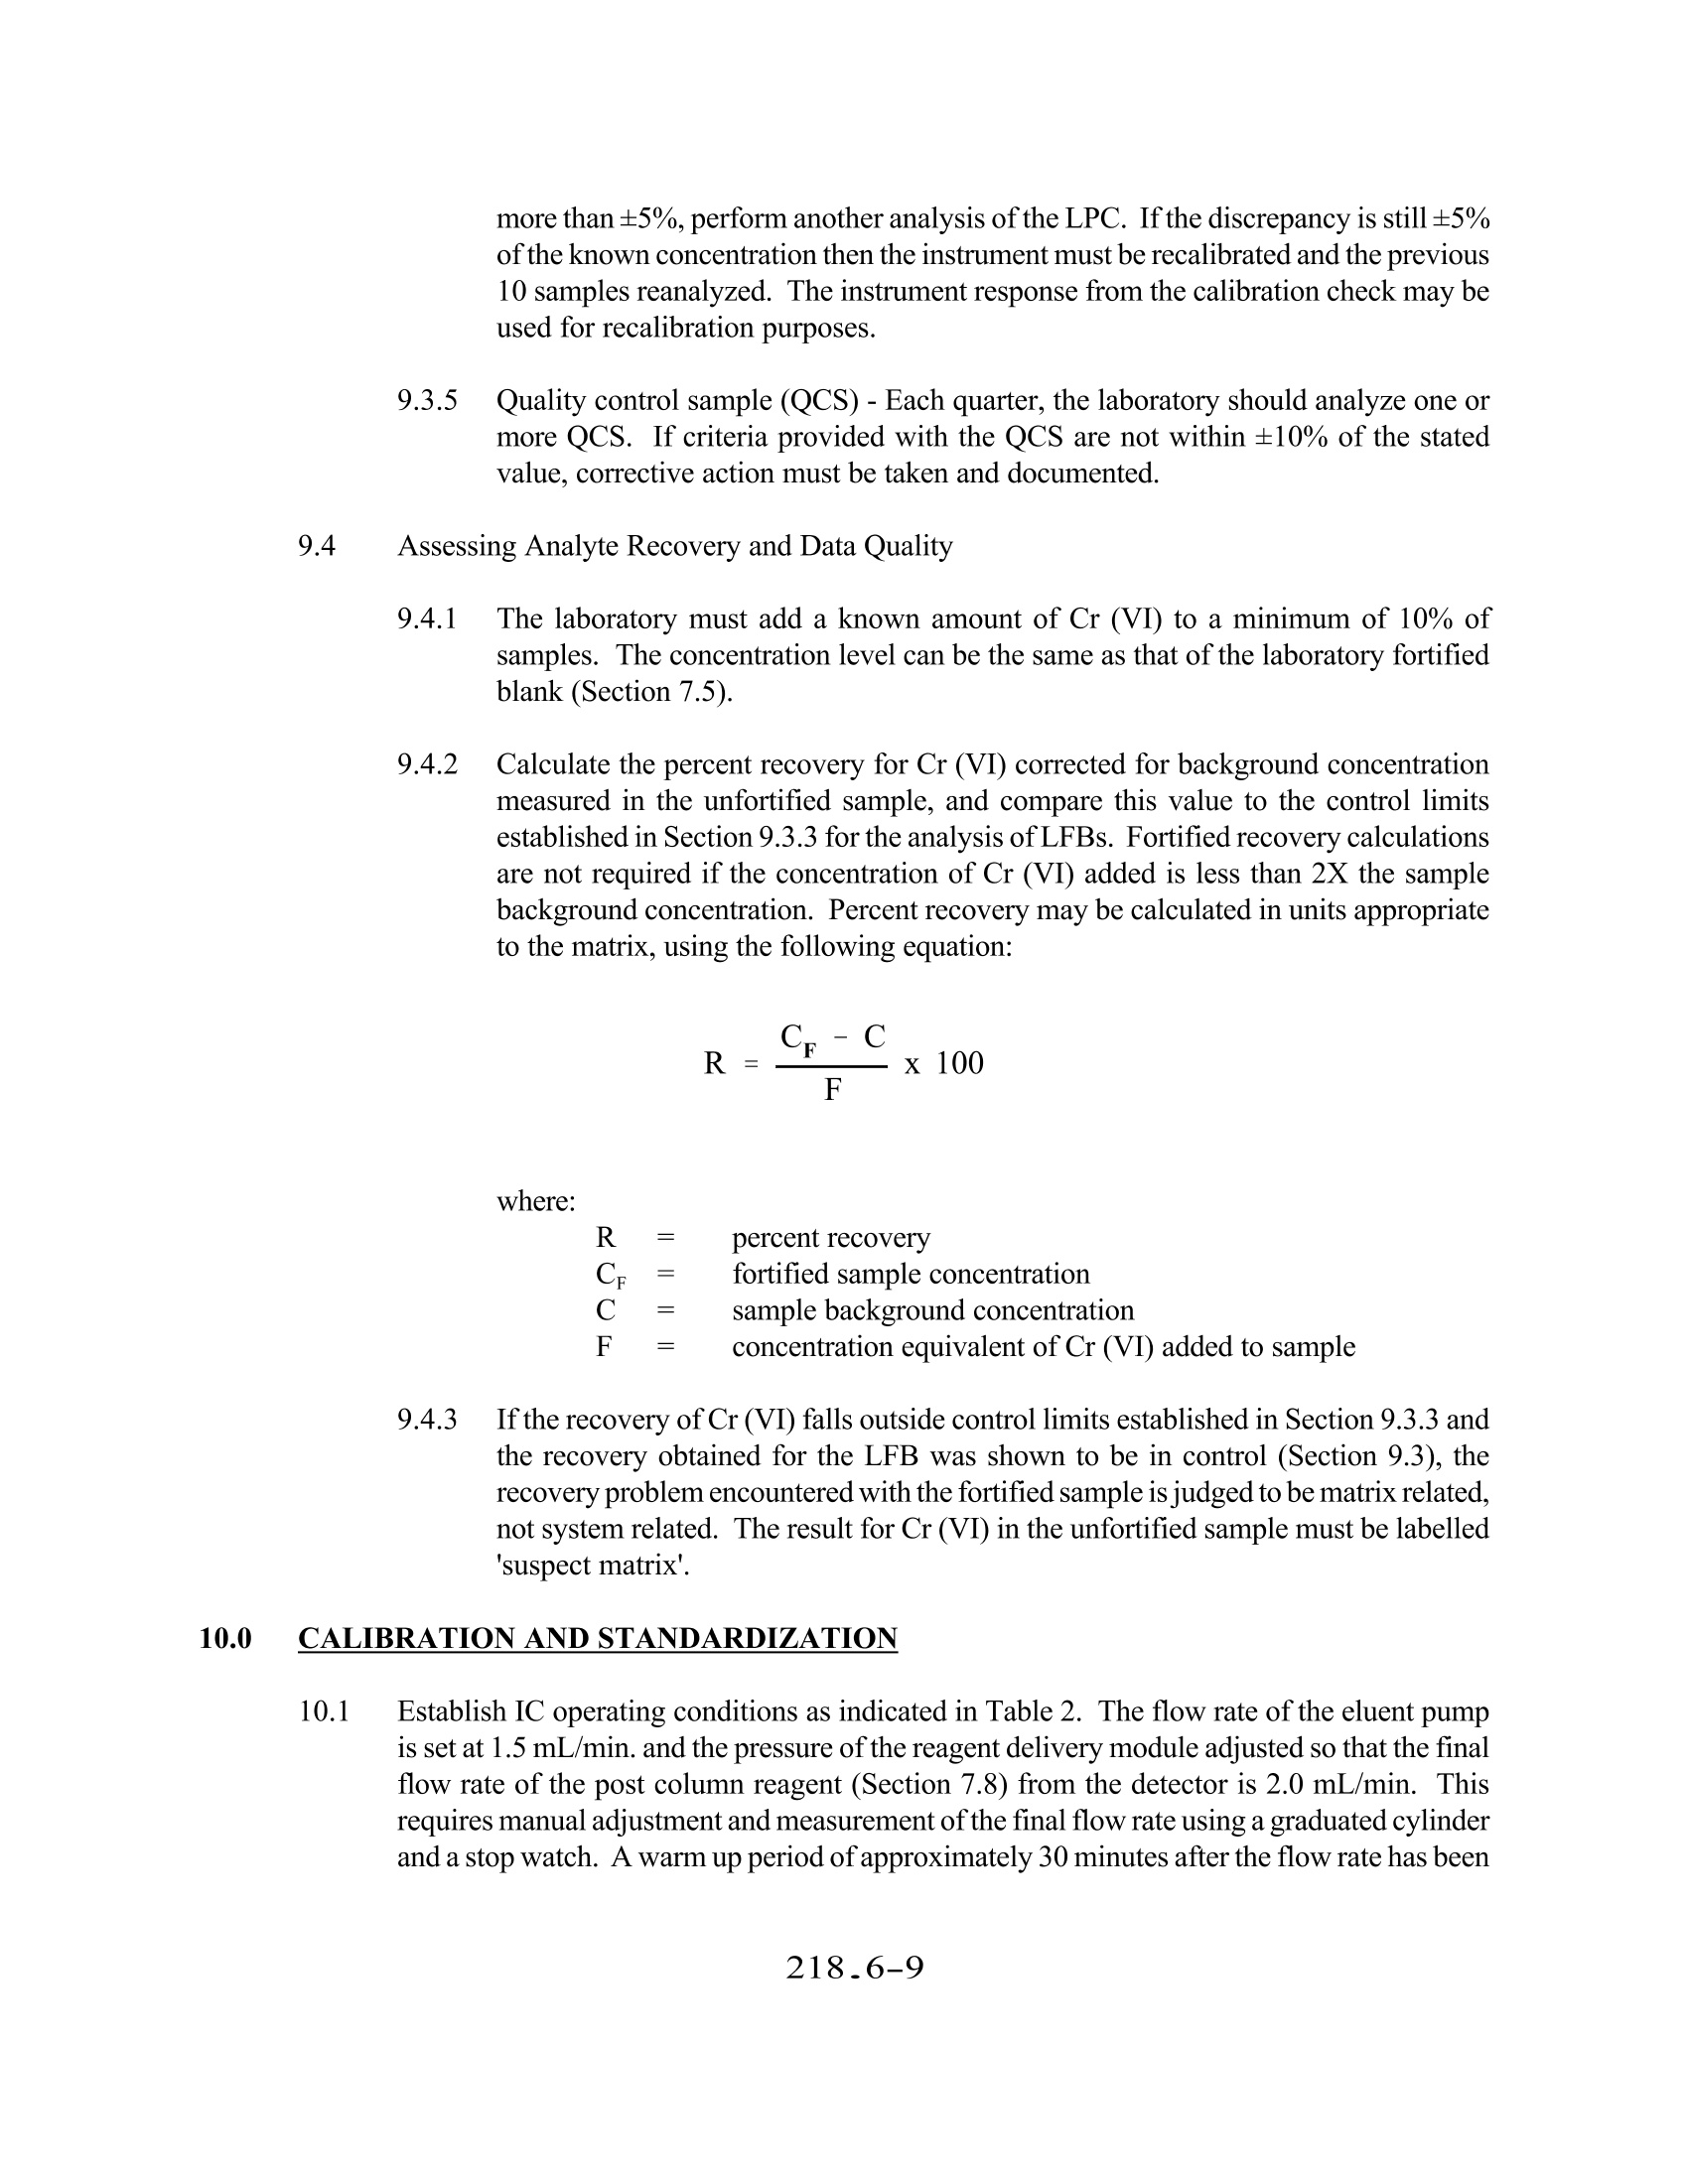
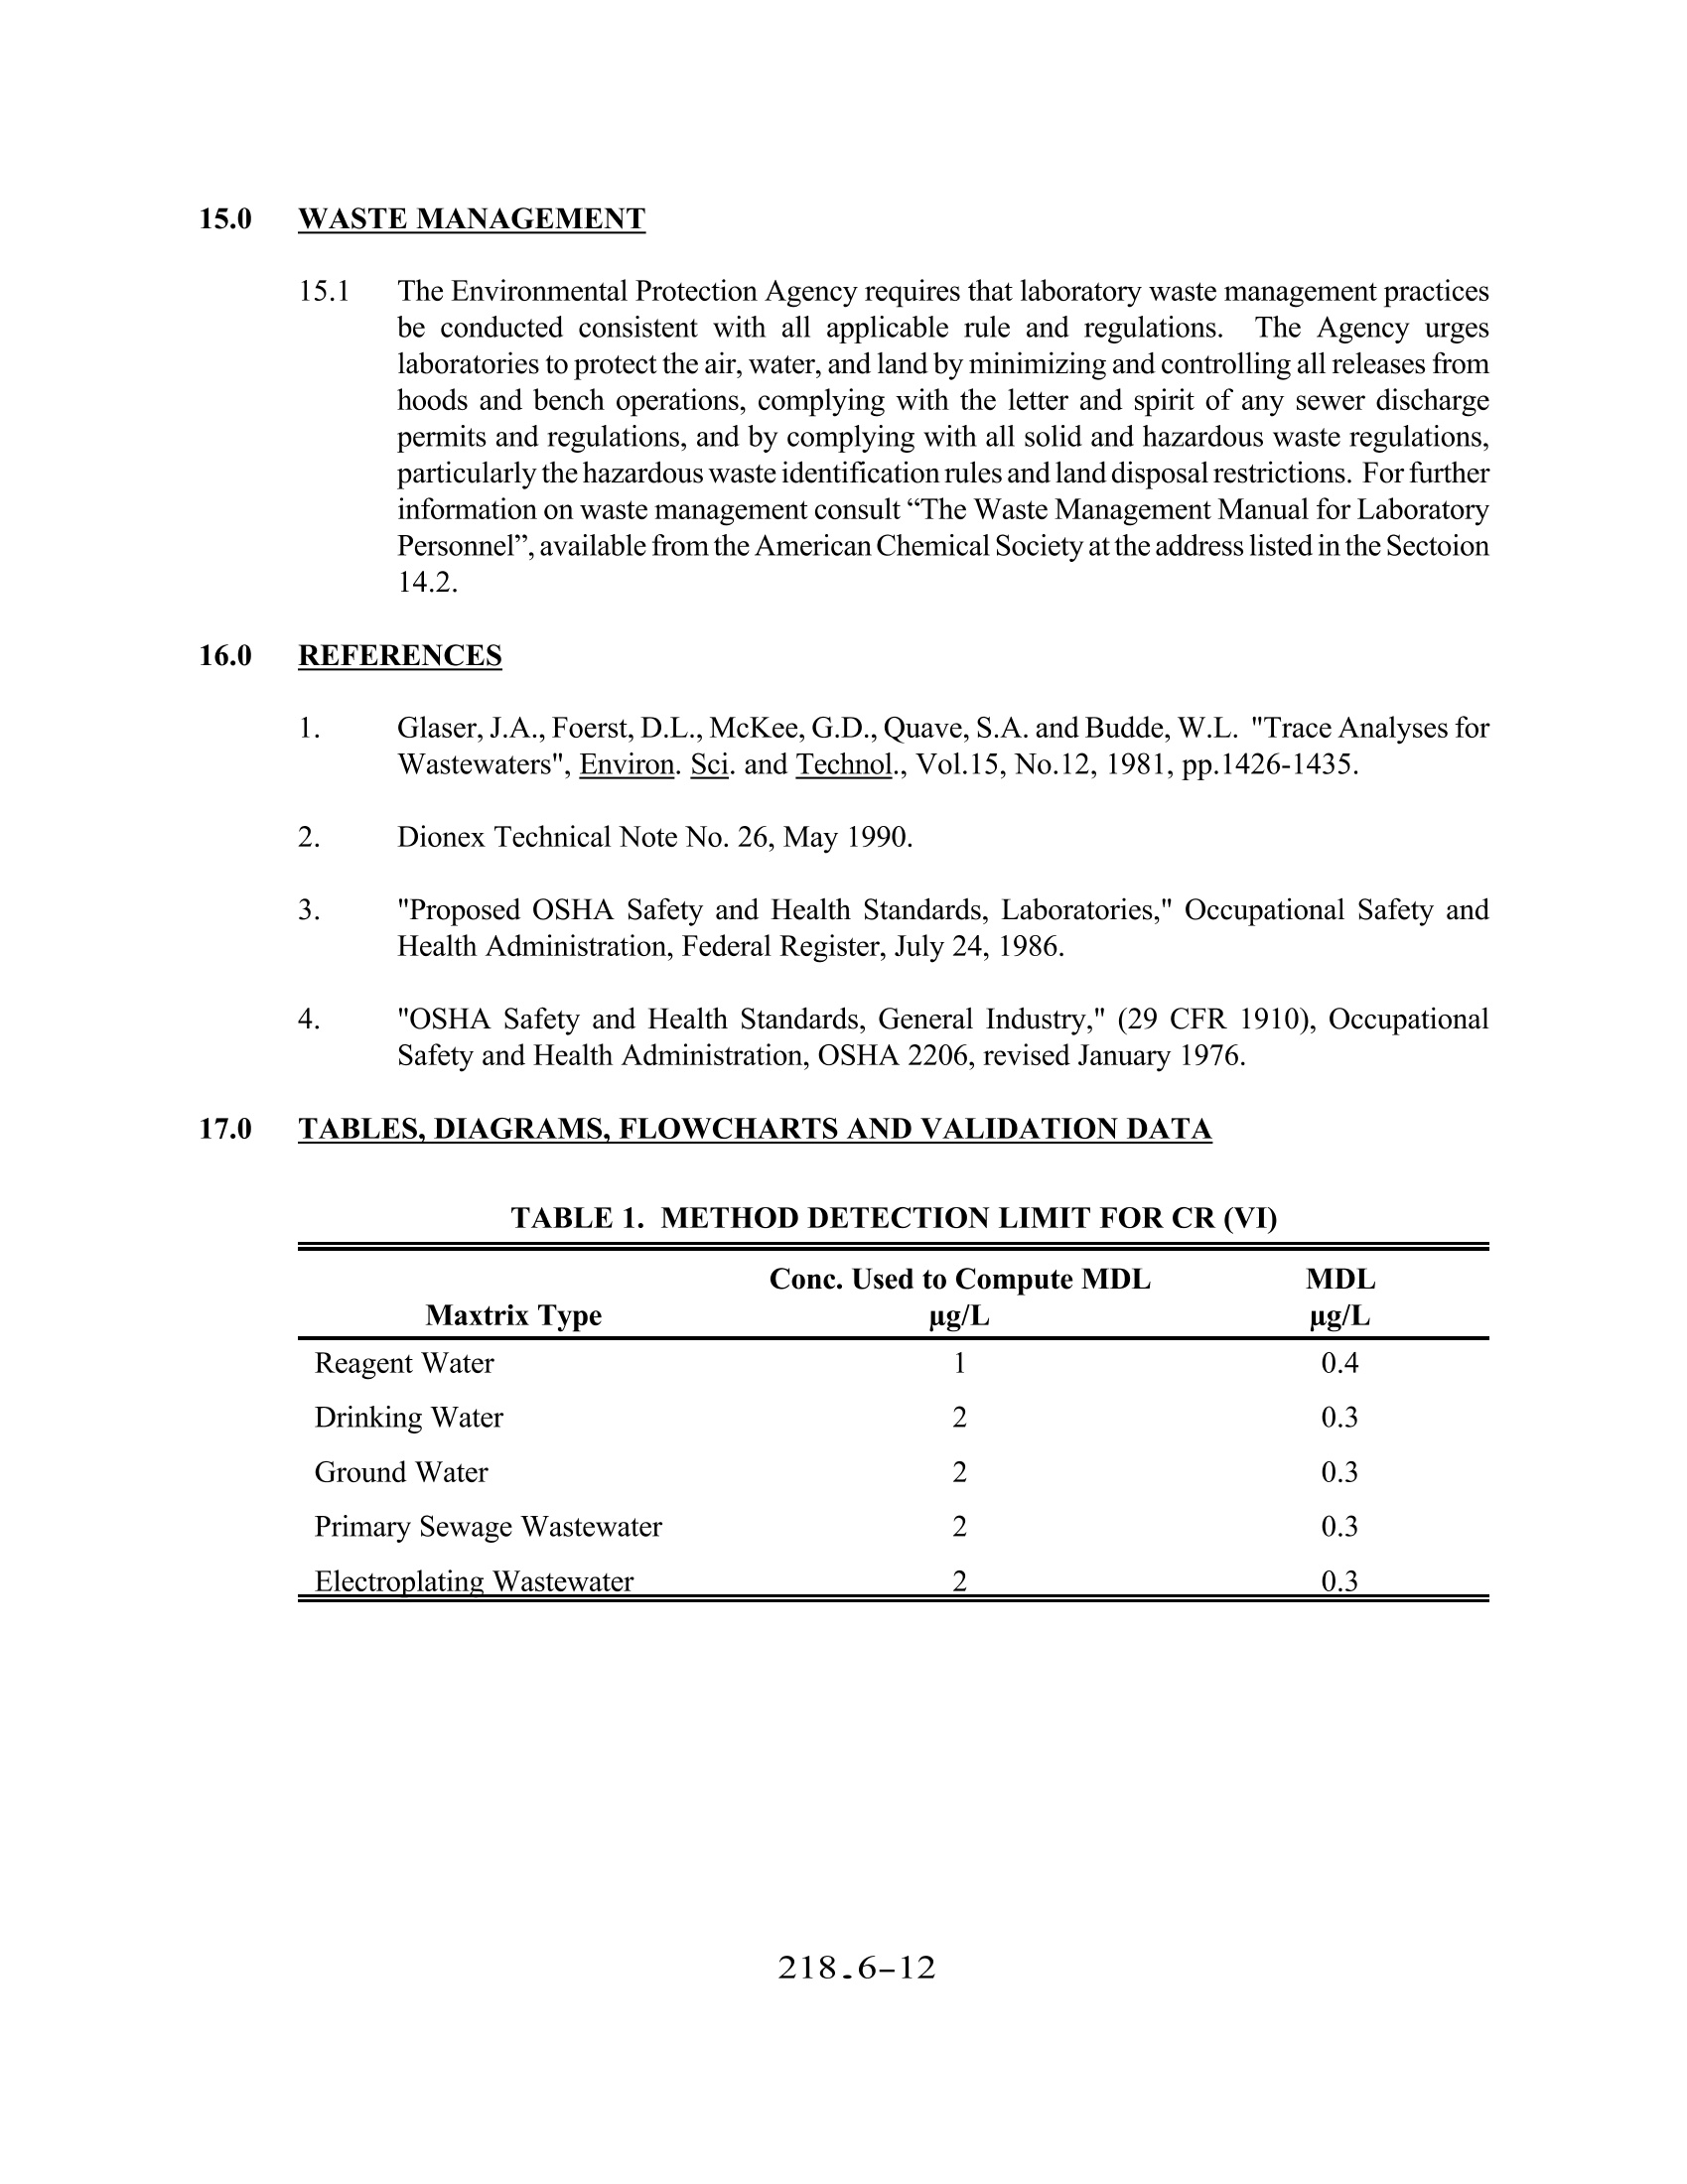
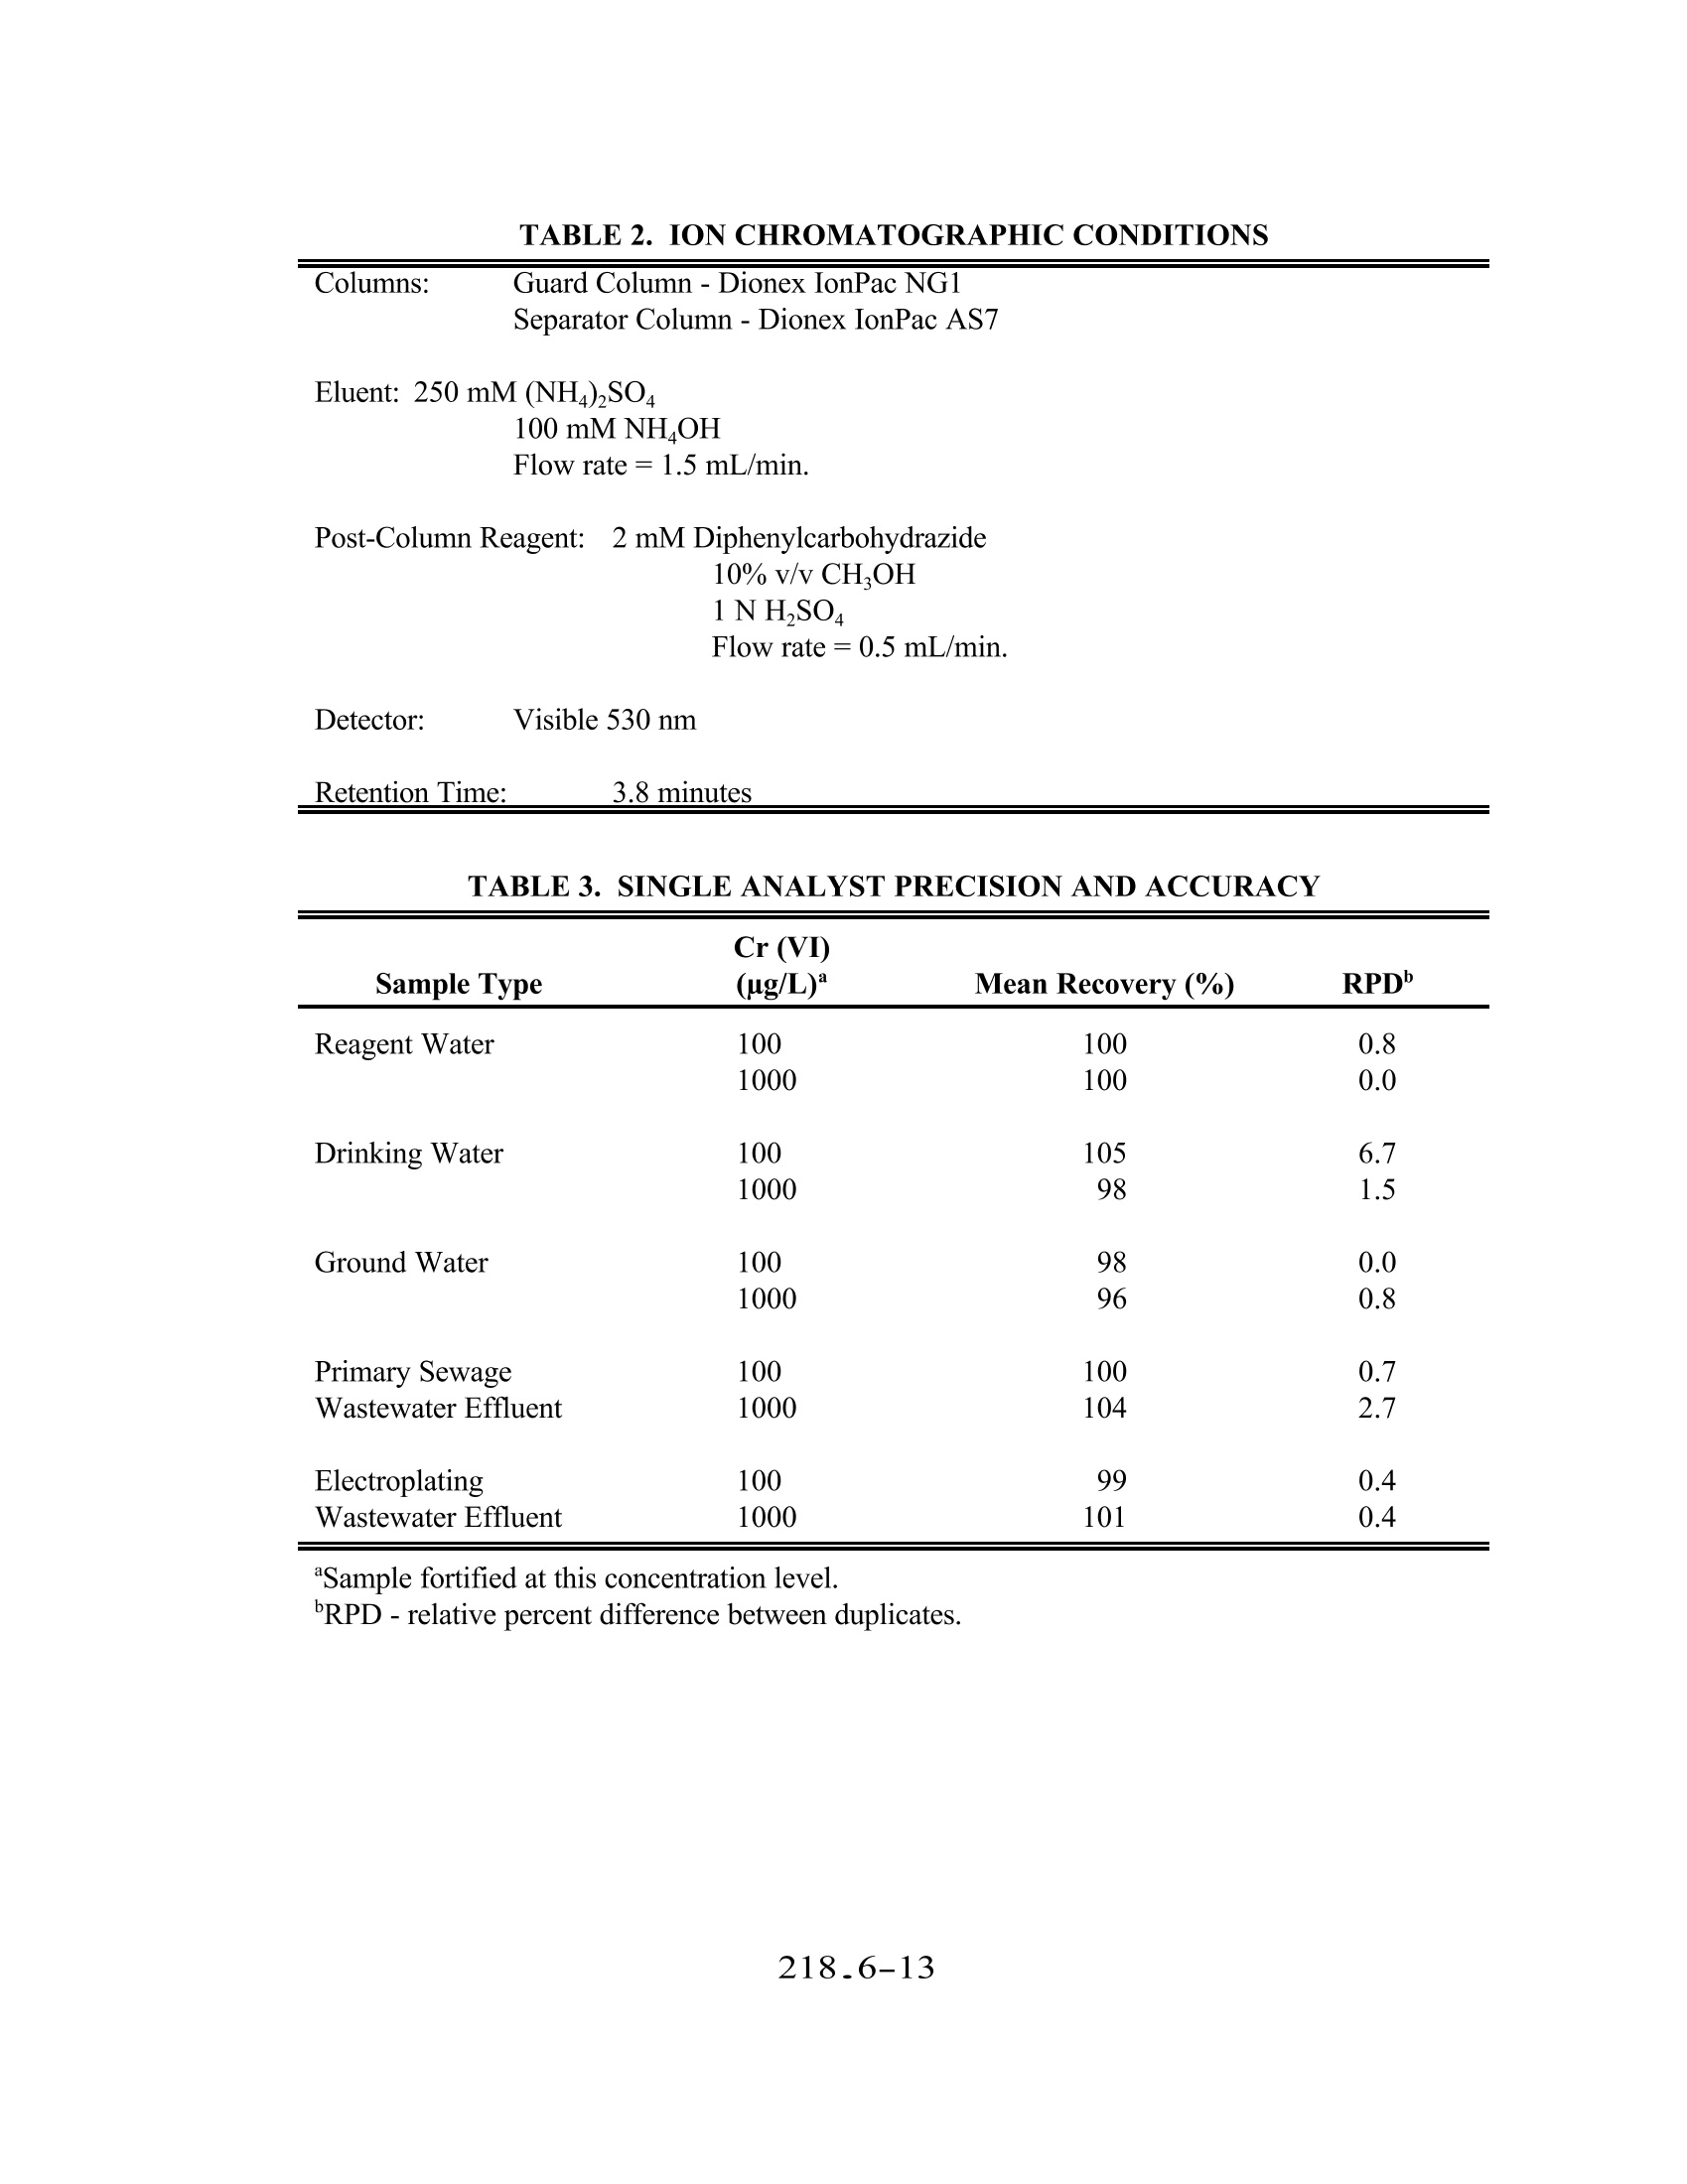
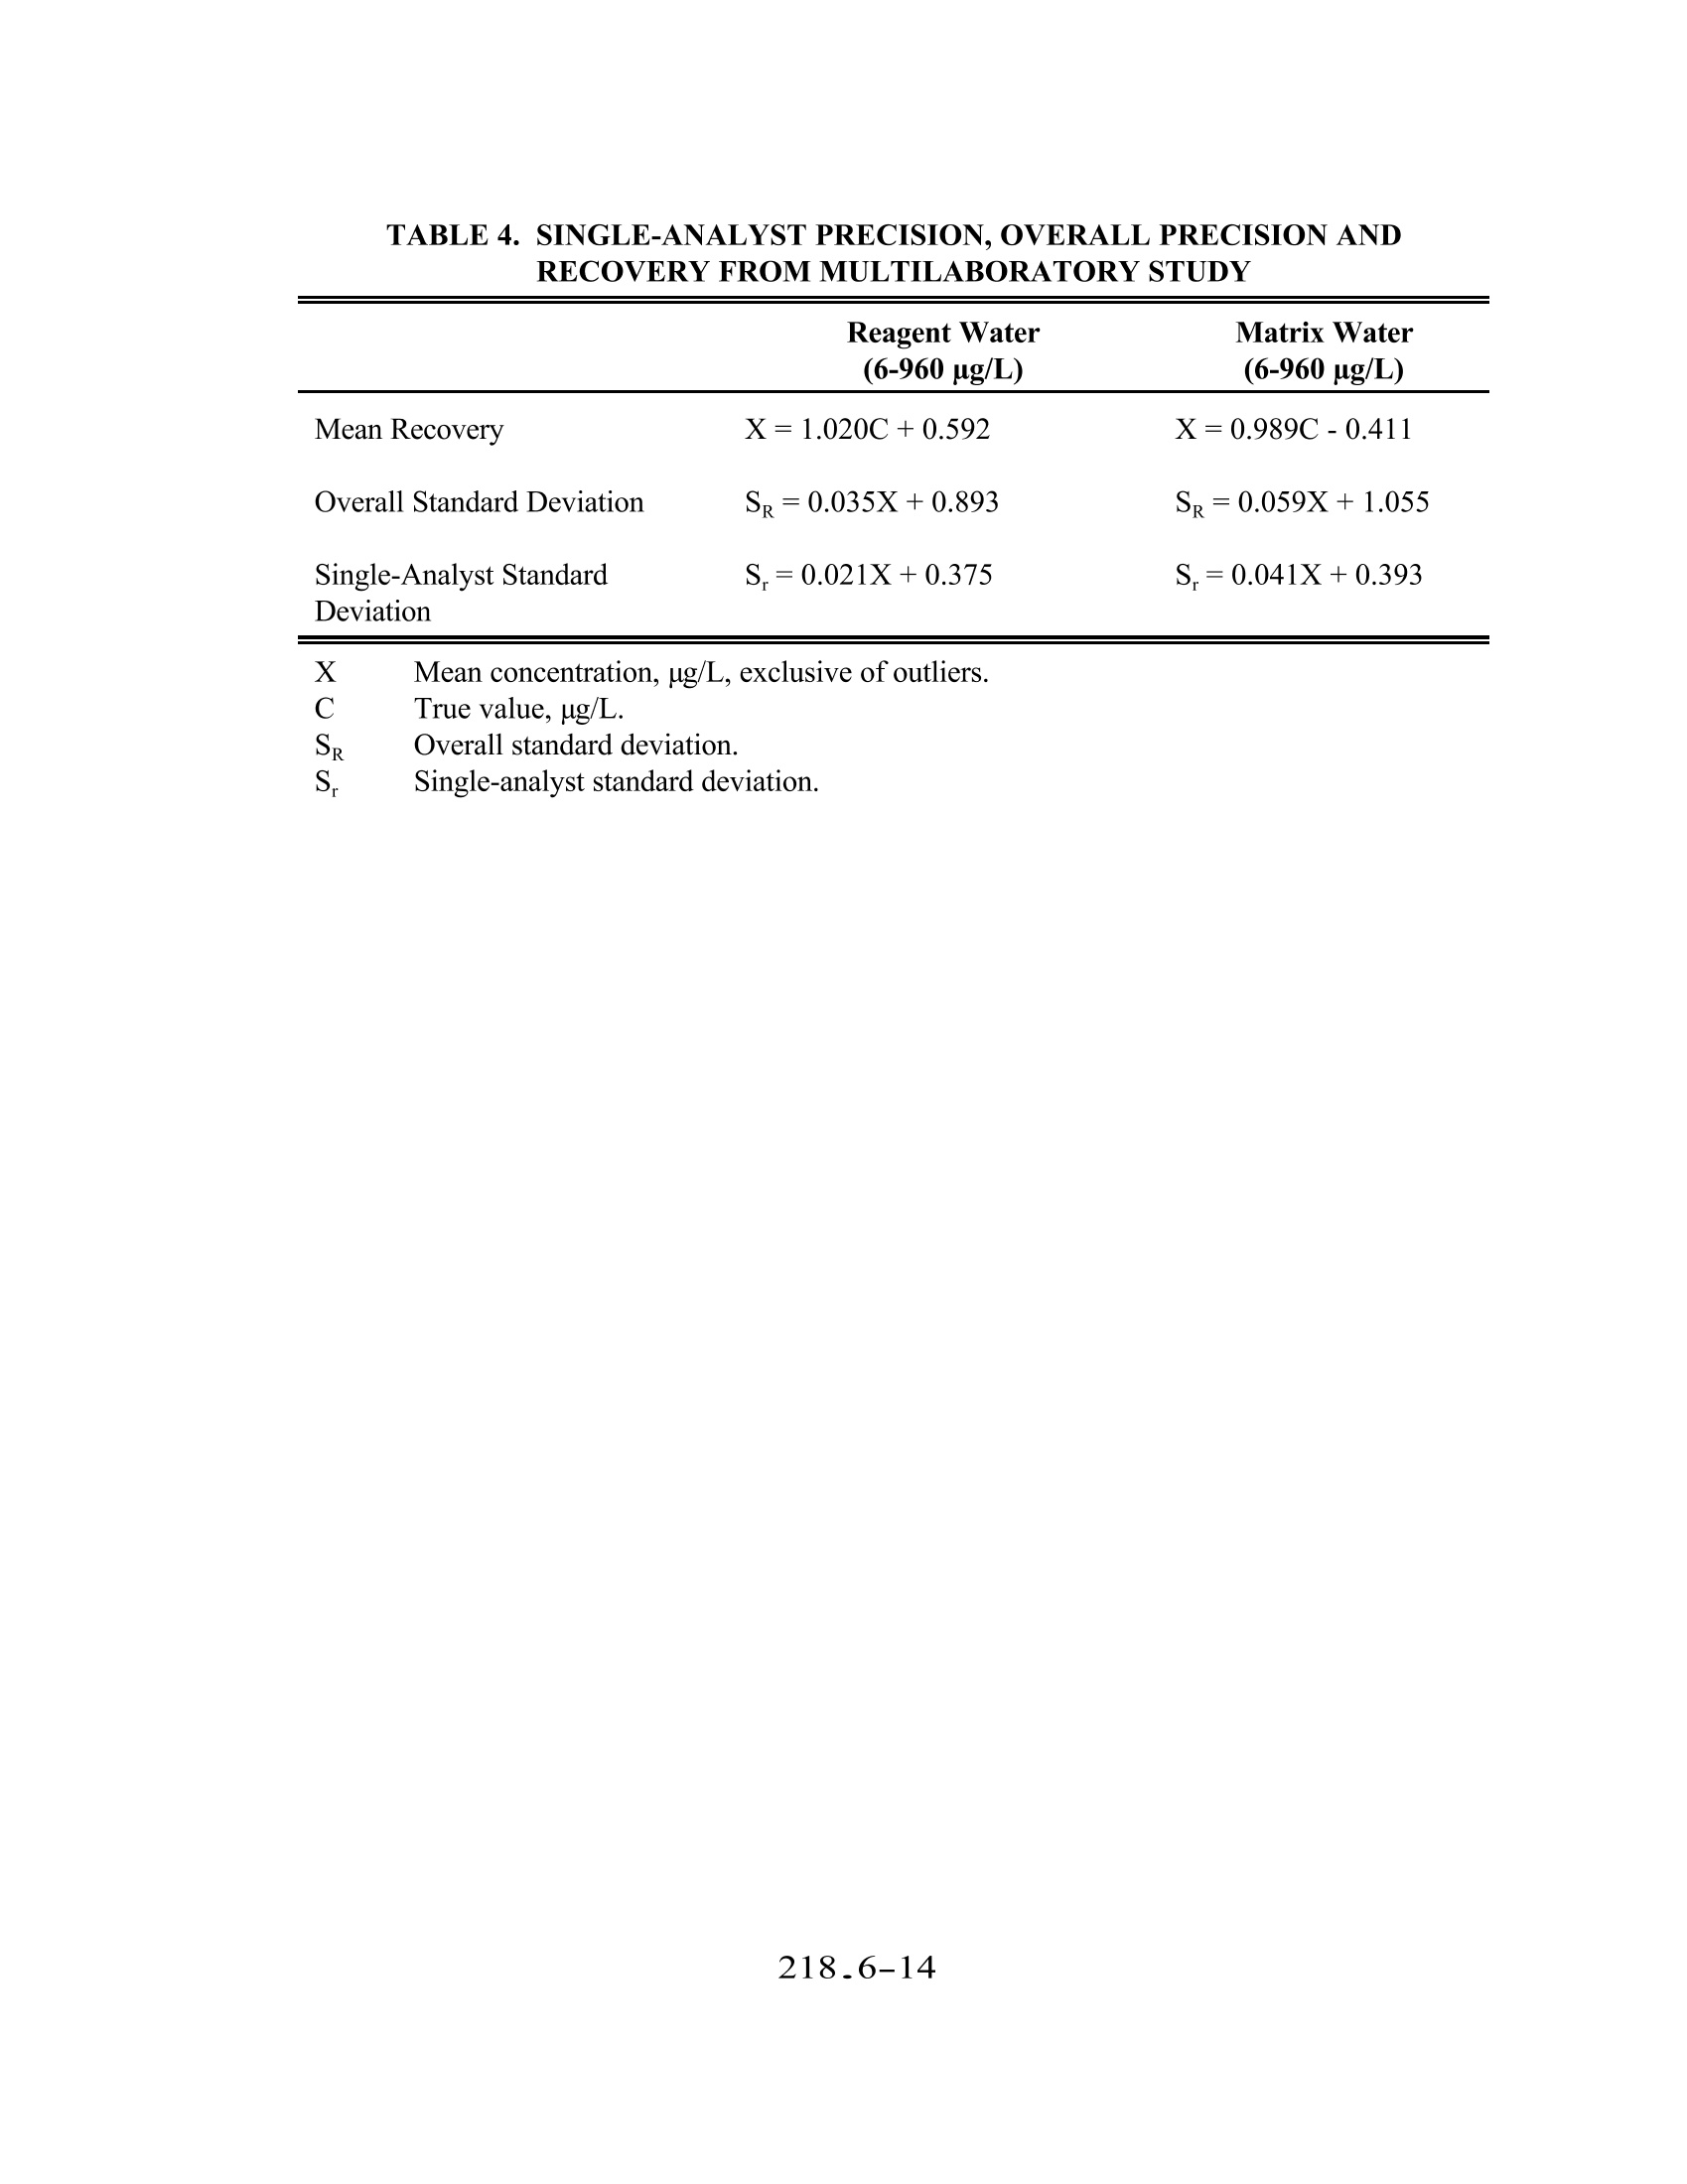
METHOD 218.6 DETERMINATION OF DISSOLVED HEXAVALENT CHROMIUM IN DRINKING WATER, GROUNDWATER,AND INDUSTRIAL WASTEWATER EFFLUENTS BY ION CHROMATOGRAPHY Revision 3.3 (DRAFT)EMMC Version E.J. Arar, S.E. Long (Technology Applications, Inc.), and J.D. Pfaff -Method 218.6, Revision 3.2 (1991)E.J.Arar, J.D. Pfaff, and T.D. Martin - Method 218.6, Revision 3.3 (1994) ENVIRONMENTAL MONITORING SYSTEMS LABORATORY U.S.ENVIRONMENTAL PROTECTION AGENCY CINCINNATI,OHIO 45268 218.6-1 METHOD 218.6 DETERMINATION OF DISSOLVED HEXAVALENT CHROMIUM IN DRINKING WATER,GROUNDWATER, AND INDUSTRIAL WASTEWATER EFFLUENTS BYIONCHROMATOGRAPHY 1.0 SCOPE AND APPLICATION 1.1 This method provides procedures for determination of dissolved hexavalent chromium (asCrO) in drinking water, groundwater, and industrial wastewater effluents. Chemical Abstracts Service Registry Analyte Number (CASRN) Hexavalent Chromium (as CrO) 11104-59-9 1.2 For reference where this method is approved for use in compliance monitoring programs [e.g.,Clean Water Act (NPDES) or Safe Drinking Water Act (SDWA)] consult both theappropriate sections of the Code of Federal Regulation (40 CFR Part 136 Table 1B forNPDES, and Part 141 $ 141.23 for drinking water), and the latest Federal Registerannouncements. 1.3 The method detection limits (MDL) obtained by a single laboratory for hexavalent chromium(Cr (VI)) in the above matrices are listed in Table 1. The MDL obtained by an individuallaboratory for a specific matrix may differ from those listed depending on the nature of thesample and the instrumentation used. A multilaboratory method detection limit (MMDL) inreagent water was determined to be 0.4 ug/L. The IMDL was based upon the within-laboratory standard deviation (s,) of thirteen paired analyses of samples by thirteenlaboratories at an average analyte concentration of 1.4 ug/L. 1.4 Samples containing high levels of anionic species such as sulphate and chloride may causecolumn overload. Samples containing high levels oforganics or sulfides cause rapid reductionof soluble Cr (VI) to Cr (III). Samples must be stored at 4°C and analyzed within 24 hoursof collection. 1.5 This method should be used by analysts experienced in the use of ion chromatography. 2.0 SUMMARYOFMETHOD 2.1 An aqueous sample is filtered through a 0.45 um filter and the filtrate is adjusted to a pH of9-9.5 with a concentrated buffer solution. A measured volume of the sample (50-250 uL)isintroduced into the ion chromatograph. A guard column removes organics from the samplebefore the Cr(VI), as CrO, is separated on a high capacity anion exchange separatorcolumn. Post-column derivatization ofthe Cr (VI) with diphenylcarbazide is followed bydetection of the colored complex at 530 nm. 3.0 DEFINITIONS 3.1 Calibration Standard (CAL)- A solution prepared from the dilution of stock standardsolutions. The CAL solutions are used to calibrate the instrument response with respect toanalyte concentration (Section 7.9). 3.2 Dissolved Analyte-The concentration of analyte in an aqueous sample that will pass througha 0.45 um membrane filter assembly prior to sample acidification. 3.3 Instrument Performance Check (IPC) Solution- A solution of the method analyte, used toevaluate the performance of the instrument system with respect to a defined set of methodcriteria. 3.4 Laboratory Duplicates (LD1 and LD2)-Two aliquots of the same sample taken in thelaboratory and analyzed separately with identical procedures. Analyses of LD1 and LD2indicates precision associated with laboratory procedures, but not with sample collection,preservation, or storage procedures. 3.5 Laboratory Fortified Blank (LFB)-An aliquot of LRB to which known quantities of themethod analytes are added in the laboratory. The LFB is analyzed exactly like a sample, andits purpose is to determine whether the methodology is in control and whether the laboratoryis capable of making accurate and precise measurements. 3.6 Laboratory Fortified Sample Matrix (LFM)- An aliquot of an environmental sample towhich a known quantity of the method analyte is added in the laboratory.The LFM isanalyzed exactly like a sample, and its purpose is to determine whether the sample matrixcontributes bias to the analytical results. The background concentration of the analyte in thesample matrix must be determined in a separate aliquot and the measured value in the LFMcorrected for background concentration. 3.7 Laboratory Reagent Blank (LRB)-An aliquot ofreagent water or other blank matrices thatare treated exactly as a sample including exposure to all glassware, equipment, solvents,reagents, and internal standards that are used with other samples.。The LRB is used todetermine if the method analyte or other interferences are present in the laboratoryenvironment, reagents, or apparatus. 3.8 Linear DynamicRange (LDR)-The concentration range over which the instrument responseto an analyte is linear. 3.9 Method Detection Limit (MDL)- The minimum concentration of an analyte that can beidentified, measured, and reported with 99% confidence that the analyte concentration isgreater than zero. 3.10 Quality Control Sample (QCS)- A solution ofthe method analyte of known concentrationwhich is used to fortify an aliquot of LRB or sample matrix. The QCS is obtained from a source external to the laboratory and different from the source of calibration standards. It isused to check either laboratory or instrument performance. 3.11 Stock Standard Solution- A concentrated solution containing one or more method analytesprepared in the laboratory using assayed reference materials or purchased from a reputablecommercial source. 4.0 NTERFERENCES 4.1 Interferences which affect the accurate determination of Cr (VI) may come from severalsources. 4.1.1 Contamination- A trace amount of Cr is sometimes found in reagent grade salts.Since a concentrated buffer solution is used in this method to adjust the pH ofsamples, reagent blanks should be analyzed to assess for potential Cr (VI)contamination. Contamination can also come from improperly cleaned glassware orcontact of caustic or acidic reagents or samples with stainless steel or pigmentedmaterial. 4.1.2 Reduction of Cr (VI) to Cr (III) can occur in the presence of reducing species in anacidic medium. At pH 6.5 or greater, however, Crowhich is less reactive thanHCrO4 is the predominant species 4.1.3 Overloading of the analytical column capacity with high concentrations of anionicspecies,especially chloride and sulphate, will cause a loss of Cr (VI). The columnspecified in this method can handle samples containing up to 5% sodium sulphate or2% sodium chloride. Poor recoveries from fortified samples and tailing peaks aretypical manifestations of column overload. 5.0 SAFETY 5.1 Hexavalent chromium is toxic and a suspected carcinogen and should be handled withappropriate precautions. IExtreme care should be exercised when weighing the salt forpreparation of the stock standard. Each laboratory is responsible for maintaining a currentawareness file ofOSHA regulations regarding the safe handling of chemicals specified in thismethod.. A reference file of material safety data sheets should also be available to allpersonnel involved in the chemical analysis.4 6.0 EQUIPMENT AND SUPPLIES 6.1 Ion Chromatograph 6.1.1 Instrument equipped with a pump capable of withstanding a minimum backpressureof 2000 psi and of delivering a constant flow in the range of 1-5 mL/min. andcontaining no metal parts in the sample, eluent or reagent flow path. 6.1.2 Helium gas supply (High purity,99.995%). 6.1.3 Pressurized eluent container, plastic, 1 L or 2 L size. 6.1.4 Sample loops of various sizes (50-250uL). 6.1.5 A pressurized reagent delivery module with a mixing tee and beaded mixing coil. 6.1.6 Guard Column- A column placed before the separator column and containing asorbent capable of removing strongly absorbing organics and particles that wouldotherwise damage the separator column (Dionex IonPac NG1 or equivalent). 6.1.7 Separator Column - A column packed with a high capacity anion exchange resincapable of separating Crofrom other sample constituents (Dionex IonPac AS7 orequivalent). 6.1.8 Anion suppressor device: The data presented in this method was generated using aDionex Anion MicroMembrane Suppressor (P/N37106). Other suppressor devicesmay be used provided comparable detection limits are achieved and adequate baselinestability is attained. 6.1.9 A low-volume flow-through cell, visible lamp detector containing no metal parts incontact with the eluent flow path. Detection wavelength is at 530 nm. 6.1.10Recorder, integrator or computer for receiving analog or digital signals for recordingdetector response (peak height or area) as a function of time. 6.2 Labware - All reusable labware (glass, quartz, polyethylene, Teflon, etc.), including thesample containers, should be soaked overnight in laboratory grade detergent and water, rinsedwith water, and soaked for four hours in a mixture of dilute nitric and hydrochloric acid(1+2+9) followed by rinsing with tap water and ASTM Type I water. Note: Chromic acid must not be used for cleaning glassware. 6.2.1 Glassware- Class A volumetric flasks and a graduated cylinder. 6.2.2 Assorted Class A calibrated pipettes. 6.2.3 10 mL male luer-lock disposable syringes. 6.2.4 0.45 um syringe filters. 6.2.5 Storage bottle-High density polypropylene,1 L capacity. 6.3 Sample Processing Equipment 6.3.1 Liquid sample transport containers - High density polypropylene, 125 mL capacity. 6.3.2 Supply of dry ice or refrigerant packing and styrofoam shipment boxes. 6.3.3 pH meter-To read pH range 0-14 with accuracy ±0.03 pH units. 6.3.4 0.45 um filter discs, 7.3 cm diameter (Gelman Acro 50A, Mfr. No. 4262 orequivalent). 6.3.5 Plastic syringe filtration unit (Baxter Scientific, Cat. No. 1240 IN or equivalent). 7.0 REAGENTS AND STANDARDS 7.1 Reagents -All chemicals are ACS grade unless otherwise indicated. 7.1.1 Ammonium hydroxide,NHOH,(sp.gr. 0.902), (CASRN 1336-21-6). 7.1.2 Ammonium sulphate, (NH4)2SO4,(CASRN 7783-20-2). 7.1.3 1,5-Diphenylcarbazide,(CASRN 140-22-7). 7.1.4 Methanol, HPLC grade. 7.1.5 Sulfuric acid, concentrated (sp.gr.1.84). 7.2 Reagent Water -For all sample preparations and dilutions, ASTM Type I water (ASTMD1193) is required. Suitable water may be obtained by passing distilled water through amixed bed of anion and cation exchange resins. 7.3 Cr (VI) Stock Standard Solution - To prepare a 1000 mg/L solution, dissolve 4.501 g ofNa,CrO·4H,O in ASTM Type I water and dilute to 1 L. Transfer to a polypropylene storagecontainer. 7.4 Laboratory Reagent Blank (LRB)-Aqueous LRBs can be prepared by adjusting the pH ofASTM Type I water to 9-9.5 with the same volume of buffer as is used for samples. 7.5 Laboratory Fortified Blank (LFB)-To an aliquot of LRB add an aliquot of stock standard(Section 7.3) to produce a final concentration of 100 ug/L ofCr (VI). The LFB must becarried through the entire sample preparation and analysis scheme. 7.6 Quality Control Sample (QCS)- A quality control sample must be obtained from an outsidelaboratory. Dilute an aliquot according to instructions and analyze with samples.. Arecommended minimum concentration for the QCS is 10 ug/L. 7.7 Eluent- Dissolve 33 g of ammonium sulphate in 500 mL of ASTM Type I water and add 6.5mL of ammonium hydroxide. Dilute to 1 L with ASTM Type I water. 7.8 Post-Column Reagent-Dissolve 0.5 g of 1,5-diphenylcarbazide in 100 mL of HPLC grademethanol. Add to about 500 mL of ASTM type I water containing 28 mL of 98% sulfuricacid while stirring. Dilute with ASTM Type I water to 1L in a volumetric flask. Reagentis stable for four or five days but should be prepared only as needed. 7.9 Buffer Solution - Dissolve 33 g of ammonium sulphate in 75 mL of ASTM Type I water andadd 6.5 mL of ammonium hydroxide. Dilute to 100 mL with ASTM Type I water. 8.0 SAMPLE COLLECTION,PRESERVATION, AND STORAGE 8.1 Prior to sample collection, consideration should be given to the type of data required so thatappropriate preservation and pretreatment steps can be taken. Filtration and pH adjustmentshould be performed at the time of sample collection or as soon thereafter as practicallypossible. 8.2 For determination of dissolved Cr(VI), the sample should be filtered through a 0.45 um filter.Use a portion of the sample to rinse the syringe filtration unit and filter and then collect therequired volume of filtrate. Adjust the pH of the sample to 9-9.5 by adding dropwise asolution of the buffer, periodically checking the pH with the pH meter. Approximately 10 mLof sample are sufficient for three IC analyses. 8.3 Ship and store the samples at 4°C. Bring to ambient temperature prior to analysis. Samplesmust be analyzed within 24 hours of collection. 9.0 QUALITY CONTROL 9.1 Each laboratory using this method is required to operate a formal quality control (QC)program. The minimum requirements of this program consist of an initial demonstration oflaboratory capability, and the analysis of laboratory reagent blanks, and fortified blanks andsamples as a continuing check on performance..The laboratory is required to maintainperformance records that define the quality of the data thus generated. 9.2 Initial Demonstration of Performance (mandatory) 9.2.1 The initial demonstration of performance is used to characterize instrumentperformance (MDLs and linear dynamic range) and laboratory performance prior tosample analyses. 9.2.2 Method detection limit (MDL) --A MDL should be established using reagent waterfortified at a concentration of two to five times the estimated detection limit. Todetermine the MDL value, take seven replicate aliquots of the fortified reagent waterand process through the entire analytical method. Perform all calculations defined inthe method and report the concentration values in the appropriate units. Calculate theMDL as follows: where: t = Student's t value for n-1 degrees of freedom at the 99% confidencelevel; t= 3.143 for six degrees of freedom 218_6-7 S= standard deviation of the replicate analyses The MDL must be sufficient to detect Cr (VI) at the required level according tocompliance monitoring regulation (Section 1.2). The MDL should be determinedannually, when a new operator begins work or whenever there is a change ininstrument analytical hardware or operating conditions. 9.2.3 Linear dynamic range (LDR)-- The LDR should be determined by analyzing aminimum of seven calibration standards ranging in concentration from 1-5,000 ug/Lacross all sensitivity settings of the spectrophotometer. Normalize responses bydividing the response by the sensitivity setting multiplier.. Perform the linearregression of normalized response vs. concentration and obtain the constants m andb, where m is the slope of the line and b is the y-intercept. Incrementally analyzestandards of higher concentration until the measured absorbance response, R, of astandard no longer yields a calculated concentration, C, that is ±10% of the knownconcentration,C, where Cc=(R-b)/m. That concentration defines the upper limitofthe LDR for your instrument and analytical operating conditions. Samples havinga concentration that is ≥90% of the upper limit of the LDR must be diluted to fallwithin the bounds ofthe current calibration curve concentration range and reanalyzed. 9.3 Assessing Laboratory Performance (mandatory) 9.3. The laboratory must analyze at least one LRB (Section 7.4) with each set of samples.Reagent blank data are used to assess contamination from a laboratory environment.If the Cr (VI) value in the reagent blank exceeds the determined MDL, thenlaboratory or reagent contamination should be suspected. Any determined source ofcontamination should be corrected and the samples reanalyzed. 9.3.2 The laboratory must analyze at least one LFB (Section 7.5) with each set of samples.Calculate accuracy as percent recovery (Section 9.4.2). If the recovery of Cr (VI)falls outside the control limits (Section 9.3.3), then the procedure is judged out ofcontrol, and the source of the problem should be identified and resolved beforecontinuing the analysis. 9.3.3 Until sufficient data become available (usually a minimum of 20-30 analyses), assesslaboratory performance against recovery limits of90-110%. When sufficient internalperformance data becomes available, develop control limits from the percent meanrecovery (x) and the standard deviation(s) of the mean recovery. These data are usedto establish upper and lower control limits as follows: UPPER CONTROL LIMIT= x+3s LOWER CONTROL LIMIT = X-3s 9.3.4 To verify that the instrument is properly calibrated on a continuing basis, run a LRBand a IPC (Section 3.3) after every 10 analyses. The results of analyses of standardswill indicate whether the calibration remains valid. If the measured concentration ofthe IPC (a midpoint calibration standard) deviates from the true concentration by more than ±5%, perform another analysis of the LPC. If the discrepancy is still ±5%of the known concentration then the instrument must be recalibrated and the previous10 samples reanalyzed. The instrument response from the calibration check may beused for recalibration purposes. 9.3.5 Quality control sample (QCS)-Each quarter, the laboratory should analyze one ormore QCS. If criteria provided with the QCS are not within ±10% of the statedvalue, corrective action must be taken and documented. 9.4 Assessing Analyte Recovery and Data Quality 9.4.1 The laboratory must add a known amount of Cr (VI) to a minimum of 10% ofsamples. The concentration level can be the same as that of the laboratory fortifiedblank (Section 7.5). 9.4.2 Calculate the percent recovery for Cr (VI) corrected for background concentrationmeasured in the unfortified sample,and compare this value to the control limitsestablished in Section 9.3.3 for the analysis ofLFBs. Fortified recovery calculationsare not required if the concentration of Cr (VI) added is less than 2X the samplebackground concentration. Percent recovery may be calculated in units appropriateto the matrix, using the following equation: where: Rpercent recovery C CF fortified sample concentration sample background concentration concentration equivalent of Cr (VI) added to sample 9.4.3 Ifthe recovery ofCr (VI) falls outside control limits established in Section 9.3.3 andthe recovery obtained for the LFB was shown to be in control (Section 9.3), therecovery problem encountered with the fortified sample is judged to be matrix related,not system related. The result for Cr (VI) in the unfortified sample must be labelled'suspect matrix. 10.0 CALIBRATION AND STANDARDIZATION 10.1 Establish IC operating conditions as indicated in Table 2. The flow rate of the eluent pumpis set at 1.5 mL/min. and the pressure of the reagent delivery module adjusted so that the finalflow rate of the post column reagent (Section 7.8) from the detector is 2.0 mL/min. Thisrequires manual adjustment and measurement of the final flow rate using a graduated cylinderand a stop watch. A warm up period of approximately 30 minutes after the flow rate has been adjusted is recommended and the flow rate should be checked prior to calibration and sampleanalysis. 10.2 Injection sample loop size should be chosen based on anticipated sample concentrations andthe selected sensitivity setting of the spectrophotometer. A 250 puL loop was used to establishthe method detection limits in Table 1. A 50 pL loop is normally sufficient for higherconcentrations. The sample volume used to load the sample loop should be at least 10 timesthe loop size so that all tubing in contact with sample is thoroughly flushed with new sampleto minimize cross-contamination. 10.3 Before using the procedure (Section 11.0) to analyze samples, there must be data availabledocumenting initial demonstration of performance. The required data and procec 1Sdescribed in Section 9.2. This data must be generated using the same instrument operatingconditions and calibration routine to be used for sample analysis. These documented dat:must be kept on file and be available for review by the data user. 10.4 The recommended calibration routine is given in Section 11.3. 11.0 PROCEDURE 11.1 Filtered, pH adjusted samples at 4°C should be brought to ambienttemperature prior to analysis. 11.2 Initiate instrument operating configuration described in Section 10.0 and Table 2. 11.3 Calibration-Before samples are analyzed a calibration should be performed using a minimumof three calibration solutions that bracket the anticipated concentration range of the samples.Calibration standards should be prepared from the stock standard (Section 7.3)by appropriatedilution with ASTM Type I water (Section 7.2) in volumetric flasks. The solution should beadjusted to pH 9-9.5 with the buffer solution (Section 7.9) prior to final dilution. 11.4 Construct a calibration curve of analyte response (peak height or area) versus analyteconcentration over a concentration range of one or two orders of magnitude. The calibrationrange should bracket the anticipated concentration range of samples. The coefficient ofcorrelation (r) for the curve should be 0.999 or greater. 11.5 Draw into a new, unused syringe (Section 6.2.3) approximately 3 mL of sample. Inject 10Xthe volume of the sample loop into the injection valve of the IC. Sample concentrations thatexceed the calibration range must be diluted and reanalyzed. 11.6 During the analysis of samples, the laboratory must comply with the required quality controldescribed in Sections 9.3 and 9.4. 12.0 DATA ANALYSIS AND CALCULATIONS 12.1 The sample concentration can be calculated from the calibration curve. Report values inug/L. Sample concentrations must be corrected for any Cr (VI) contamination found in theLRB. 12.2 The QC data obtained during sample analyses provide an indication of the quality of sampledata and should be reported with sample results. 13.0 METHOD PERFORMANCE 13.1 Instrumental operating conditions used for single-laboratory testing of the method aresummarized in Table 2. MDLs for dissolved Cr (VI) in five matrix waters are listed in Table1. 13.2 Single-analyst precision and accuracy data for five matrix waters, drinking water, deionizedwater, groundwater, treated municipal sewage wastewater, and treated electroplatingwastewater are listed in Table 3. 13.3 Pooled Precision and Accuracy: This method was tested by 21 volunteerlaboratories in a joint study by the USEPA and the American Society forTesting and Materials (ASTM). Mean recovery and accuracy for Cr (VI)(as CrO) was determined from the retained data of 13 laboratories inreagent water, drinking water, ground water, and various industrialwastewaters. For reagent water, the mean recovery and the overall, andsingle-analyst relative standard deviations were 105%,7.8% and 3.9%,respectively. For the other matrices combined, the same values were 96.7%,11.9% and 6.3%, respectively. Table 4 contains the linear equations thatdescribe the single-analyst standard deviation, overall standard deviation andmean recovery of Cr (VI) in reagent water and matrix water. 14.0 POLLUTIONPREVENTION 14.1 Pollution prevention encompasses any technique that reduces or eliminates the quantity ortoxicity of waste at the point of generation. Numerous opportunities for pollution preventionexist in laboratory operation. The EPA has established a preferred hierarchy ofenvironmentalmanagement techniques that places pollution prevention as the management option of firstchoice. Whenever feasible, laboratory personnel should use pollution prevention techniquesto address their waste generation. When wastes cannot be feasibly reduced at the source, theAgency recommends recycling as the next best option. 14.2 For information about pollution prevention that may be applicable to laboratories and researchinstitutions, consult“Less is Better:ILaboratory Chemical Management for WasteReduction”, available from the American Chemical Society's Department of GovernmentRelations and Science Policy, 1155 16th Street N.W., Washington D.C. 20036, (202)872-4477. 15.0 WASTE MANAGEMENT 15.1 The Environmental Protection Agency requires that laboratory waste management practicesbe conducted consistent with all applicable rule and regulations.The Agency urgeslaboratories to protect the air, water, and land by minimizing and controlling all releases fromhoods and bench operations, complying with the letter and spirit of any sewer dischargepermits and regulations, and by complying with all solid and hazardous waste regulations,particularly the hazardous waste identification rules and land disposal restrictions. For furtherinformation on waste management consult “The Waste Management Manual for LaboratoryPersonnel",available from the American Chemical Society at the address listed in the Sectoion14.2. 16.0 REFERENCES 1. Glaser, J.A., Foerst, D.L.,McKee, G.D., Quave, S.A. and Budde, W.L. "Trace Analyses forWastewaters", Environ. Sci. and Technol., Vol.15,No.12, 1981, pp.1426-1435. 2. Dionex Technical Note No. 26, May 1990. 3. "Proposed OSHA Safety and Health Standards, Laboratories," Occupational Safety andHealth Administration, Federal Register, July 24, 1986. 4. "OSHA Safety and Health Standards, General Industry,"(29 CFR 1910), OccupationalSafety and Health Administration, OSHA 2206, revised January 1976. 17.0 TABLES.DIAGRAMS.FLOWCHARTS AND VALIDATION DATA Conc. Used to Compute MDL MDL Maxtrix Type ug/L ug/L Reagent Water 0.4 Drinking Water 2 0.3 Ground Water 2 0.3 Primary Sewage Wastewater 2 0.3 Electroplating Wastewater 2 0.3 TABLE 2. ION CHROMATOGRAPHIC CONDITIONS Cr (VI) Sample Type (ug/L) Mean Recovery (%) RPD Reagent Water 100 100 0.8 1000 100 0.0 Drinking Water 100 108 6.7 1000 1.5 Ground Water 100 0.0 1000 0.8 Primary Sewage 100 100 0.7 Wastewater Effluent 1000 2.7 Electroplating 100 Wastewater Effluent 1000 04 Sample fortified at this concentration level. RPD- relative percent difference between duplicates. TABLE 4. SINGLE-ANALYST PRECISION,OVERALL PRECISION ANDRECOVERYFROMMULTILABORATORY STUDY Reagent Water Matrix Water (6-960 ug/L) (6-960 pg/L) Mean Recovery X=1.020C+0.592 X=0.989C-0.411 Overall Standard Deviation SR=0.035X+0.893 SR=0.059X+1.055 Single-Analyst Standard S.=0.021X+0.375 S.=0.041X+0.393 Deviation XMean concentration, ug/L, exclusive of outliers.CSS True value, ug/L. Overall standard deviation. Single-analyst standard deviation. OFFICE OF RESEARCH AND DEVELOPMENT
确定
还剩12页未读,是否继续阅读?

产品配置单

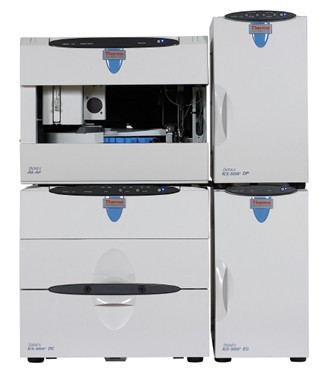
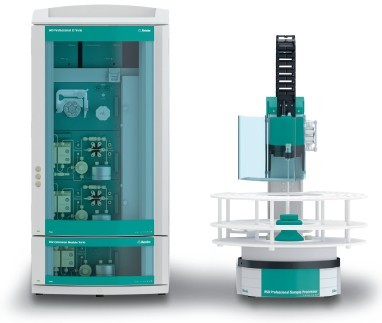
赛默飞色谱与质谱为您提供《地下水中铬检测方案(离子色谱仪)》,该方案主要用于环境水(除海水)中(类)金属及其化合物检测,参考标准--,《地下水中铬检测方案(离子色谱仪)》用到的仪器有赛默飞戴安ICS-5000+高压离子色谱系统、赛默飞ICS5000多功能离子色谱、赛默飞戴安ICS-900离子色谱仪
推荐专场
相关方案
更多
该厂商其他方案
更多