


应用范围
用离子色谱法测定试剂水,表面水,地下水,处理好的饮用水中高氯酸根的方法
方法要点
1.0mL的样品,注入离子色谱,高氯酸根通过含有离子色谱泵,进样阀,保护柱,分离柱,抑制装置和电导检测器的系统进行分离和检测。
建议的色谱条件
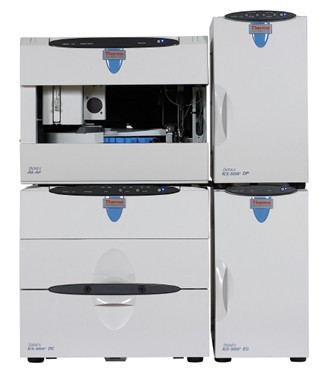
1. 色谱柱:Dionex AG16保护柱或相同产品;Dionex AS16分离柱或相同产品(美国EPA研究认为对于低含量的常见阴离子AG5/AS5和AG11/AS11均可以用于测定,但对于对于高含量的常见阴离子则采用AG16/AS16,色谱柱必须选用低或极低的亲水性)
2. 抑制器装置:Dionex Anion Self Regenerating Suppressor(ASRS)或相同产品,每分钟基线漂移/噪声不大于5nS。抑制电流设定为300mA,外加水流速5ml/min,
3. 检测器:Dionex CD20或相同产品
4. 数据处理系统:Dionex PeakNet Data Chromatography Software
5. 淋洗液:50 mM 碳酸钠,流速:1mL/min
方案详情

FIGURE 1. CHROMATOGRAM OF LOW LEVEL PERCHLORATE (4.0 ug/L)IN REAGENT WATER(Conditions as indicated in Table 1) FIGURE 2. CHROMATOGRAM OF 25 ug/L PERCHLORATE IN REAGENT WATER(Conditions as indicated in Table 1) METHOD 314.0 DETERMINATION OF PERCHLORATE IN DRINKING WATER USING IONCHROMATOGRAPHY Revision 1.0 November 1999 Daniel P. Hautman and David J. Munch, US EPA, Office of Ground Water and Drinking WaterAndrew D. Eaton and Ali W. Haghani, Montgomery Watson Laboratories NATIONAL EXPOSURE RESEARCH LABORATORY OFFICE OF RESEARCH AND DEVELOPMENT U.S.ENVIRONMENTAL PROTECTION AGENCY CINCINNATI,OHIO 45268 METHOD 314.0 DETERMINATION OF PERCHLORATE IN DRINKING WATER USING IONCHROMATOGRAPHY 1. SCOPE AND APPLICATION 1.1 This method covers the determination of perchlorate in reagent water, surface water,ground water, and finished drinking water using ion chromatography. 1.2 The single laboratory reagent water Method Detection Limit (MDL, defined in Section3.16) for the above analyte is listed in Table 1. The MDL for a specific matrix maydiffer from those listed, depending upon the nature of the sample and the specificinstrumentation employed. 1.2.1 In order to achieve comparable detection limits, an ion chromatographic systemmust utilize suppressed conductivity detection, be properly maintained, and mustbe capable of yielding a baseline with no more than 5 nanosiemen (nS) noise/driftper minute of monitored response over the background conductivity. 1.3This method is recommended for use only by or under the supervision of analystsexperienced in the use of ion chromatography and in the interpretation of the resultingion chromatograms. 1.4 When this method is used to analyze unfamiliar samples for perchlorate, anionidentification should be supported by the use of a laboratory fortified matrix sample.The fortification procedure is described in Section 9.4.1. 1.5 Users of the method data should identify data quality objectives prior to analysis. Usersof the method must demonstrate the ability to generate acceptable results, using theprocedures described in Section 9.0. 1.6This method specifies an IC column and analytical conditions which were determined tobe the most effective for the widest array of sample matrices. Other IC procedures havebeen written which incorporate similar columns and conditions, such as hydroxide basedmobile phases, low hydrophobicity IC columns, and measurement by suppressedconductivity detection.5 During the development of this method, these otherprocedures, as well as the columns and conditions outlined in this method, wereconcurrently investigated with comparable results for test matrices with moderate levelsof common inorganic background anions. These findings were consistent with those ofthe Inter-Agency Perchlorate Steering Committee,Analytical Subcommittee’s Report,published in 1998, which reported on the results of an interlaboratory validation of these other Ion Chromatographic Methods. The columns and conditions identified in thismethod were recommended since they bore the greatest tolerance for the highest levelsof common inorganic anion interference. 2. SUMMARYOF METHOD 2.1 A 1.0 mL volume of sample (see Note), is introduced into an ion chromatograph (IC).Perchlorate is separated and measured, using a system comprised of an ionchromatographic pump, sample injection valve, guard column, analytical column,suppressor device, and conductivity detector. NOTE::This large sample loop (1.0 mL) can be made using approximately 219 cm (86inches) of 0.03 inch i.d. PEEK tubing. The exact volume is not critical sinceall standards and samples will use the same sample loop. However, the volumeshould be verified to be within 5% of this volume by weighing the sample loopempty, filling the loop with deionized water and re-weighing the loop. Thevolume can then be approximated by assuming the density of water is 1.0mg/uL. 3.DEFINITIONS 3.1 ANALYSIS BATCH -- A sequence of samples, which are analyzed within a 30 hourperiod and include no more than 20 field samples. An Analysis Batch must also includeall required QC samples, which do not contribute to the maximum field sample total of20. The required QC samples include: · Instrument Performance Check Standard (IPC) ·Laboratory Reagent Blank (LRB) · Initial Calibration Check Standard (ICCS) ·Laboratory Fortified Blank (LFB) · Continuing Calibration Check Standard (CCCS), when the batch contains more than10 field samples ·End Calibration Check Standard (ECCS) · Laboratory Fortified Matrix (LFM) ·Either a Field Duplicate, a Laboratory Duplicate or a duplicate of the LFM · (if pretreated samples are included in batch) Pretreated LRB · (if pretreated samples are included in batch) Pretreated LFB · (if pretreated samples are included in batch) Pretreated LFM, for each pretreatedmatrix. NOTE: Every field sample analysis, including both diluted and pretreated field samples,but excluding any LFM or duplicate field sample analysis which qualify as QCsamples, must be applied to the maximum of 20 total field samples permitted inan analysis batch. 3.1.1 A field sample(s), included in the analysis batch, can be reanalyzed following theECCS provided the 30 hr time limit for the analysis batch has not expired. Thelaboratory can reanalyze that sample(s) but must initially conduct a secondICCS before the reanalysis and an ECCS after the final reanalysis. The ECCSmust be completed within the 30 hr window. 3.2 CALIBRATION STANDARD (CAL)--A solution prepared from the primary dilutionstandard solution(s) or stock standard solutions. The CAL solutions are used tocalibrate the instrument response with respect to analyte concentration. 3.3 INITIAL CALIBRATION STANDARDS-- A series of CAL solutions used to initiallyestablish instrument calibration and develop calibration curves for individual targetanions (Section 10.2). 3.4 INITIAL CALIBRATION CHECK STANDARD (ICCS)-- A CAL solution, which isanalyzed initially, prior to any field sample analyses, which verifies the previouslyestablished calibration curve. The concentration for the initial calibration check standardMUST be at or below the MRL (Section 3.17) level. 3.5 CONTINUING CALIBRATION CHECK STANDARDS (CCCS)--A CAL solutionwhich is analyzed after every tenth field sample analyses, not including QC samples,which verifies the previously established calibration curve and confirms accurate analytequantitation for the previous ten field samples analyzed. The concentration for thecontinuing calibration check standards should be either at a middle calibration level or atthe highest calibration level (Section 10.3.2). 3.6 END CALIBRATION CHECK STANDARD (ECCS)--A CAL solution which isanalyzed after the last field sample analyses which verifies the previously establishedcalibration curve and confirms accurate analyte quantitation for all field samplesanalyzed since the last continuing calibration check. The end calibration check standardshould be either the middle or high level continuing calibration check standard (Section10.3.2). 3.7 FIELD DUPLICATES (FD) --Two separate samples collected at the same time andplace under identical circumstances and treated exactly the same throughout field andlaboratory procedures. Analyses of field duplicates indicate the precision associatedwith sample collection, preservation and storage, as well as with laboratory procedures. 3.8 INSTRUMENT PERFORMANCE CHECK SOLUTION (IPC)-- A solution containinga specific concentration of perchlorate and other test substances (namely chloride,sulfate and carbonate) used to evaluate the performance of the instrument system withrespect to a defined set of criteria. 3.9LABORATORY DUPLICATE (LD)-- Two sample aliquots (LD1 and LD2), taken inthe laboratory from a single sample bottle, and analyzed separately with identicalprocedures. Analyses of LD1 and LD2 indicate precision associated specifically with thelaboratory procedures by removing variation contributed from sample collection,preservation and storage procedures. 3.10 LABORATORY FORTIFIED BLANK (LFB)- An aliquot of reagent water, or otherblank matrix, to which a known quantity of perchlorate is added in the laboratory. TheLFB is analyzed exactly like a sample, and its purpose is to determine whether themethodology is in control, and whether the laboratory is capable of making accurate andprecise measurements. 3.11 LABORATORY FORTIFIED SAMPLE MATRIX (LFM)- An aliquot of anenvironmental field sample to which a known quantity of perchlorate is added in thelaboratory. The LFM is analyzed exactly like a sample, and its purpose is to determinewhether the sample matrix contributes bias to the analytical result (when compared tothe result for the LFB). The background concentrations of perchlorate, in the samplematrix, must be initially determined in a separate aliquot and the measured value in theLFM corrected for this background concentration. 3.12 LABORATORY REAGENT BLANK (LRB)- An aliquot of reagent water or otherblank matrix that is treated exactly as a sample including exposure to all glassware,equipment, solvents, filtration and reagents that are used with other samples. The LRBis used to determine if perchlorate or other interferences are present in the laboratoryenvironment, the reagents, or the apparatus. 3.13 LINEAR CALIBRATION RANGE (LCR)-The concentration range over which theinstrument response is linear. 3.14 MATERIAL SAFETY DATA SHEET (MSDS)- Written information provided byvendors concerning a chemical's toxicity, health hazards, physical properties, fire, andreactivity data including storage, spill, and handling precautions. 3.15 MATRIX CONDUCTIVITY THRESHOLD (MCT)-The highest permittedconductance of an unknown sample matrix, measured prior to conducting the analysis,which is used to determine when sample matrix dilution or pretreatment is required. Theconductance of a sample matrix is proportional to the common anions present in thematrix (which contribute to the level of total dissolved solids [TDS]) which can greatlyaffect the integrity of this analysis. The value for this threshold is dependant on theconditions, hardware, and state of the hardware employed. Consequently, this thresholdis not method defined and must be determined by the individual analytical laboratoryduring the Initial Demonstration of Capability (IDC) and confirmed in each analysisbatch using the Instrument Performance Check (IPC) Solution. Matrix conductivity is measured in microsiemens/cm (uS/cm) or microMhos/cm(uMhos/cm) which areconsidered equivalent terms. 3.16 METHOD DETECTION LIMIT (MDL)- The minimum concentration of an analytethat can be identified, measured and reported with 99% confidence that the analyteconcentration is greater than zero. 3.17 MINIMUM REPORTING LEVEL (MRL)- The minimum concentration that can bereported as a quantitated value for a target analyte in a sample following analysis. Thisdefined concentration can be no lower than the concentration of the lowest calibrationstandard and can only be used ifacceptable quality control criteria for this standard aremet. 3.18 PEAK AREA TO HEIGHT RATIO (A/H)- The ratio of the peak area divided by thepeak height which is used as a tool to monitor analytical performance. This ratio is usedto establish and monitor the MCT and represents an objective means of assessinganalytical performance when analyzing high conductivity matrices. A gradual distortionof the baseline is typically observed in the retention time window for perchlorate as thematrix conductivity increases (consistent with elevated levels of common anions) whichwill more significantly influence peak height relative to the influence on peak area. Asthe distortion of the baseline increases, this ratio increases, and the integrity of themeasured perchlorate will be compromised. 3.19 PROFICIENCY TESTING (PT) or PERFORMANCE EVALUATION (PE) SAMPLE--A certified solution of method analytes whose concentration is unknown to theanalyst. Often, an aliquot of this solution is added to a known volume of reagent waterand analyzed with procedures used for samples. Often, results of these analyses are usedas part of a laboratory certification program to objectively determine the capabilities of alaboratory to achieve high quality results. 3.20 QUALITY CONTROL SAMPLE (QCS)- A solution of method analytes of knownconcentrations that is obtained from a source external to the laboratory and differentfrom the source of calibration standards. It is used to check laboratory performancewith externally prepared test materials. 3.21 STOCK STANDARD SOLUTION (SSS)-- A concentrated solution containingperchlorate which is either prepared in the laboratory using assayed reference materialsor purchased from a reputable commercial source. 3.22 TOTAL DISSOLVED SOLIDS (TDS)--Both organic and inorganic constituent whichare dissolved in a sample matrix and are not removed by particulate filtration. 4.. INTERFERENCES 41 Method interferences may be caused by contaminants in the reagent water, reagents,glassware, and other sample processing apparatus that lead to discrete artifacts orelevated baselines in an ion chromatogram. These interferences can lead to false positiveresults for the target analyte as well as reduced detection limits as a consequence ofelevated baseline noise. 4,2 Interferences can be divided into three different categories: direct chromatographiccoelution, where an analyte response is observed at very nearly the same retention timeas the target anion; concentration dependant coelution, which is observed when theresponse of higher than typical concentrations of the neighboring peak overlap into theretention window of the target anion; and, ionic character displacement, where retentiontimes may significantly shift due to the influence of high ionic strength matrices (highmineral content or hardness) overloading the exchange sites in the column andsignificantly shortening target analyte's retention times. 4.2.1 A direct chromatographic coelution may be solved by changing columns, eluentstrength, modifying the eluent with organic solvents (if compatible with ICcolumns), changing the detection systems, or selective removal of the interferencewith pretreatment. Sample dilution will have little to no effect. The analystMUST verify that these changes do not induce any negative affects on methodperformance by repeating and passing all the QC criteria as described in Section9. 4.2.2 Sample dilution may resolve some of the difficulties if the interference is theresult of either concentration dependant coelution or ionic characterdisplacement, but it must be clarified that sample dilution will alter yourMinimum Reporting Limit (MRL) by a proportion equivalent to that of thedilution. Therefore, careful consideration of project objectives should be givenprior to performing such a dilution. An alternative to sample dilution, may bedilution of the eluent as outlined in Section 11.2.6. 4.2.3 Pretreatment cartridges can be effective as a means to eliminate certain matrixinterferences. With any proposed pretreatment, the analyst must verify that thetarget analyte is not affected by monitoring recovery after pretreatment(additional pretreated LFM requirement see Section 11.1.4.6) and that nobackground contaminants are introduced by the pretreatment (additionalpretreated LRB requirement see Sections 9.3.1.1 and 11.1.4.2). With advancesin analytical separator column technology which employ higher capacity anionexchange resins, the need for these cartridges has been greatly reduced. 4.2.3.1 Extreme caution should be exercised in using these pretreatmentcartridges. Artifacts are known to leach from certain cartridges whichcan foul the guard and analytical columns causing loss of columncapacity indicated by shortened retention times and irreproducibleresults. Frequently compare your calibration standard chromatogramsto those of the column test chromatogram (received when the columnwas purchased) or use calibration chromatograms generated when thecolumn was initially installed, to insure proper separation and similarresponse ratios between the target analytes are observed. 4.2.3.2 If LRB background problems are encountered in the retention timewindow for perchlorate when these pretreatment cartridges have beenemployed, increase the initial reagent water rinse ofthe cartridge toapproximately five times the volume specified by the manufacturer. 4,3 Sample matrices with high concentrations of common anions such as chloride, sulfateand carbonate can make the analysis problematic by destabilizing the baseline in theretention time window for perchlorate. This is evidenced by observing a protractedtailing following the initial elution of the more weakly retained anions (chloride,carbonate, and sulfate) which extends into the perchlorate retention time window.These common anion levels can be indirectly assessed by monitoring the conductivity ofthe matrix. Consequently, all sample matrices must be monitored for conductivity(Section 11.1.2) prior to analysis. When the laboratory determined Matrix ConductivityThreshold (MCT, see Section 9.2.8) is exceeded, procedures incorporating sampledilution and/or pretreatment must be performed as specified in Sections 11.1.3 and11.1.4, respectively. 4.4 All reagent solutions (eluents, external water for ASRS suppressor, etc...) used by theinstrument must be filtered through no larger than a 0.45 um nominal pore sizemembrane or frit to remove particulates and prevent damage to the instrument, columnsand flow systems. Sample filtration must also be employed on every sample prior toanalysis. This applies not only to field samples but also to the laboratory reagent blank(LRB) and laboratory fortified blank (LFB). The LRB and LFB samples function ascontrols and must be filtered to confirm no bias is attributable to the filtration.5 FFilterthe samples through a membrane or frit with no larger than a 0.45 um nominal pore size.Syringe mounted, cartridge type, filters work well. Filters specifically designed for ICapplications should be used. 4.5 Close attention should be given to the potential for carry over peaks from one analysiswhich will effect the proper detection of perchlorate in a second, subsequent analysis. Itis the responsibility of the user to confirm that no late eluting peaks have carried overinto a subsequent analysis thereby compromising the integrity of the analytical results. 5.. SAFETY 5.1 The toxicity or carcinogenicity of each reagent used in this method have not been fullyestablished. Each chemical should be regarded as a potential health hazard and exposureshould be as low as reasonably achievable. Cautions are specifically listed below inSection 5.3 for hazardous materials. 5.2 Each laboratory is responsible for maintaining a current awareness file of OSHAregulations regarding the safe handling of the chemicals specified in this method. Areference file of Material Safety Data Sheets (MSDS) should be made available to allpersonnel involved in the chemical analysis. The preparation of a formal safety plan isalso advisable. Additional references on laboratory safety are available.-12 5.3 The following chemicals have the potential to be highly toxic or hazardous, consultMSDS. 5.3.1 Sodium Hydroxide (NaOH), used in the preparation of the eluent is consideredcaustic. 6. EQUIPMENT AND SUPPLIES 6.1 Ion chromatograph (IC) -- Analytical system complete with eluent reservoirs, an ionchromatographic pump, injection valves, both guard and analytical separator columns,suppressor, conductivity detector, and computer based data acquisition system. 6.1.1 Anion guard column -- Dionex AG16 4 mm (P/N 55377),or equivalent. Thiscolumn functions as a protector of the separator column. If omitted from thesystem, the retention times will be shorter. 6.1.2 Anion separator column -- Dionex AS16, 4 mm (P/N 55376), or equivalent (seeSections 6.1.2.1-6.1.2.2). The AS16, 4 mm column using the conditionsoutlined in Table 1 produced the separations shown in Figures 1 through 4. 6.1.2.1 The development of this method included investigations into theperformance of alternate 4 mm IC guard and analytical separatorcolumns which have been used for the IC analysis of perchlorate andare specified in procedures external to the U.S.EPA.1-5 These alternateguard /separator columns included the Dionex AG5/ AS5 and theDionex AG11/AS11. The AG5 / AS5 is currently specified in thestandard operating procedure (SOP) for the IC analysis of perchlorateby the State of California, Department of Health Services.1,5TheAG11 /AS11 is used by several commercial labs conducting ICanalysis for perchlorate and is recognized by California as an acceptable alternate to the AG5 / AS5.2-4 A multilab validation study includedboth of these analytical columns and indicated comparable results couldbe attained. In U.S.EPA studies, both the AG5 / AS5 and the AG11/AS11 performed well for reagent water and simulated drinking watersamples with low to moderate common anion levels but as these levelsincreased, performance began to diminish for both columns. The AG16/AS16 columns could tolerate much higher levels of these commonanions and therefore it is recommended in this method as the column ofchoice. A summary of the results of examining these three columns forsimulated matrices with various common anion levels is presented inTable 4. 6.1.2.2 Any alternate, equivalent column must be characterized as hydrophilic or conversely, must be rated as having low to very lowhydrophobicity. This is one characteristic that is consistent for theAS5, AS11 and AS16 analytical separator columns. This requirementfor low hydrophobicity is to allow the efficient, reproducible andsymmetrical band elution of polarizable anions, such as perchlorate. Ifthe perchlorate analysis is attempted on a hydrophobic column, such asthose typically used for the analysis of common anions,3 poorperformance will result due to very asymmetric, tailing peaks. Using amiddle to high calibration standard, conduct a typical analysis. Anyalternate column must be capable of yielding symmetrical peak elutionfor this perchlorate response as demonstrated by yielding a PeakGaussian Factor of between 0.80 and 1.15 using the followingequation, where. W(2) is the peak width at half height, and W (1) is the peak width at tenth height. NOTE:Values for W(ya) and W(10) can be attained through mostdata acquisition software. 6.1.3 Anion suppressor device--The data presented in this method were generatedusing a Dionex Anion Self Regenerating Suppressor (4 mm ASRS,ULTRA, P/N53946). An equivalent suppressor device may be utilized provided comparableconductivity detection limits are achieved and adequate baseline stability isattained as measured by a combined baseline drift/noise of no more than 5 nS perminute over the background conductivity. Proper suppressor performance is essential to analytical data reproducibility and sensitivity of the conductivitydetector. 6.1.3.1 The ASRS was set to perform electrolytic suppression at a currentsetting of 300 mA using the external water mode. External water wasdelivered to the suppressor directly from a pressurized source at a flowrate of 5 mL/min 6.1.3.2 If pretreated samples (Section 11.1.4), or sample matrices whichcontain appreciable concentrations of transition metal cations (e.g., Feor Al) are frequently analyzed, cationic components may bind to thesuppressor membrane and over time effect suppressor performance. Ifthe instrument begins to have problems with reduced peak response orasymmetrical perchlorate peaks, the suppressor membranes should becleaned. As a quick and easy cleaning step, the manufacturer's ASRS"Quickstart" procedure for installing a new ASRS should be followed.If this procedure does not correct the problem, follow themanufacturer's recommended cleaning procedure for removing metalcontaminants. 6.1.4 Detector --Conductivity cell (Dionex CD20, or equivalent) capable of providingdata as required in Section 9.2. 6.2 Data Acquisition System --The Dionex Peaknet Data Chromatography Software wasused to generate all the data in Tables 1 through 4. Other computer based data systemsmay achieve approximately the same performance but the user should demonstrate thisby the procedures outlined in Section 9. 6.3 Conductivity Meter-Used to monitor sample matrix conductance which is directlyrelated to the common anion levels in a matrix and used to determine if samplepretreatment is required. At a minimum, this meter should be capable of measuringmatrix conductance over a range of 1 - 10,000 uS/cm. 6.4 Analytical balance -- Used to accurately weigh target analyte salt for stock standardpreparation (±0.1 mg sensitivity). 6.5 Top loading balance --Used to accurately weigh reagents such as sodium hydroxidesolution in the preparation of eluents (±10 mg sensitivity). 6.6 Weigh boats --Plastic, disposable-for weighing eluent reagents. 6.7 Micro beakers --Plastic,disposable- used during sample preparation. 6.8 Syringes --Plastic, disposable, 10 mL- used during sample preparation. 6.9 Pipets --Pasteur, plastic or glass, disposable, graduated, 5 mL and 10 mL. 6.10 Bottles --High density polyethylene (HDPE) or glass, amber or clear, 30 mL, 125 mL,250 mL. For sampling and storage of calibration solutions. Stability studies presentedby the Interagency Perchlorate Steering Committee for Analytical Methods andconfirmed at the EPA (see Table3A), indicate perchlorate is neither photoreactive norprone to adsorption to the walls of either HDPE plastic or glass bottles. 6.11 Particulate filters -- 0.45 micron syringe filters, specifically designed for IC applications(Gelman IC Acrodisc, PN 4485, or equivalent). These cartridges are used to removeparticulates from the sample matrix while loading the sample manually or if theautosampler employed does not filter the sample during loading. 6.12 Matrix pretreatment cartridges in the barium form-- (Dionex OnGuard-Ba cartridges,PN 046072, or equivalent.) These cartridges are conditioned according to themanufacturer's directions and are used to reduce the matrix levels of sulfate. 6.13 Matrix pretreatment cartridges in the silver form - (Dionex OnGuard-Ag cartridges PN039637, or equivalent.) These cartridges are conditioned according to themanufacturer’s directions and are used to reduce the matrix levels of chloride. 6.14 Matrix pretreatment cartridges in the hydrogen form --Dionex OnGuard-H cartridges(PN 039596) or equivalent. These cartridges are conditioned according to themanufacturer’s directions and are used to reduce cations in the sample matrix. Thisprotects the analytical column by removing silver which has leached from the Agcartridge and may indirectly minimize the effect of carbonate by removing the cationiccounter ion. 7.。REAGENTS AND STANDARDS 7.1 Reagent water --Distilled or deionized water 17.8 Mohm or better, free of the anions ofinterest.. Water should contain particles no larger than 0.20 microns. 7.2 Eluent solution -- 50 mM sodium hydroxide (NaOH, [CASRN 1310-73-2]), dissolve 8.0grams of 50% (W/W) sodium hydroxide in reagent water to a final volume of 2.0 L.NOTE: This eluent solution is specific to the columns listed in Table 1. Any alternatecolumns will likely have unique and specific conditions identified by the manufacturer. 7.2.1 Solutions of NaOH are very susceptible to carbonate contamination resultingfrom adsorption of carbon dioxide from the atmosphere. This contamination willresult in poor reproducibility of perchlorate retention times, elevated instrument background conductivity, and increased baseline noise/drift. Consequently,exposure to the atmosphere should be minimized by storing these eluentsolutions in sealed reservoirs under low pressure (3 to 5 psi) helium. Inaddition, these solutions should be regularly prepared and held for no more than5 days. When refilling the eluent reservoir, completely replace old eluentsolution by emptying the old eluent, rinsing the reservoir with reagent water, andrefilling with the freshly prepared eluent solution. With this eluent, thesuppressed conductivity detector background signal should be between 2- 5 uS. 7.2.2 This eluent solution must be purged for 10 minutes with helium prior to use.This effectively removes dissolved gases which may form micro bubbles in theIC, compromising system performance and adversely effecting the integrity ofthe data. Alternatively, an in-line degas apparatus may be employed. 7.2.3 A system or apparatus which automatically generates the hydroxide eluent(Dionex EG40, or equivalent) is an acceptable alternative to physically preparingthis hydroxide eluent. 7.3 Perchlorate stock standard solution, 1000 mg/L (1 mg/mL)-A stock standard solutionmay be purchased as a certified solution or prepared from ACS reagent grade, sodiumsalt as listed below. (NOTE: Sodium perchlorate represents a molar weight fraction of81.2% perchlorate anion) 7.3.1 Perchlorate (ClOz) 1000 mg/L-- Dissolve 0.1231 g sodium perchlorate(NaClO4, CASRN [7601-89-0] in reagent water and dilute to 100 mL in avolumetric flask. NOTE::Stability of standards --Perchlorate stock standards, stored at roomtemperature, appear to be very stable and may be stable for an extended periodof time. However, specified expiration dates should be marked on eachprepared stock standard as part of any laboratory's quality control program. Inthis regard, it is recommended that stock standards for perchlorate be held forno more than 12 months and an expiration date should be clearly specified onthe label. 7.4 Mixed Common Anion Stock Solution- containing the anions chloride, sulfate andcarbonate each at 25 mg/mL anion concentration. This solution is used to preparesimulated common anion samples in the determination of the MCT (Section 9.2.8). 7.4.1 Dissolve the following salts in reagent water to a final volume of 25.0 mL: 1.0 g sodium chloride (NaCl, CASRN [7647-14-5])=0.61 g Cl 0.93 g sodium sulfate (Na,SO4, CASRN [7757-82-6])=0.63 g SO 1.1 g sodium carbonate (Na,CO,, CASRN [497-19-8])=0.62 g CO, 7.5Conductivity Meter Calibration Solution 7.5.1 Potassium Chloride (KCl), 745 mg/L (total salt weight) --Dissolve 0.745 gpotassium chloride (KCl, [CASRN 7447-40-7]) in reagent water and dilute to afinal volume of 1.00 L in a volumetric flask. On a properly functioningandcalibrated conductivity meter, the reference conductance for this solution is 1410uS/cm at 25C.16 8..SAMPLE COLLECTION, PRESERVATIONAND STORAGE 8.1 Samples may be collected in plastic or glass bottles. All bottles must be thoroughlycleaned and rinsed with reagent water. The volume collected should be sufficient toinsure a representative sample, allow for replicate analysis and laboratory fortified matrixanalysis, if required, and minimize waste disposal. 8.2 Samples do not need to be shipped iced or stored cold in a refrigerator but every effortshould be taken to protect the samples from temperature extremes. A thermallyinsulated sampling kit, designed to fit sampling bottles securely during shipment, shouldbe used to protect the samples from these temperature extremes. 8.3 Sample preservation and holding times for the anions are as follows: Analyte Preservation Holding Time Perchlorate None required 28 days NOTE: Perchlorate has been shown to be stable for more than 28 days° but extendedholding time studies (beyond 35 days) were not conducted by EPA.Typically,when analytes are believed to be stable, a 28 day holding time is established asa sufficient time period to permit a laboratory to conduct the analysis. 9.。QUALITY CONTROL 9.1 Each laboratory using this method is required to operate a formal quality control (QC)program. The requirements of this program consist of an initial demonstration oflaboratory capability, and subsequent analysis in each analysis batch (Section 3.1) of anInstrument Performance Check Standard (IPC), Laboratory Reagent Blank (LRB),Initial Calibration Check Standard (ICCS), Laboratory Fortified Blank (LFB), Continuing and End Calibration Check Standards (CCCS/ECCS), Laboratory FortifiedSample Matrix (LFM) and either a Field, Laboratory or LFM duplicate sample analysis.This section details the specific requirements for each of these QC parameters. The QCcriteria discussed in the following sections are summarized in Section 17, Table 5 and 6.The laboratory is required to maintain performance records that define the quality of thedata that are generated. 9.2 INITIAL DEMONSTRATION OF CAPABILITY 9.2.1 The Initial Demonstration of Capability (IDC) --This is used to characterizeinstrument and laboratory performance prior to performing analyses by thismethod. The QC requirements for the IDC discussed in the following sectionare summarized in Section 17,Table 5. 9.2.2Initial demonstration of low system background-- See Section 9.3.1. 9.2.3 Initial Demonstration of Accuracy (IDA)--Prepare and analyze 7 replicate LFBsfortified at 25.0 ug/L. Calculate the mean measured concentration (C) of thereplicate values as follows. where. Cx =Mean recovered concentration of the replicate analysis. C.C2....Cn=Recovered concentrations of the replicate 1,2...n.n=7 To pass the IDA, the value derived for C, must be within± 10% of the truevalue or between 22.5 ug/L and 27.5 ug/L. 9.2.4 Initial Demonstration of Precision (IDP) --Using the data generated for Section9.2.3, calculate the percent relative standard deviation (%RSD) of the replicateanalysis, as indicated below. To pass the IDP, the %RSD must be less than10%. where. Sn-1= sample standard deviation (n-1) of the replicate analyses. C, =mean recovered concentration of the replicate analysis. 9.2.5 Quality Control Sample (QCS)-After calibration curves have initially beenestablished or have been re-established, or as required to meet data qualityneeds, verify both the calibration and acceptable instrument performance with thepreparation and analyses of an external/second source QCS. If the determinedconcentrations are not within ± 10% of the stated values, performance of thedeterminative step of the method is unacceptable. The source of the problemmust be identified and corrected before either proceeding with the IDC orcontinuing with on-going analyses. 9.2.6 Method Detection Limit (MDL) - An MDL must be established using reagentwater (blank) fortified at a concentration of three to five times the estimatedinstrument detection limit.8 To determine MDL values, take seven replicatealiquots of the fortified reagent water and process through the entire analyticalmethod over a three day period. These seven MDL replicate analyses may beperformed gradually over three days or may represent data that has beencollected, at a consistent MDL estimated concentration, over a series of morethan three days. Perform all calculations defined in the method and report theconcentration values in the appropriate units. Calculate the MDL as follows: where. t= student's t value for a 99% confidence level and a standard deviationestimate with n-1 degrees of freedom [t =3.14 for seven replicates]Sm =sample standard deviation (n-1) of the seven replicate analyses. 9.2.6.1 MDLs should be periodically verified, but MUST be initiallydetermined when a new operator begins work or whenever there is asignificant change in the background, or instrument response. NOTE: Do not subtract blank values when performing MDL calculations. 9.2.7 Minimum Reporting Level (MRL)-The MRL is the threshold concentration ofan analyte that a laboratory can expect to accurately quantitate in an unknownsample. The MRL should be established at an analyte concentration eithergreater than three times the MDL or at a concentration which would yield aresponse greater than a signal to noise ratio of five. Setting the MRL too lowmay cause repeated QC failure upon analysis of the ICCS. Although thelowest calibration standard may be below the MRL, the MRL must neverbe established at a concentration lower than the lowest calibrationstandard. 9.2.8 Matrix Conductivity Threshold (MCT)- The MCT is an individual laboratorydefined value which must be determined by preparing a series of sequentiallyincreasing, common anion fortified, reagent water samples each contain aconstant perchlorate concentration. Initially, a reagent water prepared LFB,containing no common anions, must be analyzed which contains perchlorate at asuggested concentration of 25 ug/L perchlorate. Next, the series of sequentiallyincreasing anionic solutions are prepared, each containing perchlorate at asuggested concentration of 25 ug/L, which also containing the individualcommon anions of chloride, sulfate and carbonate, all included at uniform increasing concentrations of 200, 300,400,500,600,800, and 1000 mg/L foreach anion. A concentration of 25 ug/L perchlorate has been suggestedassuming the MRL has been set in the range of 3.0 ug/L to 5.0 ug/L. If alaboratory’s MRL is higher, choose a perchlorate concentration for this exerciseat approximately 5 times that MRL. 9.2.8.1 Prepare the mixed common anion stock solution (see Section 7.4)containing chloride, sulfate and carbonate, each at 25 mg/mL. 9.2.8.2 Prepare a perchlorate secondary stock dilution standard at 1.00 mg/Lfrom the 1000 mg/L perchlorate stock standard (Section 7.3) bydiluting 0.50 mL of the stock solution to a final volume of 500 mL. 9.2.8.3 Prepare the LFB at suggested perchlorate concentration of 25 ug/L bydiluting 0.625 mL of the perchlorate secondary stock dilution standard(Section 9.2.8.2) to a final volume of 25.0 mL. 9.2.8.4 Next, prepare the series of common anion fortified reagent watersamples by adding 0.20 mL, 0.30 mL, 0.40 mL, 0.50 mL, 0.60 mL,0.80 mL, and 1.00 mL of the mixed common anion stock solution(Section 7.4) into separate 25 mL volumetric flasks. Next, add 0.625mL of the perchlorate secondary stock dilution standard (Section9.2.8.2) to each 25 mL volumetric flask and dilute to volume withreagent water to yield a final perchlorate concentration of 25.0 ug/L. 9.2.8.5 Measure and record the conductance of each of these preparedsolutions on a calibrated conductivity meter (This meter must becalibrated as described in Section 10.4 prior to measuringconductance). To use as a relative reference conductance, the 400mg/L mixed anion sample, which contains chloride at 400 mg/L, sulfateat 400 mg/L and carbonate at 400 mg/L, should display a conductanceof between 3200 uS/cm and 3700 uS/cm. 9.2.8.6 Analyze each solution, recording the peak area to height (A/H) ratioand the quantified concentration of perchlorate. In many dataacquisition and instrument control software, the peak area to heightratio is a definable parameter which can be specified for printout on theanalysis report. 9.2.8.7 Both the A/H ratio and quantified perchlorate concentration for theLFB and the 200 mg/L mixed common anion solution should bereproducibly consistent but as the common anion levels increase, theA/H ratio will also begin to increase as the peak height is distorted andreduced. As the peak is distorted, the area will also eventually begin tobe distorted and the quantitated concentration will be reduced, but this is typically secondary, with the ratio of peak area to height initiallypredicting this pending quantitation problem. 9.2.8.8 Calculate the A/H ratio percent difference (PDA/) between the averageA/H ratio for the LFB (A/HLFB) and the average A/H ratios for eachmixed common anion solutions (A/HMA) using the following equation. 9.2.8.9 As the conductivity of the matrices increase, the PDAH will increase.The MCT is the matrix conductance where the PDAH exceeds 20%.To derive the MCT, perform a linear regression on these data byplotting PDA/H (as the independent variable, x) versus the matrixconductance (as the dependent variable, y). The resulting regressiondata should yield an r’value of> 0.95. (See Figure 5) Record the“constant” (intercept value) and the “X-coefficient”(slope) andcalculate the MCT as follows. MCT=(20%)x (X-coefficient) + (constant) NOTE: Be careful to consistently apply percentages as either wholenumbers or as fractional values (20%=0.20) for both the regressionanalysis and the MCT calculation. 9.2.8.10 As an alternate to the regression analysis, the laboratory can choose toestablish their MCT at the conductance level of the highest mixed anionsolution which yielded a PDA/H value below the 20 % threshold. 9.2.8.11 As a final procedure, the laboratory should confirm their perchlorateMRL in a mixed common anion solution which reflects a conductancenear (within +/-10%) that specified as the MCT. This solution mustcontain perchlorate, at the laboratory determined MRL, as well as thecommon anions chloride, sulfate and carbonate, prepared consistentwith the instruction for the mixed anion solutions in this section and ata concentration estimated to generate a conductance near the MCT.The conductance of this solution must be measured at within ±10% ofthe MCT and following the analysis, the recovered perchlorate must bebetween 70-130% of the MRL concentration. If the MRL recoveryfails this criteria, the MCT should be lowered by 10% and this MRLverification must be repeated. 9.2.8.12 Prior to conducting any field sample analysis, the conductivity of thatmatrix must be determined. When the conductance of a field sample isabove the MCT, sample dilution or pretreatment, as described inrespective Sections 11.1.3 and 11.1.4 must be performed. 9.3 ASSESSING LABORATORY PERFORMANCE-The following items must beincluded in every analysis batch (Section 3.1). 9.3.1 Laboratory Reagent Blank (LRB)- An LRB must be prepared and treatedexactly as a typical field sample including exposure to all glassware, equipment,solvents, filtration and reagents that are used with field samples. Data producedare used to assess instrument performance of a blank sample and evaluatecontamination from the laboratory environment. Values that exceed % the MRLindicate a laboratory or reagent contamination is present. The source of thecontamination must be determined prior to conducting any sample analysis. Anysample included in an automated analysis batch which has an invalid LRB,indicated by a quantitated perchlorate that exceeds the MRL, must bereanalyzed in a subsequent analysis batch after the contamination problem isresolved. 9.3.1.1 When sample matrices have been pretreated to reduce the risk of highcommon anion interference (Section 11.1.4), a second LRB must beprepared, pretreated in exactly the same manner, and analyzed toconfirm no background effects from the pretreatment process arepresent. If an analysis batch only contains pretreated samples, thenonly a pretreated LRB is required. 9.3.2 Instrument Performance Check (IPC)--The MCT, which was determined aspart of the IDC in Section 9.2.8, must be verified through the analysis of an IPC.The IPC is three tiered and is used to verify the state of the IC system, over time,to quantitate perchlorate in highly ionic matrices. This must be conducted witheach analysis batch since over time, column performance can change. 9.3.2.1 Prepare a mixed common anion solution which reflects a conductancenear (within +/- 10%) that specified as the MCT. This solution must beprepared consistent with the instruction in Section 9.2.8, and containingthe common anions chloride, sulfate and carbonate as well asperchlorate at a suggested concentration of 25 ug/L. This perchlorateconcentration has been specified assuming the MRL has been set in therange of 3.0 ug/L to 5.0 ug/L. If a laboratory's MRL is higher, chosea perchlorate concentration for this exercise at approximately 5 timesthat MRL. 9.3.2.2(Confirm the conductance of the IPC and analyze it as the initial samplein the analysis batch. If, after several weeks of storage, the measuredconductance of this solution has shifted by more than 10% from theoriginal measured value, prepare a fresh IPC solution. Following theanalysis, calculate the PDA/H (Section 9.2.8.8), by comparing the peakarea to height ratio of this IPC mixed anion standard (A/HMA) for thisanalysis batch to the value that was derived for the LFB (A/HLFB) eitherin the original IDC or in the previous analysis batch. As the first tiercriteria, the value for PDA/H must be less than 25% before proceedingwith the analysis batch. 9.3.2.3 At the second tier criteria, the measured recovery for perchlorate in thisIPC must fall between 80% and 120% (20.0 ug/L to 30.0 ug/L for a25 ug/L fortification). 9.3.2.4 As a third tier and final criteria for the IPC, the laboratory must closelymonitor the perchlorate retention time for this analysis. Smallvariations in retention time can be anticipated when a new solution ofeluent is prepared but if sudden shifts of more than 5% are observed inthe perchlorate retention time, some type of instrument problem may bepresent. Potential problems include improperly prepared eluent,erroneous method parameters programmed such as flow rate or someother system problem. The observed retention time for perchlorateshould closely replicate the times established when the column wasoriginally installed. As a column ages, it is normal to see a gradual shiftand shortening of retention times, but if after several years of use,extensive use over less than a year, or use with harsh samples, thisretention time has noticeably shifted to any less than 80% of theoriginal recorded value, the column requires cleaning (according tomanufacturer’s instructions) or replacement. A laboratory shouldretain a historic record of retention times for perchlorate to provideevidence of an analytical column’s continued performance. 9.3.2.5 If any of the conditions defined in Section 9.3.2.2 through 9.3.2.4 arenot met, the MCT must be repeated and revised to a more appropriatelower matrix conductivity threshold or the source of the problem mustbe determined and the IPC reanalyzed. 9.3.3 Laboratory Fortified Blank (LFB)-Prepare a secondary dilution stock using thesame stock solution used to prepare the calibration standards. This separate,secondary dilution stock is used as a concentrate to fortify the LFB and theLFMs (Section 9.4.1). An external source stock or QCS, which is used to verifythe accuracy ofthe calibration curve when it was initially prepared (Section 10.2.5), should not be used to prepare this secondary dilution stock.Laboratories are required to analyze a LFB (filtered as if it were a field sample)with each analysis batch immediately following the ICCS. The LFB must beprepared with the same solution used to prepare the LFM and should beprepared at concentrations no greater than ten times the highest concentrationobserved in any field sample and should be varied to reflect the range ofconcentrations observed in field samples. By analyzing the LFB initially, acontrol check is performed on the concentrated solution used to prepare theLFM. If any deviations in the perchlorate concentration are present, it will bereflected in the LFB and not exclusively attributed to a matrix upon analysis ofthe LFM. Calculate accuracy as percent recovery (Section 9.4.1.3). Therecovery for perchlorate must fall in the range of 85 - 115% prior to analyzingsamples. If the LFB recovery for an analysis batch does not meet these recoverycriteria the data are considered invalid, and the source of the problem should beidentified and resolved before continuing analyses. 9.3.3.1 When sample matrices have been pretreated to reduce the risk of highcommon anion interference (Section 11.1.4), a second LFB must beprepared, pretreated in exactly the same manner, and analyzed toconfirm no background effects or recovery bias induced by thepretreatment are present. If an analysis batch only contains pretreatedsamples, then only a pretreated LFB is required. 9.4 ASSESSING ANALYTE RECOVERY AND DATA QUALITY- The following mustbe included in every analysis batch (Section 3.1). 9.4.1 Laboratory Fortified Sample Matrix (LFM)-The laboratory must add a knownamount of each target analyte to a minimum of 5% of the collected field samplesor at least one with every analysis batch, whichever is greater. Samples whichexceed the MCT must either be diluted (Section 11.1.3) or pretreated to reducethe common anion levels (Section 11.1.3). Samples which are pretreated haveadditional LFM requirements described in Section 11.1.4.6, and must be fortifiedbefore pretreatment. For a LFM to be valid, the target analyte concentrationsmust be greater than the native level and should adhere to the requirementoutlined in Section 9.4.1.2. It is recommended that the solutions used to fortifythe LFM be prepared from the same stocks used to prepare the calibrationstandards and not from external source stocks. This will remove the biascontributed by an externally prepared stock and focus on any potential biasintroduced by the field sample matrix. 9.4.1.1 The fortified concentration must be equal to or greater than the nativesample concentration. Fortified samples that exceed the calibrationrange must be diluted to be within the linear range. In the event that the fortified level is less than the observed native level of the unfortifiedmatrix, the recovery should not be calculated. This is due to thedifficulty in calculating accurate recoveries ofthe fortifiedconcentration when the native sample concentration to fortifiedconcentration ratio is greater than one. 9.4.1.2 For normal drinking waters, the LFM typically should be prepared inthe range of 20-50 ug/L. The LFM should not be prepared atconcentration greater than ten times the highest concentration observedin any field sample and should be varied to reflect the range ofconcentrations expected in field samples. 9.4.1.3 Calculate the percent recovery for each target analyte, corrected forconcentrations measured in the unfortified sample. Percent recoveryshould be calculated using the following equation: where. %REC = percent recovery, C,= measured perchlorate in the fortified sample, C =measured native perchlorate sample concentration, and S=concentration equivalent of analyte added to sample. 9.4.1.4 Recoveries may exhibit a matrix dependence. If the recovery forperchlorate falls outside 80 -120%, and the laboratory’s performancefor all other QC performance criteria is acceptable, the accuracyproblem encountered with the fortified sample is judged to be matrixrelated, not system related. The result for that analyte in the unfortifiedsample and the LFM must be labeled suspect/matrix to inform the datauser that the result is suspect due to matrix effects. Repeated failure tomeet suggested recovery criteria indicates potential problems with theprocedure and should be investigated. 9.4.2 FIELD,LABORATORY DUPLICATES OR DUPLICATE LFM- Thelaboratory must analyze either a field duplicate, a laboratory duplicate, or aduplicate LFM for a minimum of 5% of the collected field samples or at least onewith every analysis batch, whichever is greater. The sample matrix selected forthis duplicate analysis must contain measurable concentrations of the targetanions in order to establish the precision of the analysis set and ensure the qualityof the data. Without prior knowledge or strong suspicion that an unknownsample has measurable perchlorate concentrations, the best alternative is to analyze a duplicate LFM. 9.4.2.1 Calculate the relative percent difference (RPD) of the initial quantitatedconcentration (Ic) and duplicate quantitated concentration (D) usingthe following formula. 9.4.2.2 Duplicate analysis may exhibit a matrix dependance. If the RPD for theduplicate measurements of perchlorate falls outside±15% and if allother QC performance criteria are met, laboratory precision is out ofcontrol for the sample and perhaps the analytical batch. The result forthe sample and duplicate should be labeled as suspect/matrix to informthe data user that the result is suspect due to a potential matrix effect,which led to poor precision. This should not be a chronic problem andif it frequently recurs (>20% of duplicate analyses), it indicates aproblem with the instrument or individual technique that must becorrected. 9.4.3 In recognition of the rapid advances occurring in chromatography, the analyst ispermitted certain options, such as the use of different columns (which meet thecriteria in Section 6.1.2.2), injection volumes, and/or eluents, to improve theseparations or lower the cost of measurements. Each time such modifications tothe method are made, the analyst is required to repeat the procedure in Section9.2 and adhere to the condition of conductivity baseline stability found in Section1.2.1. 9.4.4 It is recommended that the laboratory adopt additional quality assurancepractices for use with this method. The specific practices that are mostproductive depend upon the needs of the laboratory and the nature of thesamples. Whenever possible, the laboratory should perform analysis of qualitycontrol check samples and participate in relevant proficiency testing (PT) orperformance evaluation (PE) sample studies. 10. CALIBRATION AND STANDARDIZATION 10.1 Demonstration and documentation of acceptable initial calibration is required prior tothe IDC and before any samples are analyzed, and is required intermittently throughoutsample analysis to meet required QC performance criteria outlined in this method andsummarized in Table 6. Initial calibration verification is performed using a QCS as wellas with each analysis batch using an initial, continuing (when more than 10 field samplesare analyzed), and end calibration check standards. The procedures for establishing the initial calibration curve are described in Section 10.2. The procedures to verify thecalibration with each analysis batch is described in Section 10.3. 10.2 INITIAL CALIBRATION CURVE 10.2.1 Establish ion chromatographic operating parameters equivalent to thoseindicated in Table 1. 10.2.2 Estimate the Linear Calibration Range (LCR) -- The LCR should cover theexpected concentration range ofthe field samples and should not extend overmore than two orders of magnitude in concentration. The restriction of twoorders of magnitude is prescribed since beyond this it is difficult to maintainlinearity throughout the entire calibration range. 10.2.2.1 If quantification is desired over a larger range, then two separatecalibration curves should be prepared. 10.2.2.2 A minimum of three calibration standards are required for a curve thatextends over a single order of magnitude and a minimum of fivecalibration standards are required if the curve covers two orders ofmagnitude. 10.2.2.3 Since the anticipated concentration range for perchlorate in actual fieldsamples is expected to cover two orders of magnitude, the use of atleast five calibration standards in the range 4-400 pg/L isrecommended. 10.2.3 Prepare the calibration standards by carefully adding measured volumes of thestock standard (Section 7.3) to a volumetric flask and diluting to volume withreagent water. 10.2.4 Inject 1.0 mL of each calibration standard. Tabulate peak area responses againstthe perchlorate concentration. The results are used to prepare a calibrationcurve. Acceptable calibration is confirmed after reviewing the curve for linearity(second order fits are also acceptable) and passing the criteria for the initialcalibration check standard in Section 10.3.1. Alternately, if the ratio of area toconcentration (response factor) is constant over the LCR (indicated by < 15%relative standard deviation), linearity through the origin can be assumed and theaverage ratio or response factor can be used in place of a calibration curve. 10.2.4.1 Peak areas must be used as a measure of response since they have beenfound to be more consistent, in terms of quantitation, than peakheights. Peak height can tend to be suppressed as a result of high levels of common anions in a given matrix which can compete for exchangesites leading to peak broadening. Using peak areas, it is the analyst’sresponsibility to review all chromatograms to insure accurate baselineintegration of target analyte peaks, since poorly drawn baselines willsignificantly influence peak areas. 10.2.5 After establishing or reestablishing calibration curves, the accuracy of thiscalibration must be verified through the analysis of a QCS or externally preparedsecond source. The QCS should be prepared at a concentration near the middleof the calibration curve. As specified in Section 9.2.5, determinedconcentrations must fall within±10% of the stated values. 10.3 CONTINUING CALIBRATION VERIFICATION -- Initial calibrations may be stable forextended periods oftime. Once the calibration curve has been established it MUST beverified for each analysis batch, prior to conducting any field sample analysis using an InitialCalibration Check Standard. Continuing Calibration Check Standards and End CalibrationCheck Standards are also required as described in the sections below. 10.3.1 INITIAL CALIBRATION CHECK STANDARD (ICCS)- For each analysisbatch the calibration must initially be verified prior to analyzing any samples. Thelowest level standard used to prepare the linear calibration curve must be used.In cases where the analyst has chosen to set the MRL above the lowest standard,a standard at a concentration equal to the MRL is acceptable. Percent recoveryfor the ICCS must be in the range or 75 - 125% before continuing the analysisbatch and conducting any sample analyses. 10.3.2 CONTINUING CALIBRATION CHECK/END CALIBRATION CHECKSTANDARDS (CCCS/ECCS)-- Continuing calibration check standards MUSTbe analyzed after every tenth field sample analysis and at the end of the analysisbatch as an end calibration check standard. If more than 10 field samples areincluded in an analysis batch, the analyst must alternate between the middle andhigh continuing calibration check standard levels. 10.3.2.1 The percent recovery for perchlorate in the CCCS/ECCS must bebetween 85 -115%. 10.3.2.2 If during the analysis batch, the measured concentration for perchloratein the CCCS or ECCS differs by more than the calibration verificationcriteria shown above, or if the perchlorate peak retention time shiftsoutside the retention time window (as defined in Section 11.2.4), allsamples analyzed after the last acceptable check standard areconsidered invalid and must be reanalyzed. The source of the problemmust be identified and resolved before reanalyzing the samples orcontinuing analyses. 10.3.2.3 In the case where the end calibration fails to meet performance criteria,but the initial and middle calibration checks are acceptable, the samplesbracketed by the acceptable calibrations may be reported. However, allfield samples between the middle and end calibration checks MUST bereanalyzed. 10.4 CONDUCTIVITY METER CALIBRATION --Prior to conducting the MCT andcoinciding with each analysis batch, conductivity meter calibration must be verified orestablished using a standard KCl solution (Section 7.5). 10.4.1 Thoroughly rinse the conductivity electrode with reagent water. Place theelectrode in the reagent water, turn on the meter and confirm the conductance ofthis blank is <1 uS/cm. 10.4.2 Pour approximately 15 mL of the standard KCl solution (Section 7.5) into aplastic disposable micro beaker (Section 6.7) and place the electrode into thesolution. The reference conductance for this solution is 1410 uS/cm at25°C.16The conductivity meter must yield a conductance between 1380 uS/cm and 1440uS/cm to be in calibration. 10.4.3 If the conductivity meter fails calibration, recalibrate the unit per manufacture’sinstruction and repeat the procedure in 10.4.2 as if the standard solution were anunknown matrix. 11.PROCEDURE 11.1 SAMPLE PREPARATION 11.1.1 Samples do not need to be refrigerated but if samples are held refrigerated as astandard practice for sample control, ensure the samples have come to roomtemperature prior to conducting sample analysis. 11.1.2 MATRIX CONDUCTANCE VERIFICATION- Prior to conducting theanalysis of a field sample matrix, the conductance of that matrix must bemeasured. Matrix conductivity is directly related to the common anion levelswhich, at high concentrations, can influence the integrity of the perchlorateanalysis. 11.1.2.1 Verify conductivity detector calibration by following the procedureoutlined in Section 10.4. 11.1.2.2 Pour approximately 15 mL of sample into a plastic disposable micro beaker (Section 6.7) and reseal the sample bottle to protect the sampleintegrity. 11.1.2.3 Place the electrode into the matrix and measure the conductivity. 11.1.2.4 If the conductance is less than the MCT, continue to Section 11.1.5. 11.1.2.5 If the conductance is greater than the MCT, the matrix requires dilutionor pretreatment prior to analysis. The dilution procedure is found inSection 11.1.3. Pretreatment is described in Section 11.1.4. 11.1.2.6 Discard this aliquot of sample and be certain to thoroughly rinse theelectrode with reagent water between each matrix conductivitymeasurement. 11.1.3 MATRIX DILUTION- If matrix conductivity is less than the MCT, go toSection 11.1.5. 11.1.3.1 A sample can be analyzed once diluted with reagent water to aconductance below the MCT. The exact magnitude of this dilution willadversely increase the MRL by an equivalent proportion. 11.1.3.2 Knowing the matrix conductance exceeds the MCT, estimate theproportion required for the dilution by dividing the measured matrixconductance by the MCT. Round up to the next whole number anddilute the sample by a proportion equivalent to this value. Forexample, if the established MCT is 6100 uS/cm and a sample reflectinga conductance of 8000 uS/cm was measured, dilute the sample withreagent water by a factor of 2. 11.1.3.3 Measure the conductance of the diluted sample to confirm it is nowbelow the MCT. Analyze the sample as specified in Section 11.1.5with the understanding that the MRL has now been elevated by aproportion equivalent to the dilution. 11.1.3.4 If perchlorate is measured above the elevated MRL, back calculateactual field sample concentration and report. If no perchlorate ismeasured above the elevated MRL and analysis or project objectivesrequired monitoring below the concentration of the elevated MRL,proceed to Section 11.1.4 and pretreat the matrix. 11.1.4 PRETREATMENT FOR MATRICES WHICH EXCEED THE MCT- Ifmatrix conductivity is less than the MCT, go to Section 11.1.5. If sample dilution did not yield the required results, sample pretreatment should beemployed. When the MCT is exceeded, it is most often due to a high levels ofcommon anions (chloride, sulfate, and carbonate) in a particular matrix. If theanalyst were to attempt the IC analysis ofthis particular matrix, the commonanions present in the sample would distort the baseline and negatively affect theaccurate quantitation of perchlorate. To effectively reduce a significant amountof these anions which contribute to the high conductivity reading, a series ofpretreatment cartridges must be employed. For this pretreatment, threecartridges are attached in series in the following order: Ba, Ag, and H. It isrecommended that all three cartridges be employed unless the analyst has specificknowledge that a matrix primarily has high levels of a specific common anion. 11.1.4.1IIndividually and thoroughly rinse each pretreatment cartridge withreagent water in order to insure all residual background contaminantsare removed from the cartridge. Perform this rinse per manufacturer’sinstructions. 11.1.4.2 Prior to pretreating any field samples, prepare and pretreat both anLRB and an LFB. These pretreated quality control samples arerequired when an analysis batch contains a matrix which must bepretreated. This pretreatment is conducted by placing the cartridges inthe following prescribed series (->Ba->Ag->H). The pretreatedLRB and LFB are used to verify that no background interference orbias is contributed by the pretreatment.If a response is observed inthe pretreated LRB, triple or quadruple the volume of reagent waterrinse suggested by the manufacturer in Section 11.1.4.1 and repeat untila blank measures no more than the MRL. If this additional rinsingprocedure is required, it must be consistently applied to all thecartridges prior to conducting any matrix pretreatment. 11.1.4.3 Filter 3 mL of sample through the series of rinsed, stacked cartridges asan initial sample rinse (Ba, Ag and H) at a flow rate of 1.0 mL/ min orless (approximately one drop every 3 to 4 seconds). This flow rate iscritical to the pretreatment and must be carefully followed. Discard thisfraction and begin collecting the pretreated sample aliquot of collectedsample. 11.1.4.4When sufficient volume has been collected, measure the conductance ofthe pretreated sample aliquot being certain the conductivity meter’sprobe has been thoroughly rinsed and excess water has been shakenfrom the tip. If the conductance is now below the MCT, the sample isready for analysis. If the conductance is still above the MCT, the flowrate through the pretreatment cartridge is likely too fast and the pretreatment should be repeated with new cartridges. In someinstances, double pretreatment cartridges may need to be applied.When this pretreatment is performed properly, U.S.EPA has found70% to 95% reduction in matrix conductance with good recoveries forperchlorate. 11.1.4.5 Place this aliquot of pretreated sample into an autosampler vial asdescribed in Section 11.1.3. 11.1.4.6 In order to ensure data quality, all samples which fail the MCT andhave been selected for pretreatment, as described in Section 11.1.4,must also be used to prepare an LFM. This LFM must be fortified withperchlorate at concentrations close to, but greater than, the leveldetermined in the native sample prior to the pretreatment. Initially, thepretreated sample is analyzed and perchlorate level is determined.Then, a second aliquot of sample must be fortified with perchlorate,pretreated to reduce the high common anion levels, and analyzed toassess perchlorate recovery from that matrix.This additional QC isrequired to rule out matrix effects and to confirm that the laboratoryperformed the pretreatment step appropriately. If the perchloraterecovery falls outside the acceptance range of 80 -120% (Section9.4.1.4), that particular sample should be reported assuspect/matrix. 11.1.4.7 The pretreatments prescribed above are effective at reducing thechloride and sulfate content of a sample matrix but will not reducematrix concentrations of other anions such as nitrate or phosphate. 11.1.5 Pour approximately 15 mL of sample into a micro beaker (Section 6.7) andreseal the sample bottle to protect the sample integrity. Using a Luer lock,plastic 10 mL syringe, withdraw approximately 10 mL of sample from the microbeaker and attach a 0.45 um particulate filter (Section 6.11), which has beendemonstrated to be free of ionic contaminants, directly to the syringe. Filter thesample into an autosampler vial or manually load the injection loop injecting afixed amount of filtered, well mixed sample. Ifusing a manually loaded injectionloop, flush the loop thoroughly between sample analysis using sufficient volumesof each new sample matrix. 11.1.5.1 If the autosampler vials or vial caps are designed to automatically filterthe sample matrix as the sample is loaded on the IC system, thisfiltration procedure can be omitted and the sample can be directlytransferred to the autosampler vial. 11.2 SAMPLE ANALYSIS 11.2.1 Table 1 summarizes the recommended operating conditions for the ionchromatograph. Included in this table is the estimated retention time forperchlorate which has been achieved by this method. Other columns,chromatographic conditions or detectors may be used if the requirements ofSections 1.2.1, 6.1.2.2 and 9.2 are met. 11.2.2 Establish a valid initial calibration and verify this calibration by conducting aQCS as described in Section 10.2 and complete the IDC (Section 9.2). Initially,analyze the IPC solution, followed by the LRB. Then confirm the IC systemcalibration by analyzing an ICCS (Section 10.3.1) and, if required, recalibrate asdescribed in Section 10.2. Lastly, analyze the LFB. 11.2.3 Inject 1.0 mL of each filtered sample. Use the same size loop for standards andsamples. An automated constant volume injection system may also be used.Record the resulting peak size in area units and retention time for each analyte. 11.2.4 The width of the retention time window used to make identifications should bebased upon measurements of actual retention time variations of standardsmeasured over several days. Three times the standard deviation of retention timemay be used as a suggested window size but the retention time window shouldnot extend beyond ±5% of the retention time for perchlorate. The experience ofthe analyst should weigh heavily in the interpretation of these chromatograms. 11.2.5 If the response of a sample analyte exceeds the calibration range, the samplemust be diluted with an appropriate amount of reagent water and reanalyzed. Ifthis is not possible then three new calibration concentrations must be employedto create a separate high concentration calibration curve, one standard near theestimated concentration and the other two bracketing around an intervalequivalent to approximately ±25% the estimated concentration. The responsegenerated by these three new high concentration calibration standards must notexceed the upper linear range for the conductivity detector. The latter procedureinvolves significantly more time than a simple sample dilution therefore, it isadvisable to collect sufficient sample to allow for sample dilution and samplereanalysis, if required. 11.2.6 Should more complete resolution be needed between perchlorate and acoeluting, shoulder peak, the eluent (Section 7.2) may be diluted. This willspread out the peaks, causing later elution of perchlorate. Analysts are advisedto carefully evaluate any of these eluent dilutions since when these eluentchanges are incorporated, other coelutions may be encountered which were notinitially evident. Additionally, the analyst must verify that this dilution does not negatively affect performance by repeating and passing all the QC criteria inSection 9, and by reestablishing a valid initial calibration curve (Section 10.2). 11.2.6.1 Eluent dilution will reduce the overall response of an anion due tochromatographic band broadening which will be evident by shortenedand broadened peaks. This will adversely effect the MDLs for eachanalyte. 11.3 AUTOMATED ANALYSIS WITH METHOD 314.0 11.3.1 Laboratories conducting analyses on large numbers of samples often preparelarge analysis batches that are run in an automated manner. When conductingautomated analyses, careful attention must be paid to ensure sufficient volume ofeluent in the reservoir is available to sustain extended operation. In order toensure their data are of acceptable quality, laboratories must ensure that all QCperformance criteria are met throughout the analysis batch through subsequentcareful inspection of the data. 11.3.2 Analysis sequences must be carefully constructed to meet required QCspecifications and frequency (Table6). To help with this task, an acceptablesequence for a sample analysis batch, with all the method-required QC, is shownin Table 7. This schedule is included only as an example of a hypotheticalanalysis batch which contains normal sample matrices as well as samples whichhave failed the MCT. Within this analysis batch, references to exactconcentrations for the ICCS, CCCS and ECCS are for illustrative purposes only. 11.3.3 Table 7 may be used as a guide when preparing analysis batches. Additionalbatches may be added sequentially on to the end of these types of schedules aslong as all QC samples, which define an individual batch (IPC, LRB, ICCS, LFB,LFM, etc.) are individually reanalyzed with each successive serial batch and theQC criteria for these analyses are continually met (from the IPC through ECCS). 12.DATA ANALYSIS AND CALCULATIONS 12.1 Identify perchlorate in the sample chromatogram by comparing the retention time of asuspect peak within the retention time window to the actual retention time of a knownanalyte peak in a calibration standard. If the perchlorate retention time has slightlyshifted (generally towards shorter times) since the initial calibration, but is still withinacceptance criteria and are reproducible during the analysis batch, the analyst should usethe retention time in the daily calibration check standards to confirm the presence orabsence of perchlorate anion. 12.1.1 If a low concentration of perchlorate is suspected in an unknown sample, but the retention time has drifted to the edge of the retention time window, a low levelperchlorate LFM, prepared at nearly the same concentration as the suspect peak,should be prepared from this sample matrix to confirm the matrix inducedretention time shift. If the fortified sample reveals a split or shouldering peakresponse, the low concentration in the unfortified sample is likely an interferantand should not be reported as perchlorate. 12.2 Compute sample concentration using the initial calibration curve generated in Section10.2. 12.3 Report ONLY those values that fall between the MRL and the highest calibrationstandards. Samples with a perchlorate response which exceeds the highest calibrationstandard concentration must be diluted and reanalyzed. When this is not possible thealternate calibration procedures described in Section 11.2.5 must be followed. Sampleswith perchlorate identified but quantitated below the concentration established by thelowest calibration standard, may be reported as “trace present"above the MDL butbelow the minimum reporting limit (MRL) and therefore not reported as a quantitatedconcentration. 12.4 Report results in ug/L. 13.METHODS PERFORMANCE 13.1 Table 1 gives the standard conditions, typical retention time, single laboratory MCT andsingle laboratory MDL in reagent water, as determined for perchlorate. This retentiontime is graphically indicated in the chromatograms in Figures 1 through 4. 13.2 Table 2 shows the precision and accuracy of the perchlorate measurement at twofortified concentrations, in reagent water, simulated high ionic strength water (HIW),simulated high organic content water (HOW), ground water, untreated surface waterand treated surface water. The mean perchlorate recovered concentration (accuracyrelative to the fortified level) and the precision (expressed as %RSD of the replicateanalysis) are tabulated. The HIW was designed to simulate a high ionic strength fieldsample and the HOW designed to simulate a high organic content field sample. TheHIW was prepared from reagent water which was fortified with the common anions ofchloride at 400 mg/L, carbonate at 600 mg/L, and sulfate at 500 mg/L. The HOW wasprepared from reagent water fortified with 10.0 mg/L fulvic acid. 13.3 Table 3 shows the stability data for perchlorate held for 35 days and stored undervarious conditions. Conditions investigated included sample bottle construction (HDPEplastic vs. glass), storage condition (refrigerated vs. held at room temperature) andvarious matrices including some with a measured perchlorate concentration assumed tocontain microbiological constituents acclimated to the presence of the anion. Matriceswithout perchlorate were fortified at 25 ug/L. Each data point in this table represents the mean percent recovery following triplicate analyses. These data were used toformulate the holding times shown in Section 8.3. 13.4 Table 4, in conjunction with the chromatograms overlaid in Figure 4 as well as the linearregression plots in Figure 5, show the results of the single laboratory MCTdetermination. The data presented in Table 4 and graphically illustrated in Figure 5,show results for not only the AS16 but also the AS11 and AS5. The chromatogramshown in Figure 4 were generated using the AS16 column. 14. POLLUTION PREVENTION 14.1 Pollution prevention encompasses any technique that reduces or eliminates the quantityor toxicity of waste at the point of generation. Numerous opportunities for pollutionprevention exist in laboratory operation. The EPA has established a preferred hierarchyof environmental management techniques that places pollution prevention as themanagement option of first choice. Whenever feasible, laboratory personnel should usepollution prevention techniques to address their waste generation. When wastes cannotbe feasiblely reduced at the source, the Agency recommends recycling as the next bestoption. 14.2 Quantity of chemicals purchased should be based on expected usage during its shelf-lifeand the disposal cost of unused material. Actual reagent preparation volumes shouldreflect anticipated usage and reagent stability. 14.3 For information about pollution prevention that may be applicable to laboratories andresearch institutions, consult "Less is Better: Laboratory Chemical Management forWaste Reduction," available from the American Chemical Society's Department ofGovernment Regulations and Science Policy, 1155 16th Street N.W., Washington D.C.20036,(202)872-4477. 15. WASTE MANAGEMENT 15.1 The Environmental Protection Agency requires that laboratory waste managementpractices be conducted consistent with all applicable rules and regulations. Excessreagents, samples and method process wastes should be characterized and disposed of inan acceptable manner. The Agency urges laboratories to protect the air, water, and landby minimizing and controlling all releases from hoods and bench operations, complyingwith the letter and spirit of any waste discharge permit and regulations, and bycomplying with all solid and hazardous waste regulations, particularly the hazardouswaste identification rules and land disposal restrictions. For further information onwaste management consult the "Waste Management Manual for Laboratory Personnel,"available from the American Chemical Society at the address listed in Section 14.3. 16.REFERENCES 1. “Determination of Perchlorate by Ion Chromatography." State of California, Department ofHealth Services, Sanitation and Radiation Laboratories Branch, Rev. No. 0 (June 3,1997). 2. “Analysis of Low Concentrations of Perchlorate in Drinking Water and Ground Water by IonChromatography.” Application Note 121, Dionex Corporation, Sunnyvale, CA (1998). 3. “Perchlorate by Ion Chromatography, Modified EPA 300.0 Using IonPac AS11.”StandardOperating Procedure, Montgomery Watson Laboratories (March 17, 1998). 4. Jackson, P.E.; Laikhtman, M.; and Rohrer, J.S. “Determination of Trace Level Perchloratein Drinking Water and Ground Water by Ion Chromatography,” Journal of ChromatographyA,850(1999),131-135. 5. Okamoto, H.S.; Rishi, D.K.; Steeber, W.R.; Baumann, F.J.; and Perera, S.K. “Using IonChromatography to Detect Perchlorate,” Journal AWWA, Vol. 91 (October 1999), 73-84. 6. Inter-Agency Perchlorate Steering Committee, Analytical Subcommittee Report (1998).Report on the interlaboratory validation of IC methods for perchlorate. 7. Glaser, J.A.; Foerst,D.L.; McKee, G.D..; Quave, S.A. and Budde, W.L. "Trace Analysesfor Wastewater," Environmental Science and Technology, Vol. 15,Number 12, page 1426,December, 1981. 8. Code of Federal Regulations 40, Pt. 136, Appendix B (July 1, 1998). 9. “OSHA Safety and Health Standards, General Industry,”(29CFR1910).Occupational Safetyand health Administration, OSHA 2206, (Revised, Jan. 1976). 10. ASTM Annual Book of Standards, Part II, Volume 11.01, D3370-82,“Standard Practice forSampling Water,” American Society for Testing and Materials, Philadelphia, PA, 1986. 11.“Carcinogens-Working with Carcinogens,” Publication No. 77-206, Department of Health,Education, and Welfare, Public Health Service, Center for Disease control, National Instituteof Occupational Safety and health, Atlanta, Georgia, August 1977. 12..“Safety In Academic Chemistry laboratories,”3" Edition, American Chemical SocietyPublication, Committee on Chemical Safety, Washington, D.C., 1979. 13.U.S. EPA Method 300.1. EPA Document number: EPA/600/R-98/118. NTIS numberPB98-169196 INZ. 14."Anion Self-Regenerating Suppressor (ASRS) Quickstart Procedure", Document Number031368-01, Dionex Corporation, Sunnyvale, CA, March,1988. 15."Installation Instructions and Troubleshooting Guide for the Anion Self-RegeneratingSuppressor-Ultra", Document Number 031367, Rev.03, Section 5.1, Dionex Corporation,Sunnyvale, CA, December, 1988. 16. CRC Handbook of Chemistry and Physics. Standard Solutions for Calibrating ConductivityCells,p. D-166, 70" Ed., 1989-1990, CRC Press, Boca Raton, Florida. 17. TABLES,DIAGRAMS,FLOWCHARTS AND VALIDATION DATA TABLE 1. CHROMATOGRAPHIC CONDITIONS AND METHOD DETECTIONLIMITS IN REAGENT WATER FOR PERCHLORATE. Determined MCTb). 6100 uS/cm Recommended method total analysis time: 15 minutes (may be shortened to 12 minutes) Analyte Retention Times and Method Detection Limits (MDLs): MDLDETERMINATION MDLDETERMINATION Fortified Conc. # of MDL (ug/L) Reps. (ug/L) Analyte Retention Time (C)(min.) Perchlorate 10.1±0.2 2.0 7 0.53 (a)Mention of trade names or commercial products does not necessarily constitute endorsement orrecommendation for use. (b)This was the single laboratory MCT determined for these conditions listed (See Table 4 and Figure 5for more detail as well as data pertaining to the AS11 and AS5). (c) Reference to chromatograms in Figure 1 through 4. TABLE 2. SINGLE LABORATORY PRECISION AND RECOVERY FOR PERCHLORATE IN VARIOUS MATRICES Matrix Unfortified Fortified Conductivity Conc. Conc. # of Mean Mean Matrix uS/cm (ug/L) (ug/L) Reps. (ug/L) %REC SD(n-1) %RSD Reagent Water ~1 12ug/Lmeasured -project required monitoring to MRL -sample pretreatment is therefore required 22 Ba/Ag/H Pretreated LRB (Section 9.3.1.1) s%MRL 23 Ba/Ag/H Pretreated LFB (Section 9.3.3.1) Recovery of 85-115% 24 Sample 14-Ba/Ag/H pretreated (Section 11.1.4), followingpretreatment the matrix conductance=230 uS/cm. normal pretreated analysisperchlorate
确定
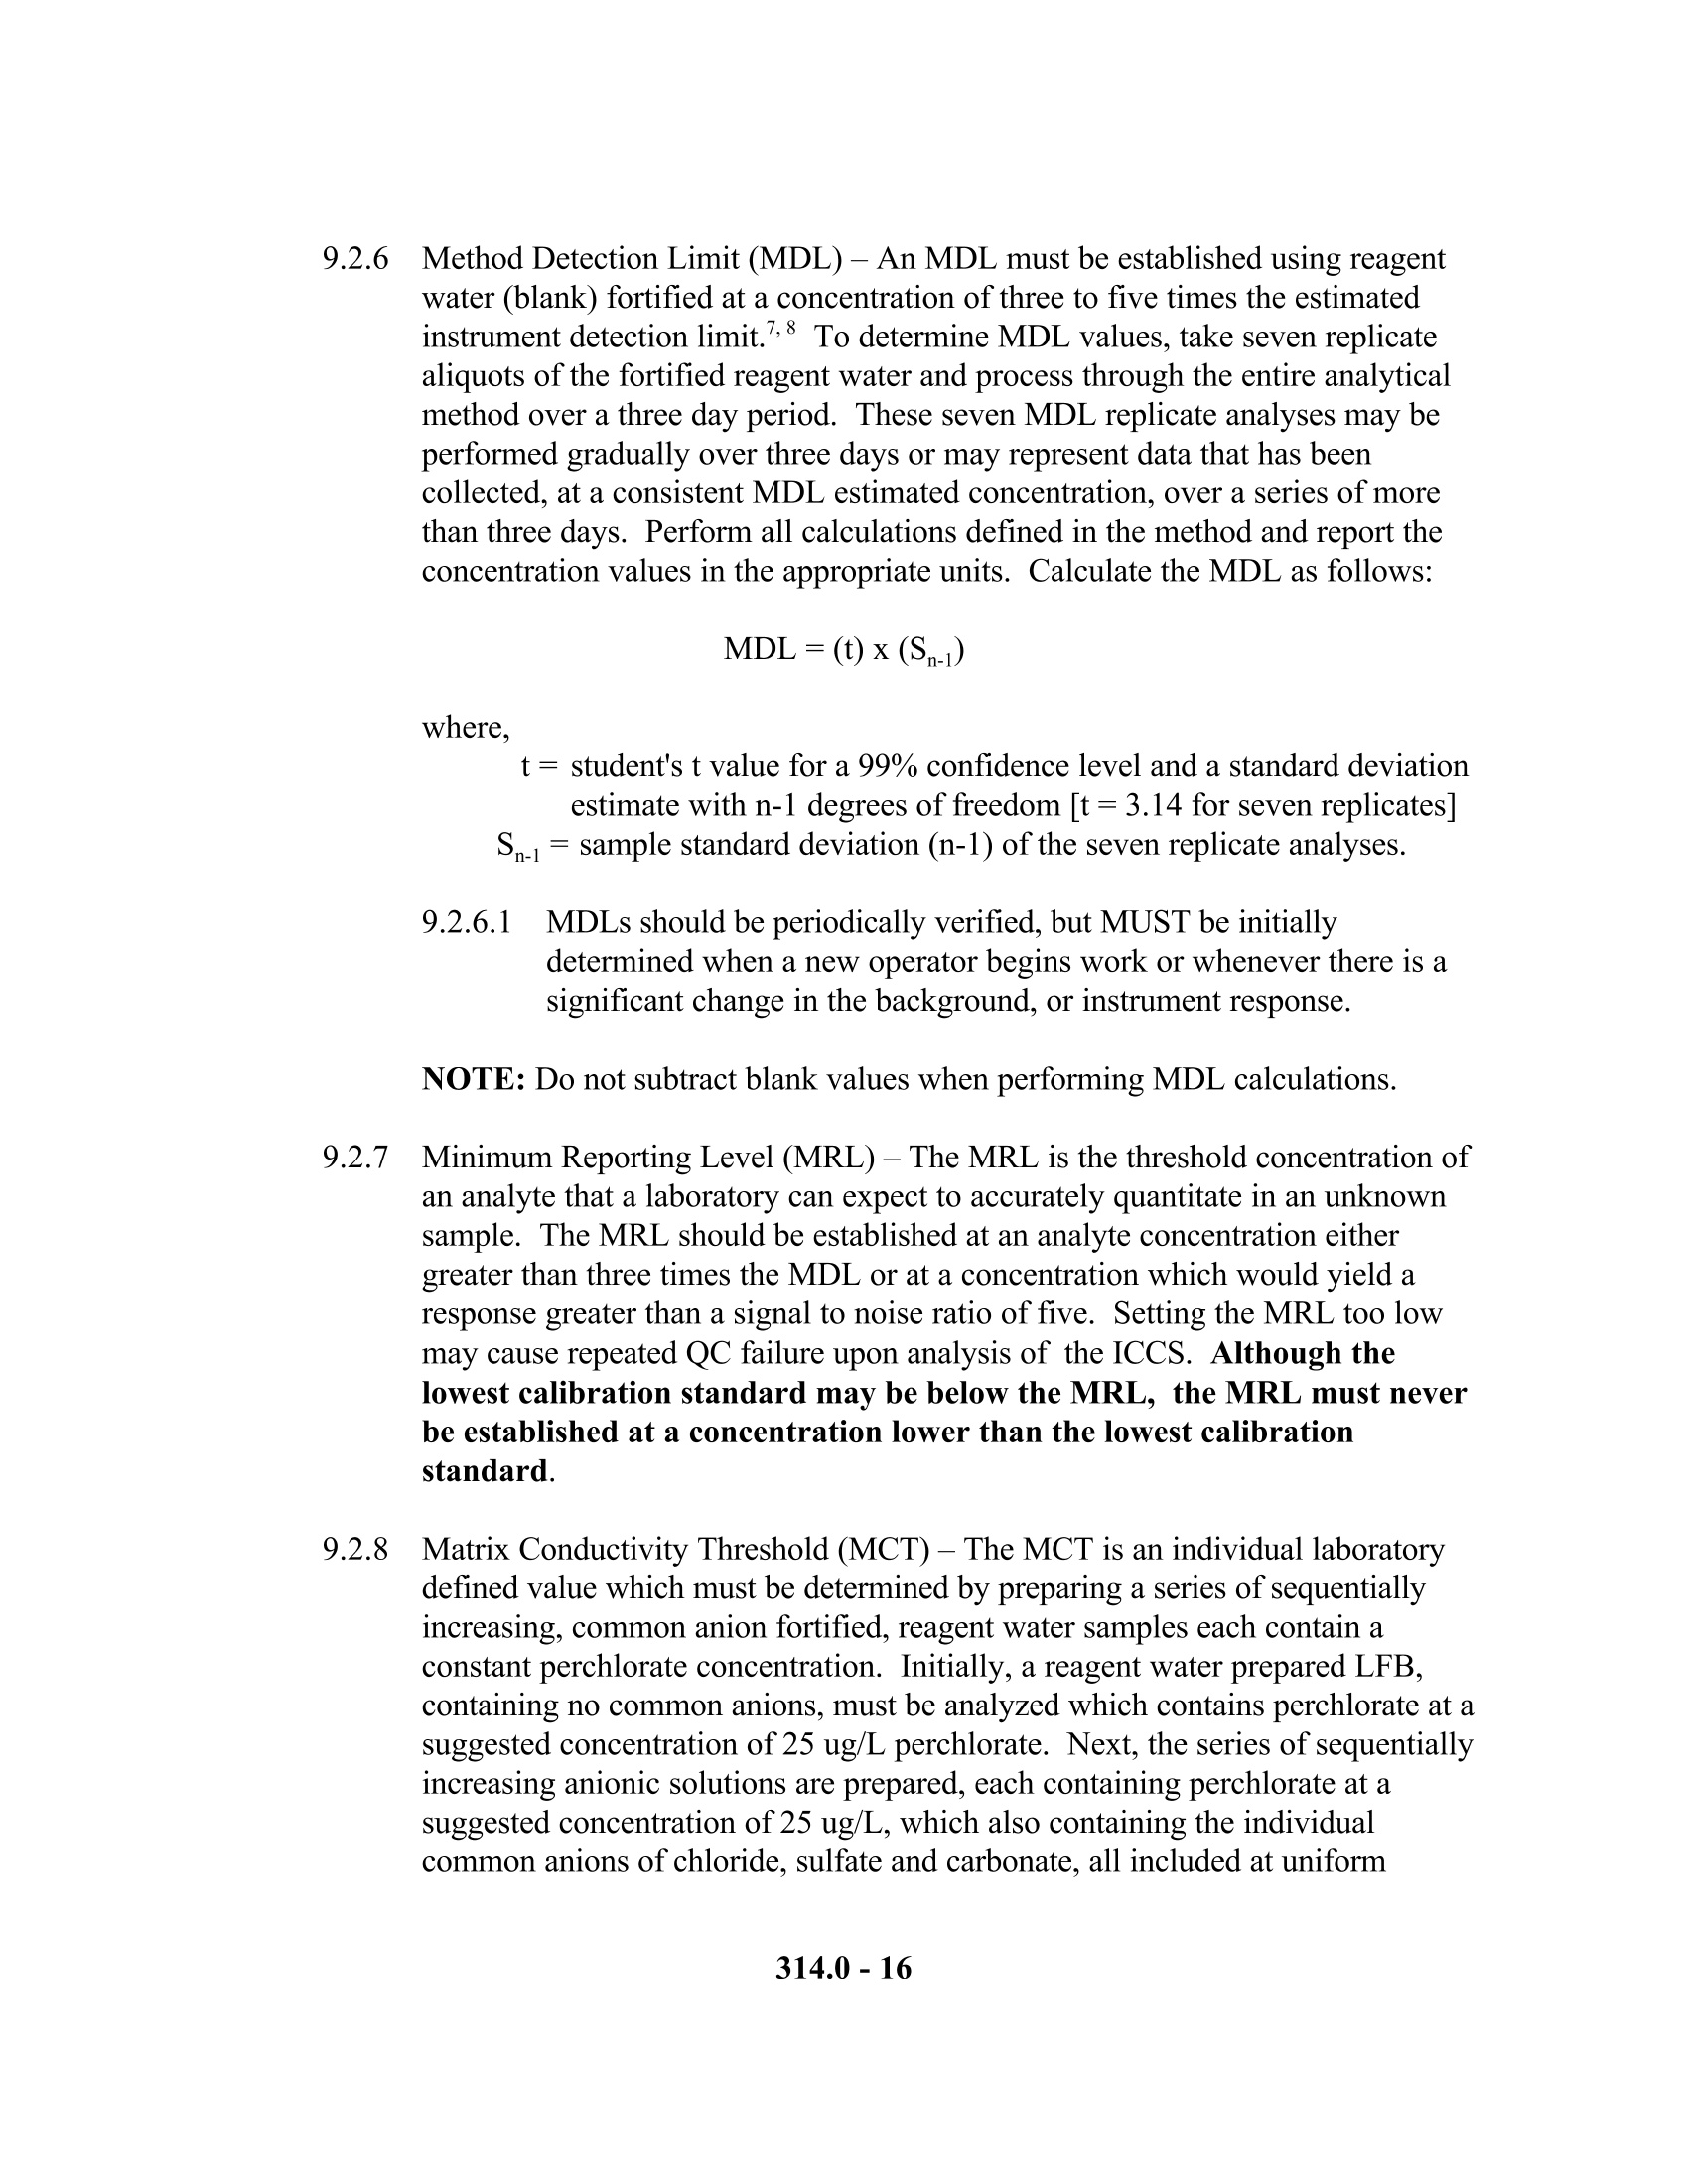
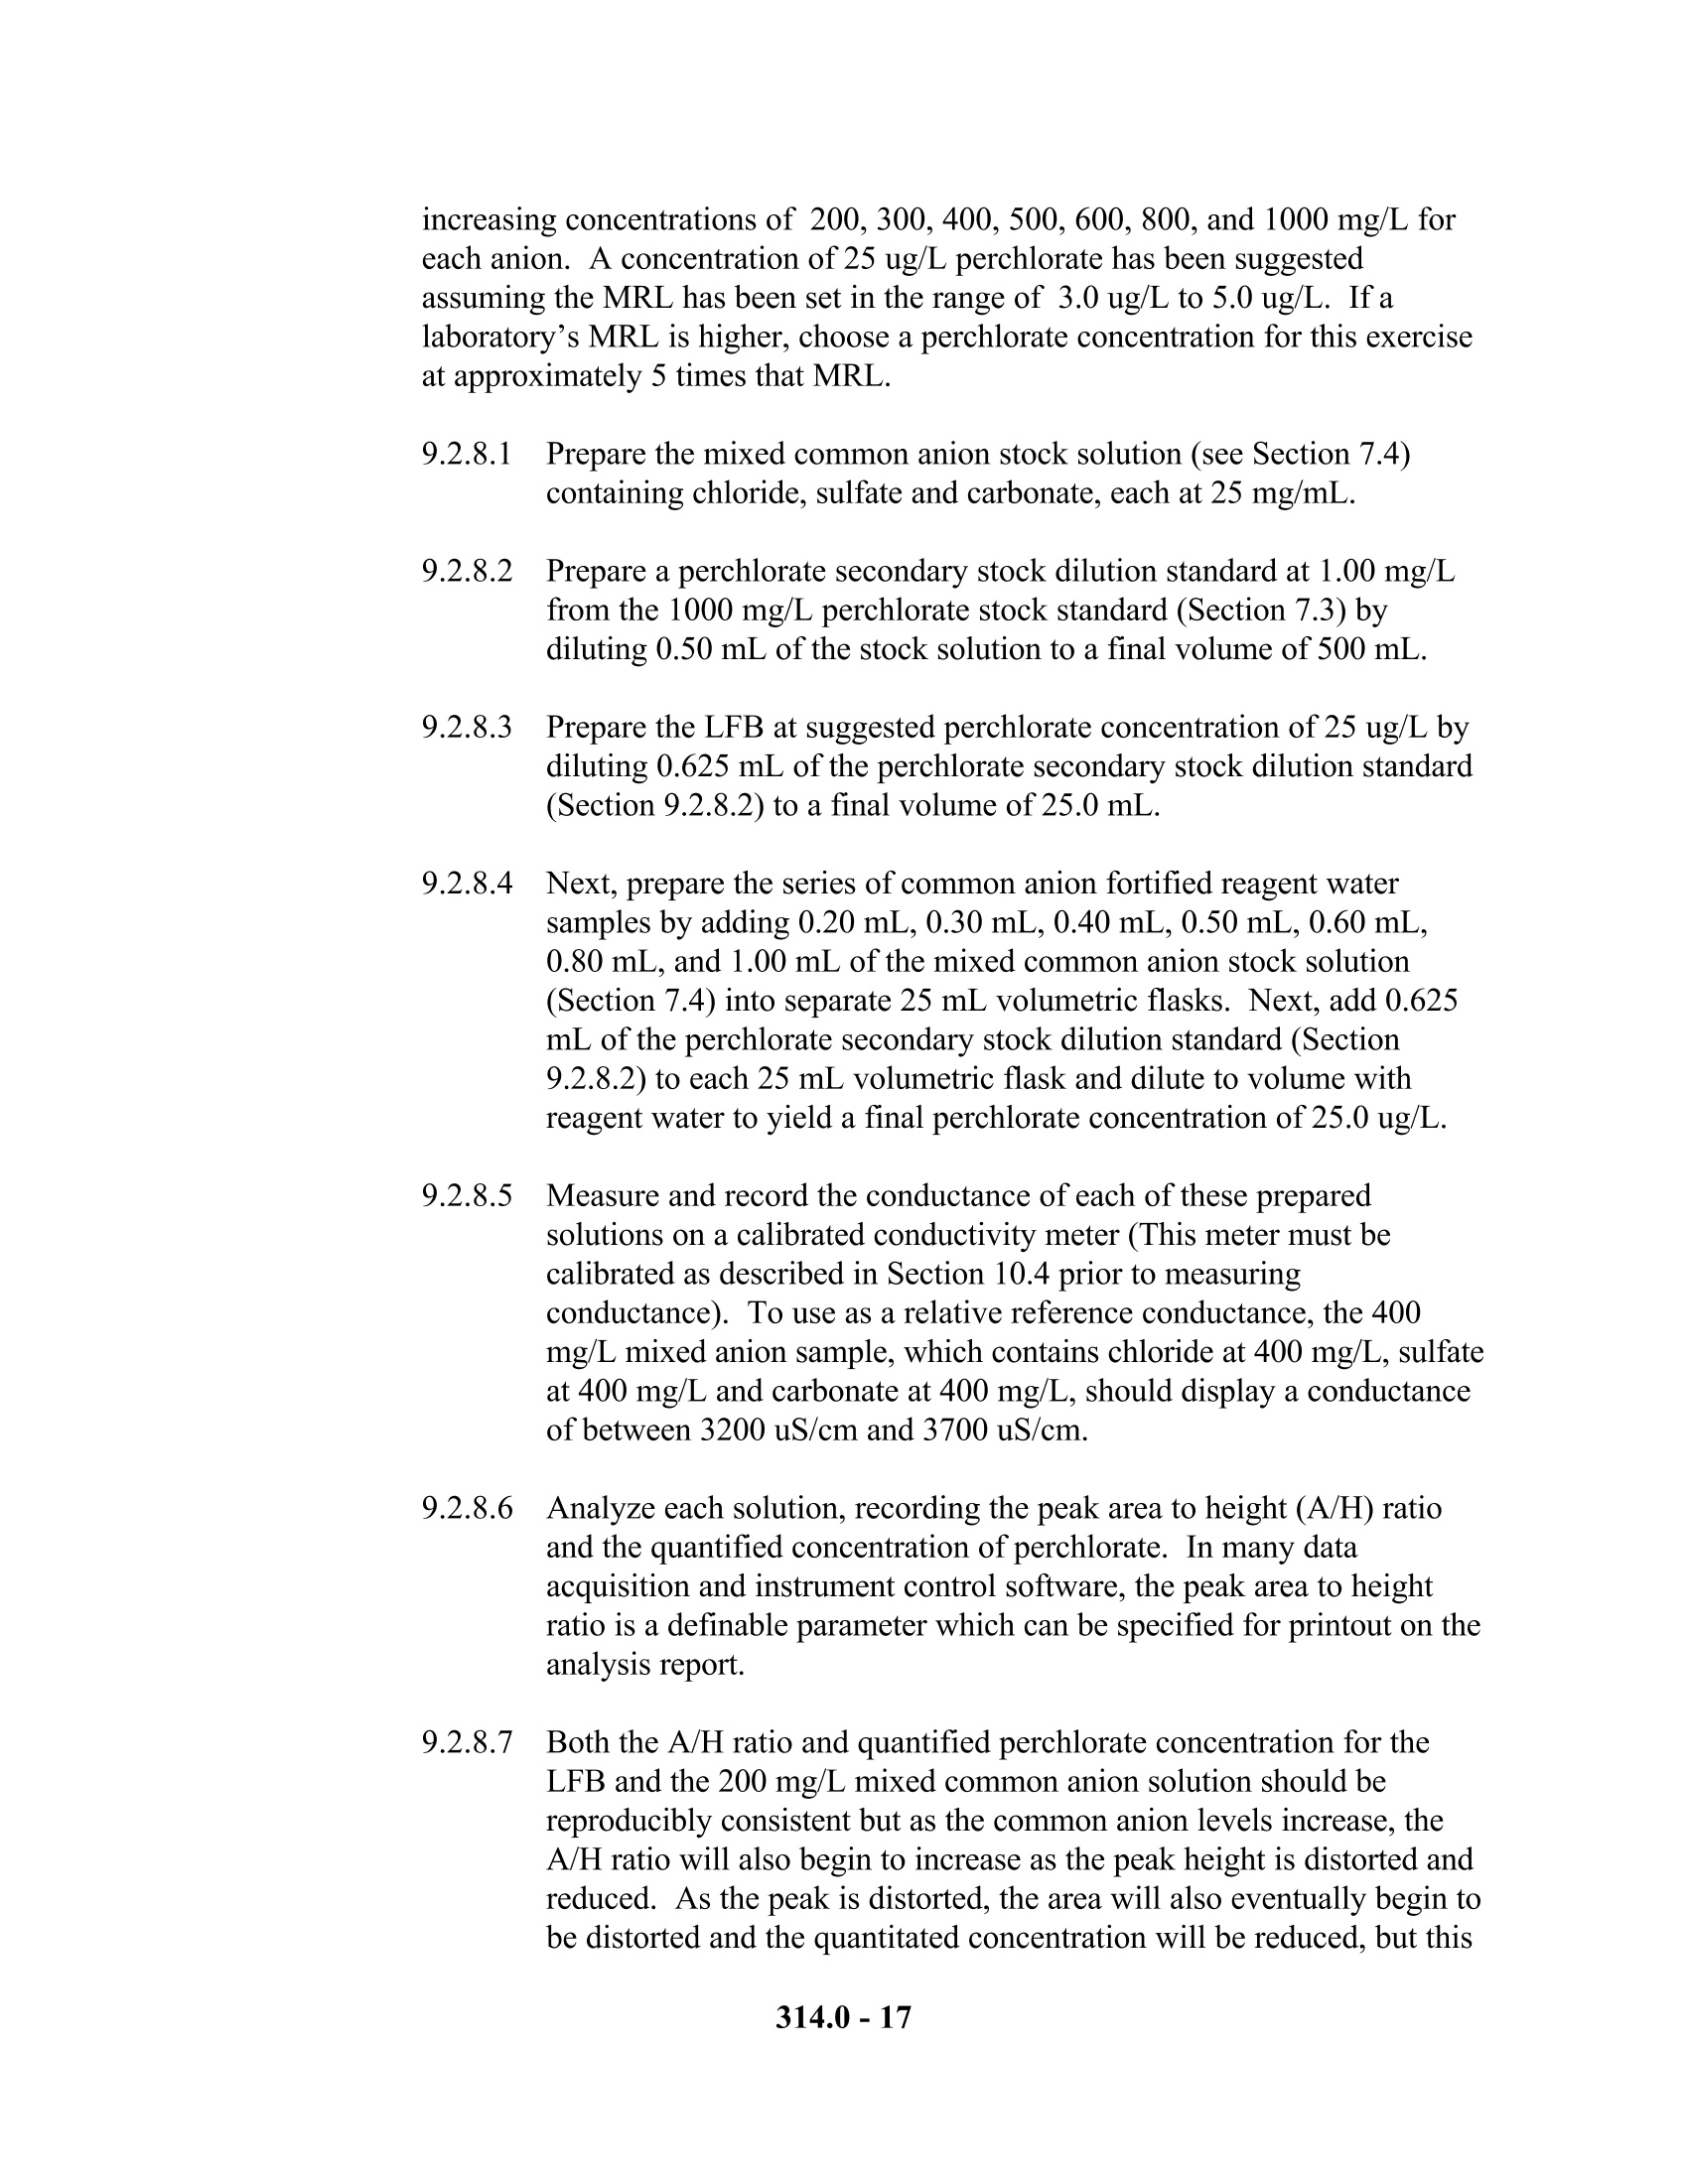
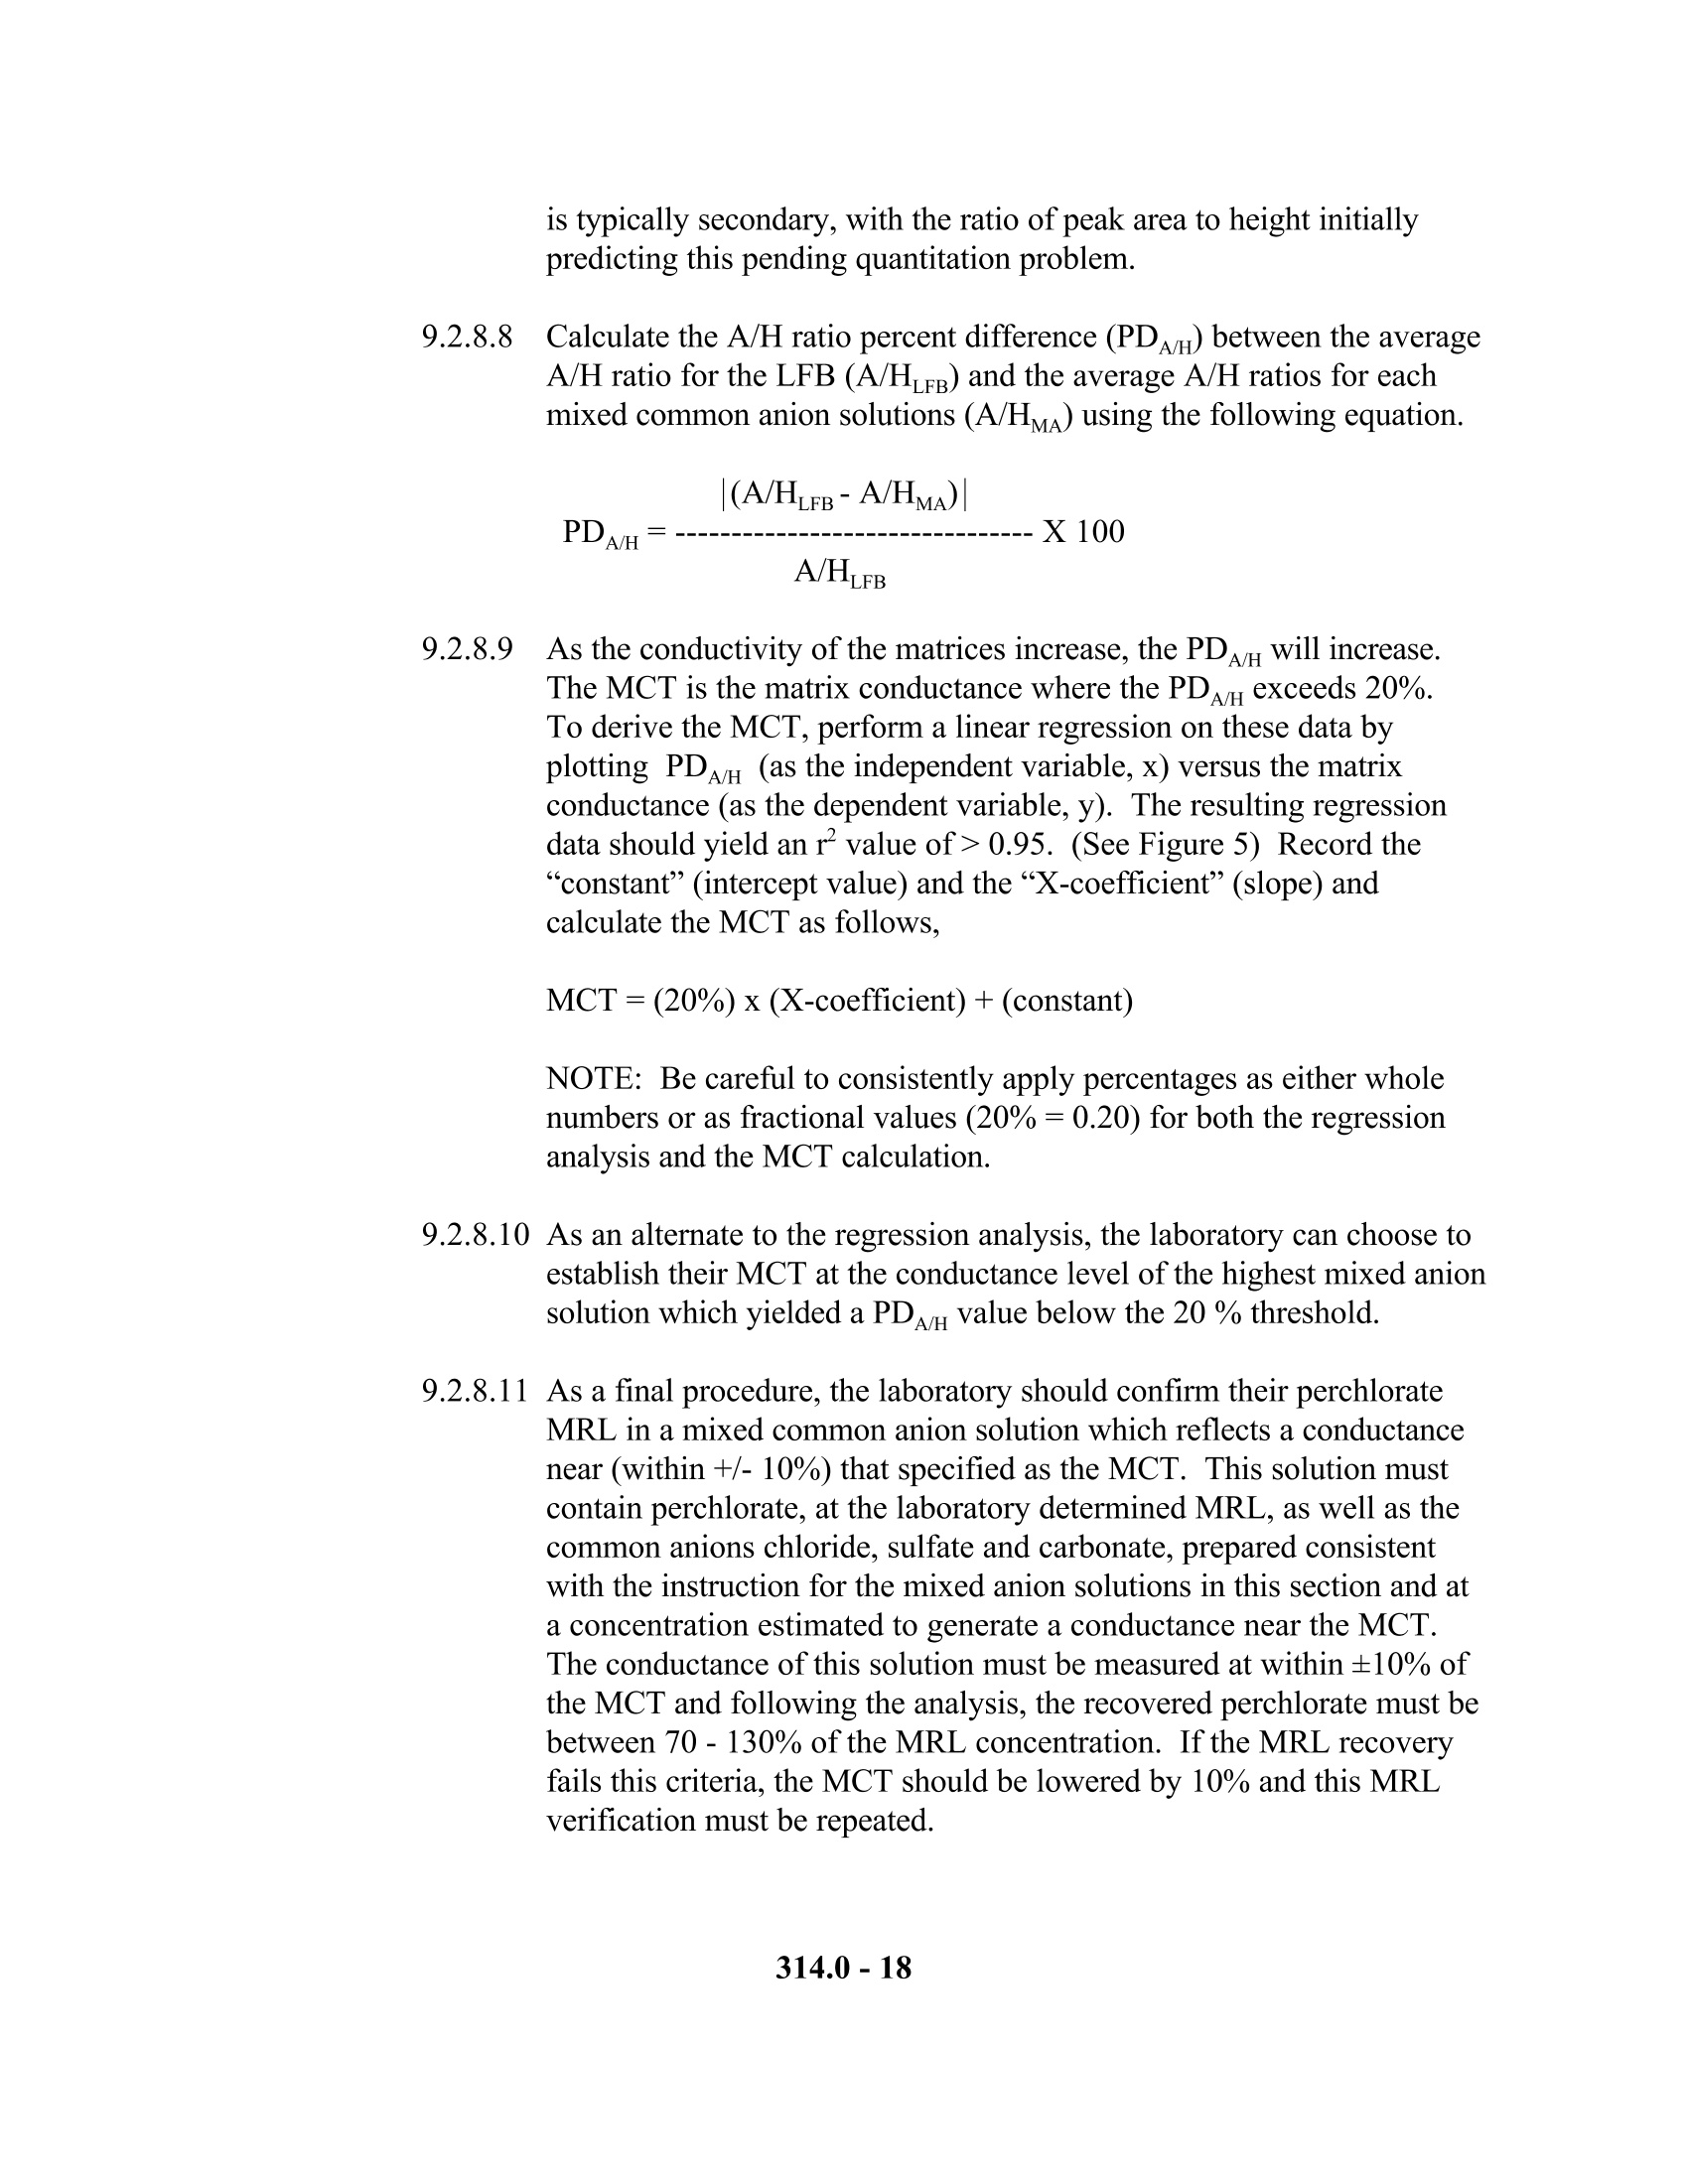
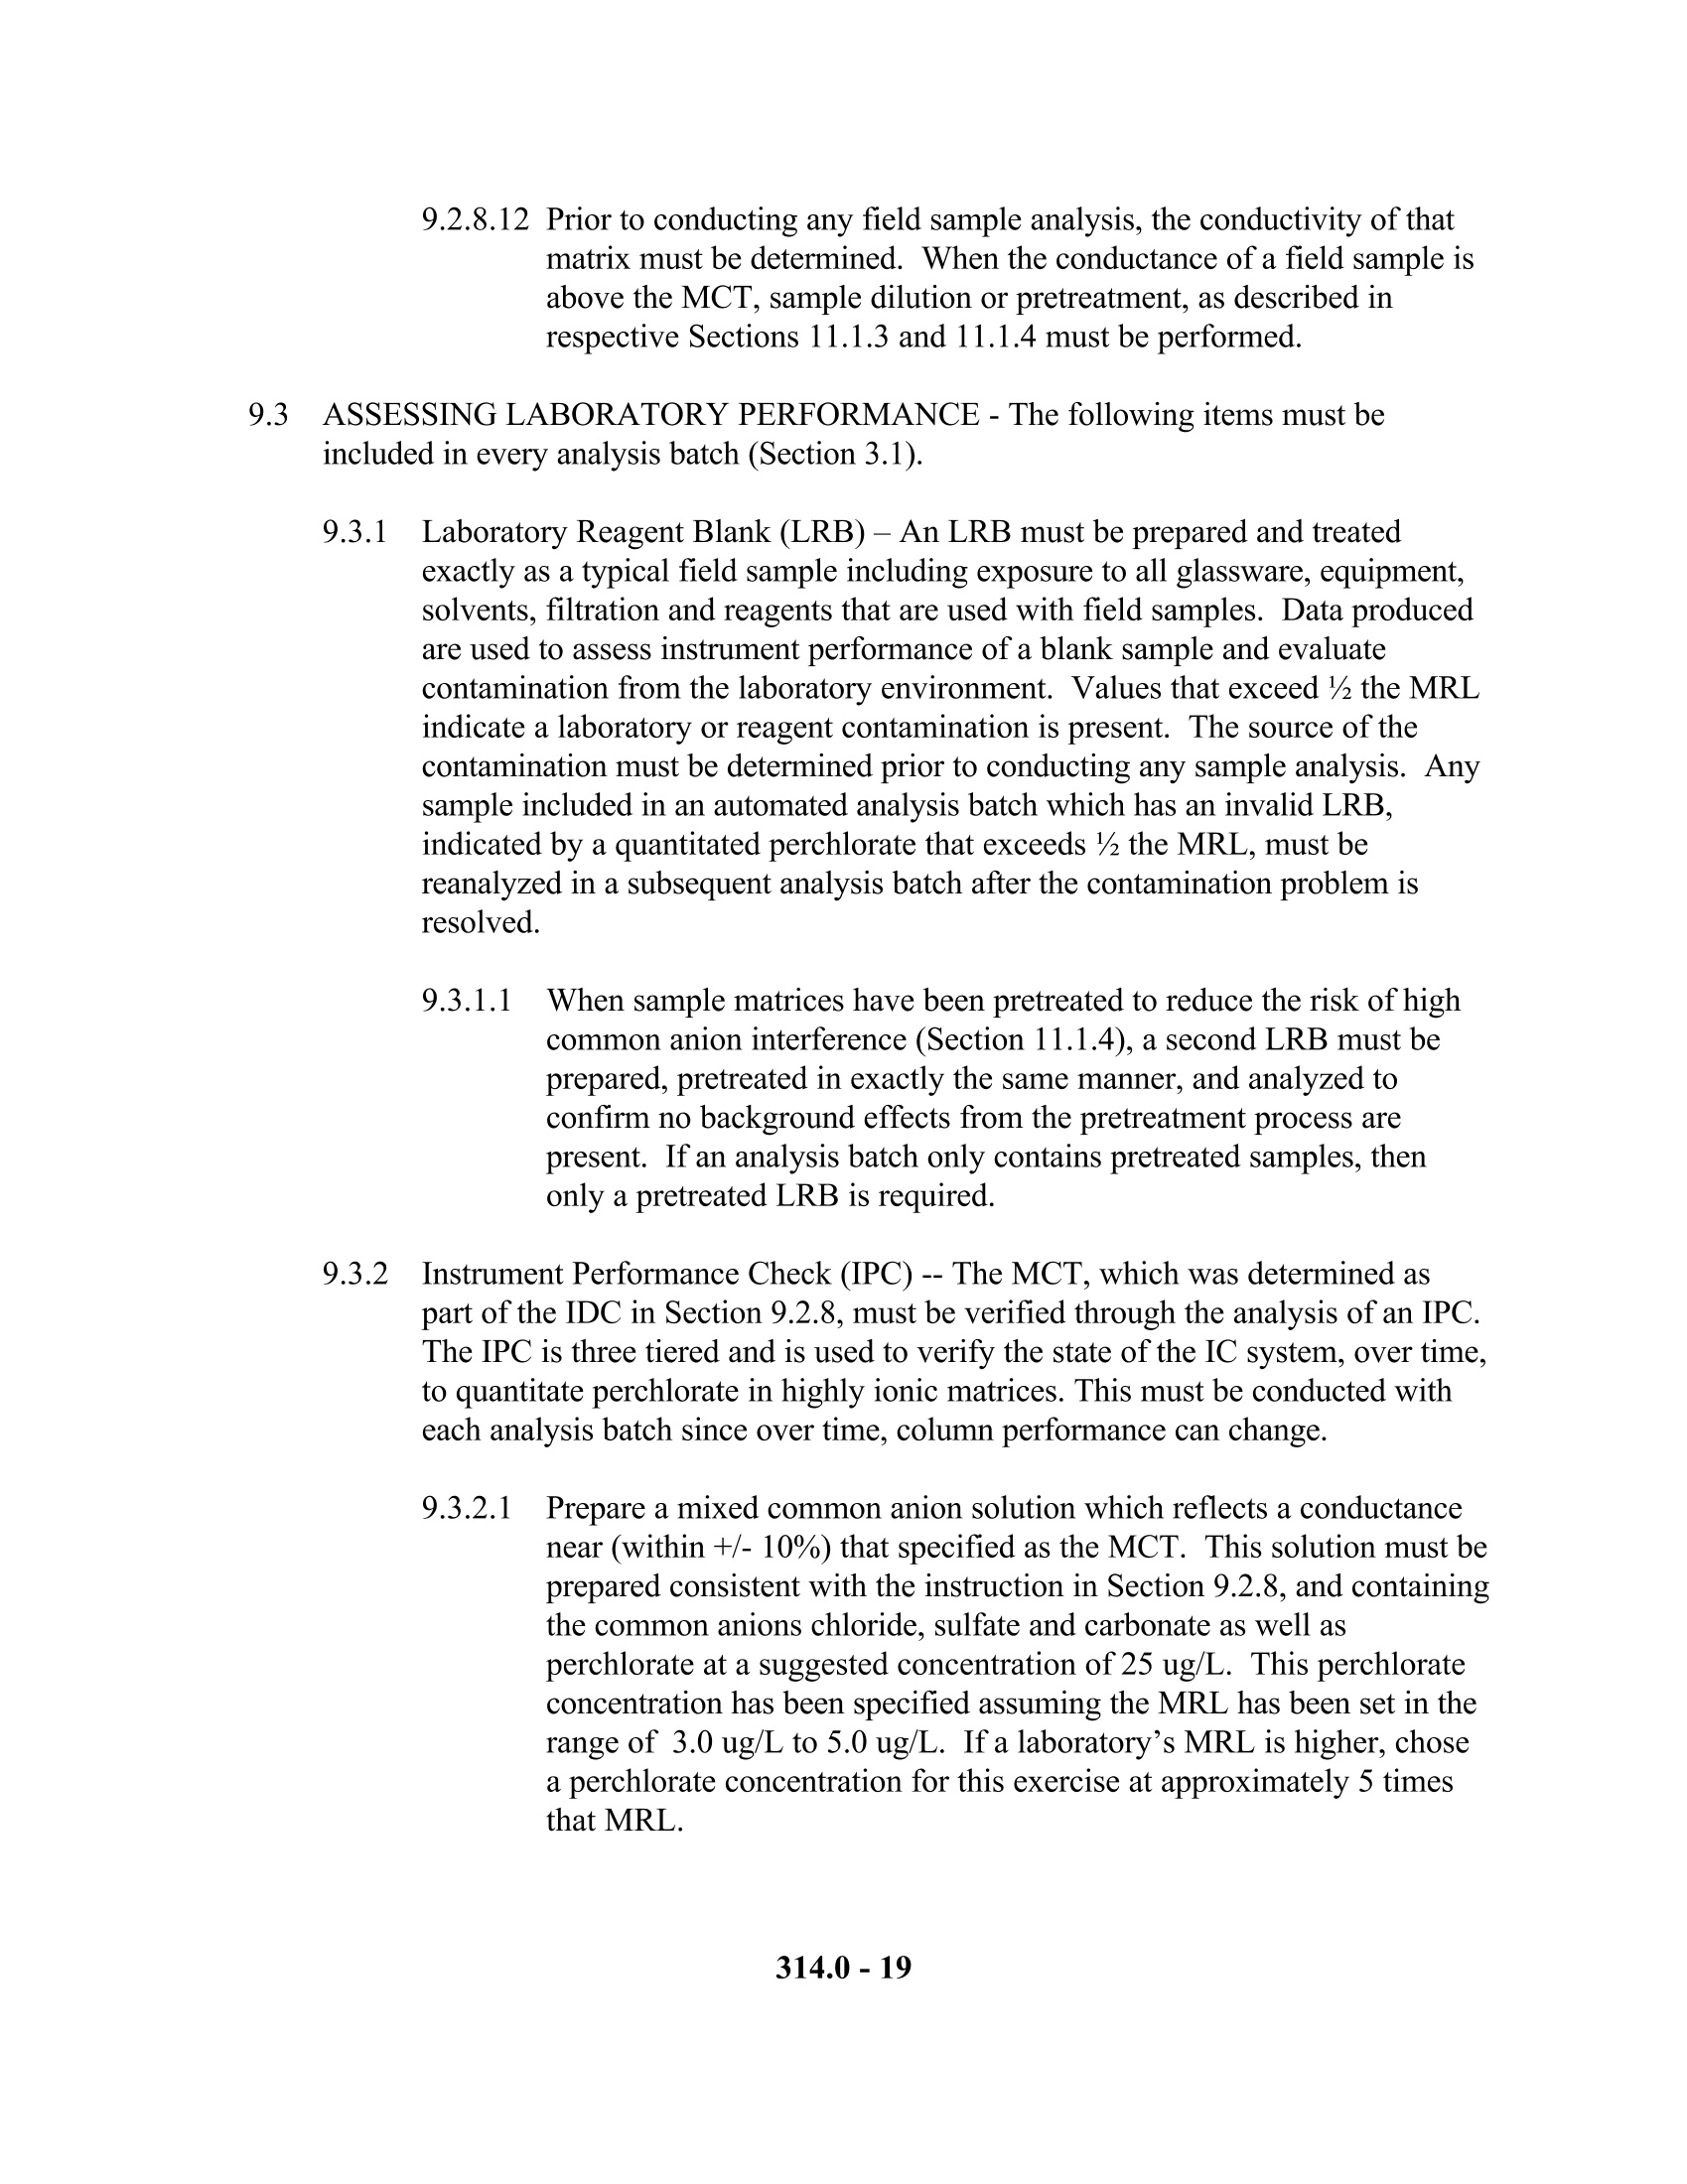
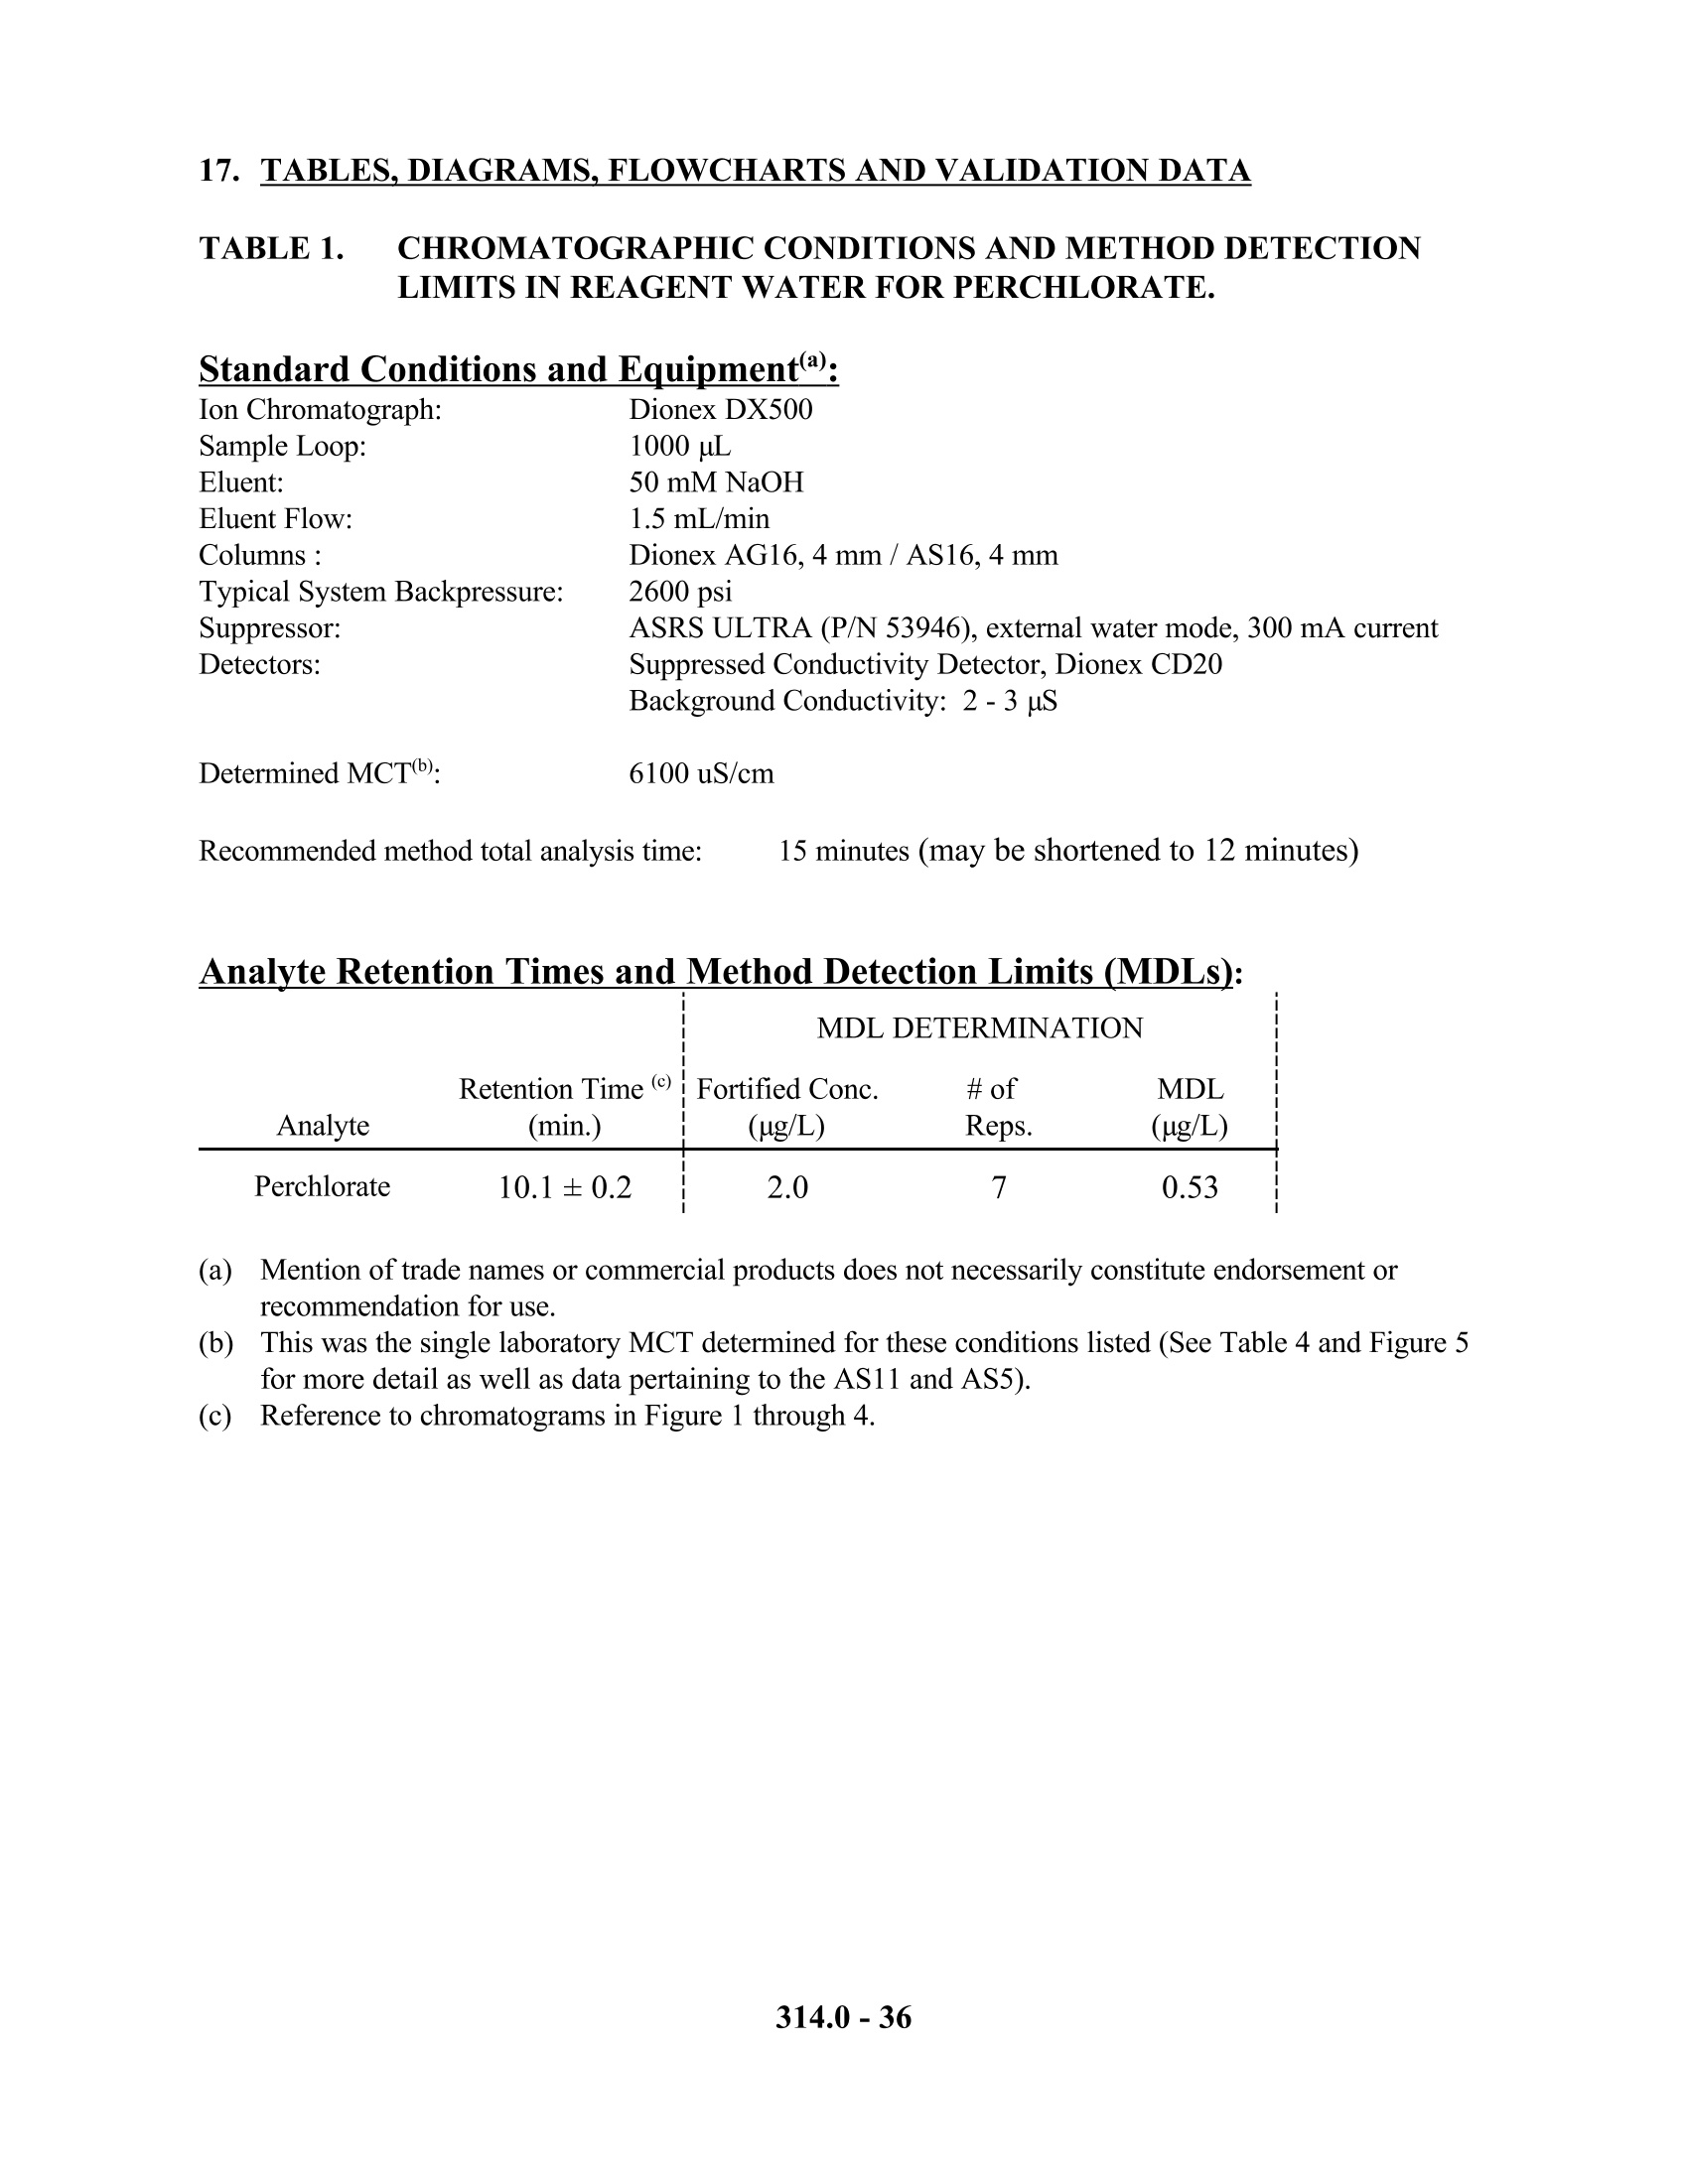
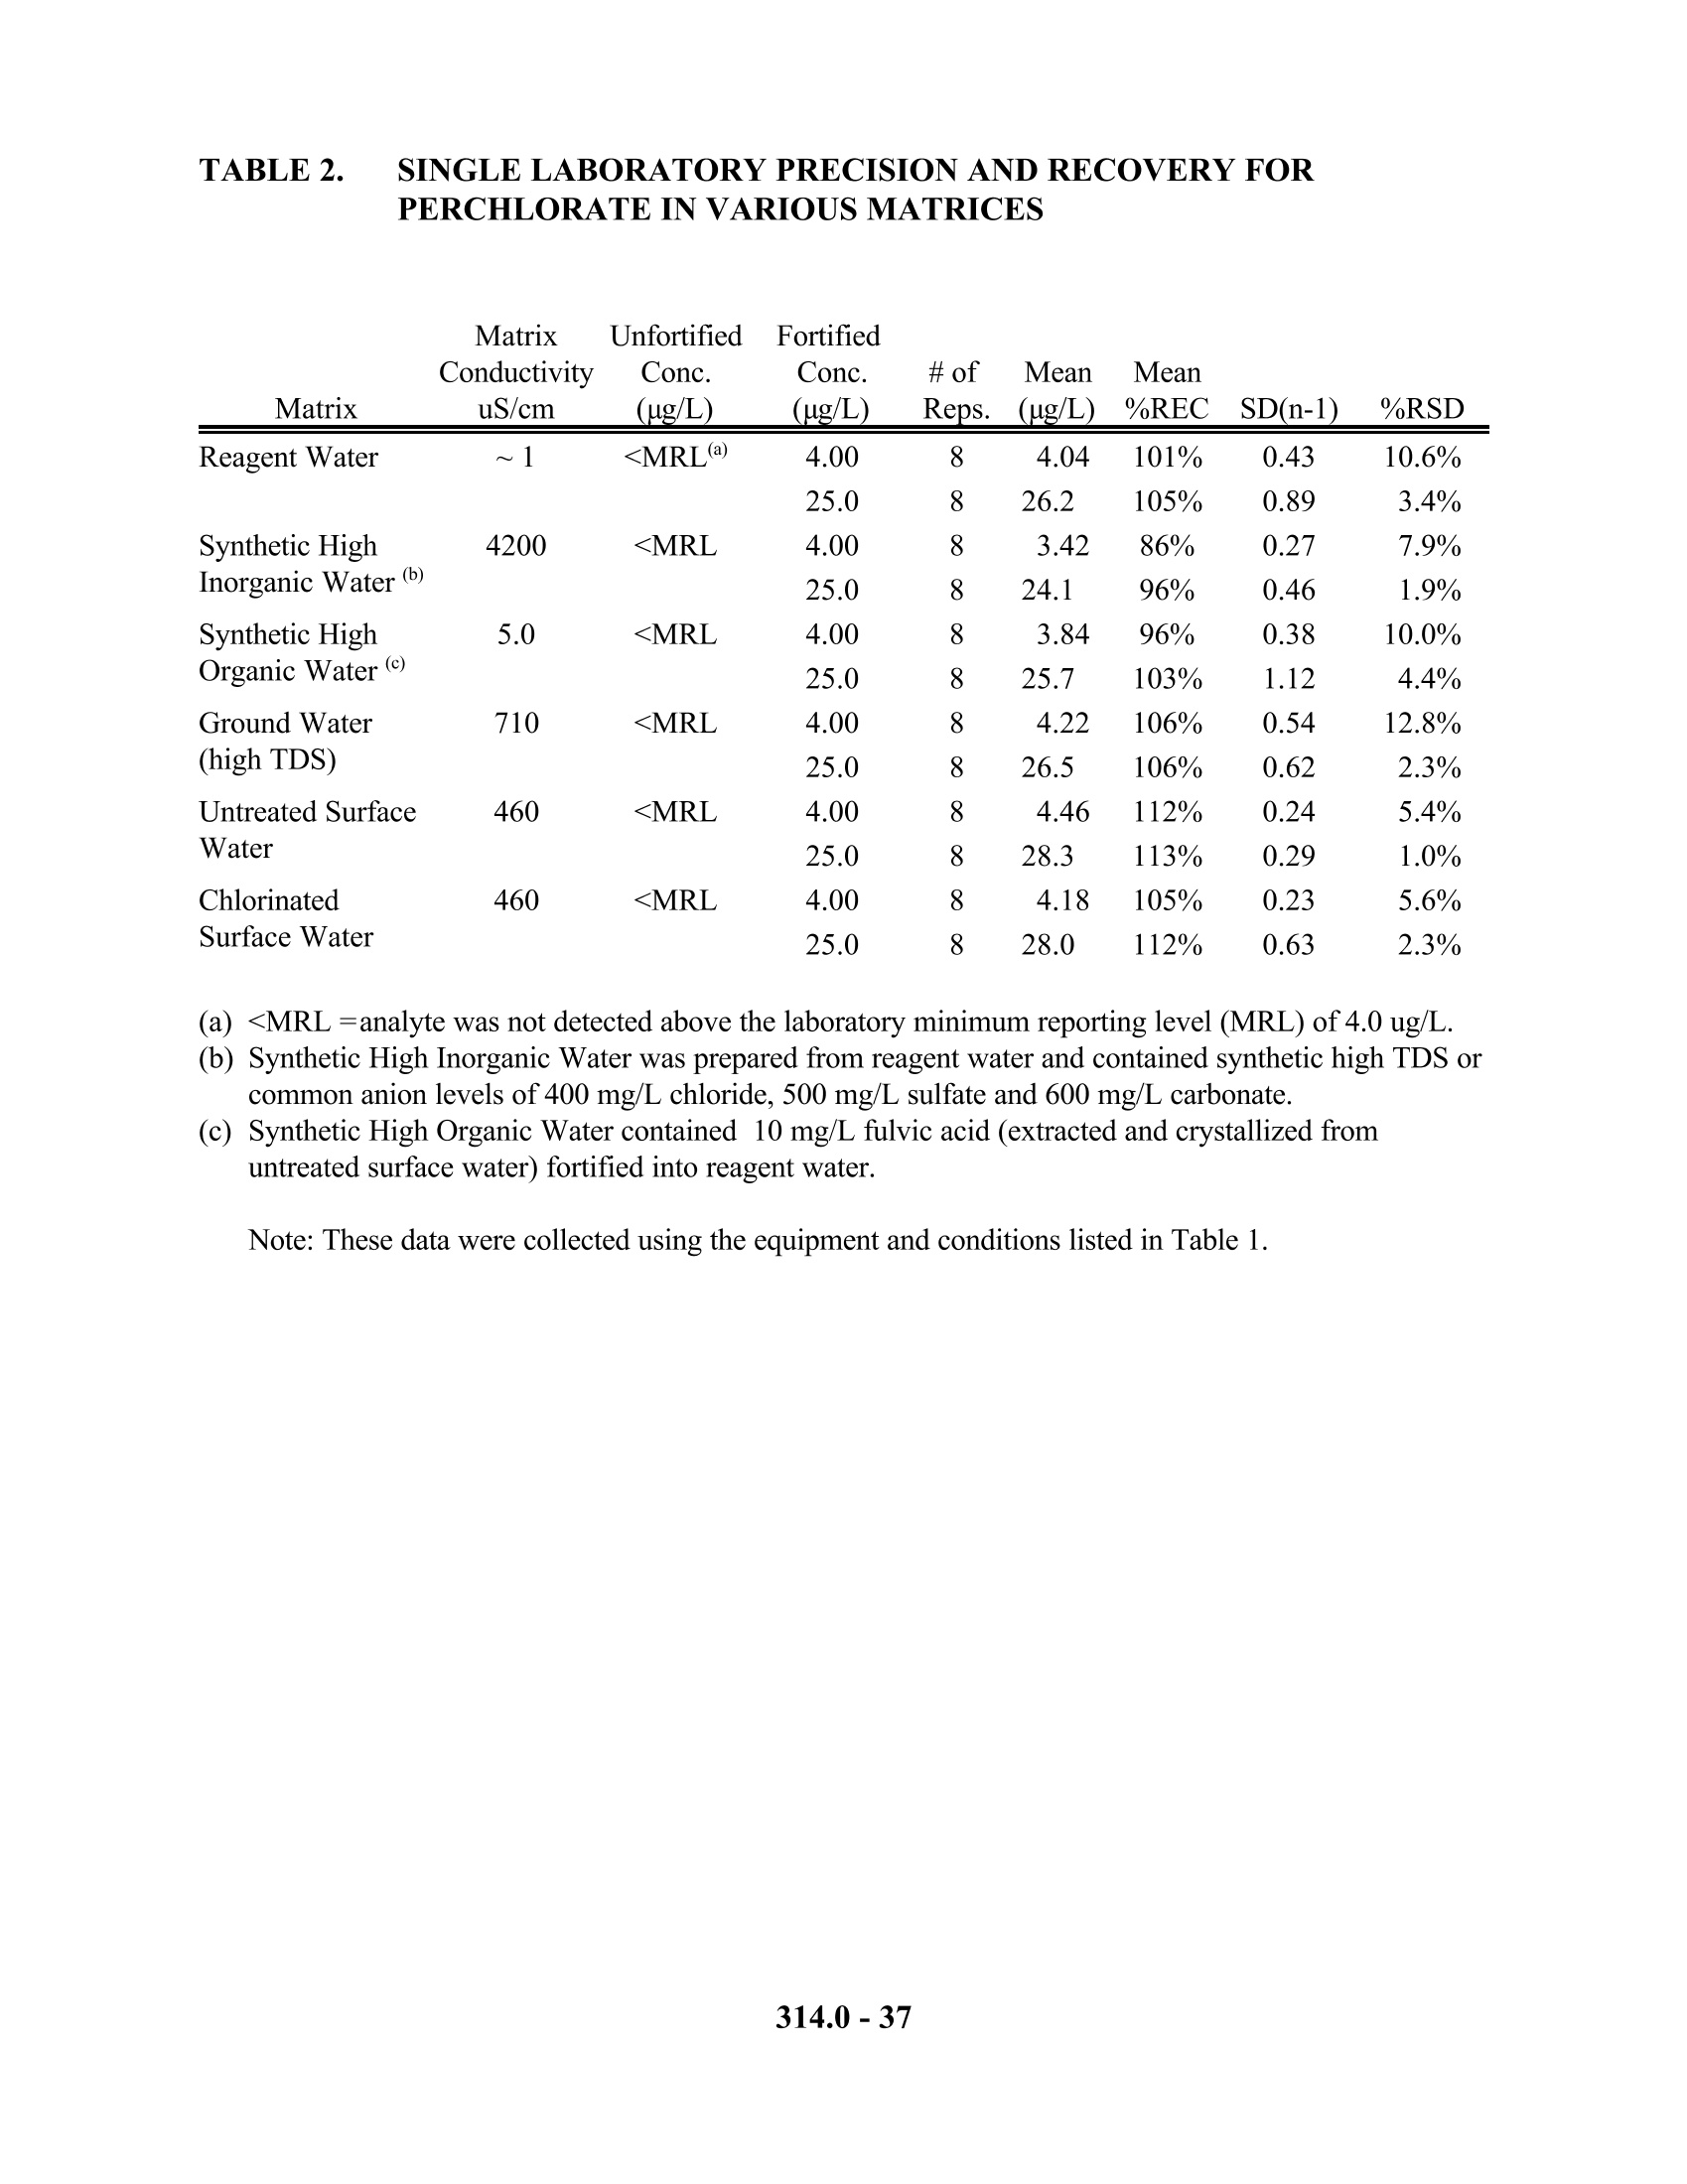
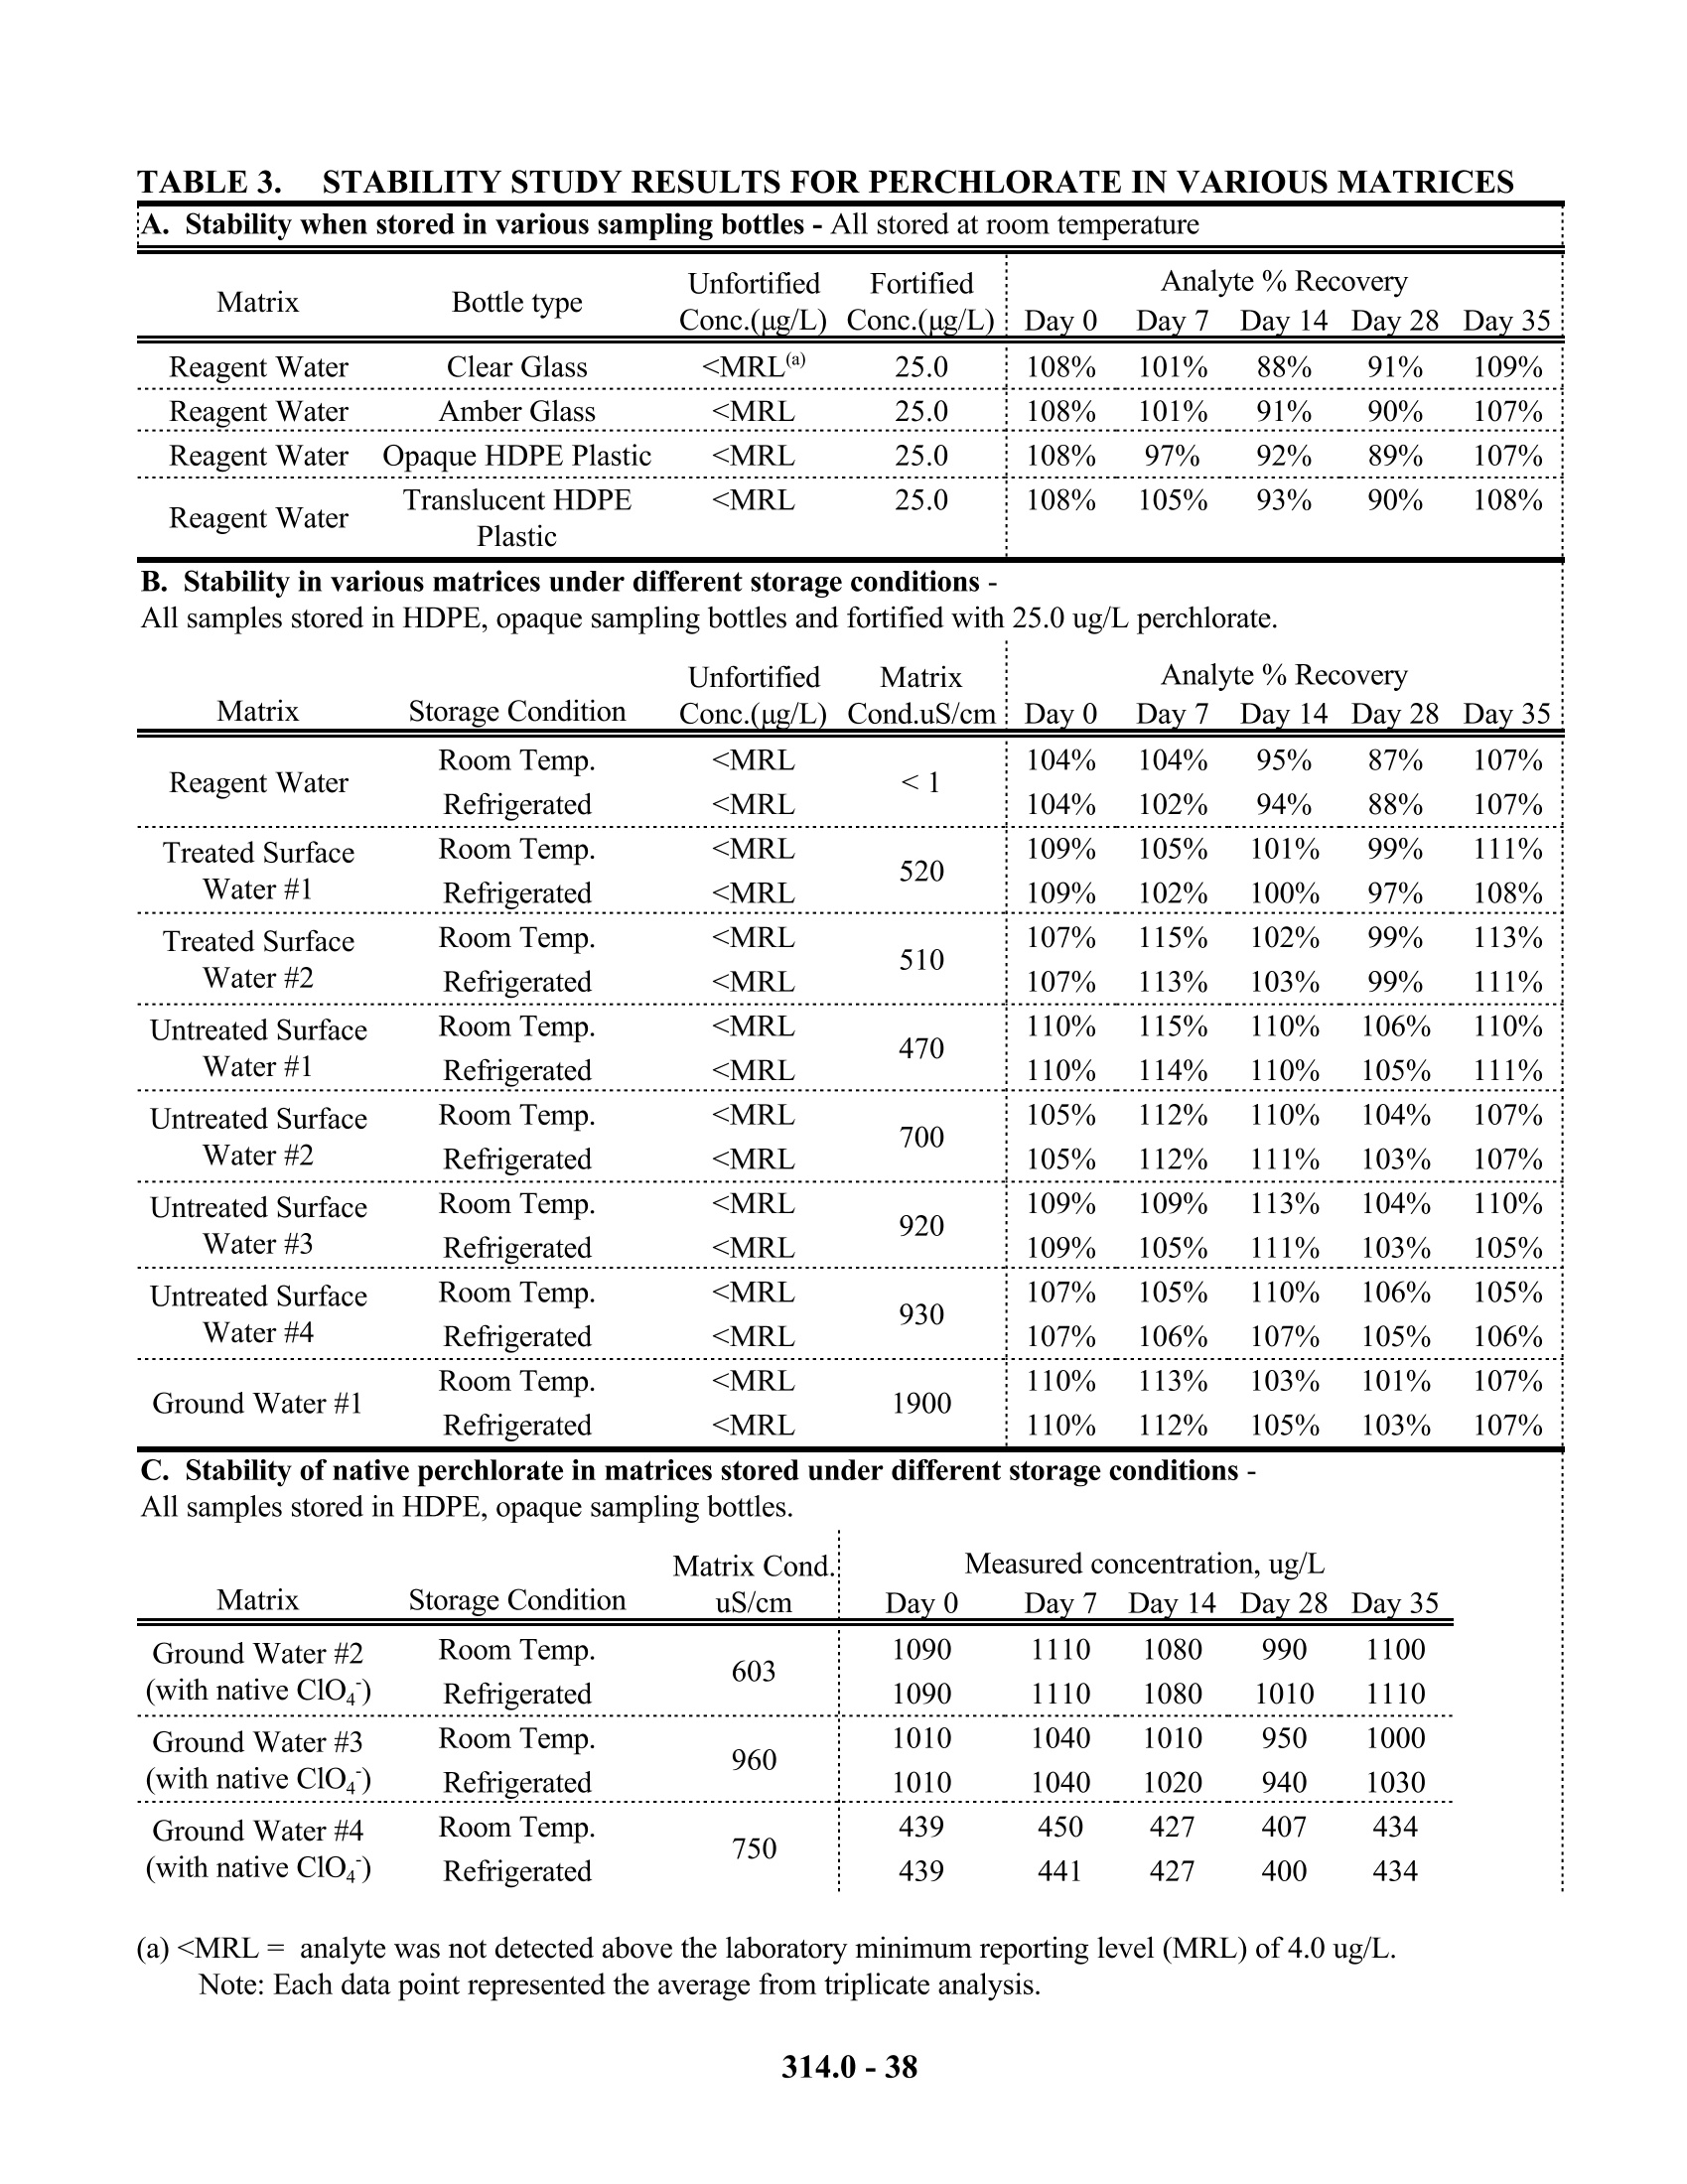
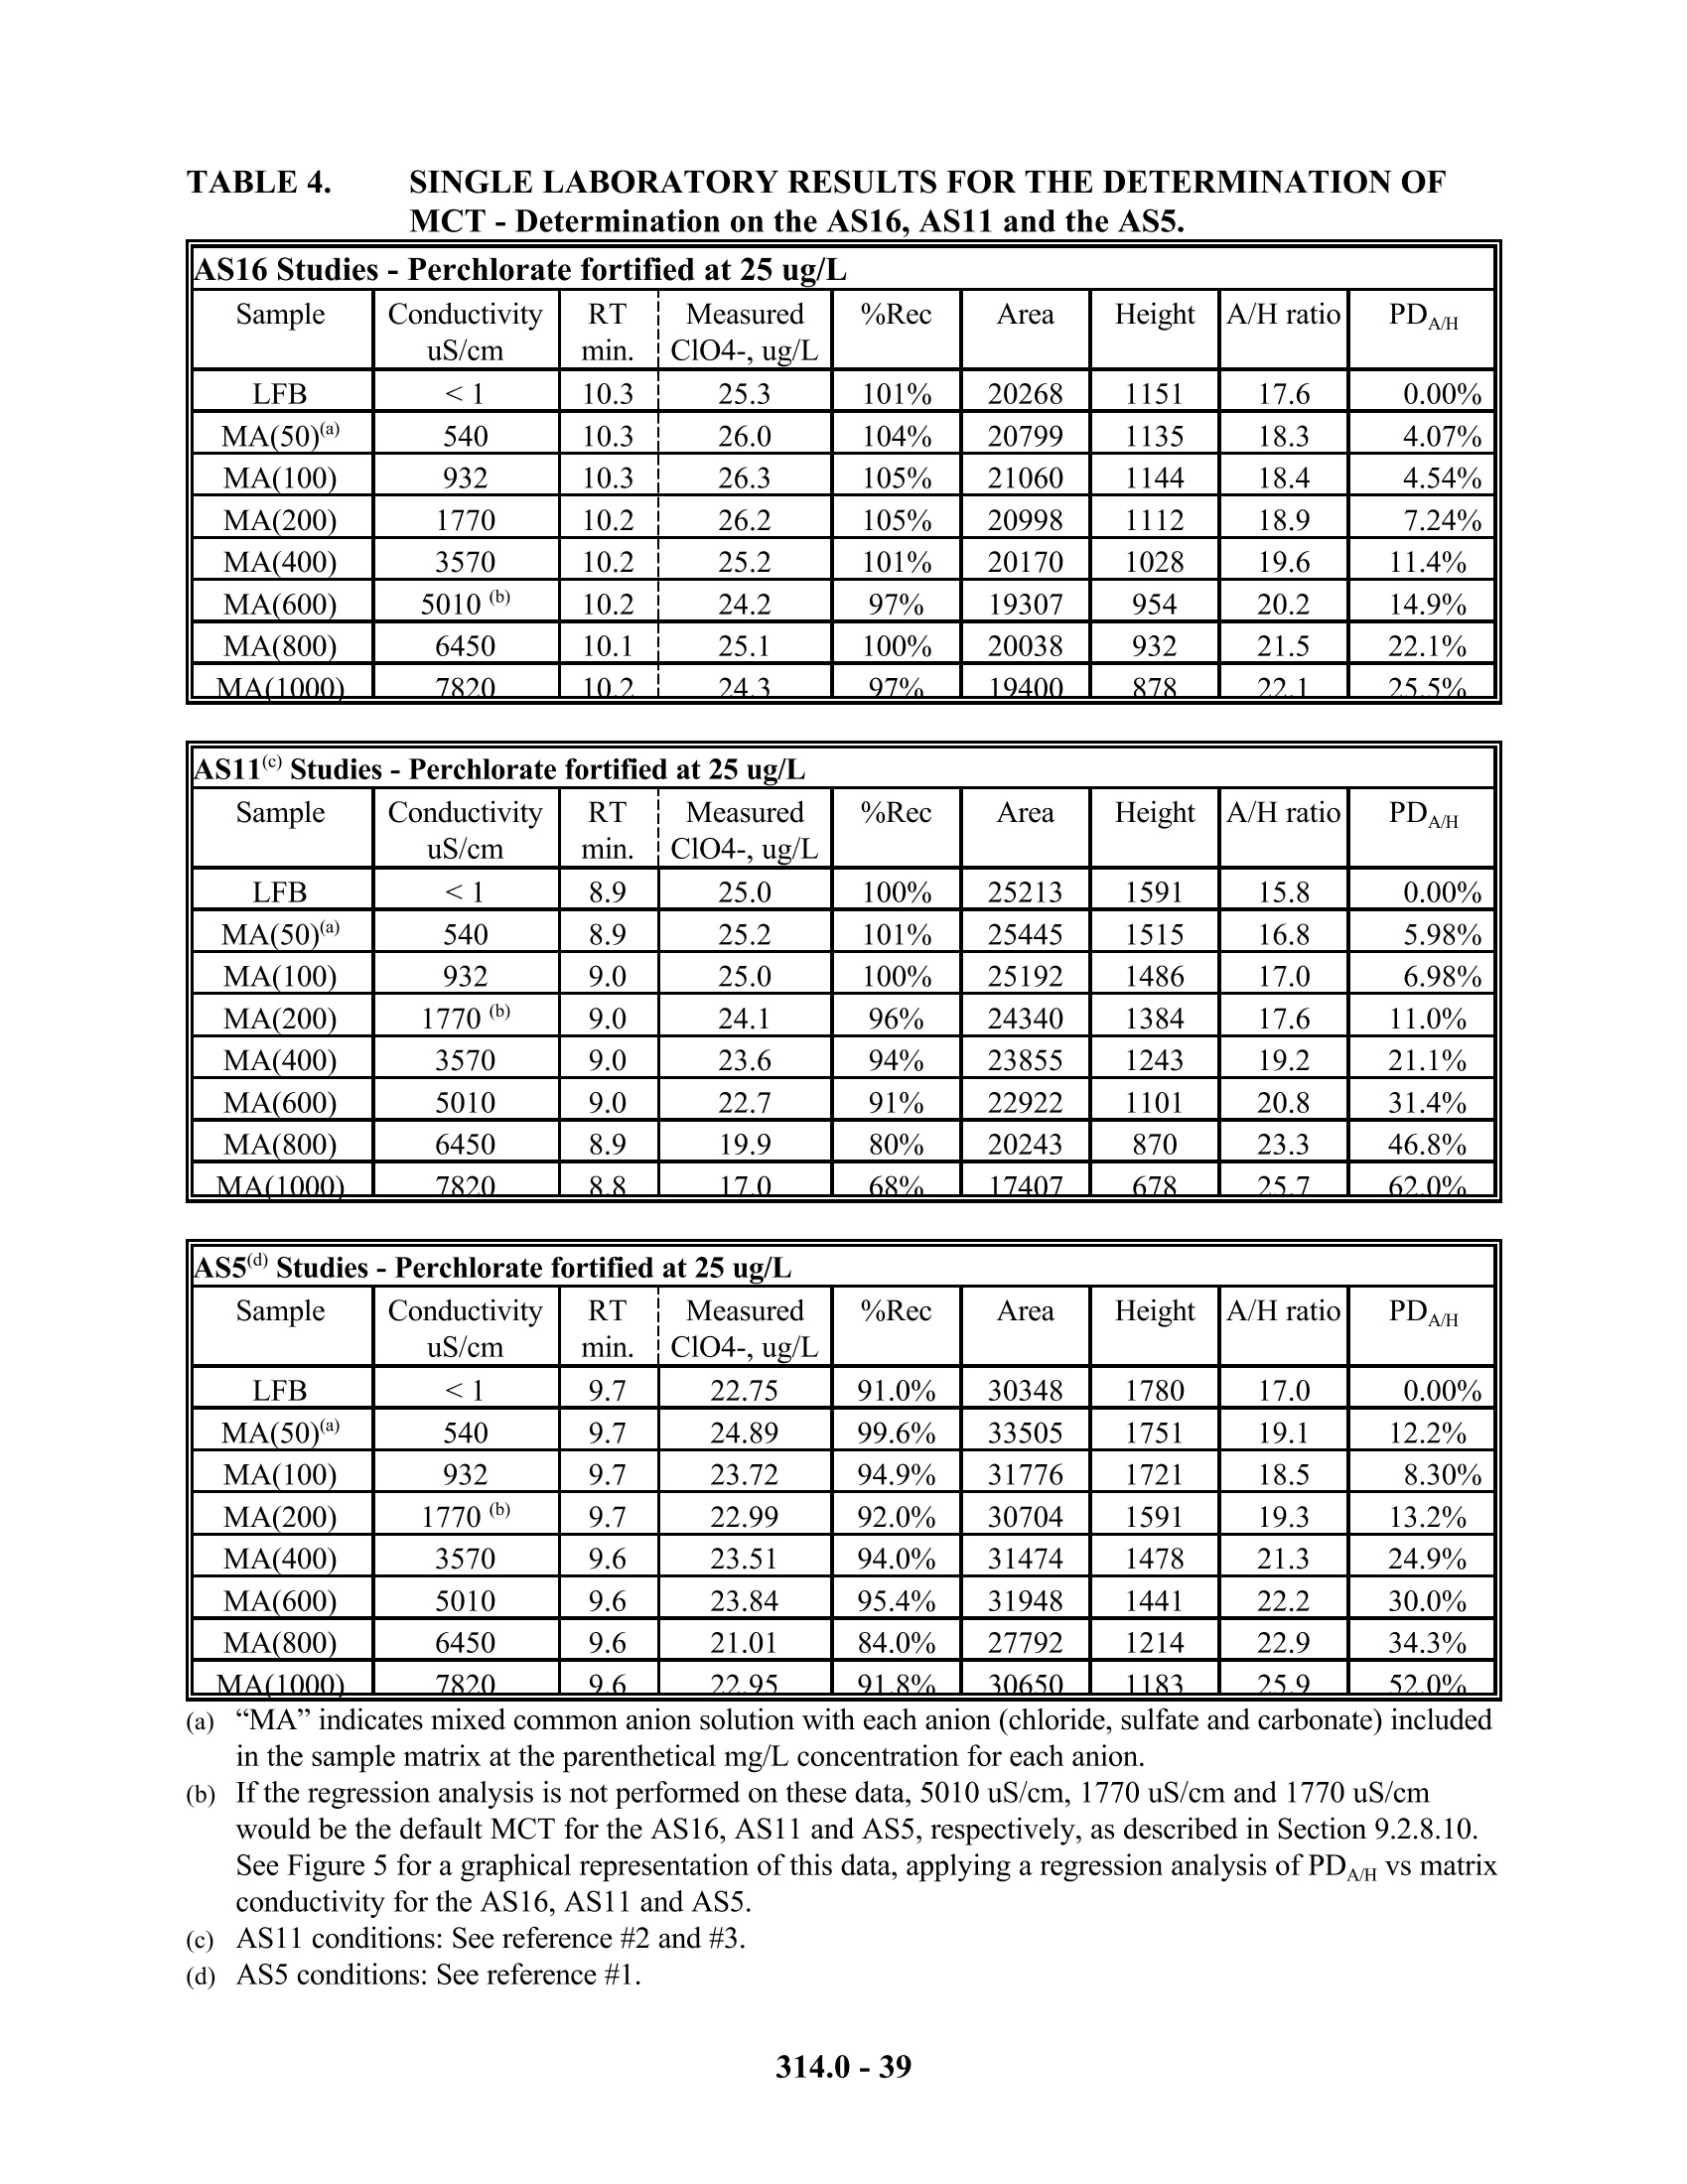
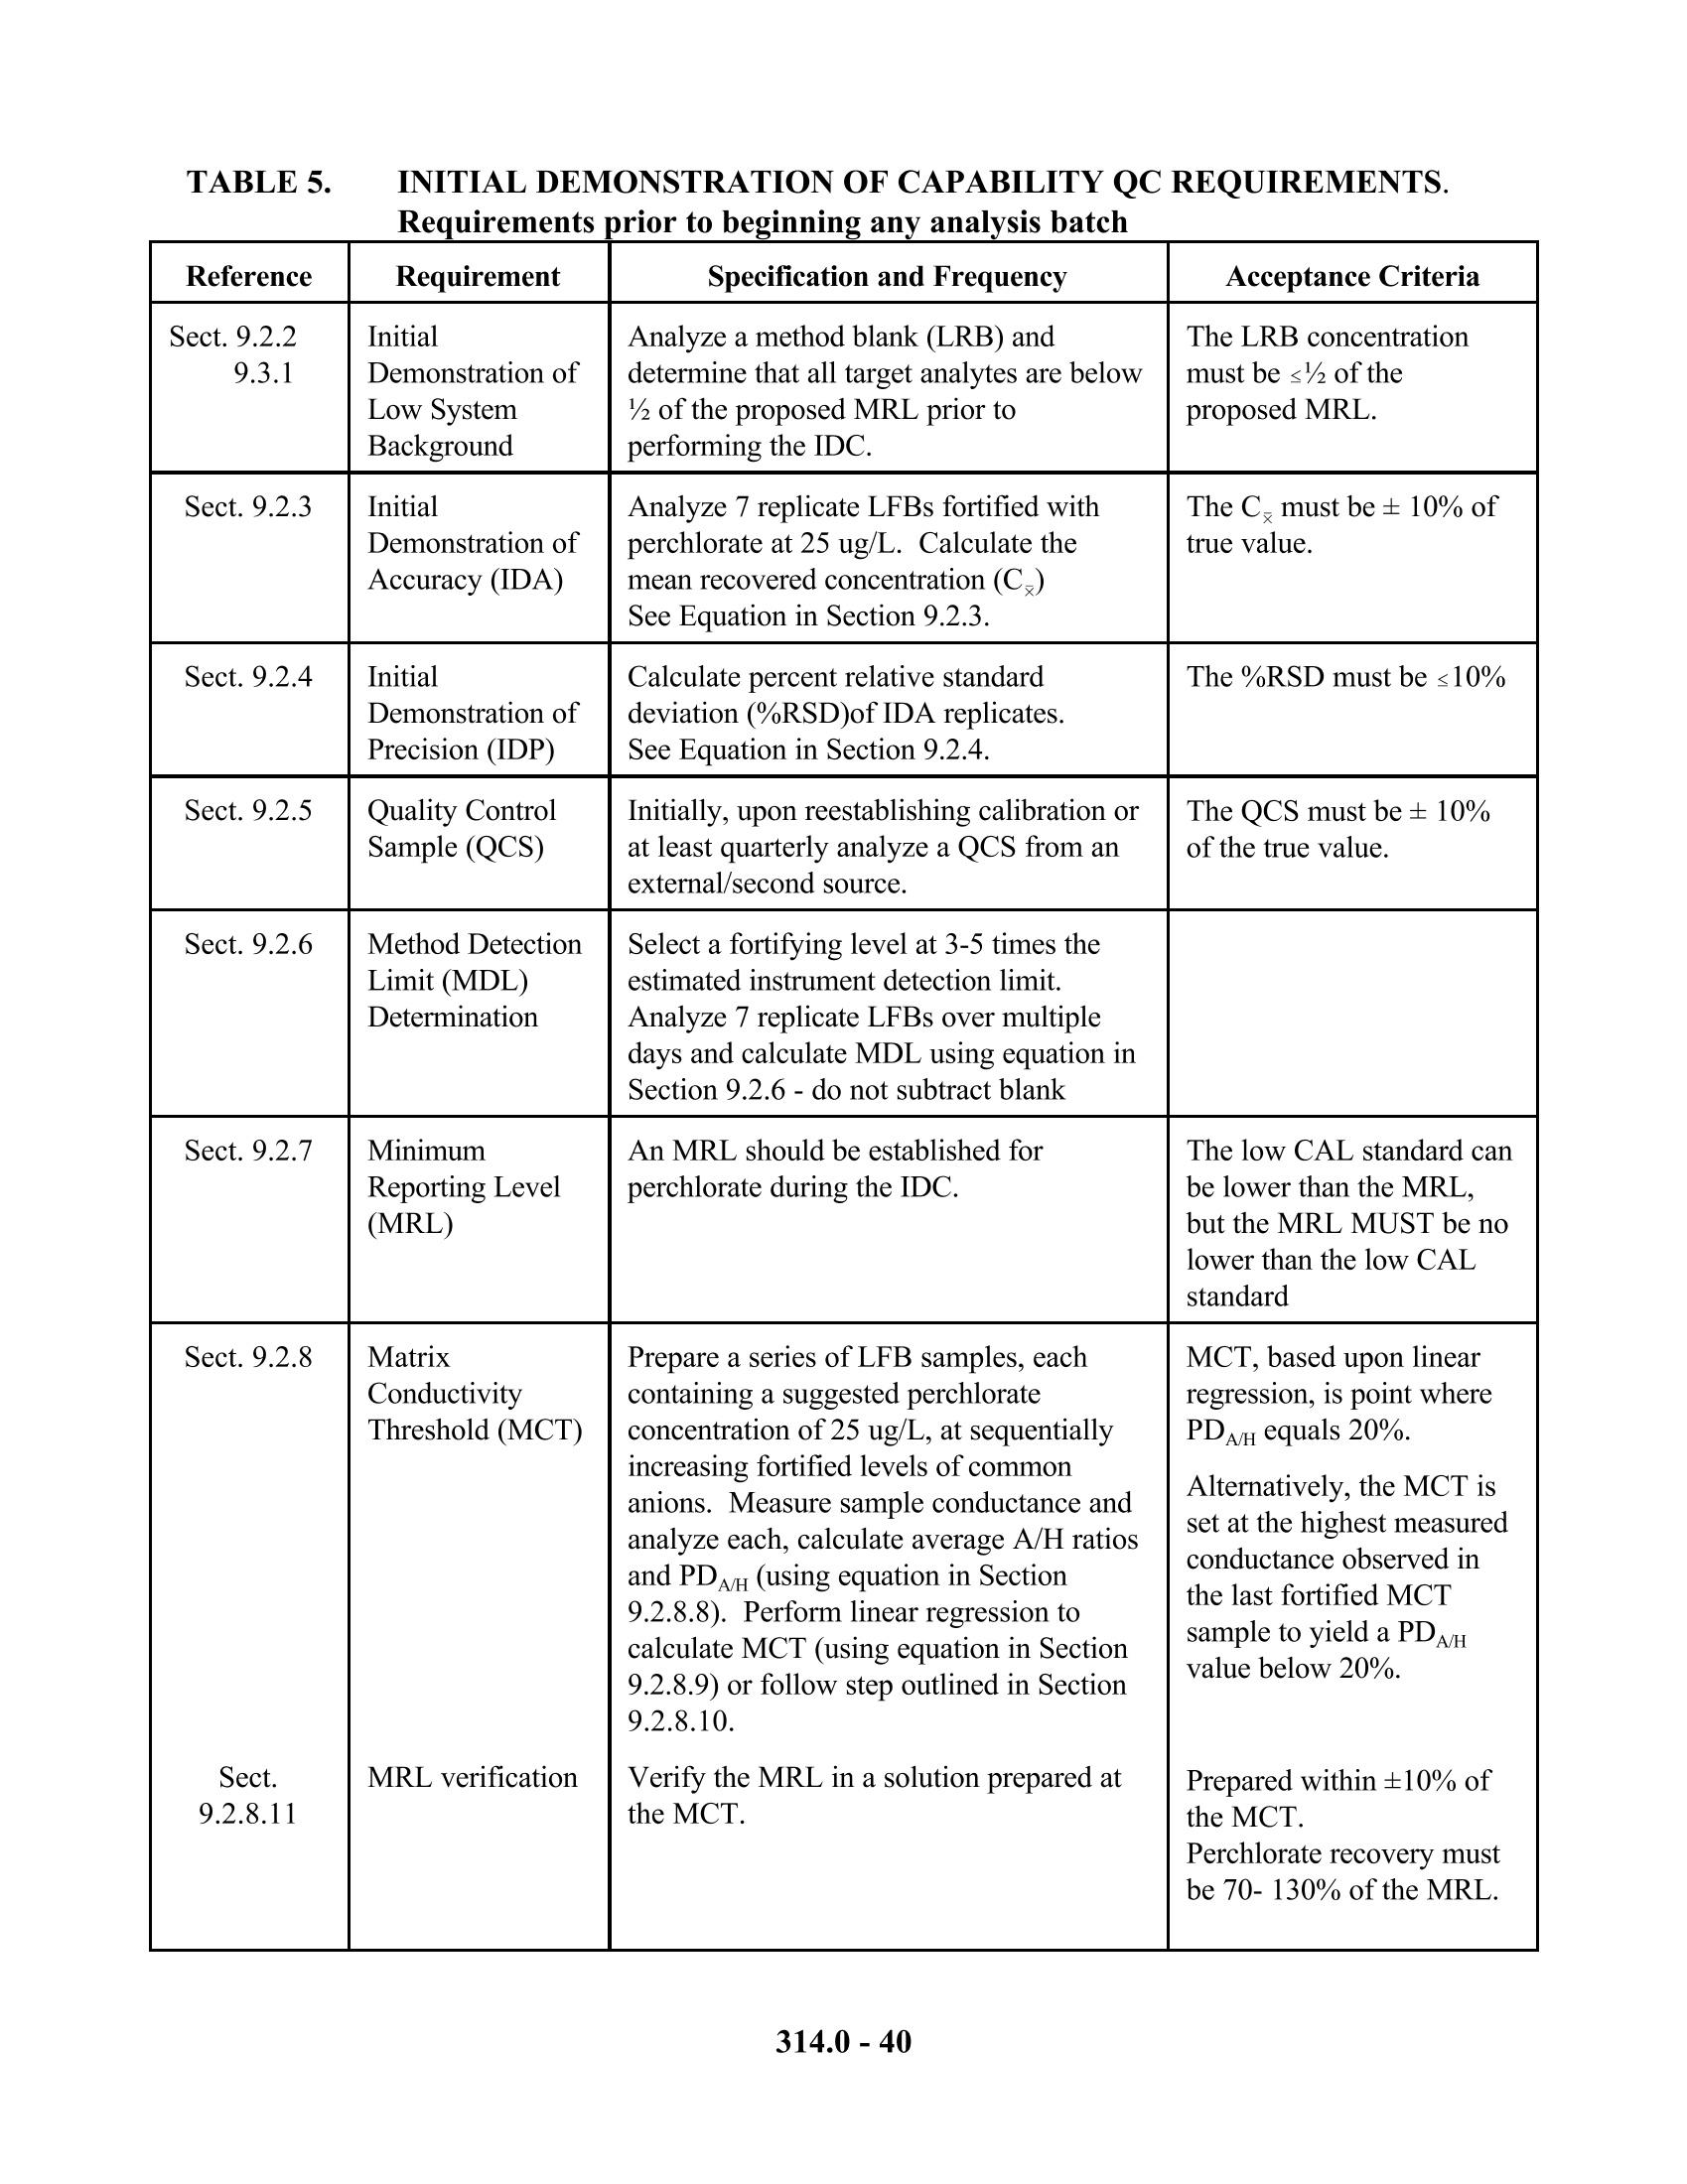
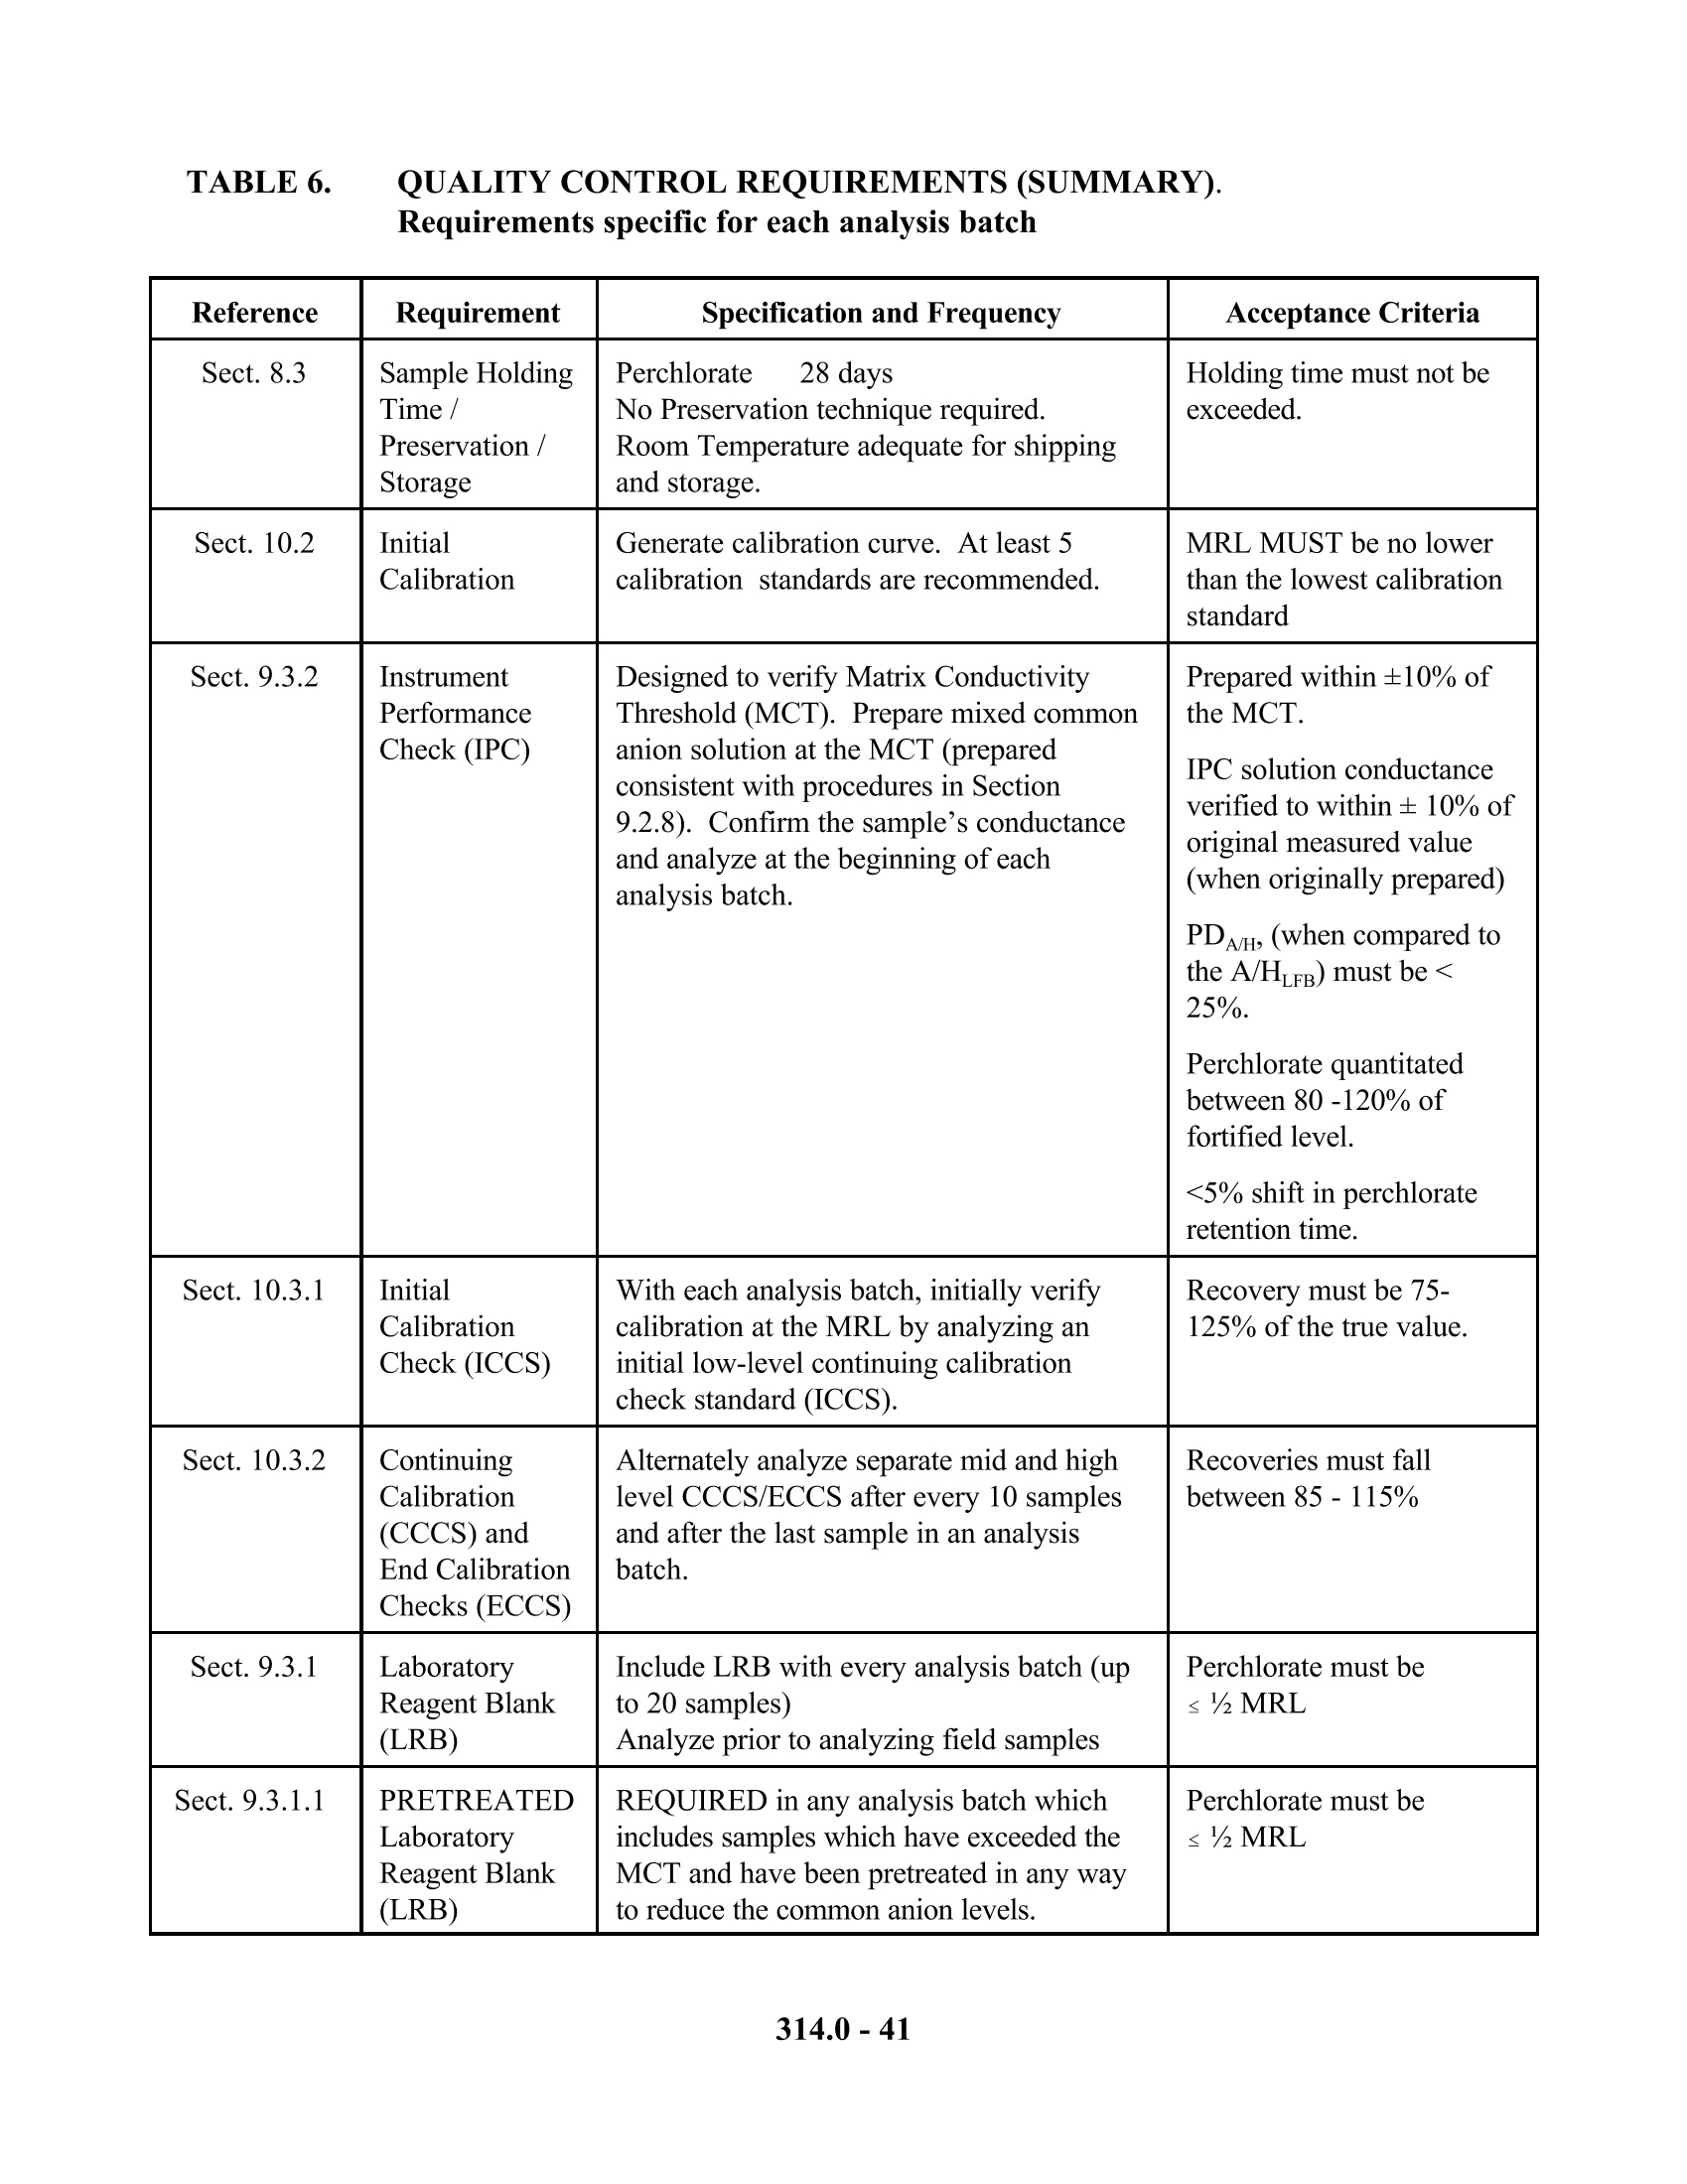
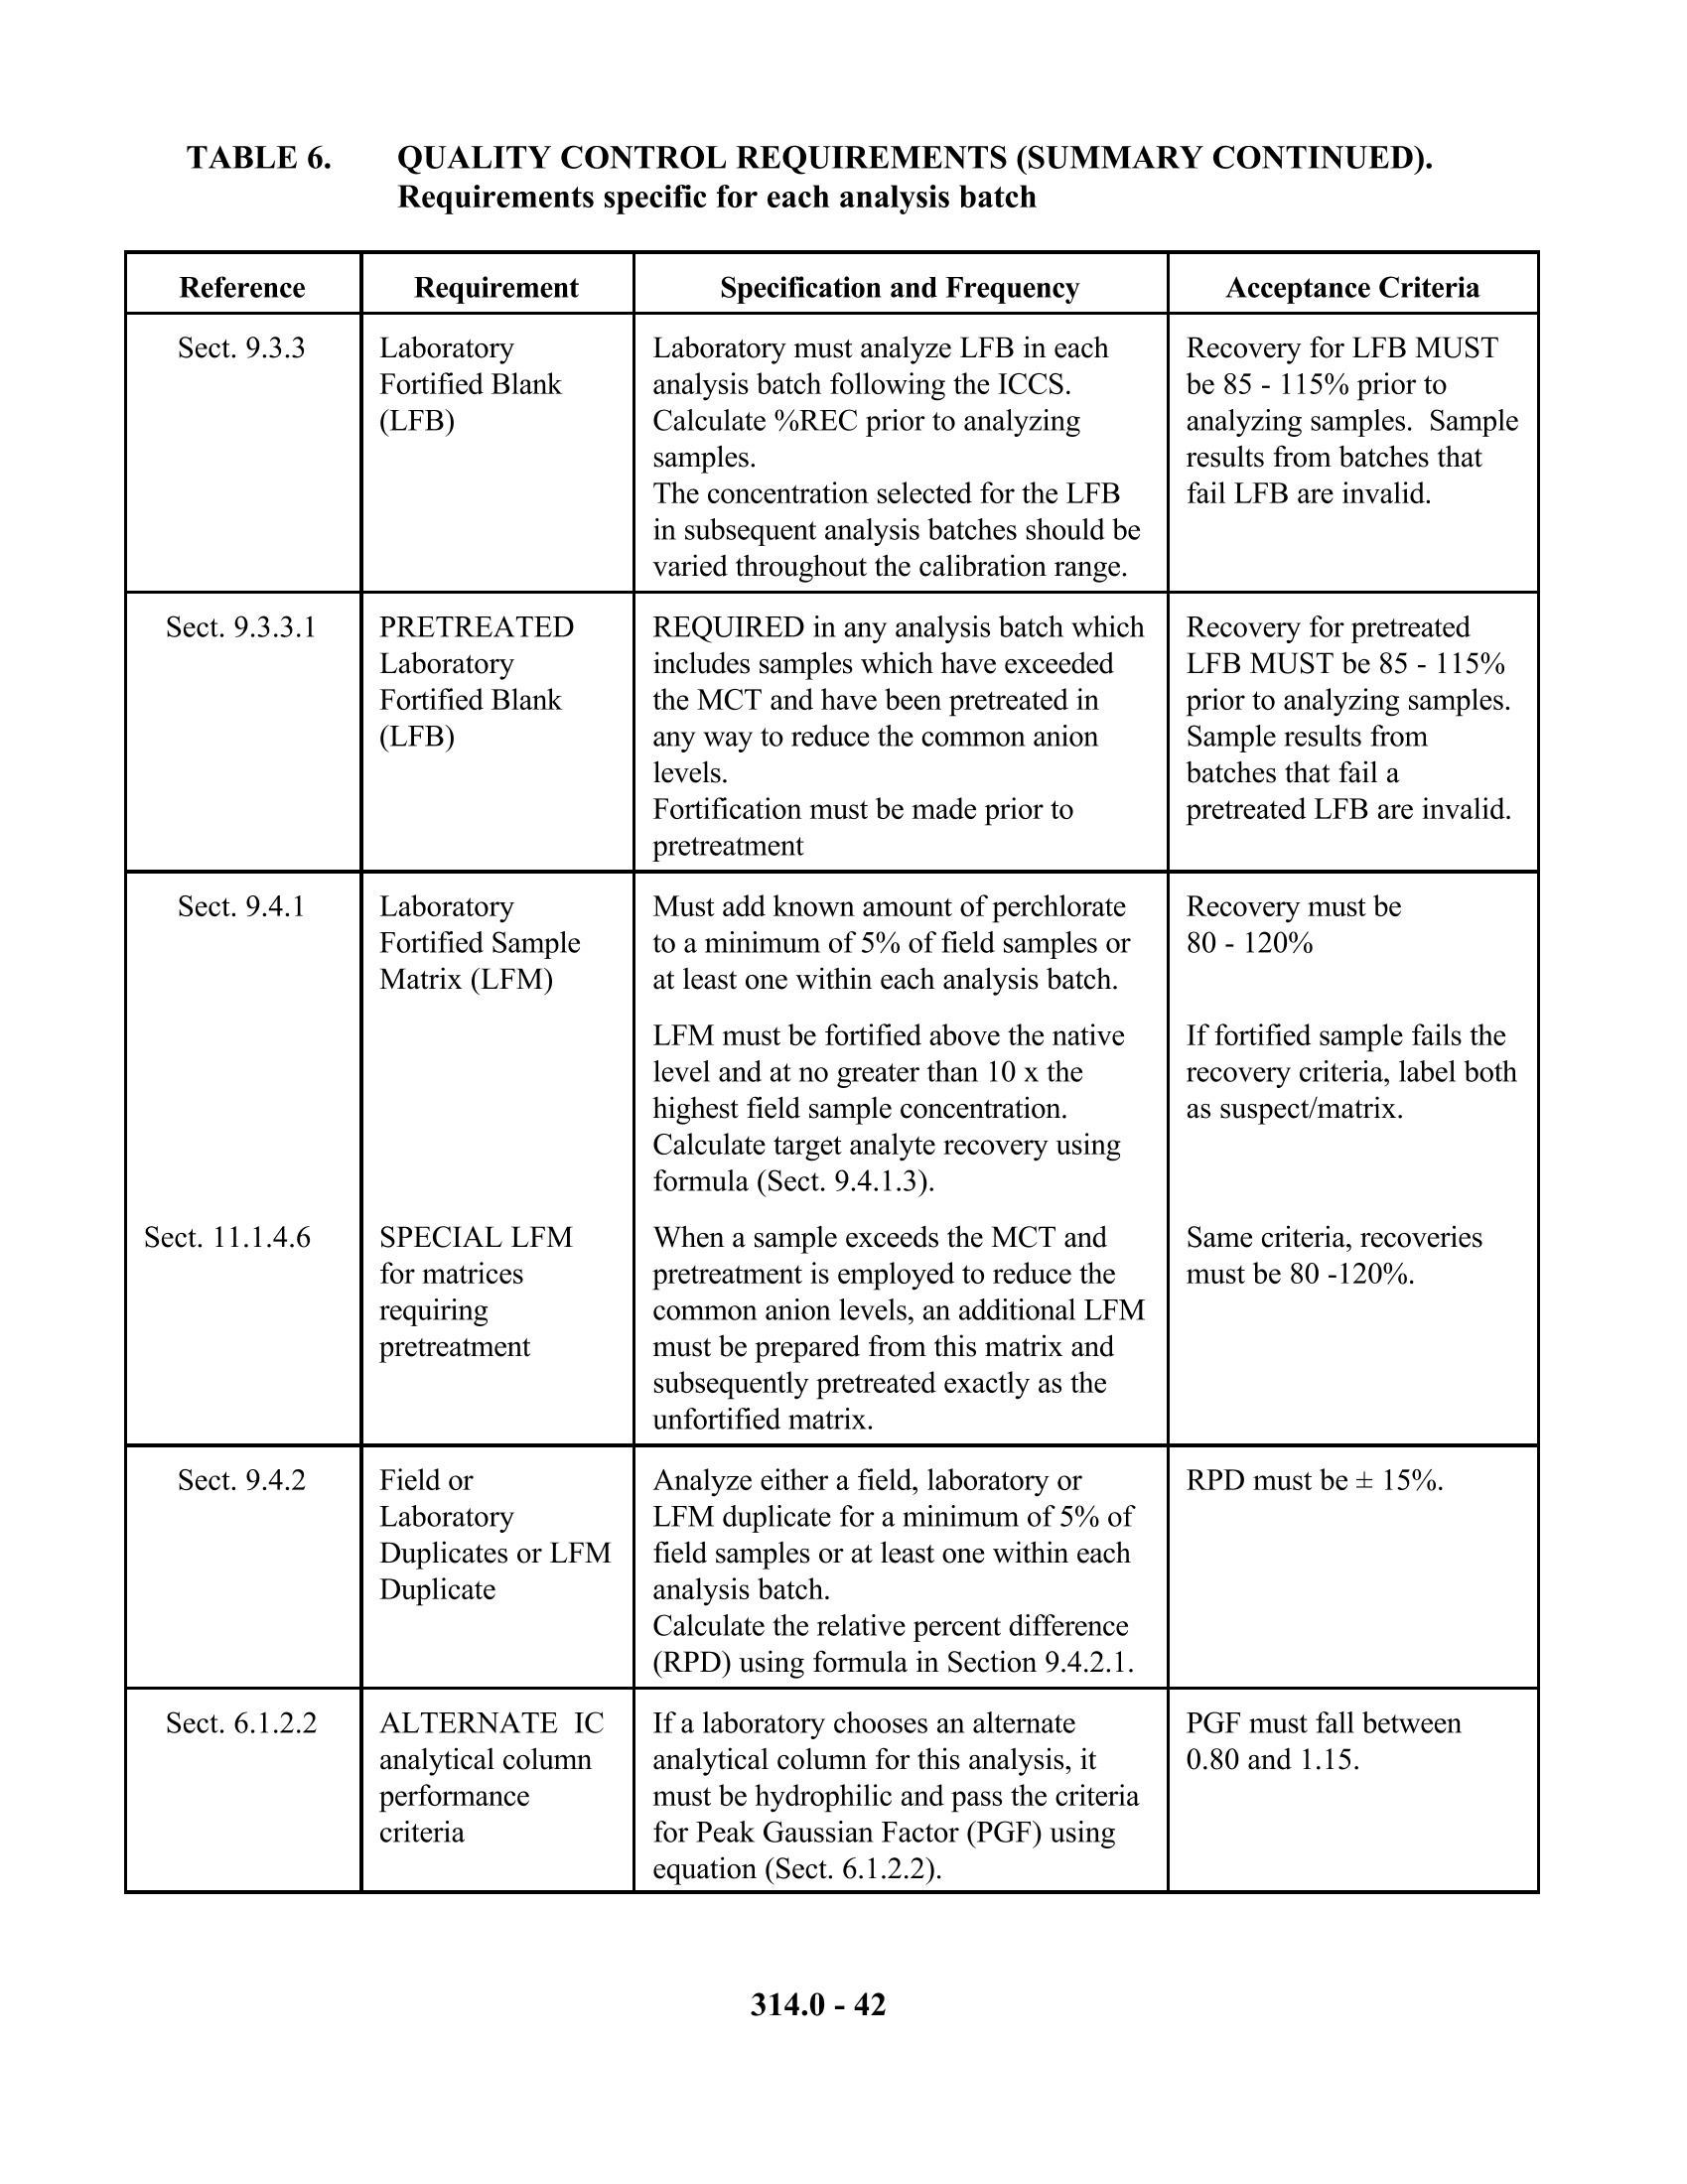
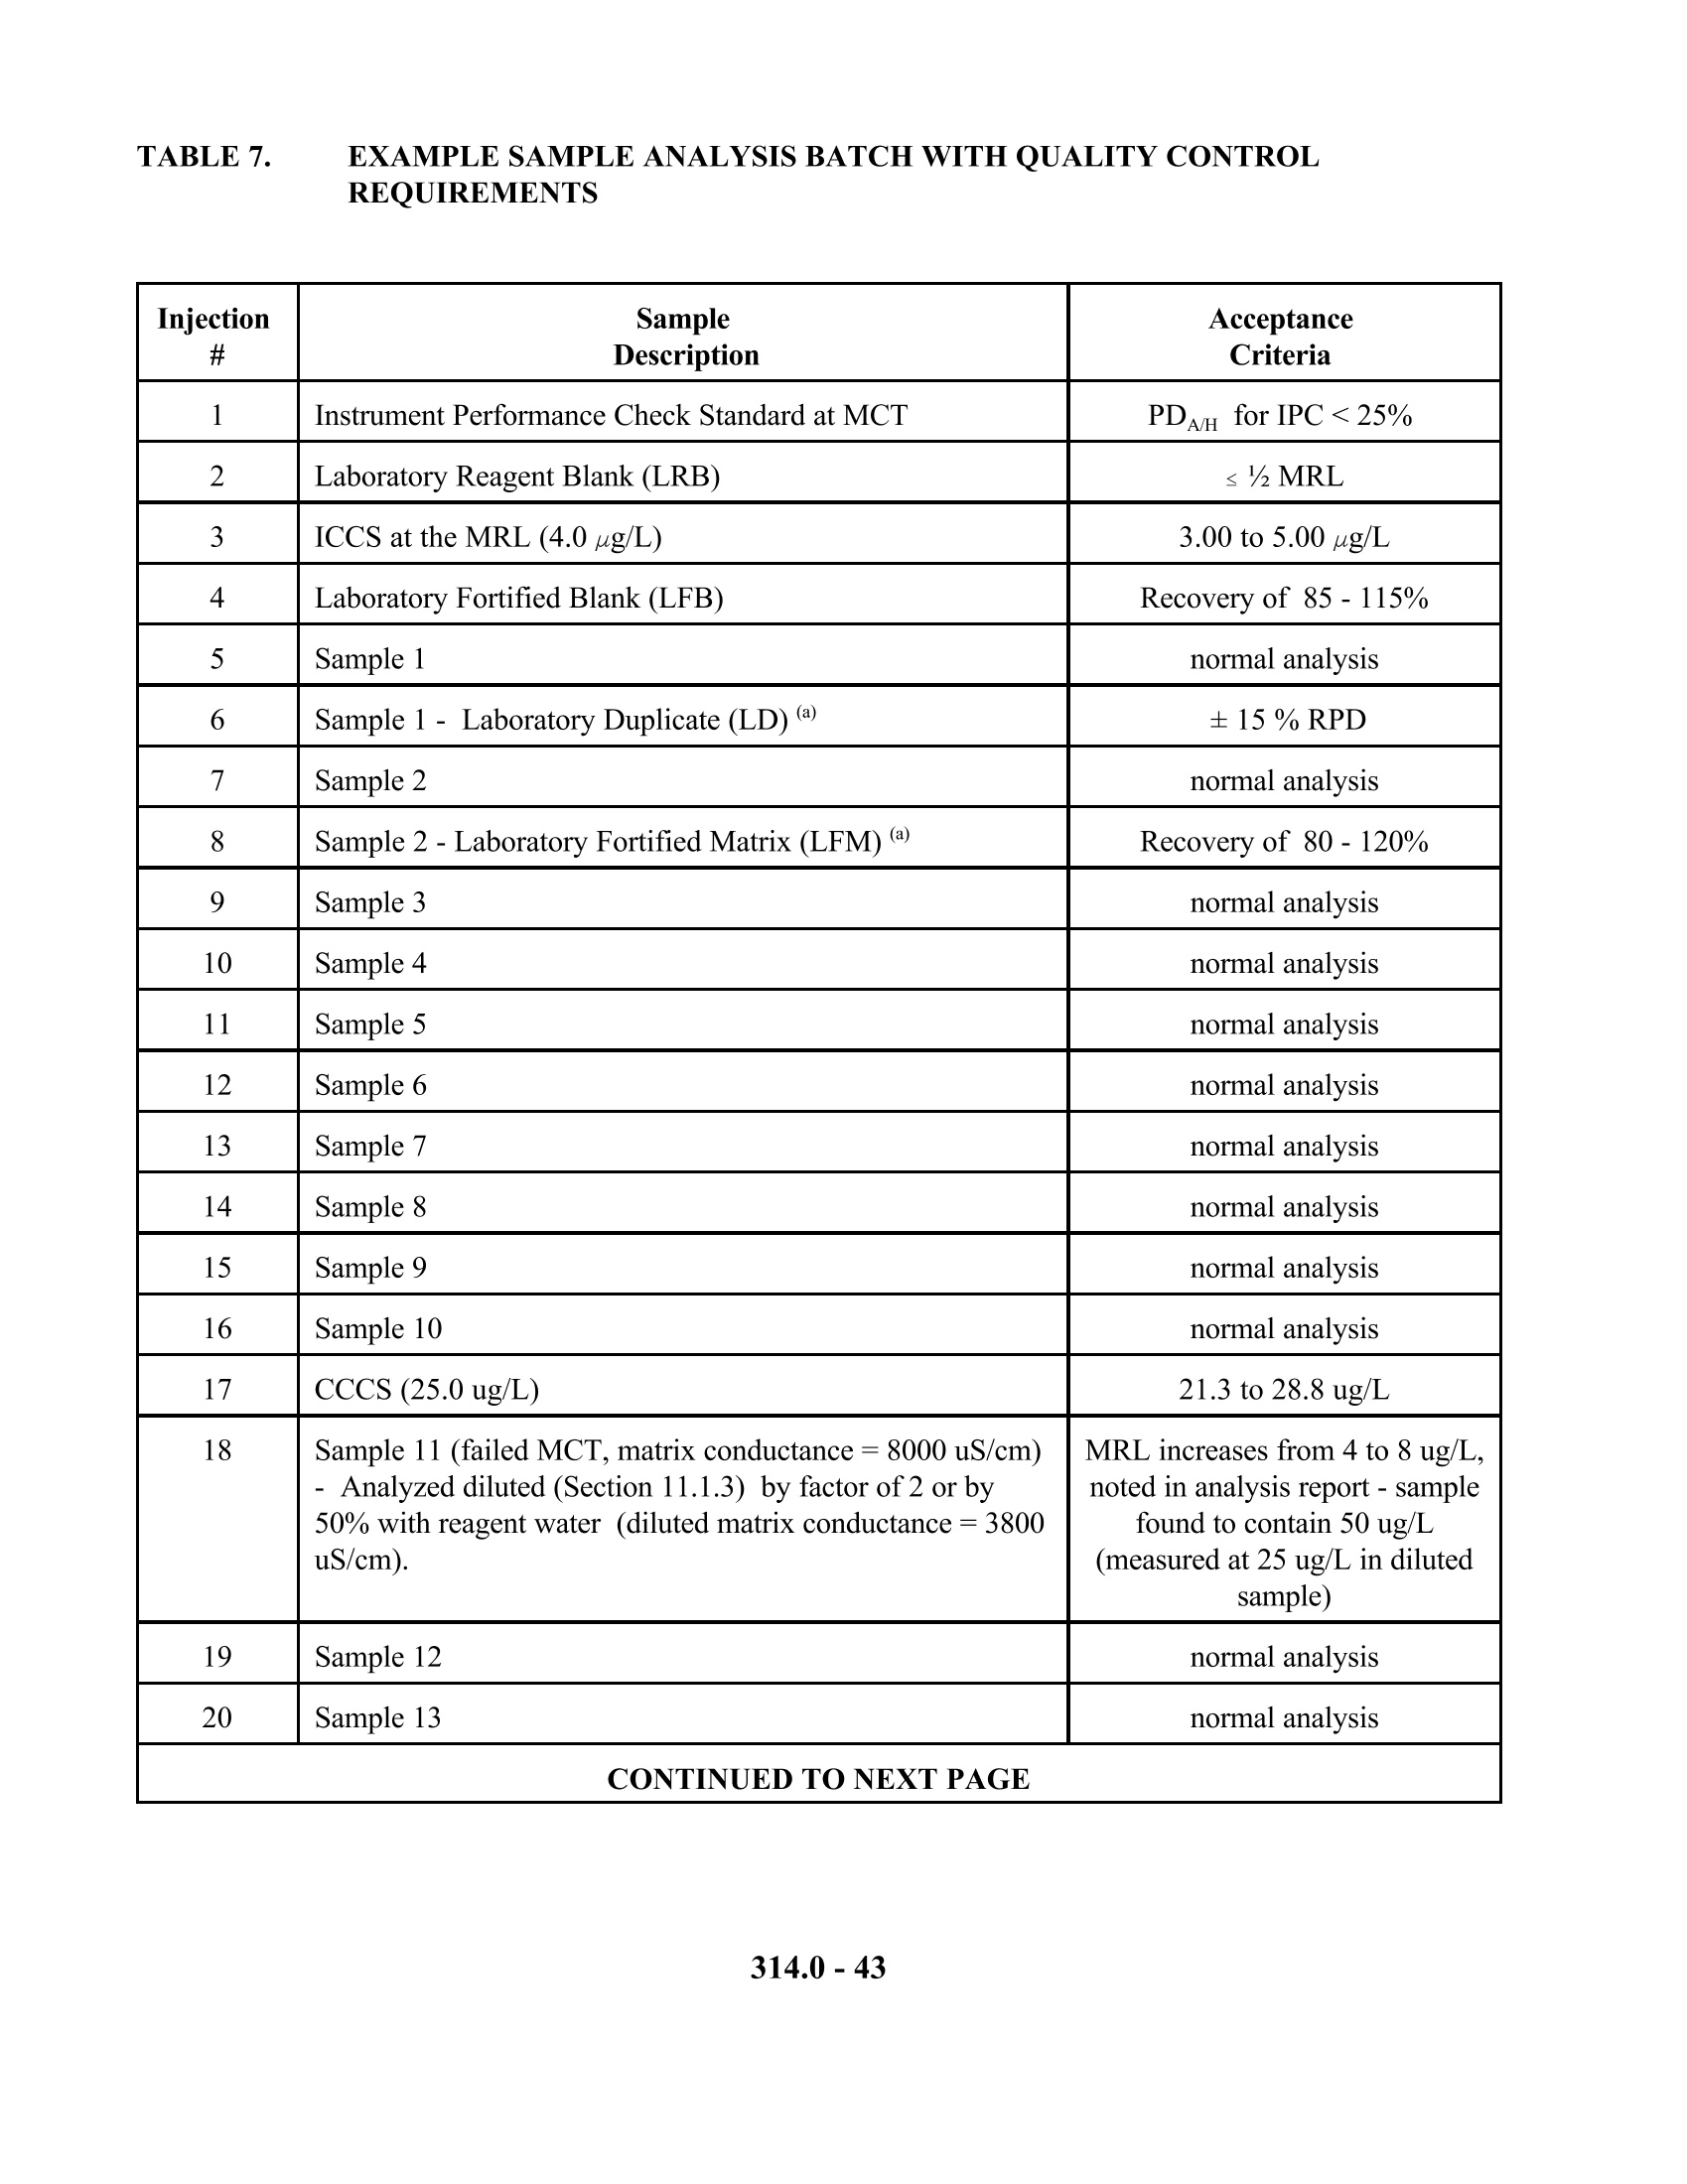
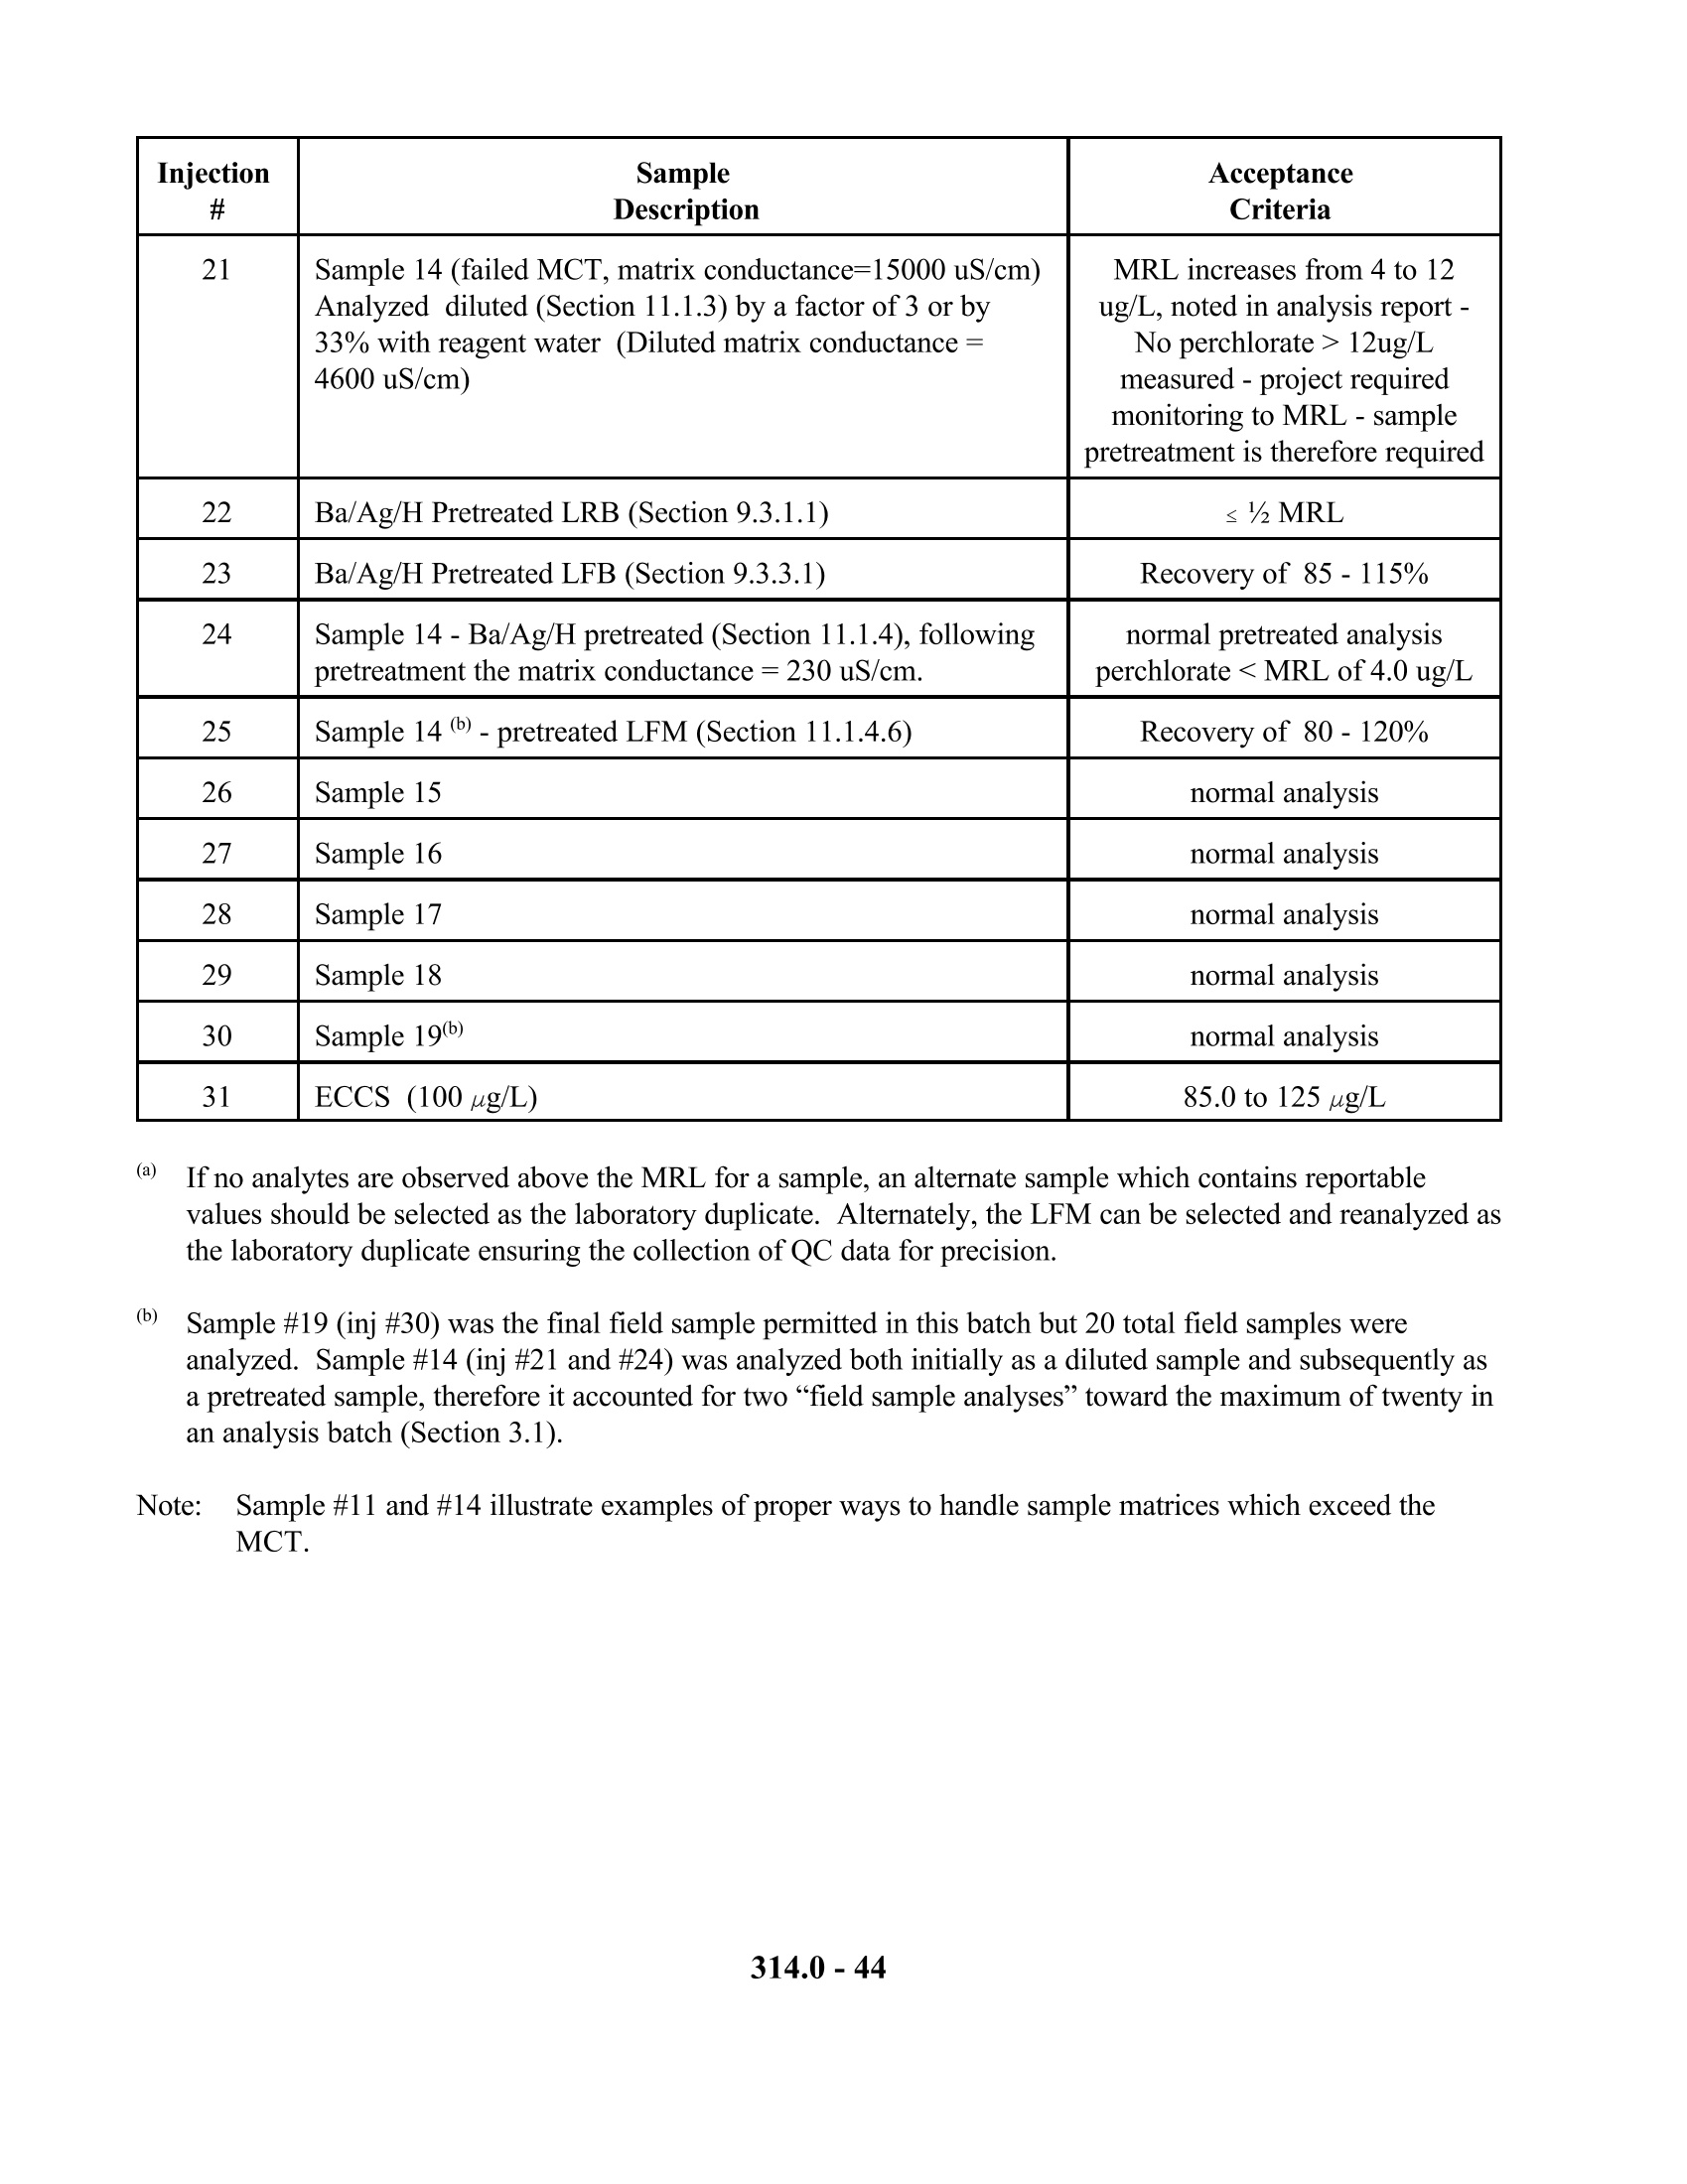
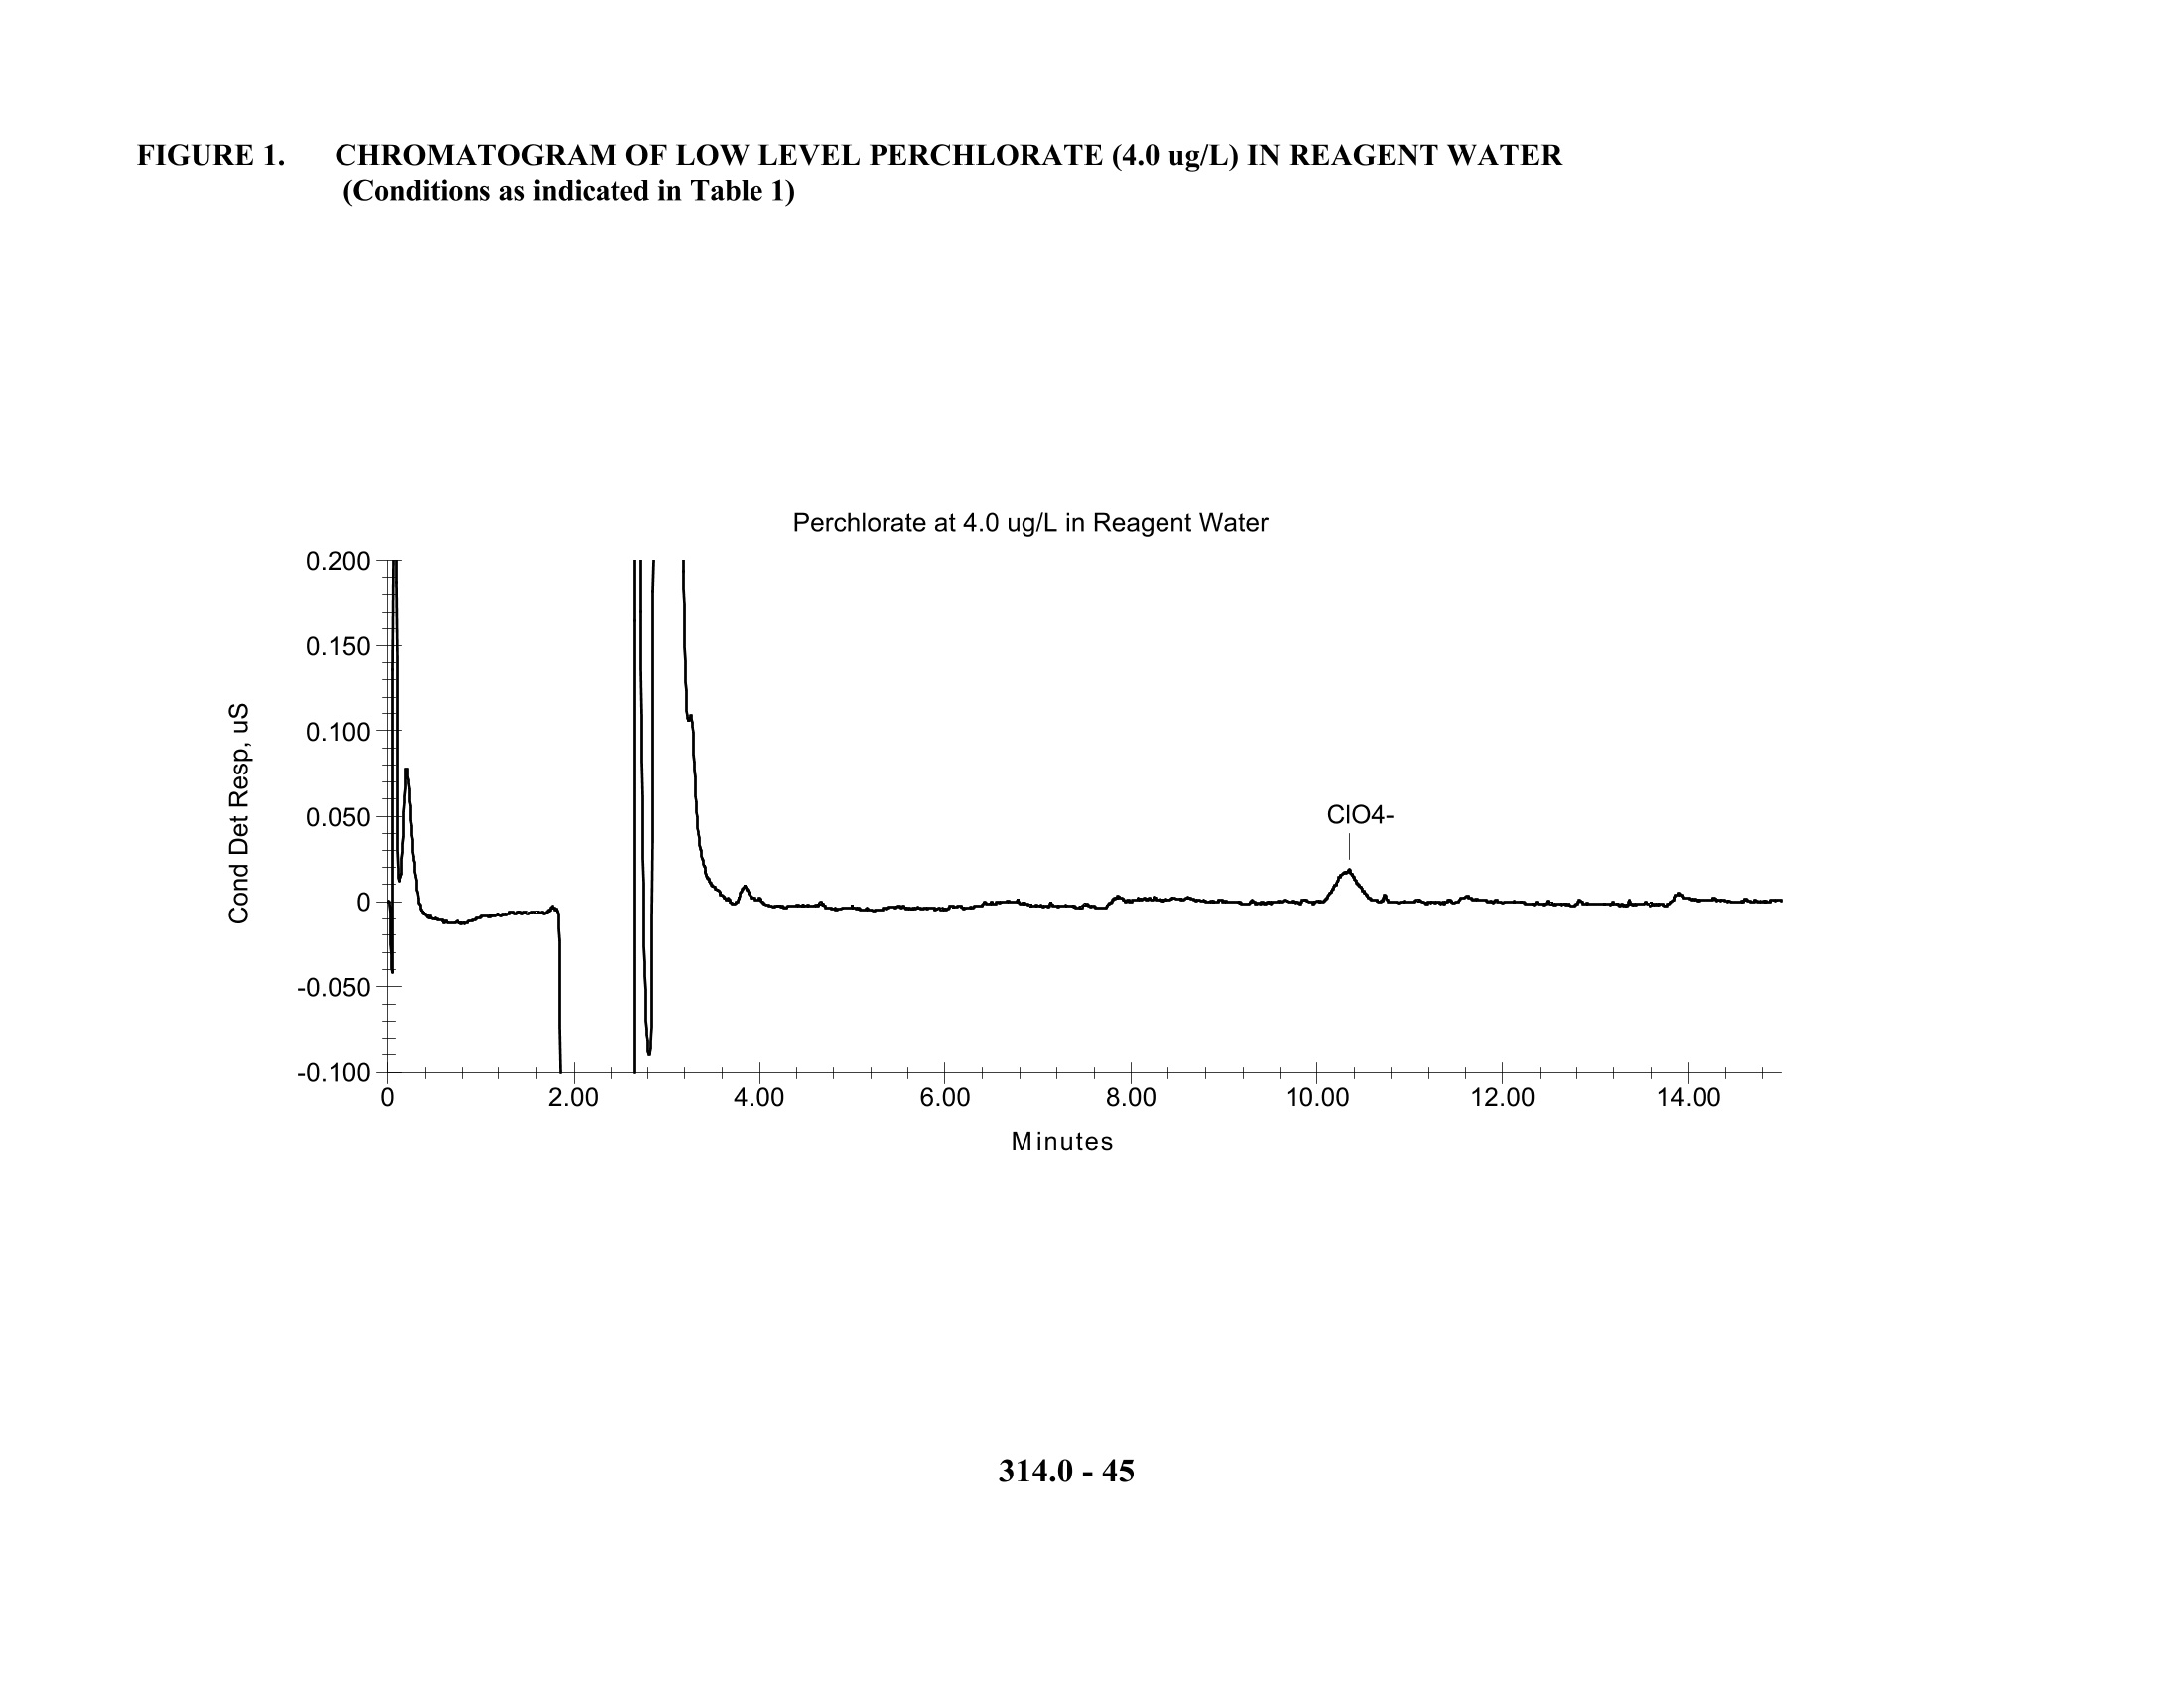
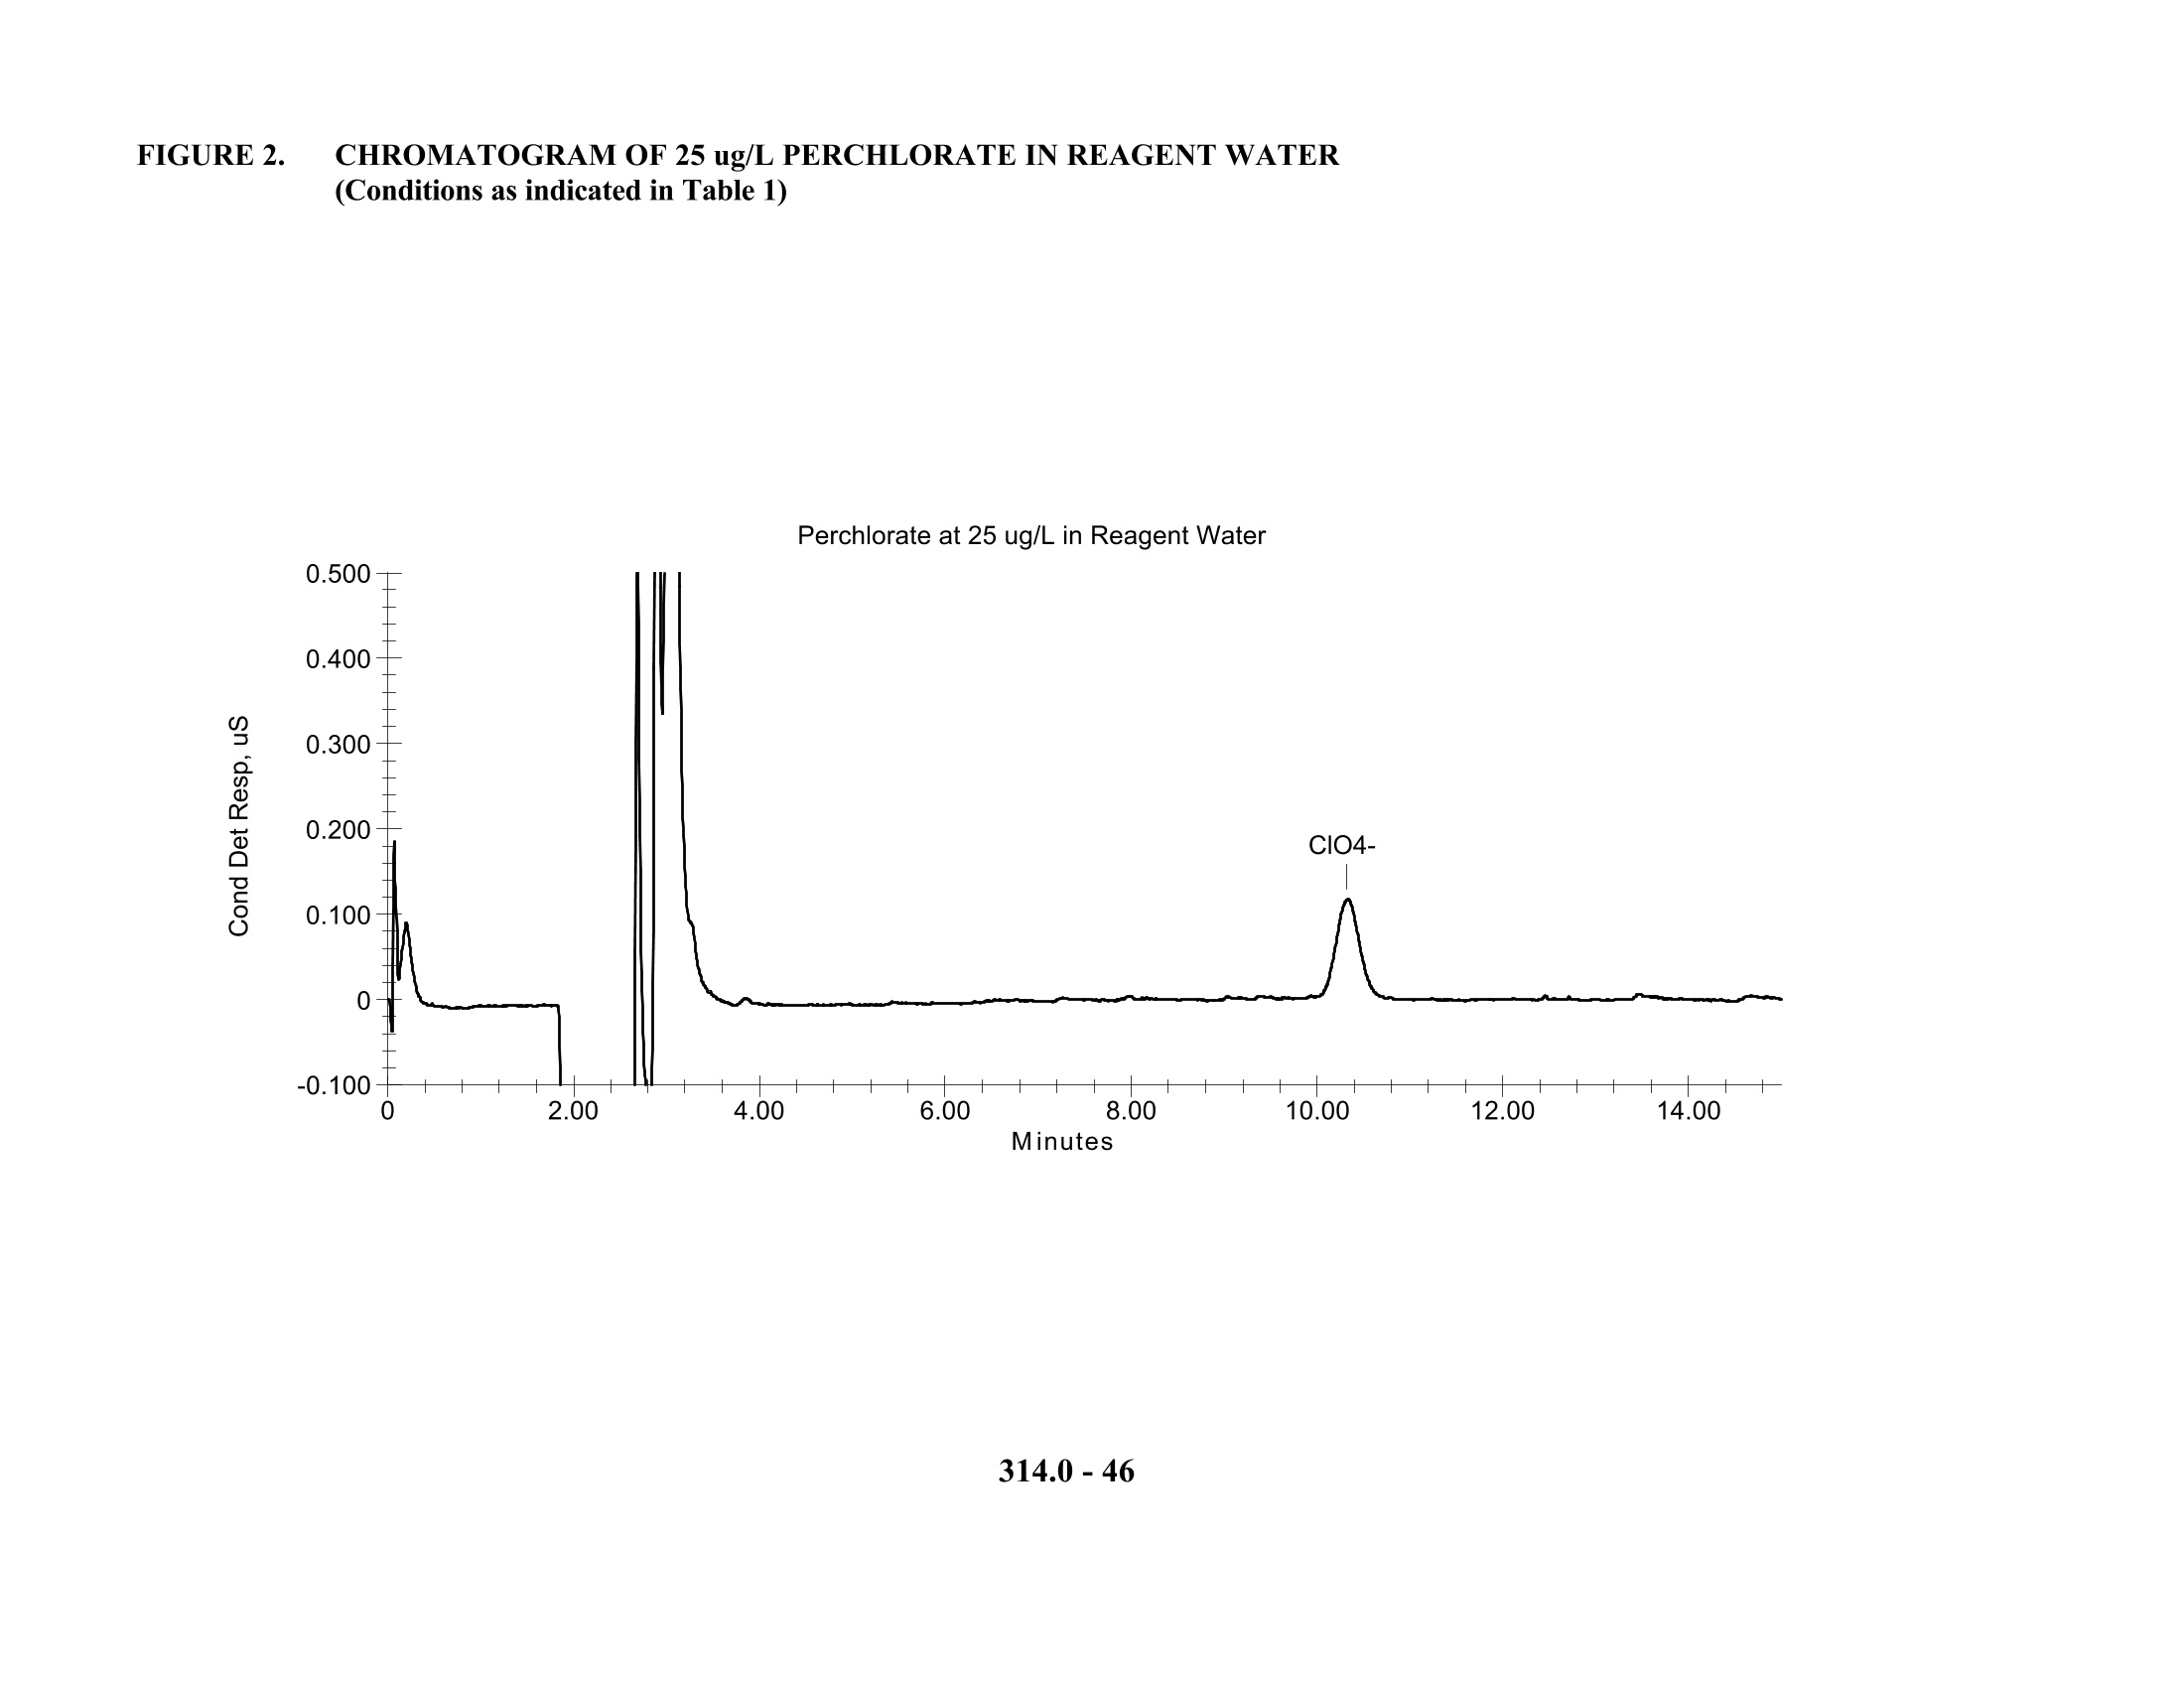
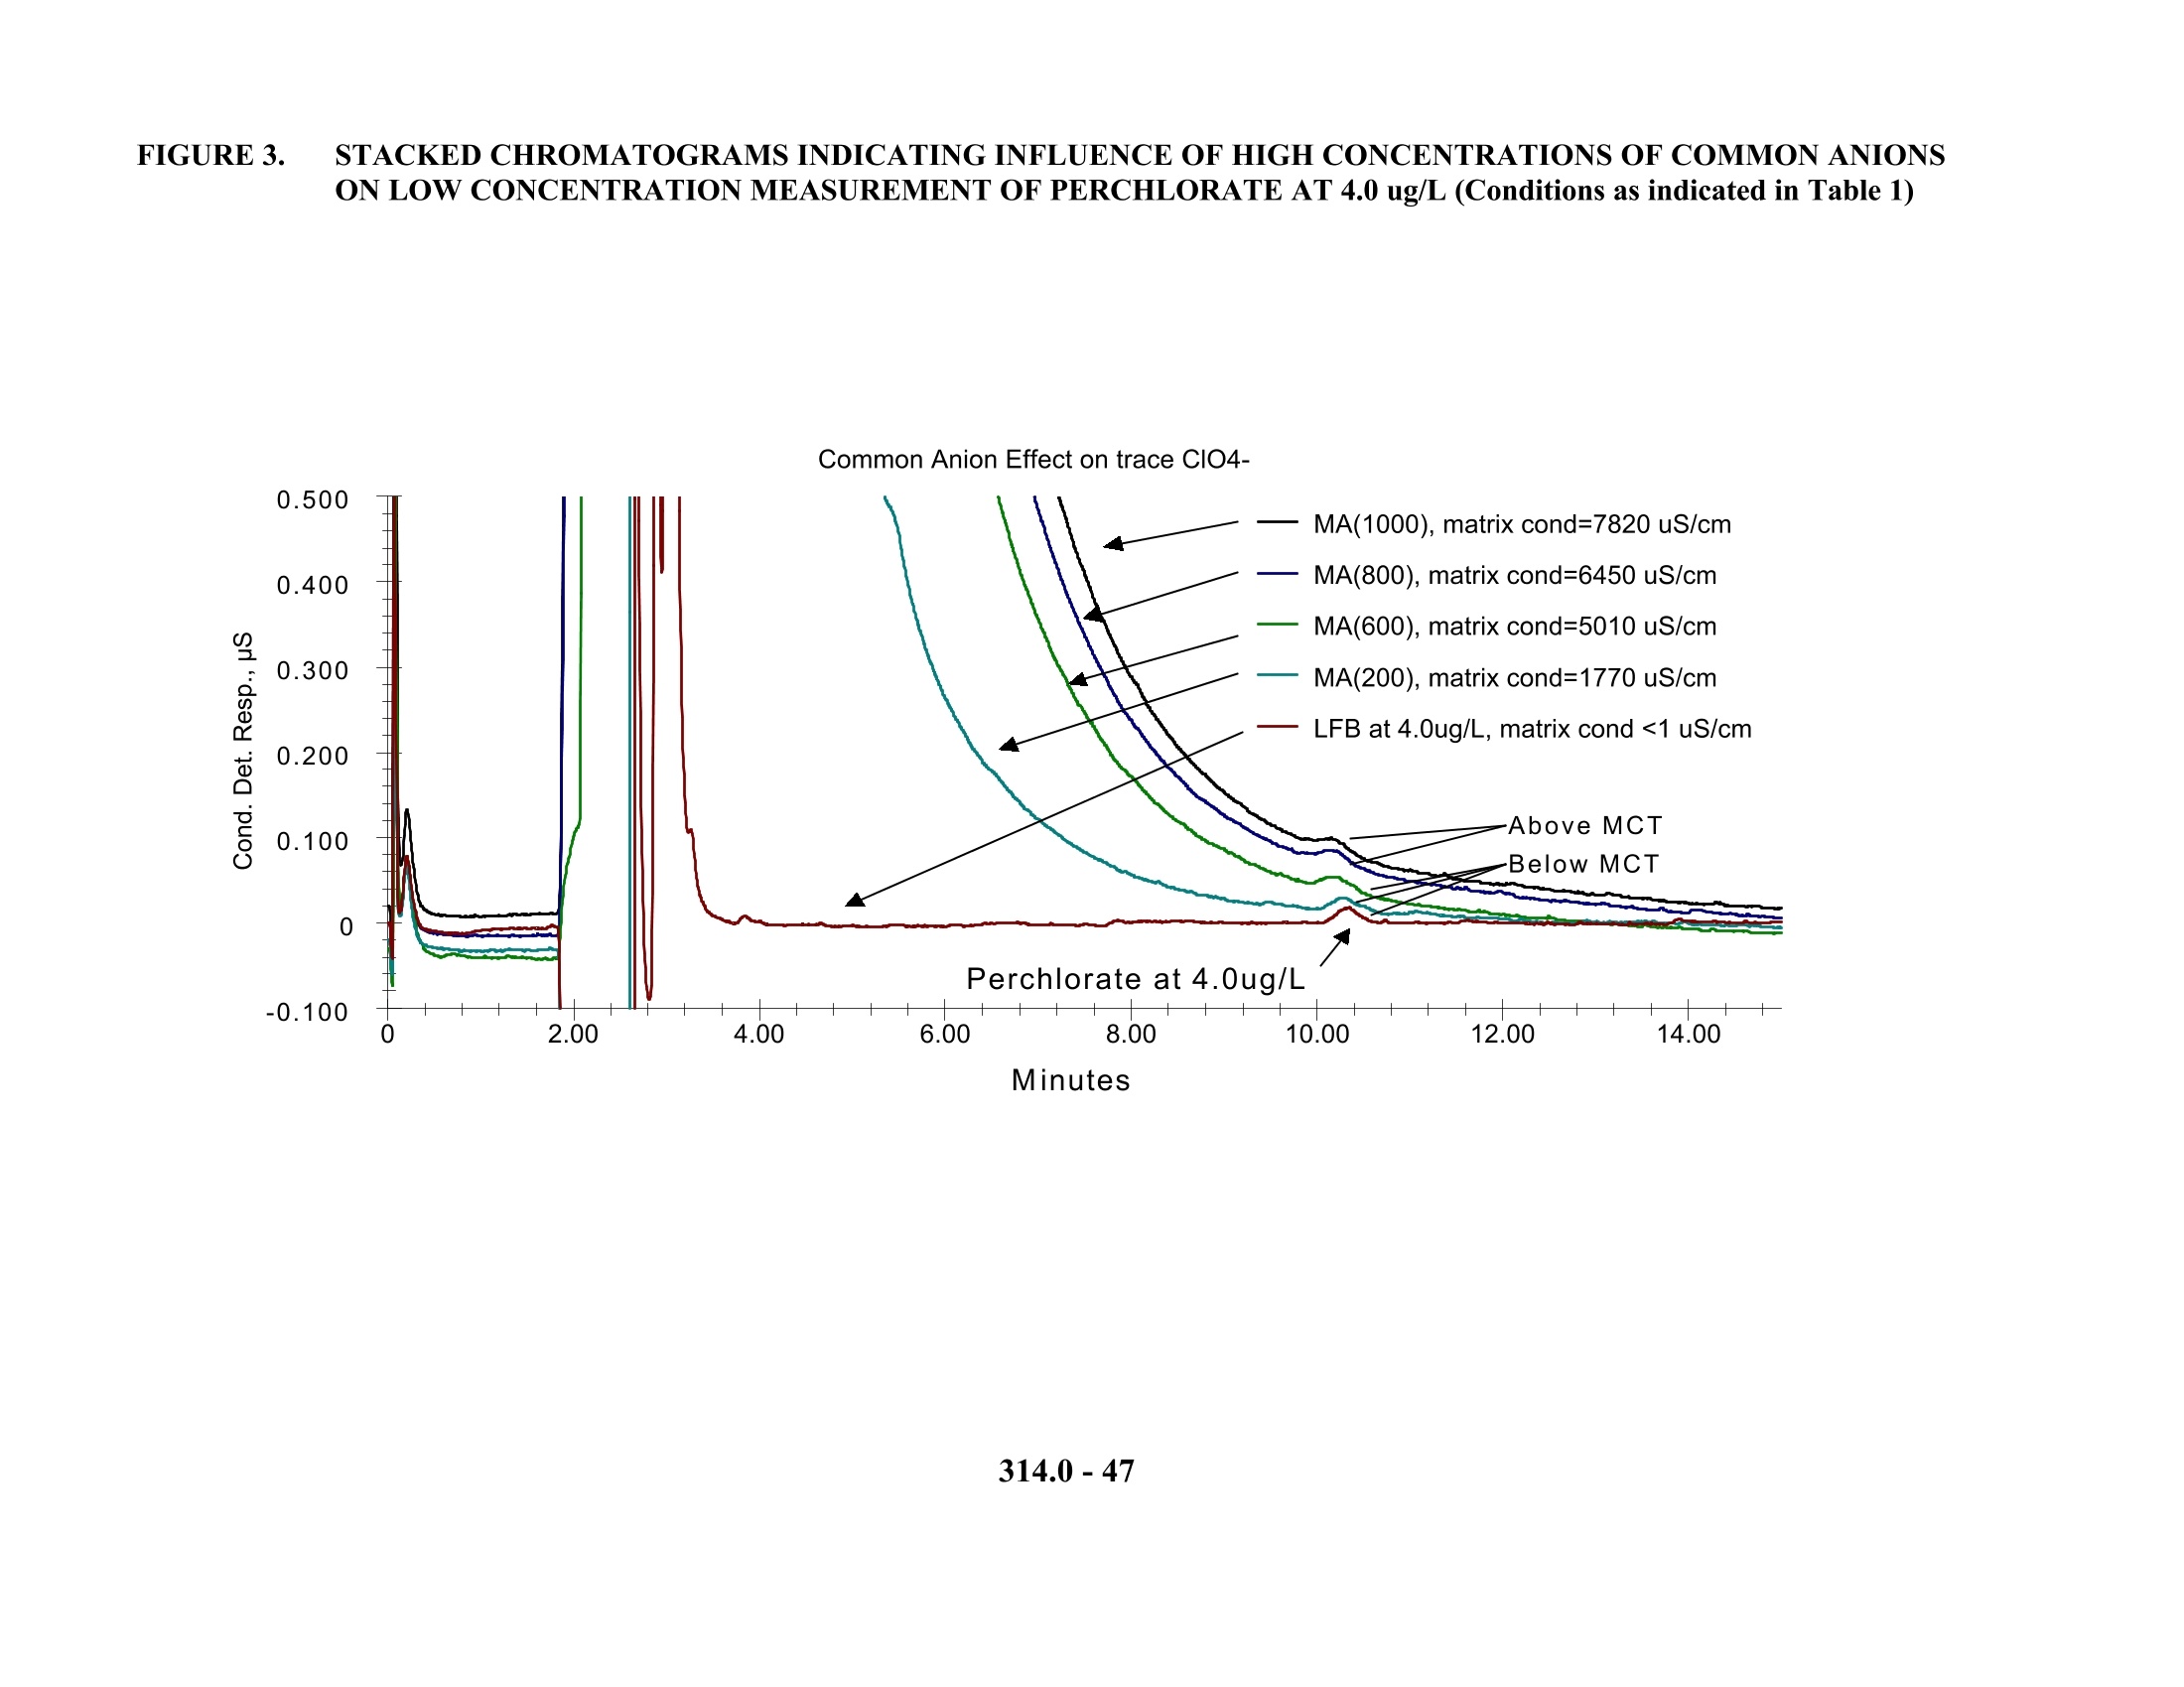
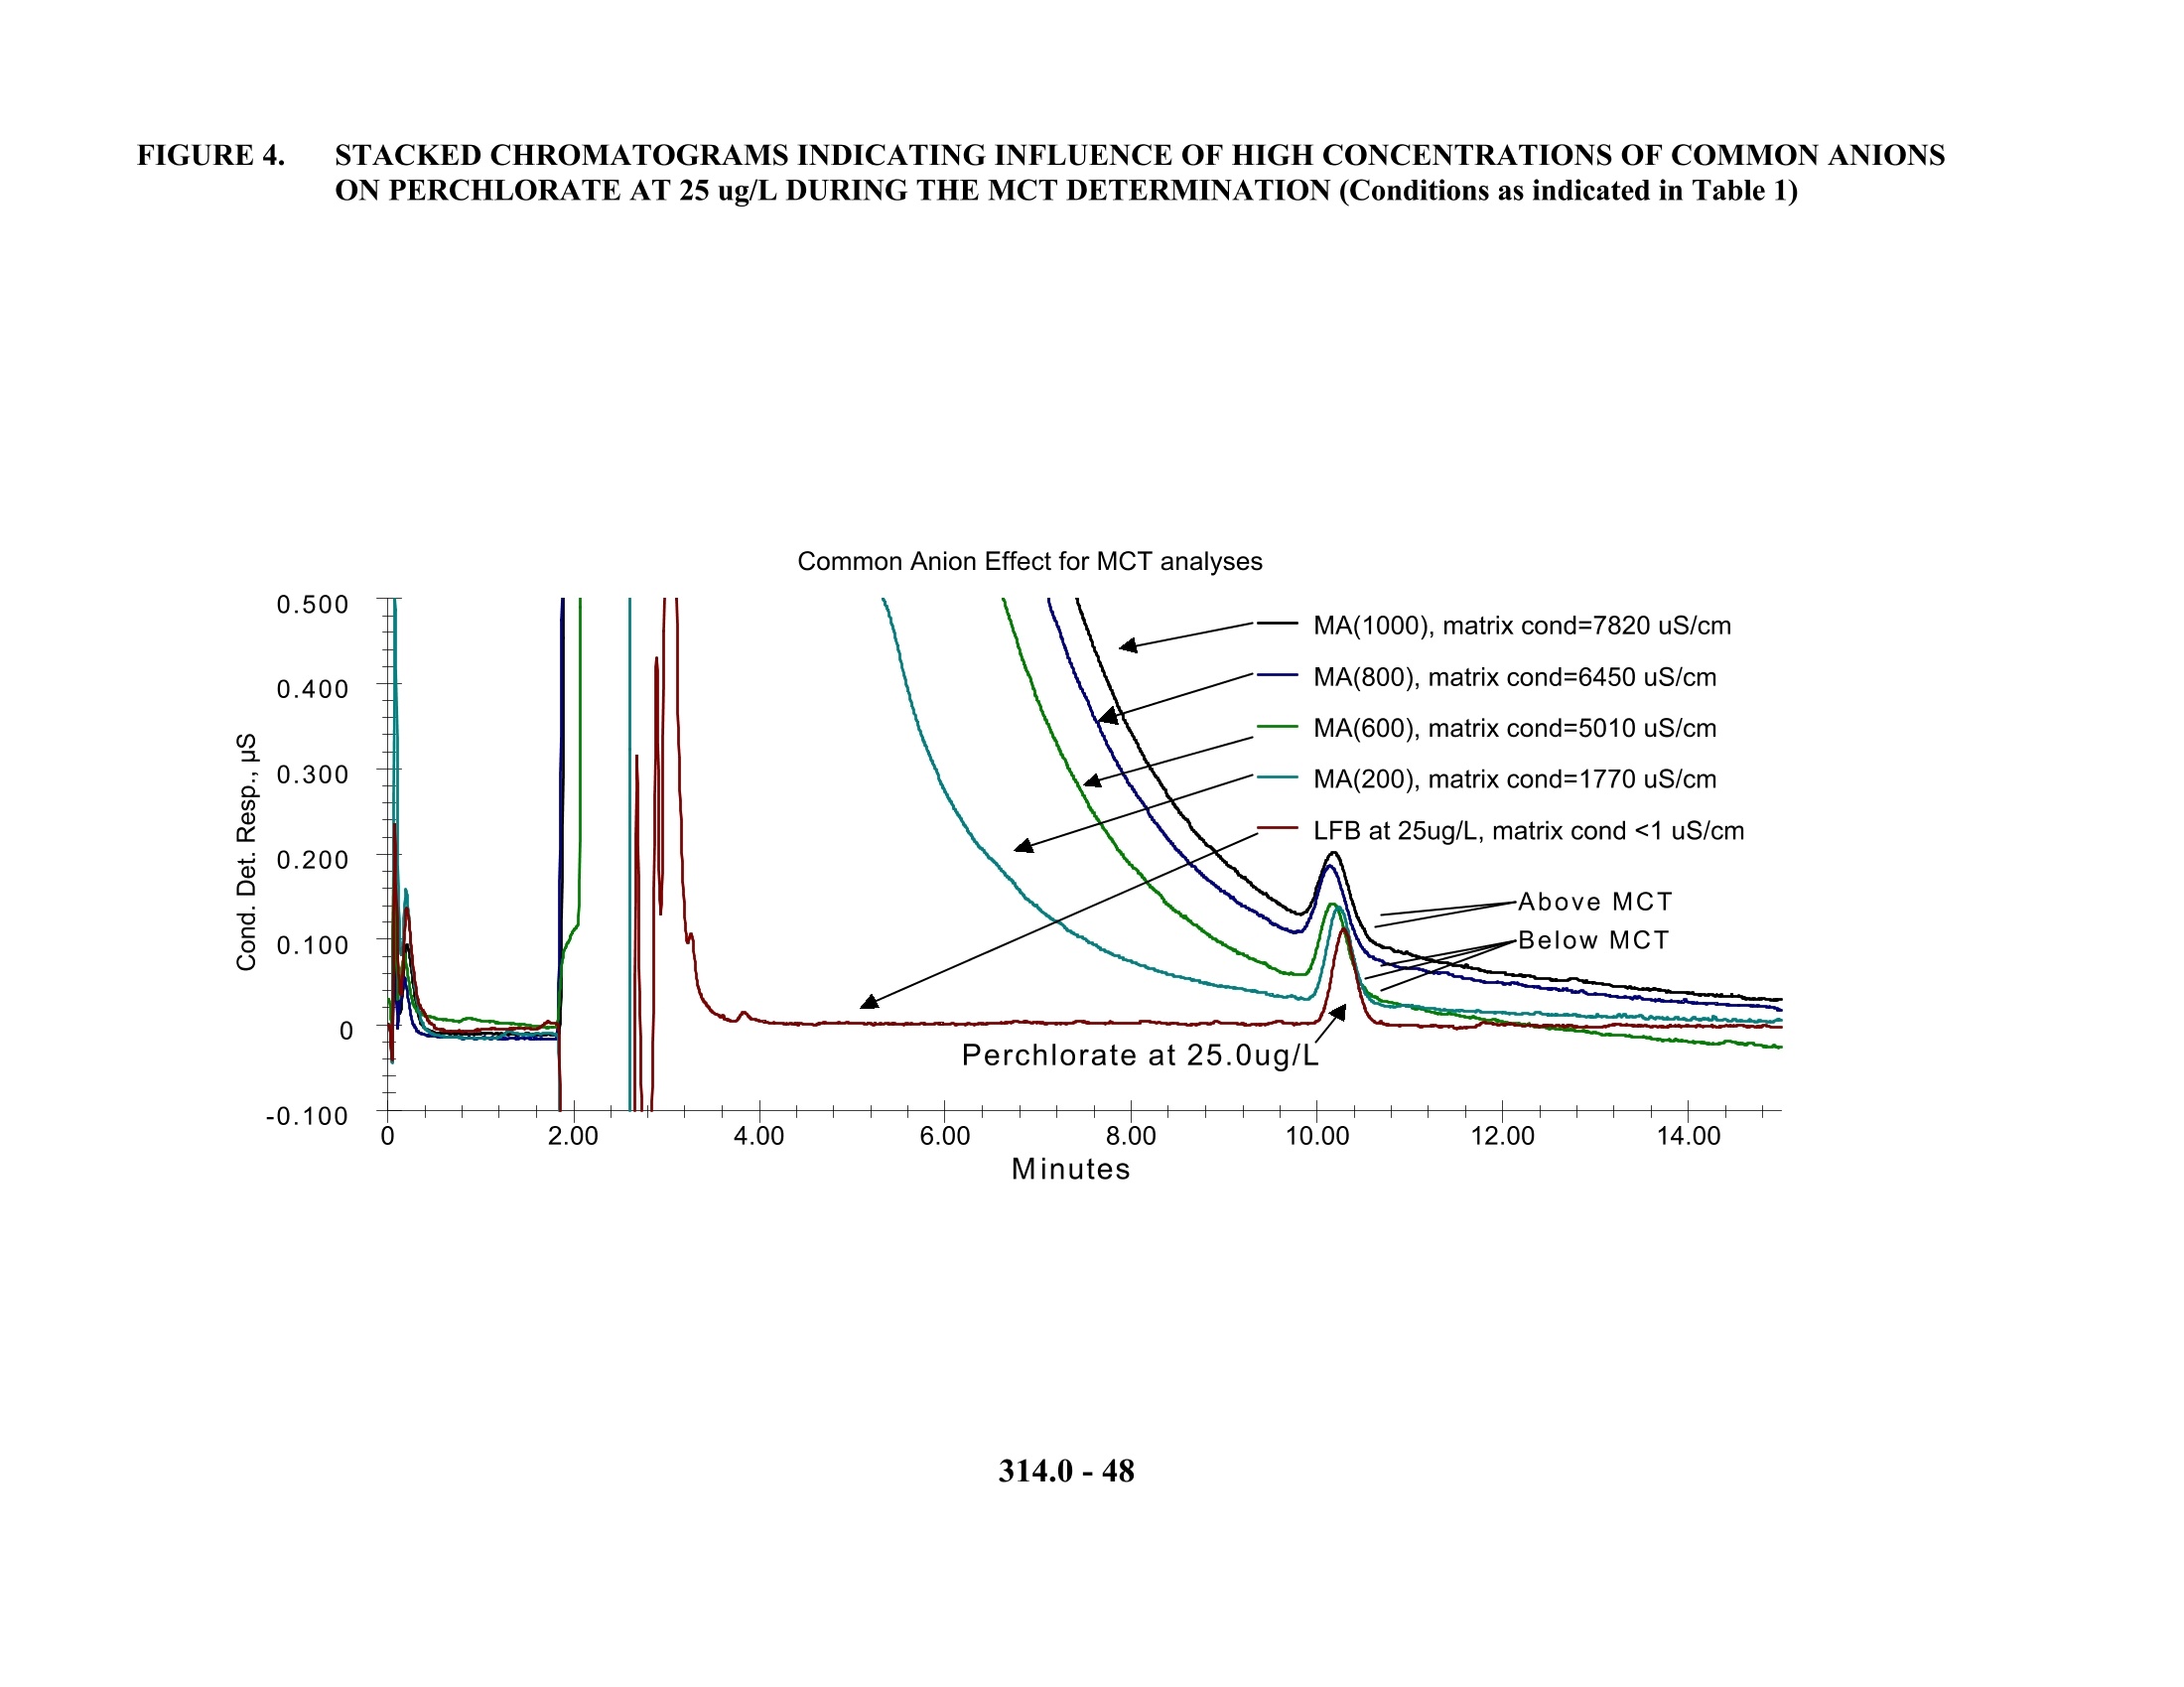
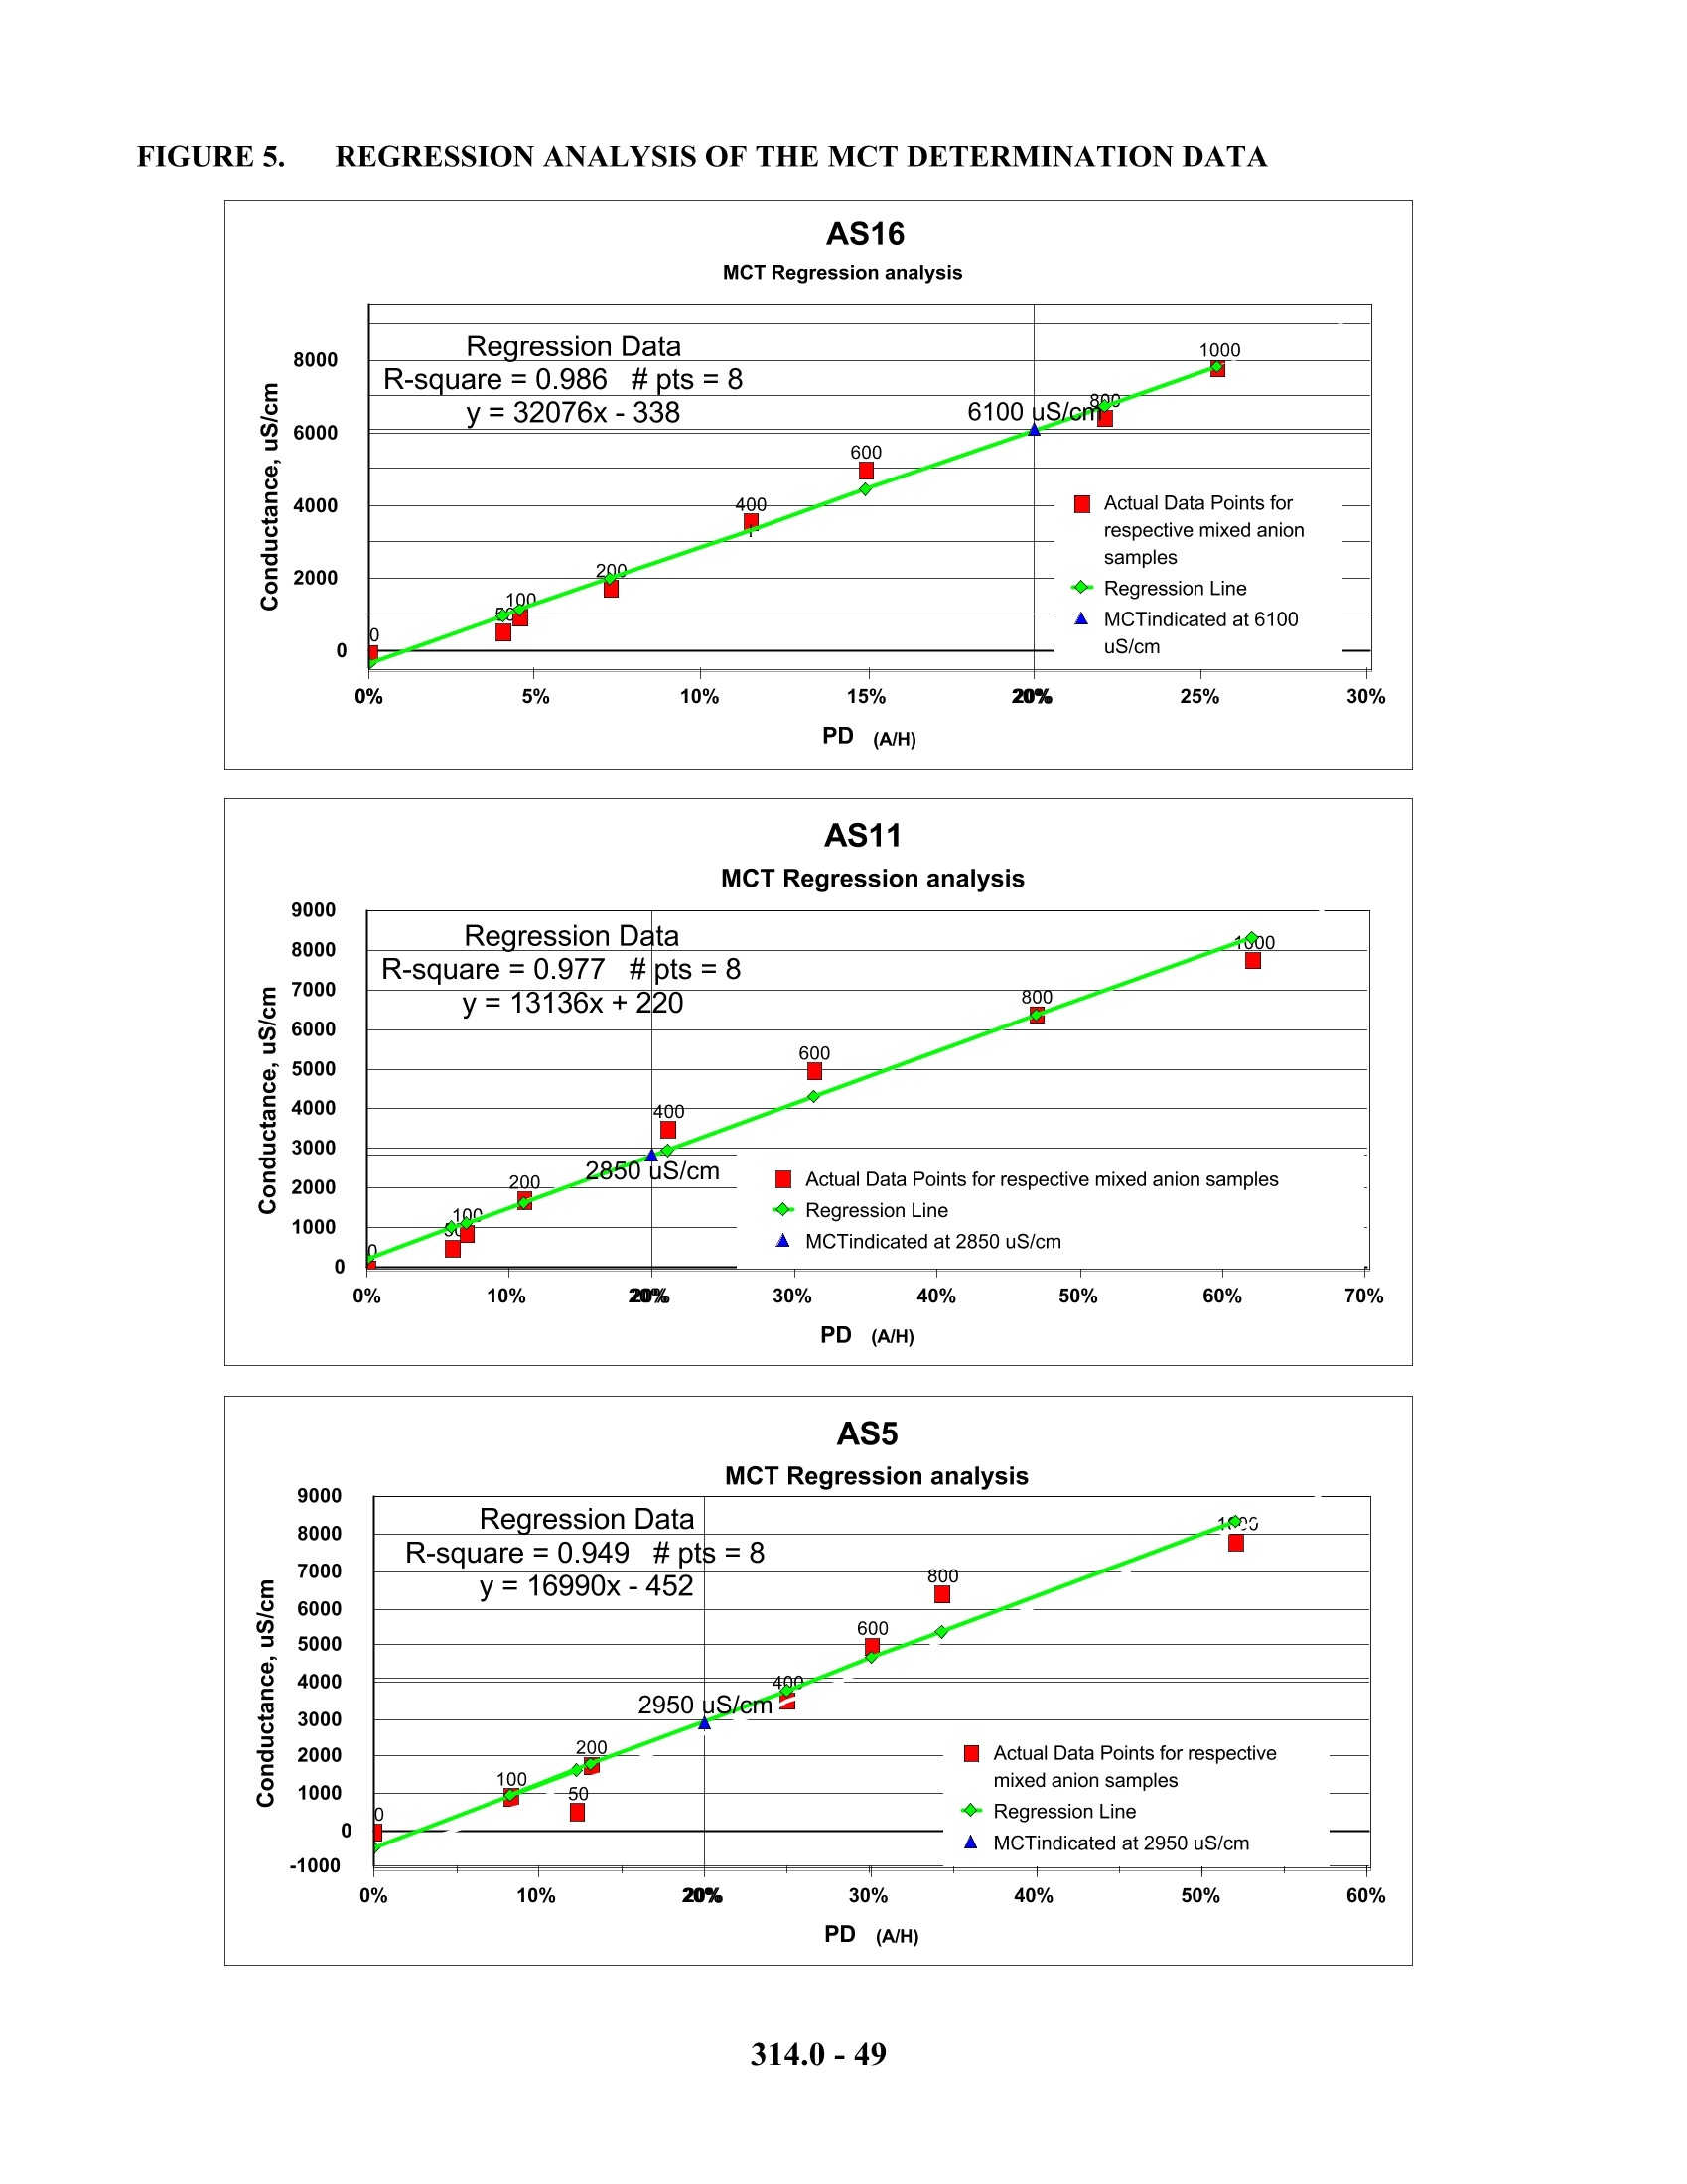
还剩47页未读,是否继续阅读?

产品配置单

赛默飞色谱与质谱为您提供《饮用水中高氯酸根检测方案(离子色谱仪)》,该方案主要用于饮用水中无机阴离子检测,参考标准--,《饮用水中高氯酸根检测方案(离子色谱仪)》用到的仪器有赛默飞戴安ICS-5000+高压离子色谱系统、赛默飞ICS5000多功能离子色谱、赛默飞戴安ICS-900离子色谱仪
推荐专场
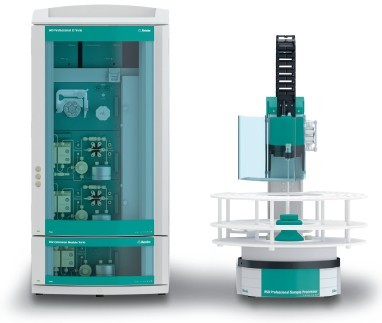
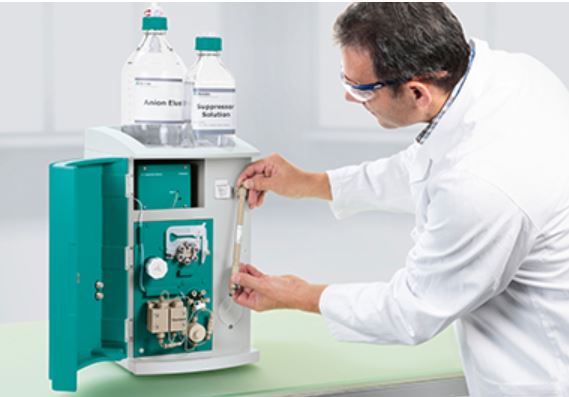
相关方案
更多
该厂商其他方案
更多