


应用范围
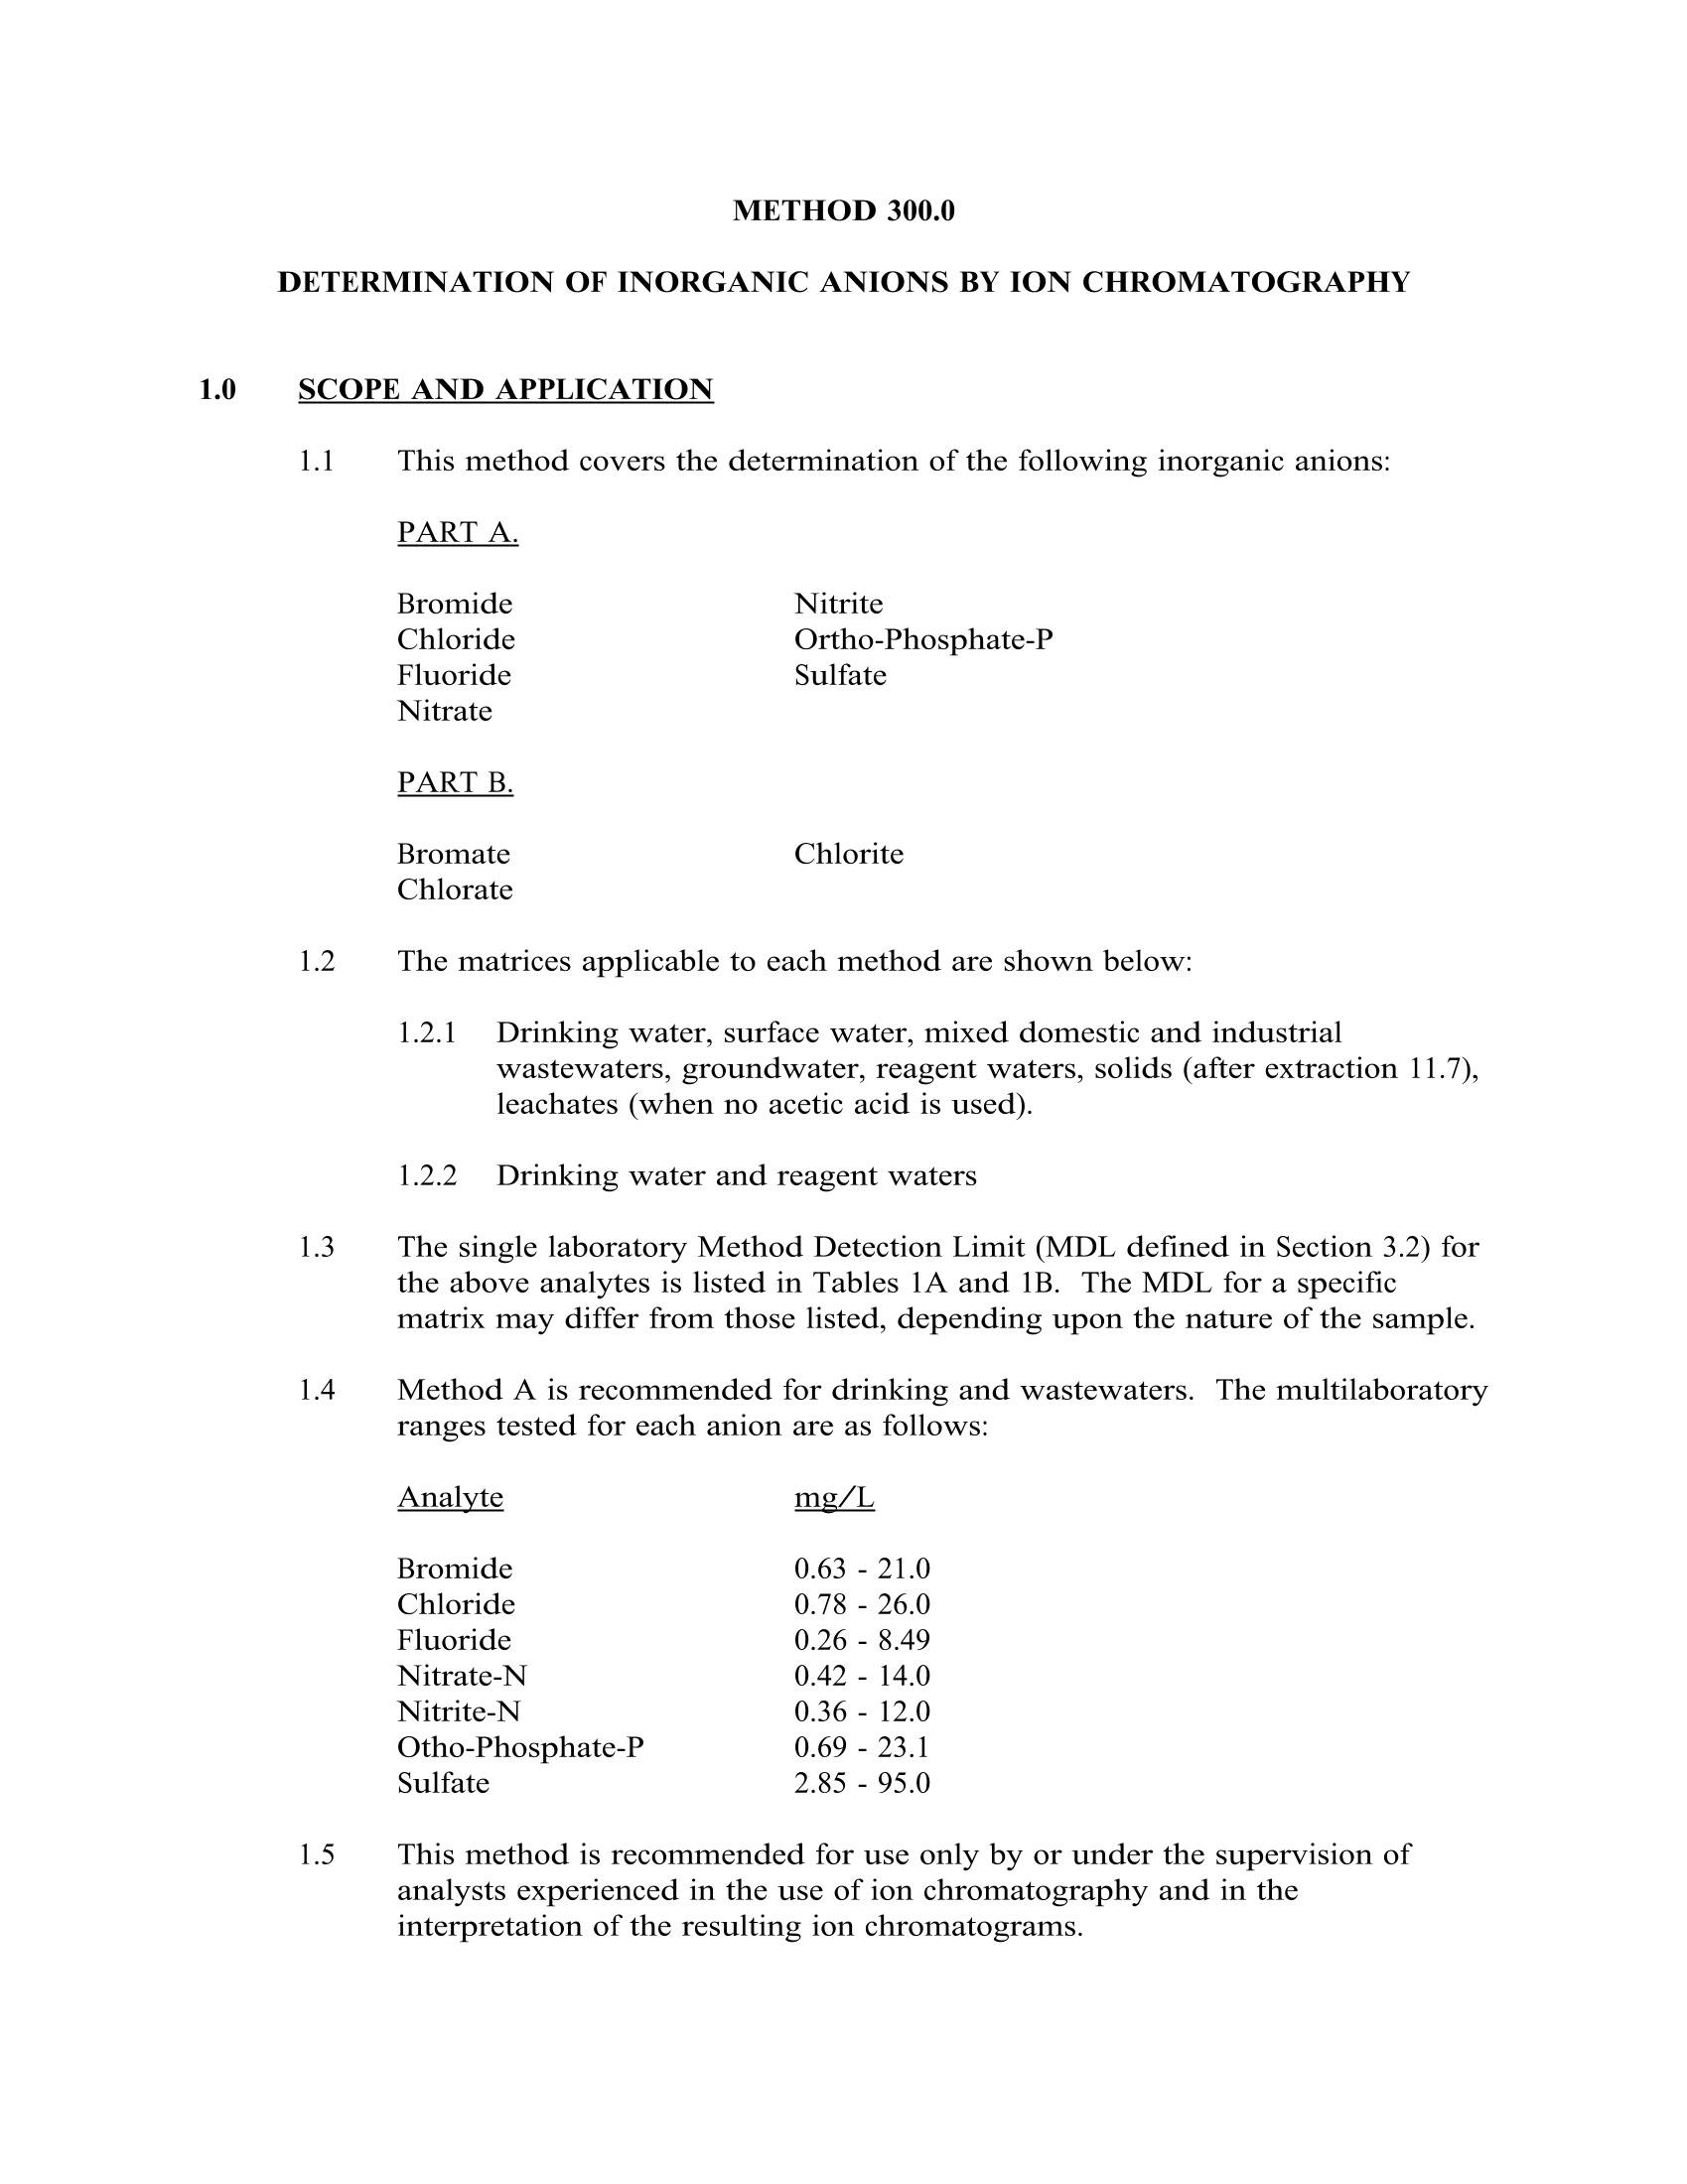
1. 可测定的阴离子包括
A部分:溴离子,氯离子,氟离子,硝酸根,亚硝酸根,磷酸根,硫酸
B部分:溴酸根,亚氯酸根,氯酸根
2.基体包括:饮用水,地表水,民用水和工业废水,地下水,试剂用水,固体浸出液
方法要点
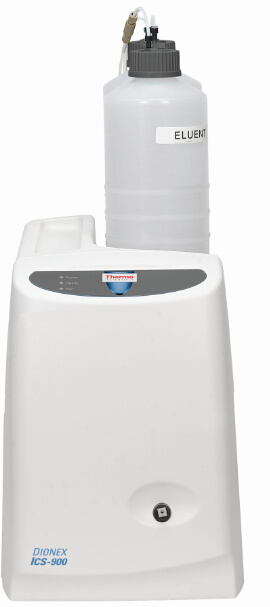
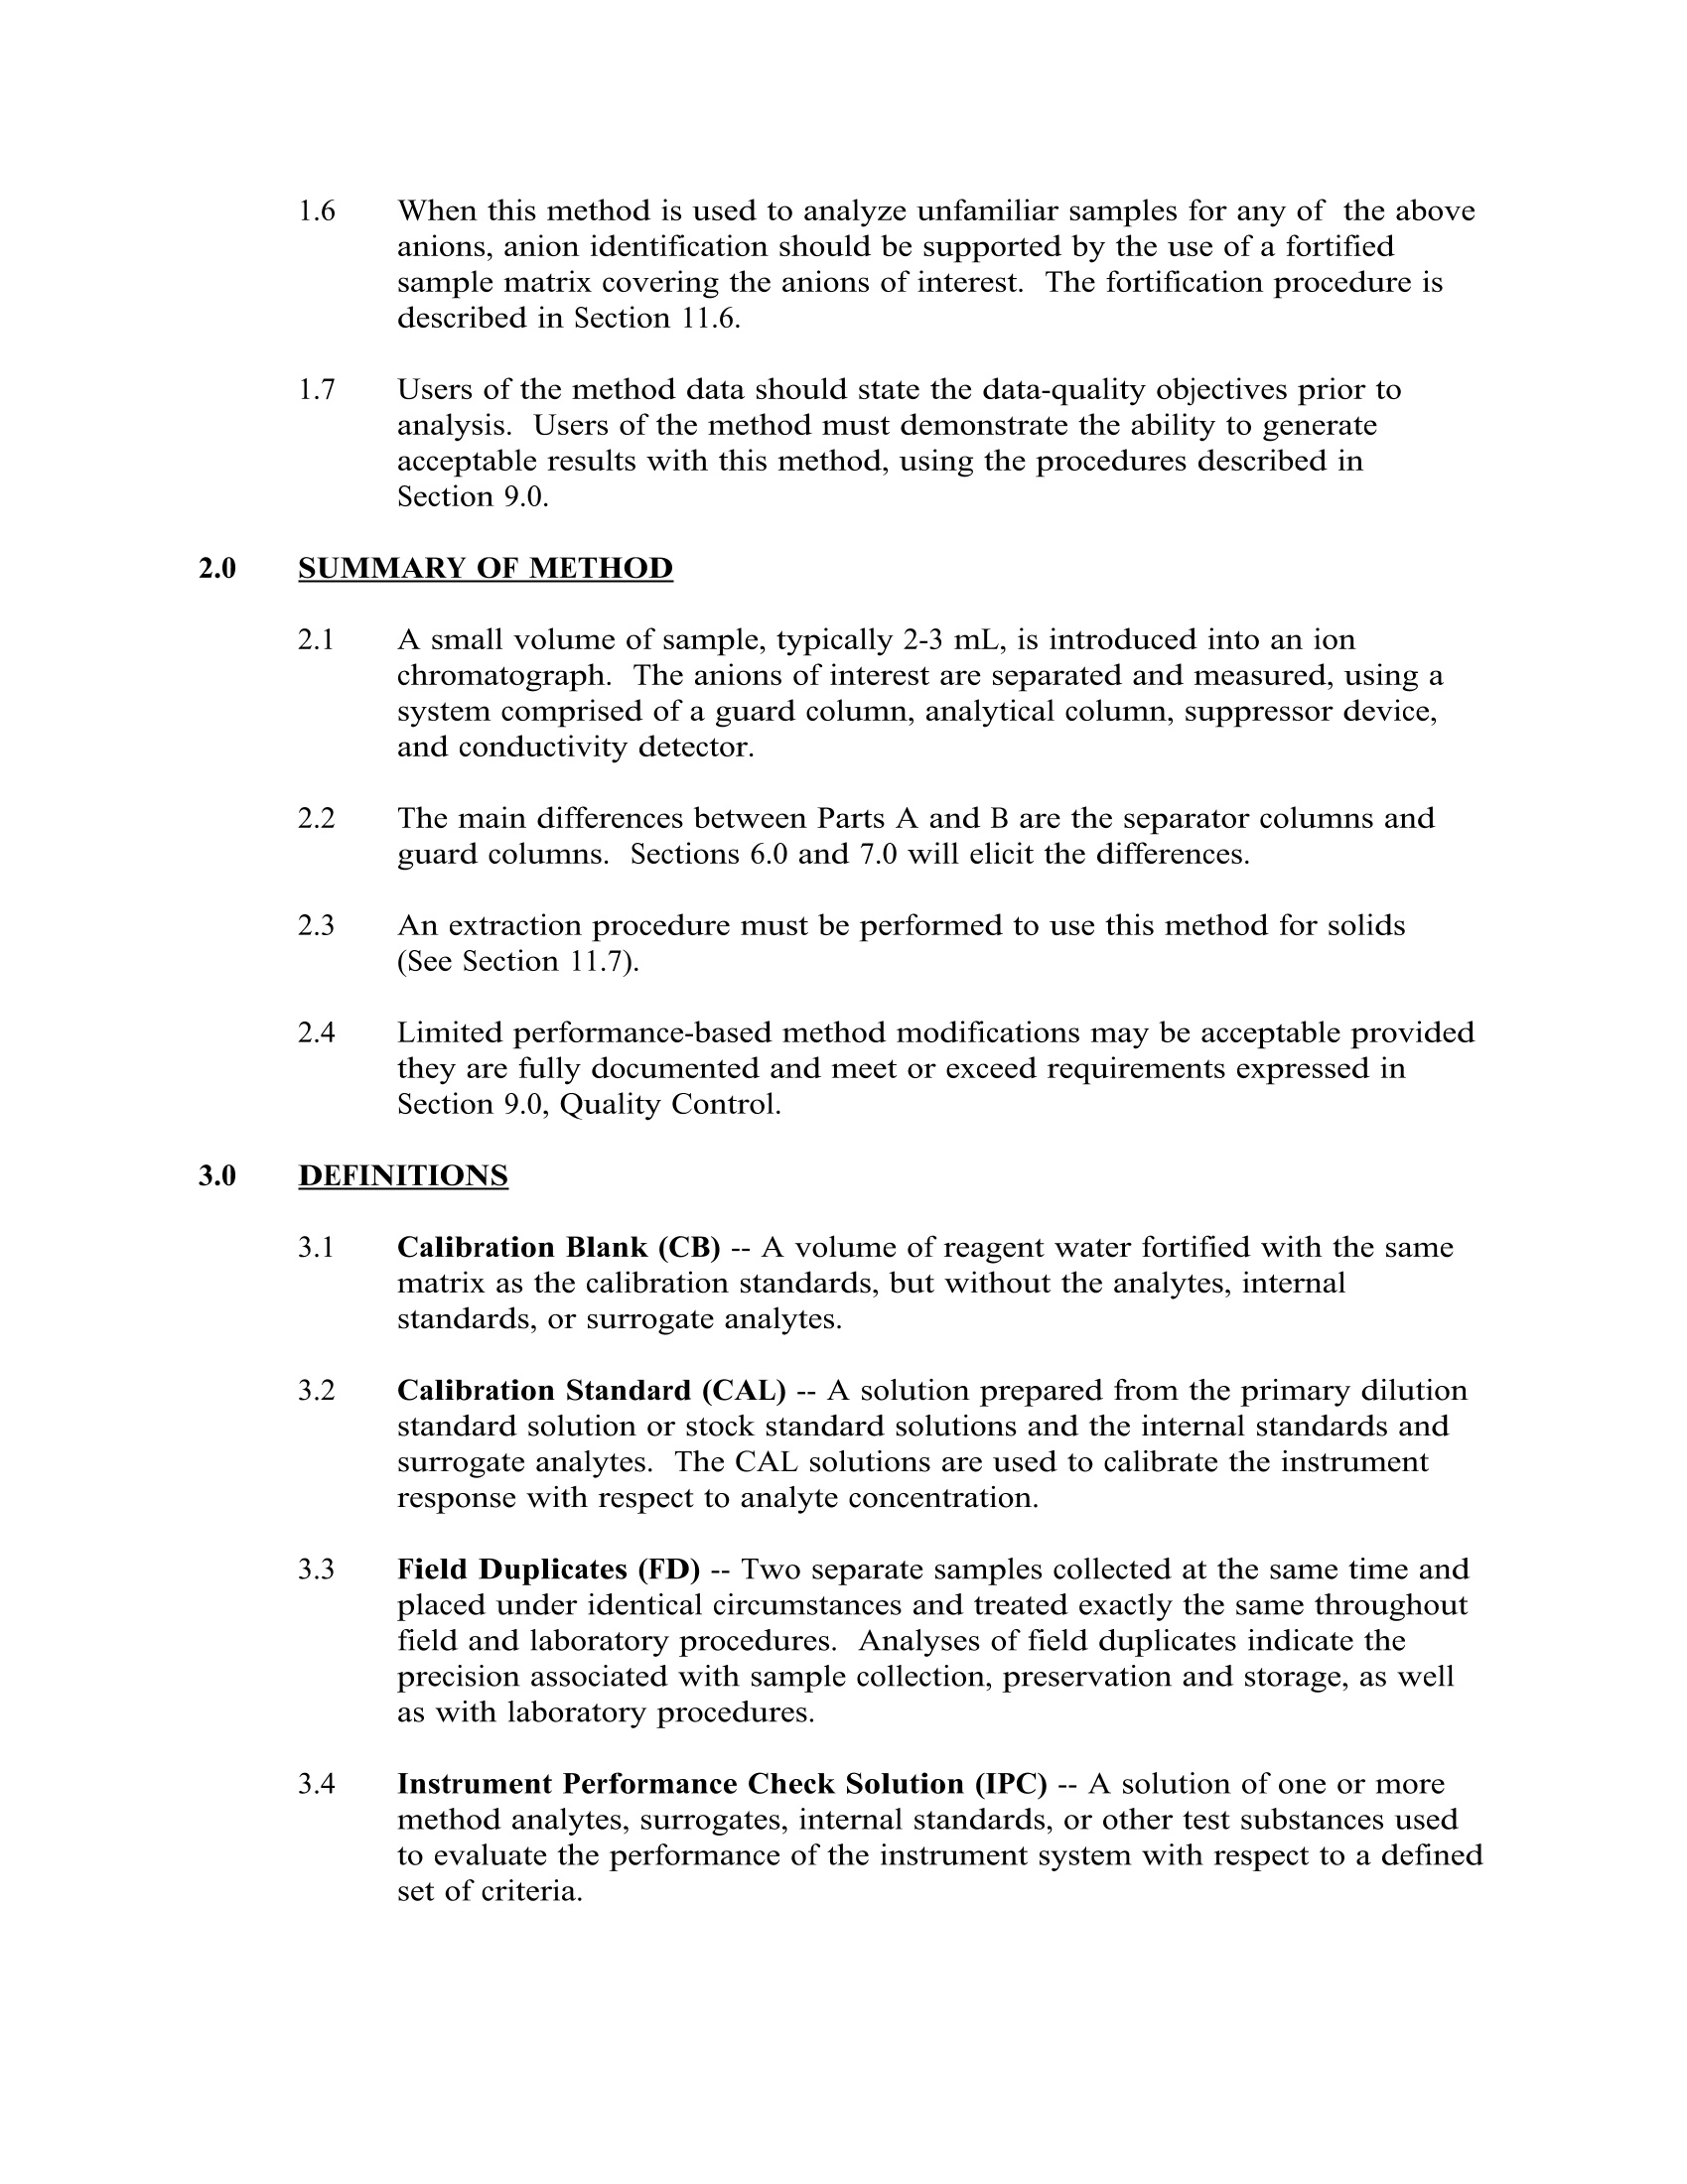
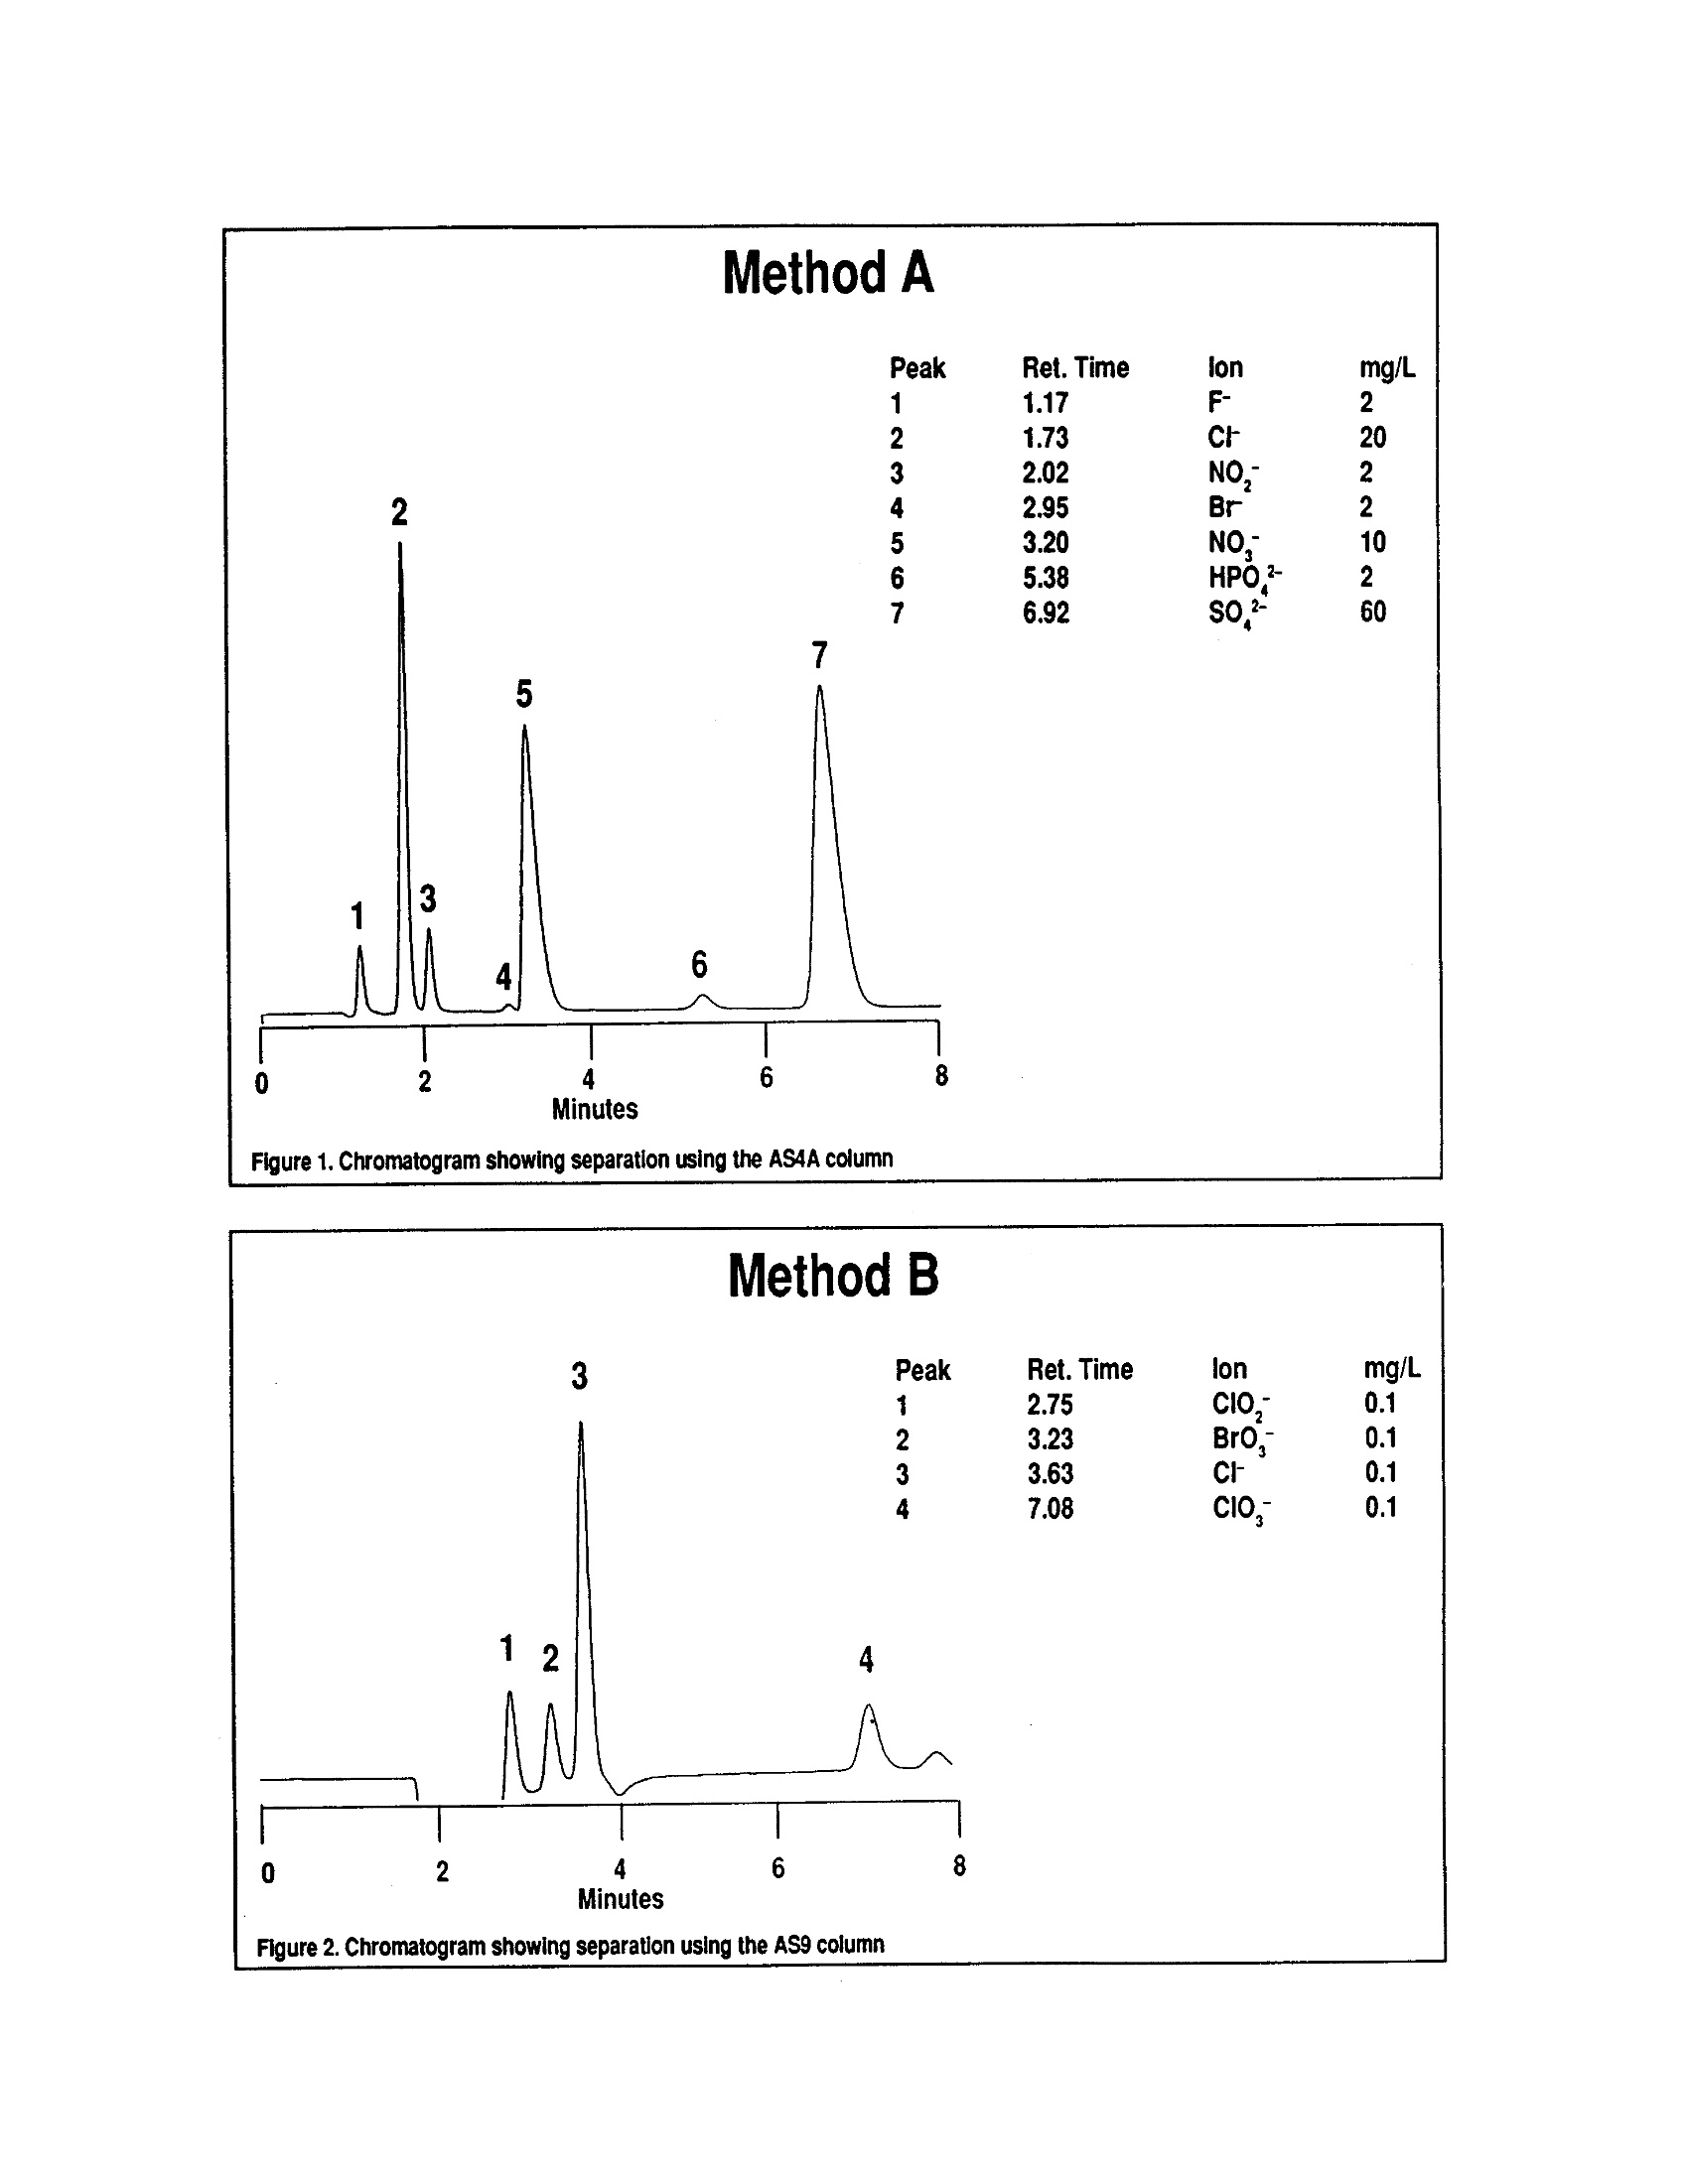
1. 小量样品,一般2-3mL注入离子色谱,阴离子采用一个系统含有保护柱,分离柱,抑制器和电导检测器进行分离和检测。
2. A部分和B部分的差异分离柱和保护柱的不同。
3. 固体样品必须经过一萃取过程
建议的色谱条件
1. 方法A:Dionex AS4A分离柱;方法B:Dionex AS9分离柱
2. 抑制器装置:Dionex Anion MicroMembrane Suppressor
3. 检测器:Dionex-电导池死体积约为1.25μL
4. 淋洗液:A-1.7mM碳酸氢钠和1.8mM碳酸钠
5. 再生液:0.025N硫酸
方案详情

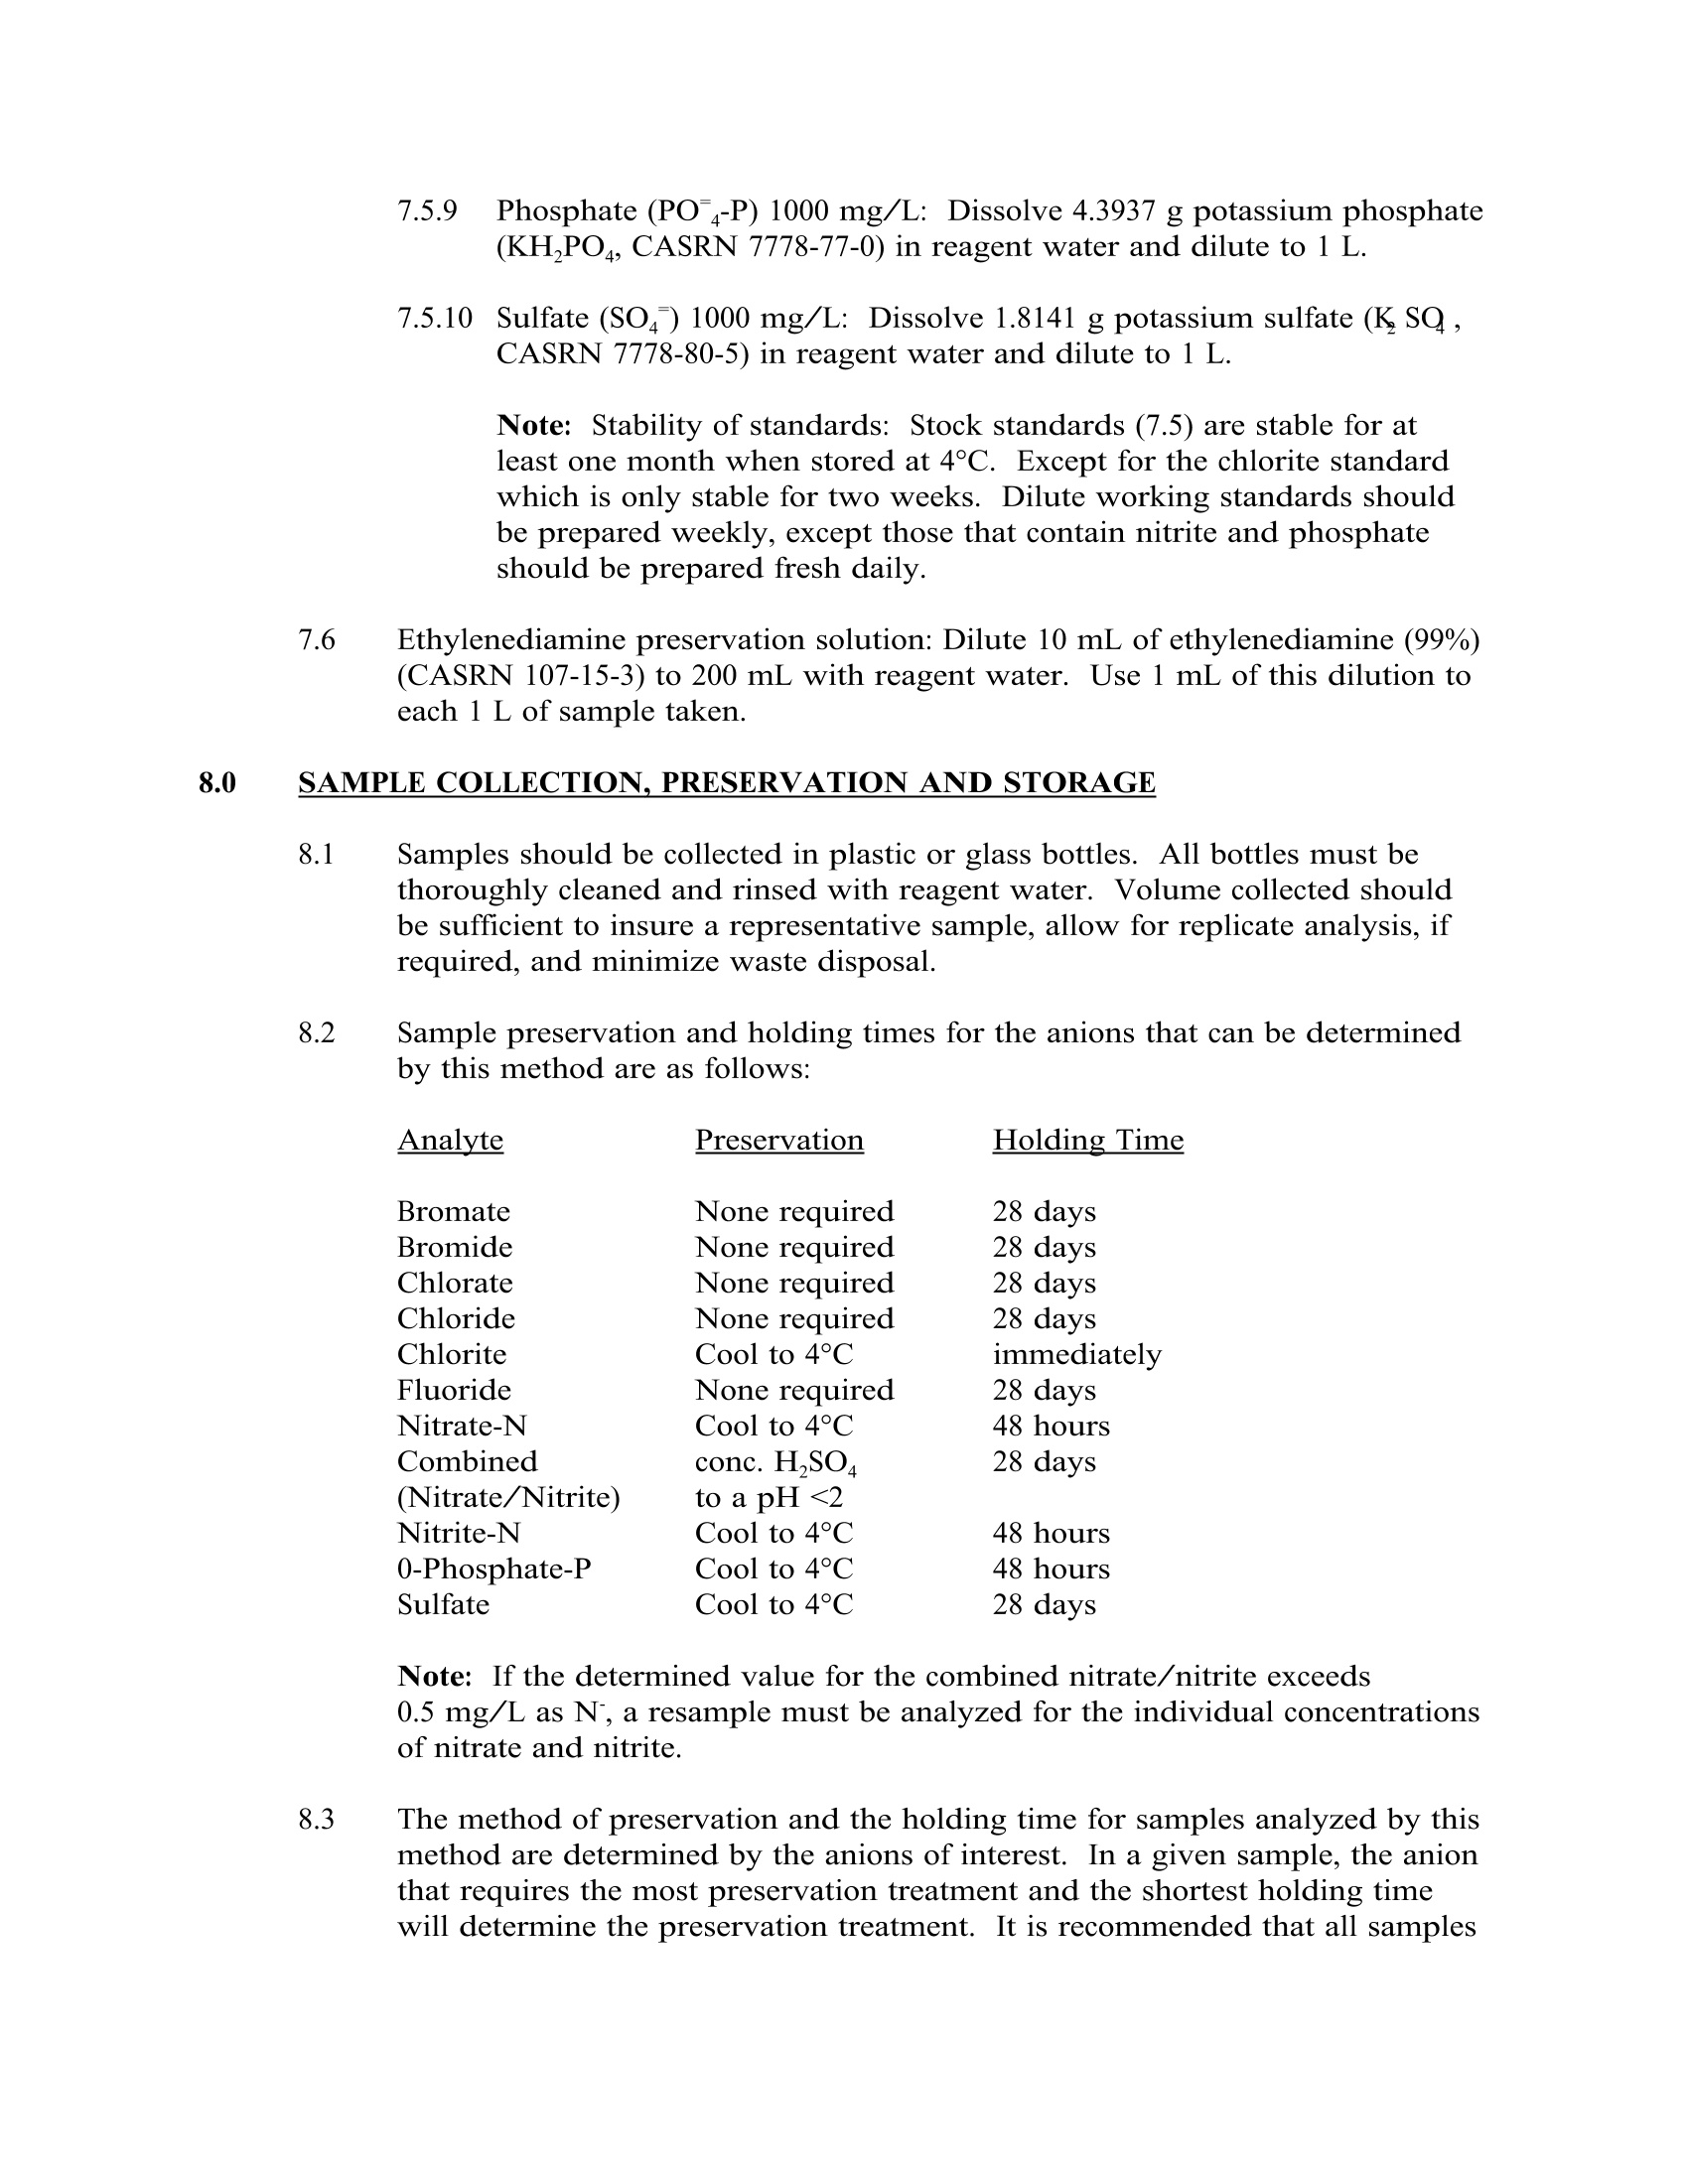
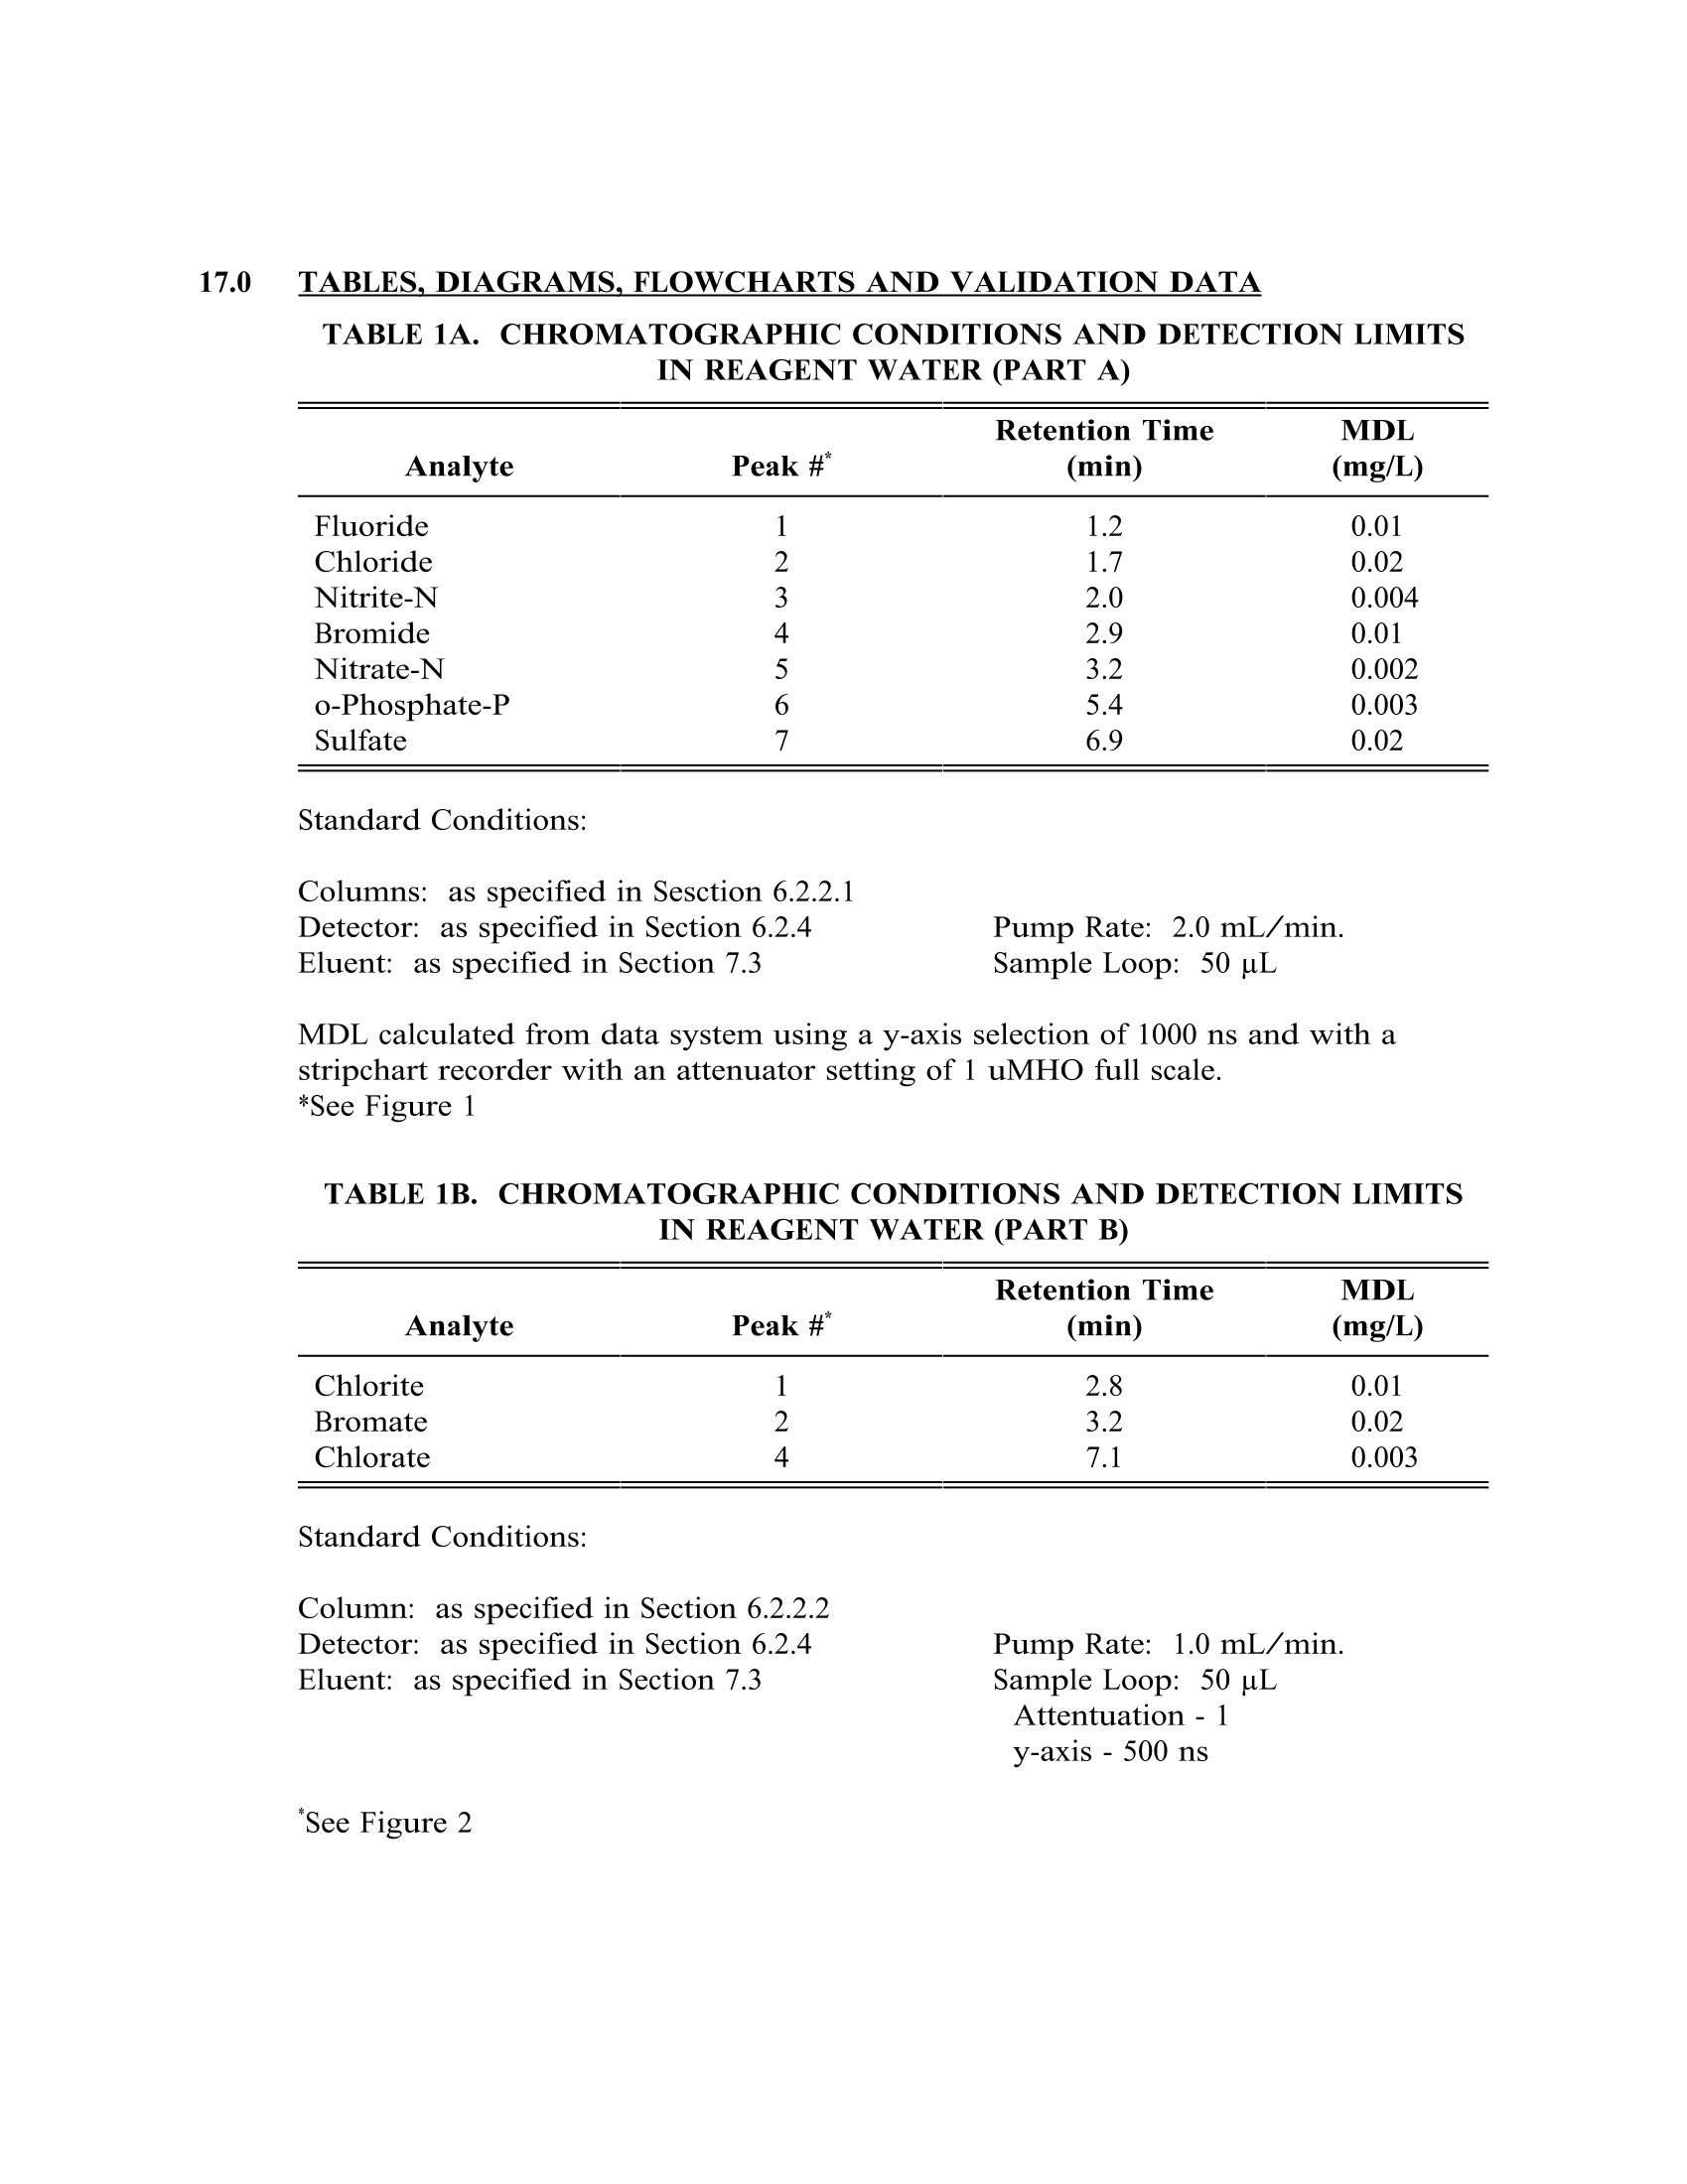
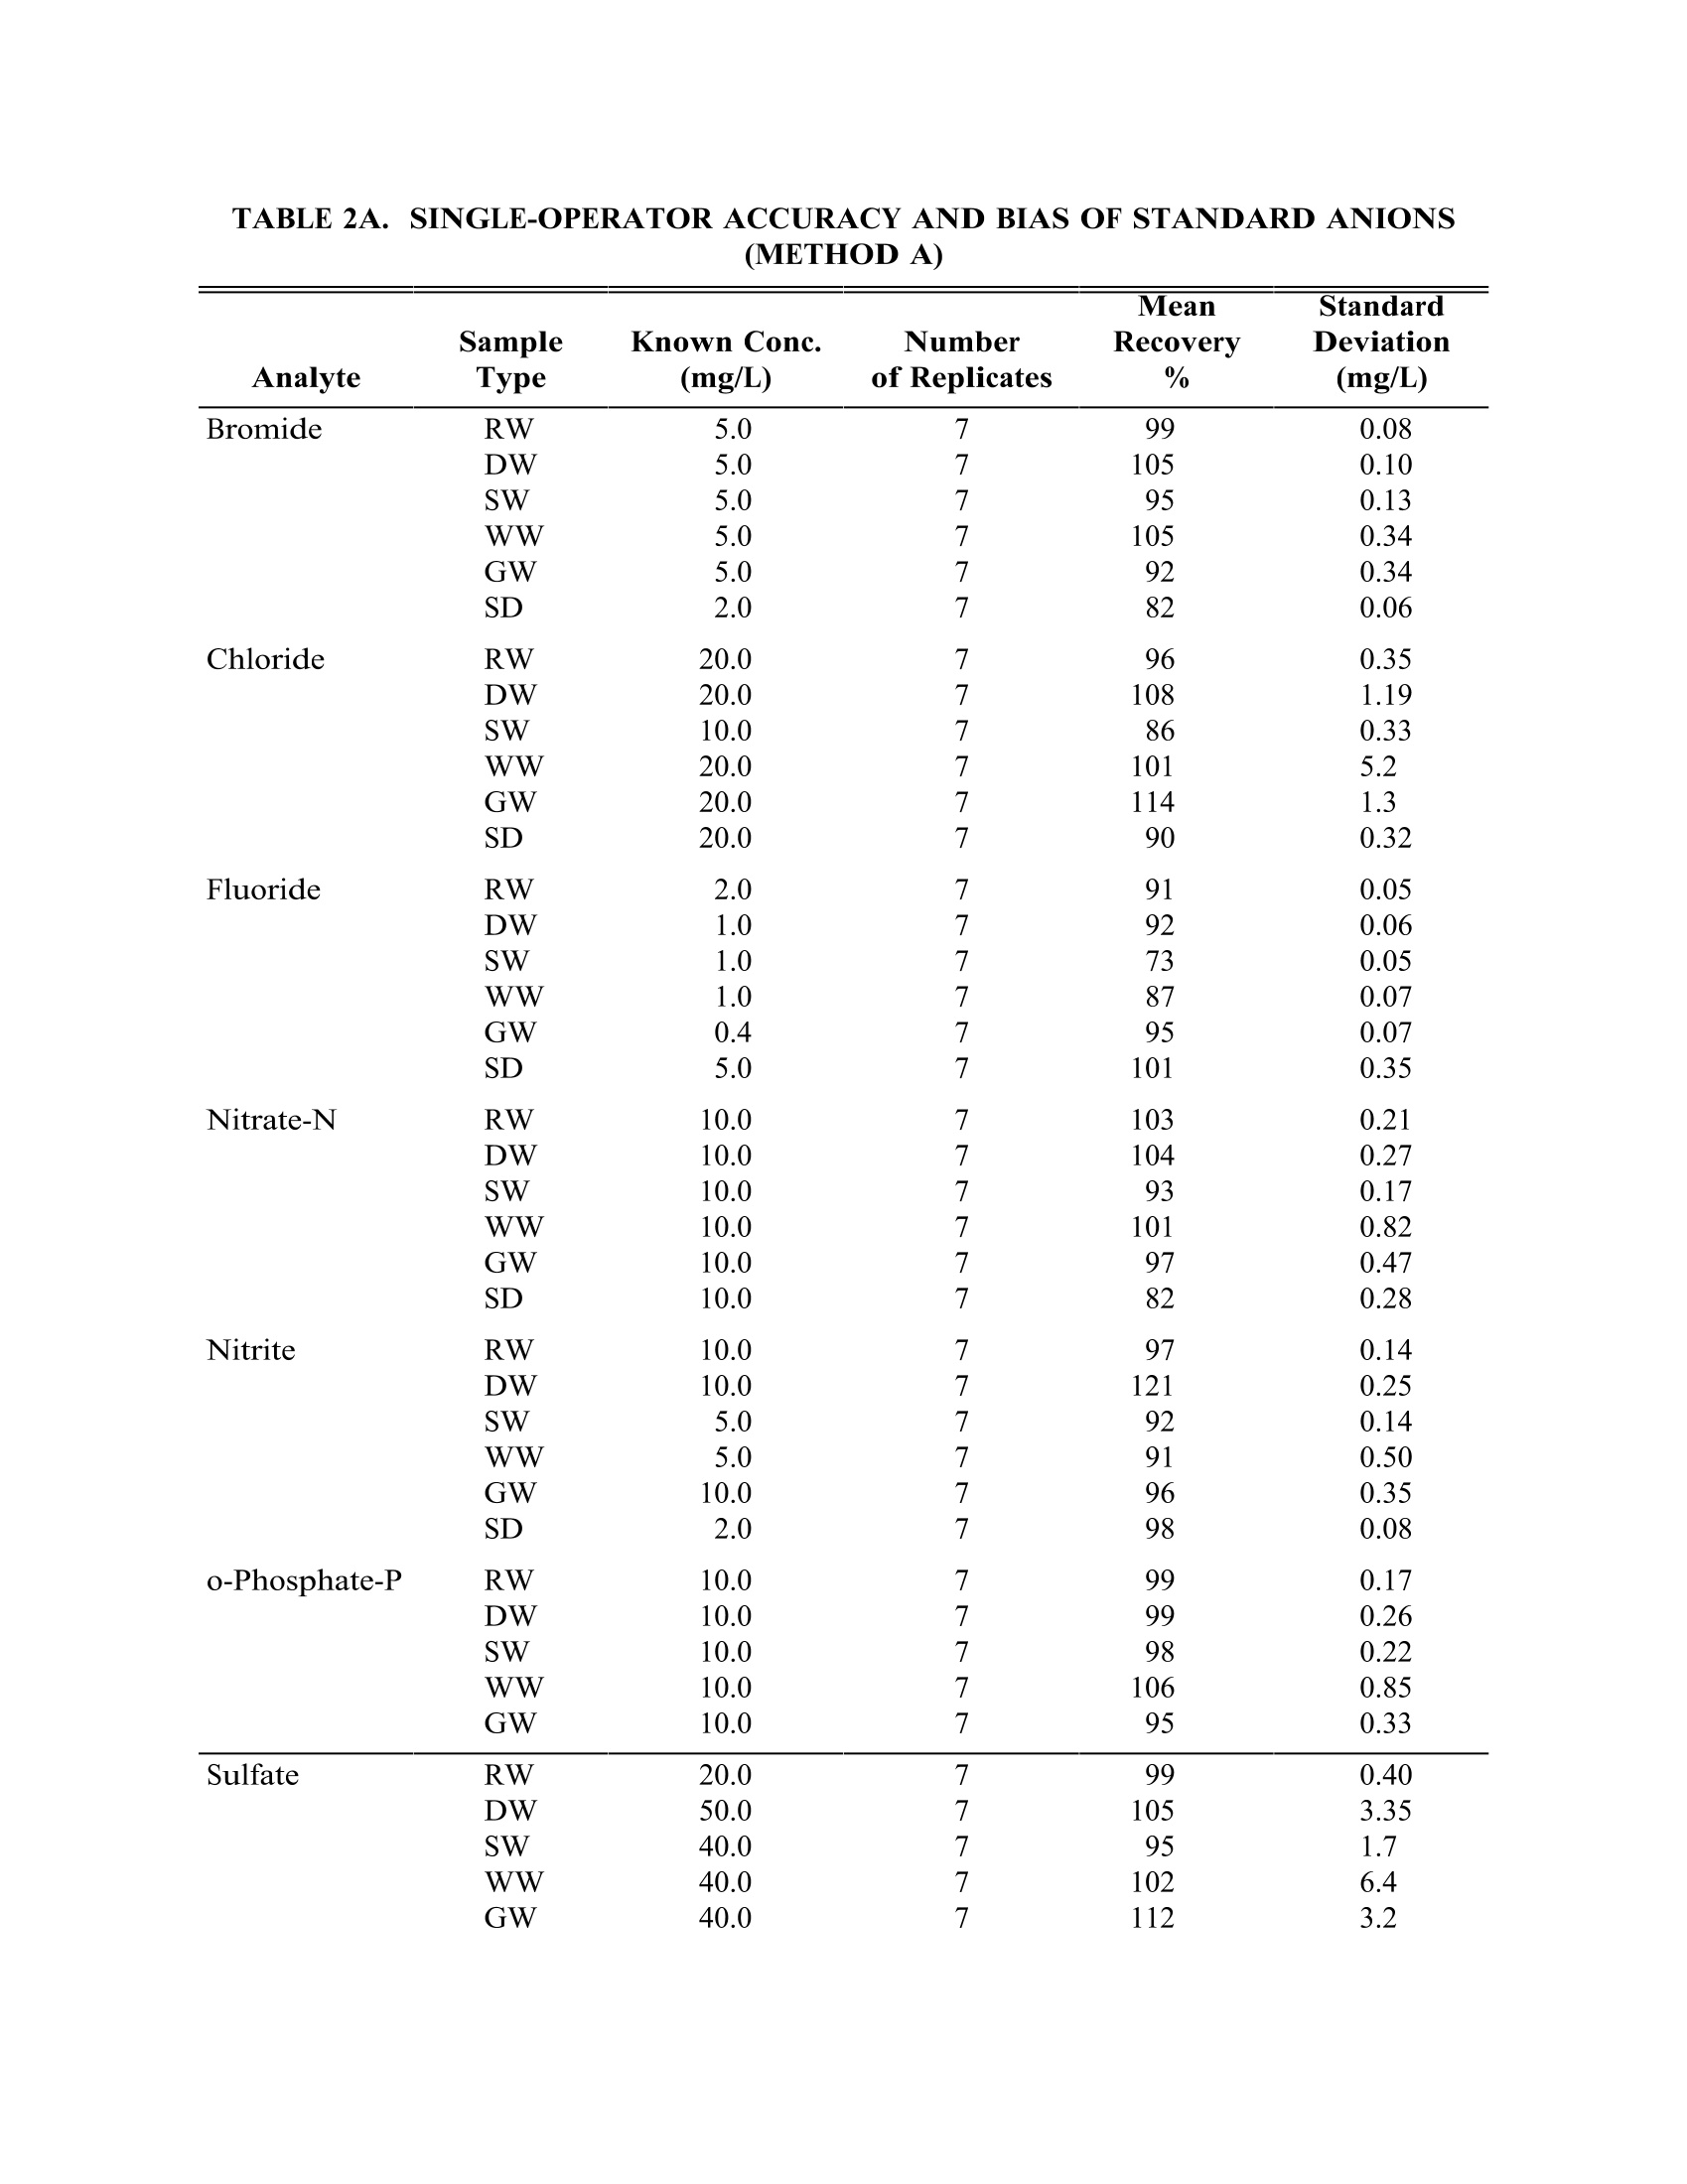
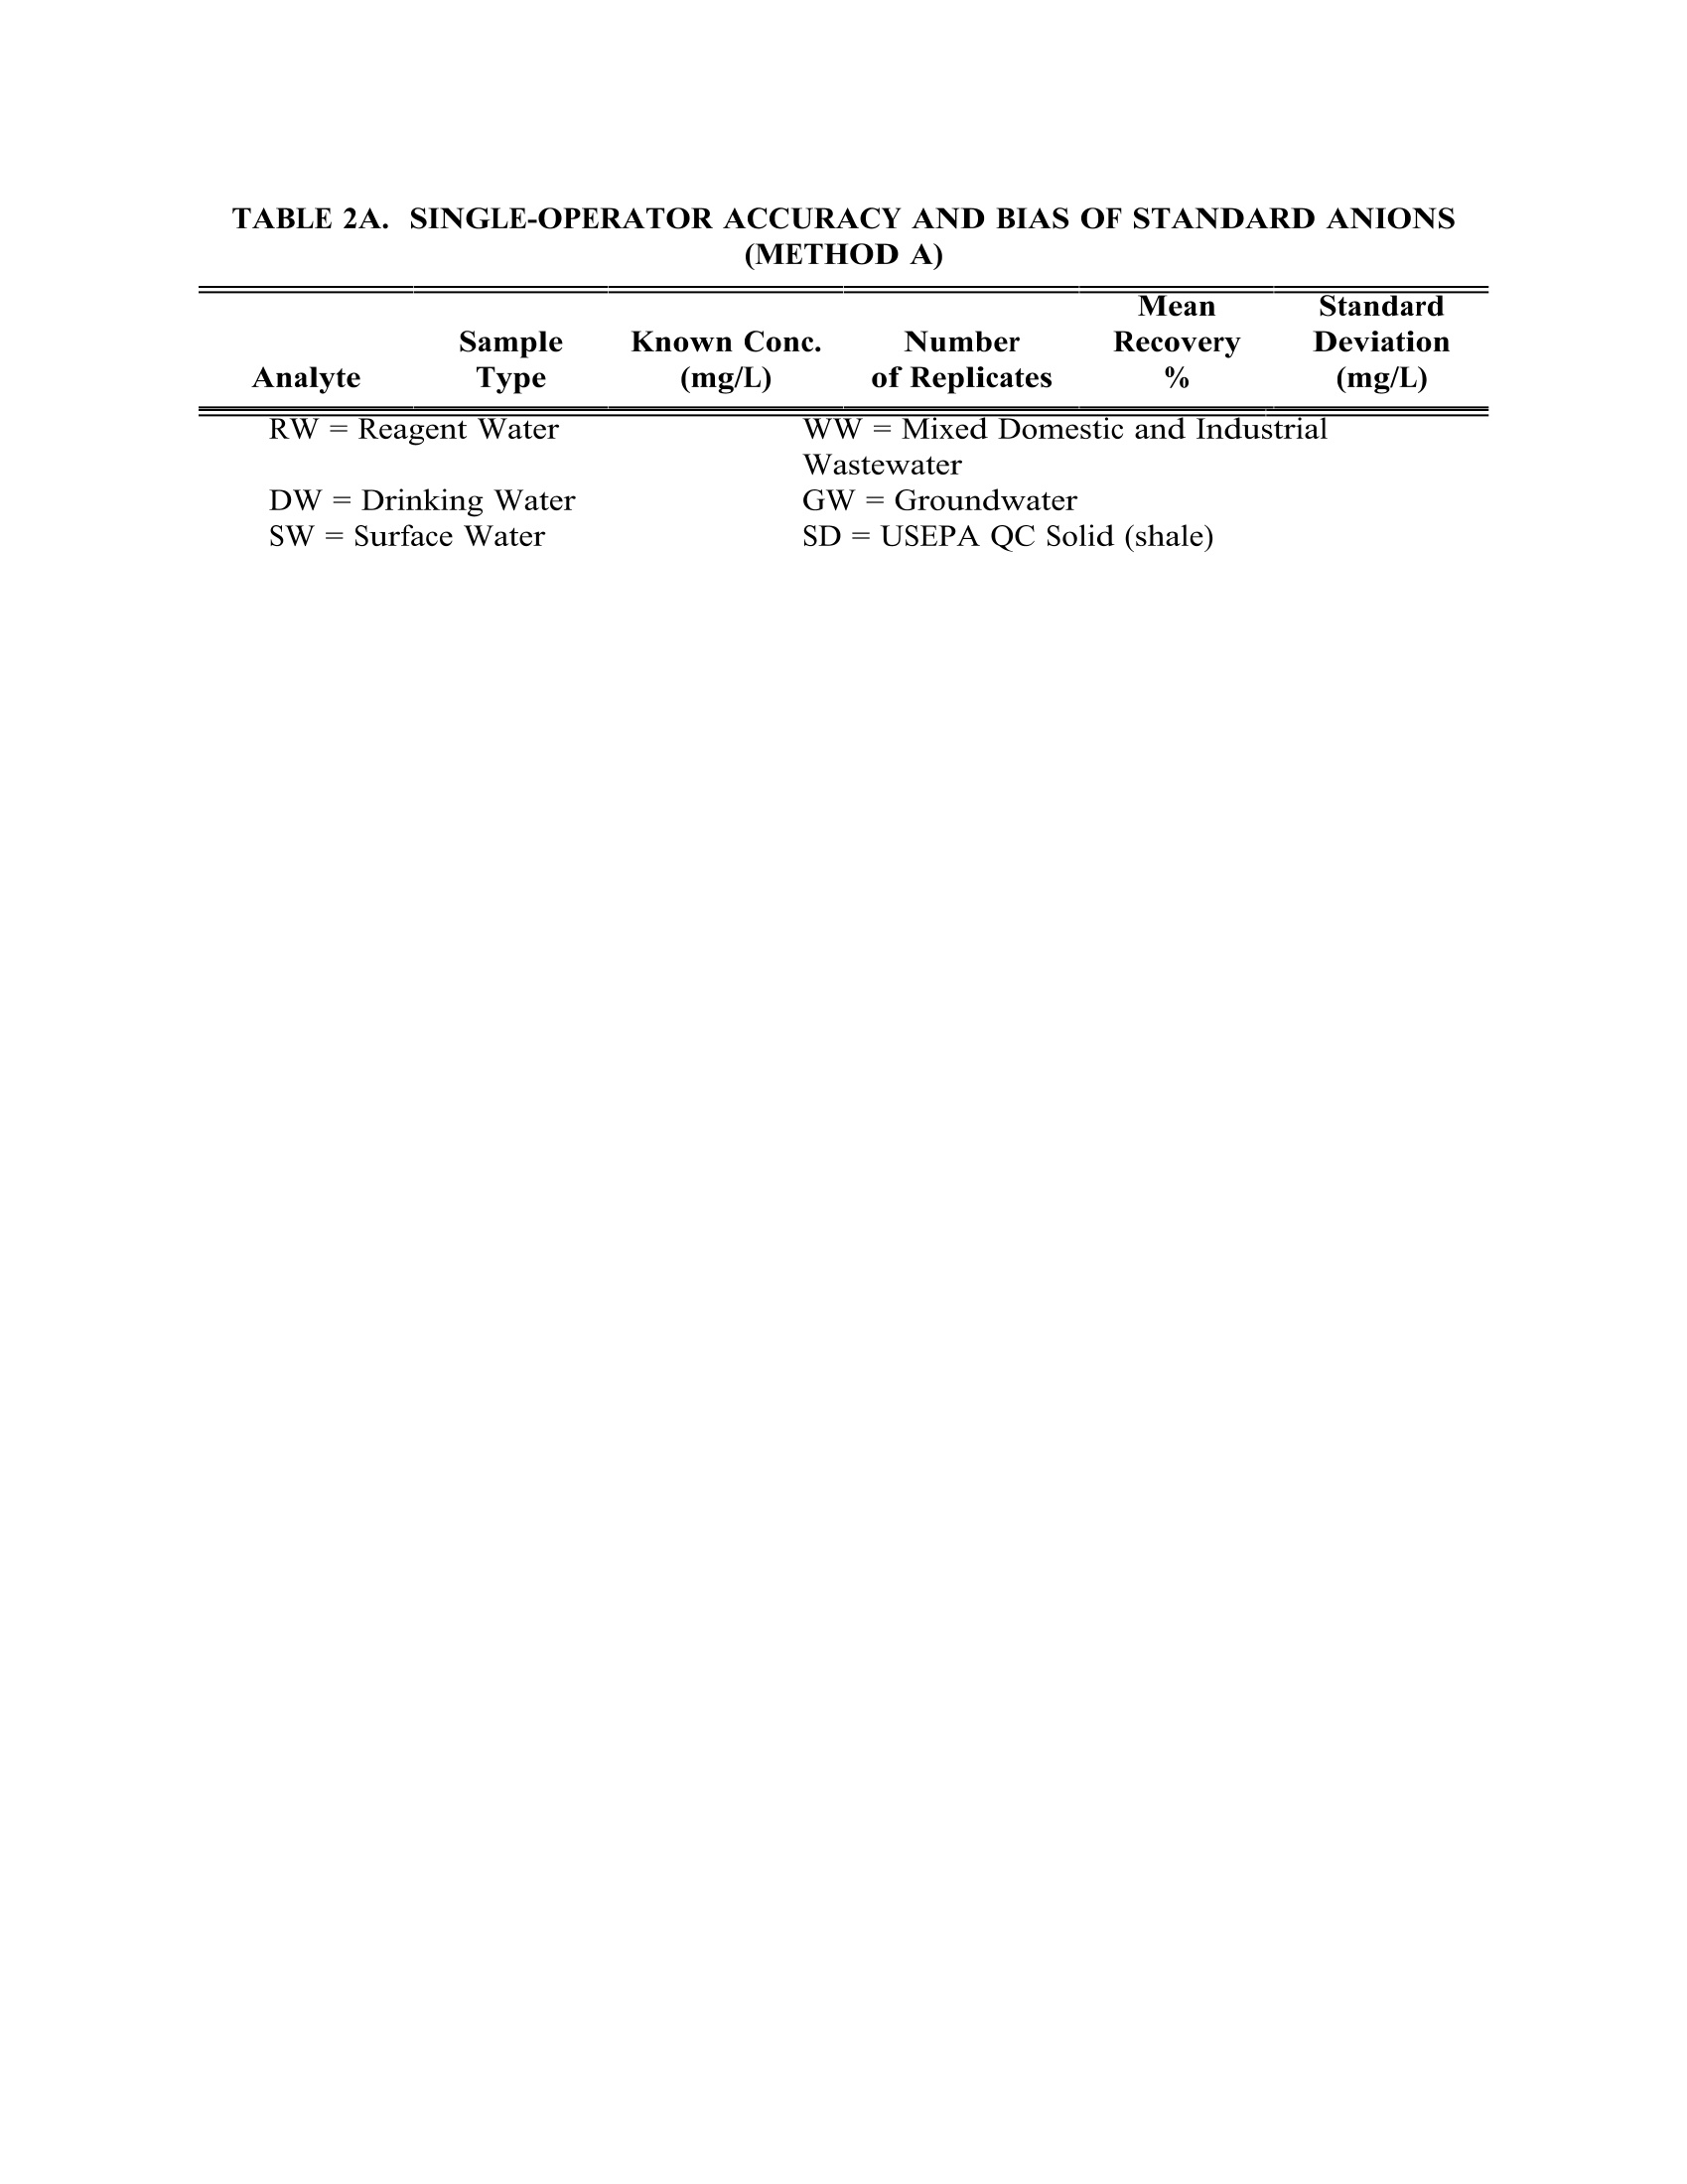
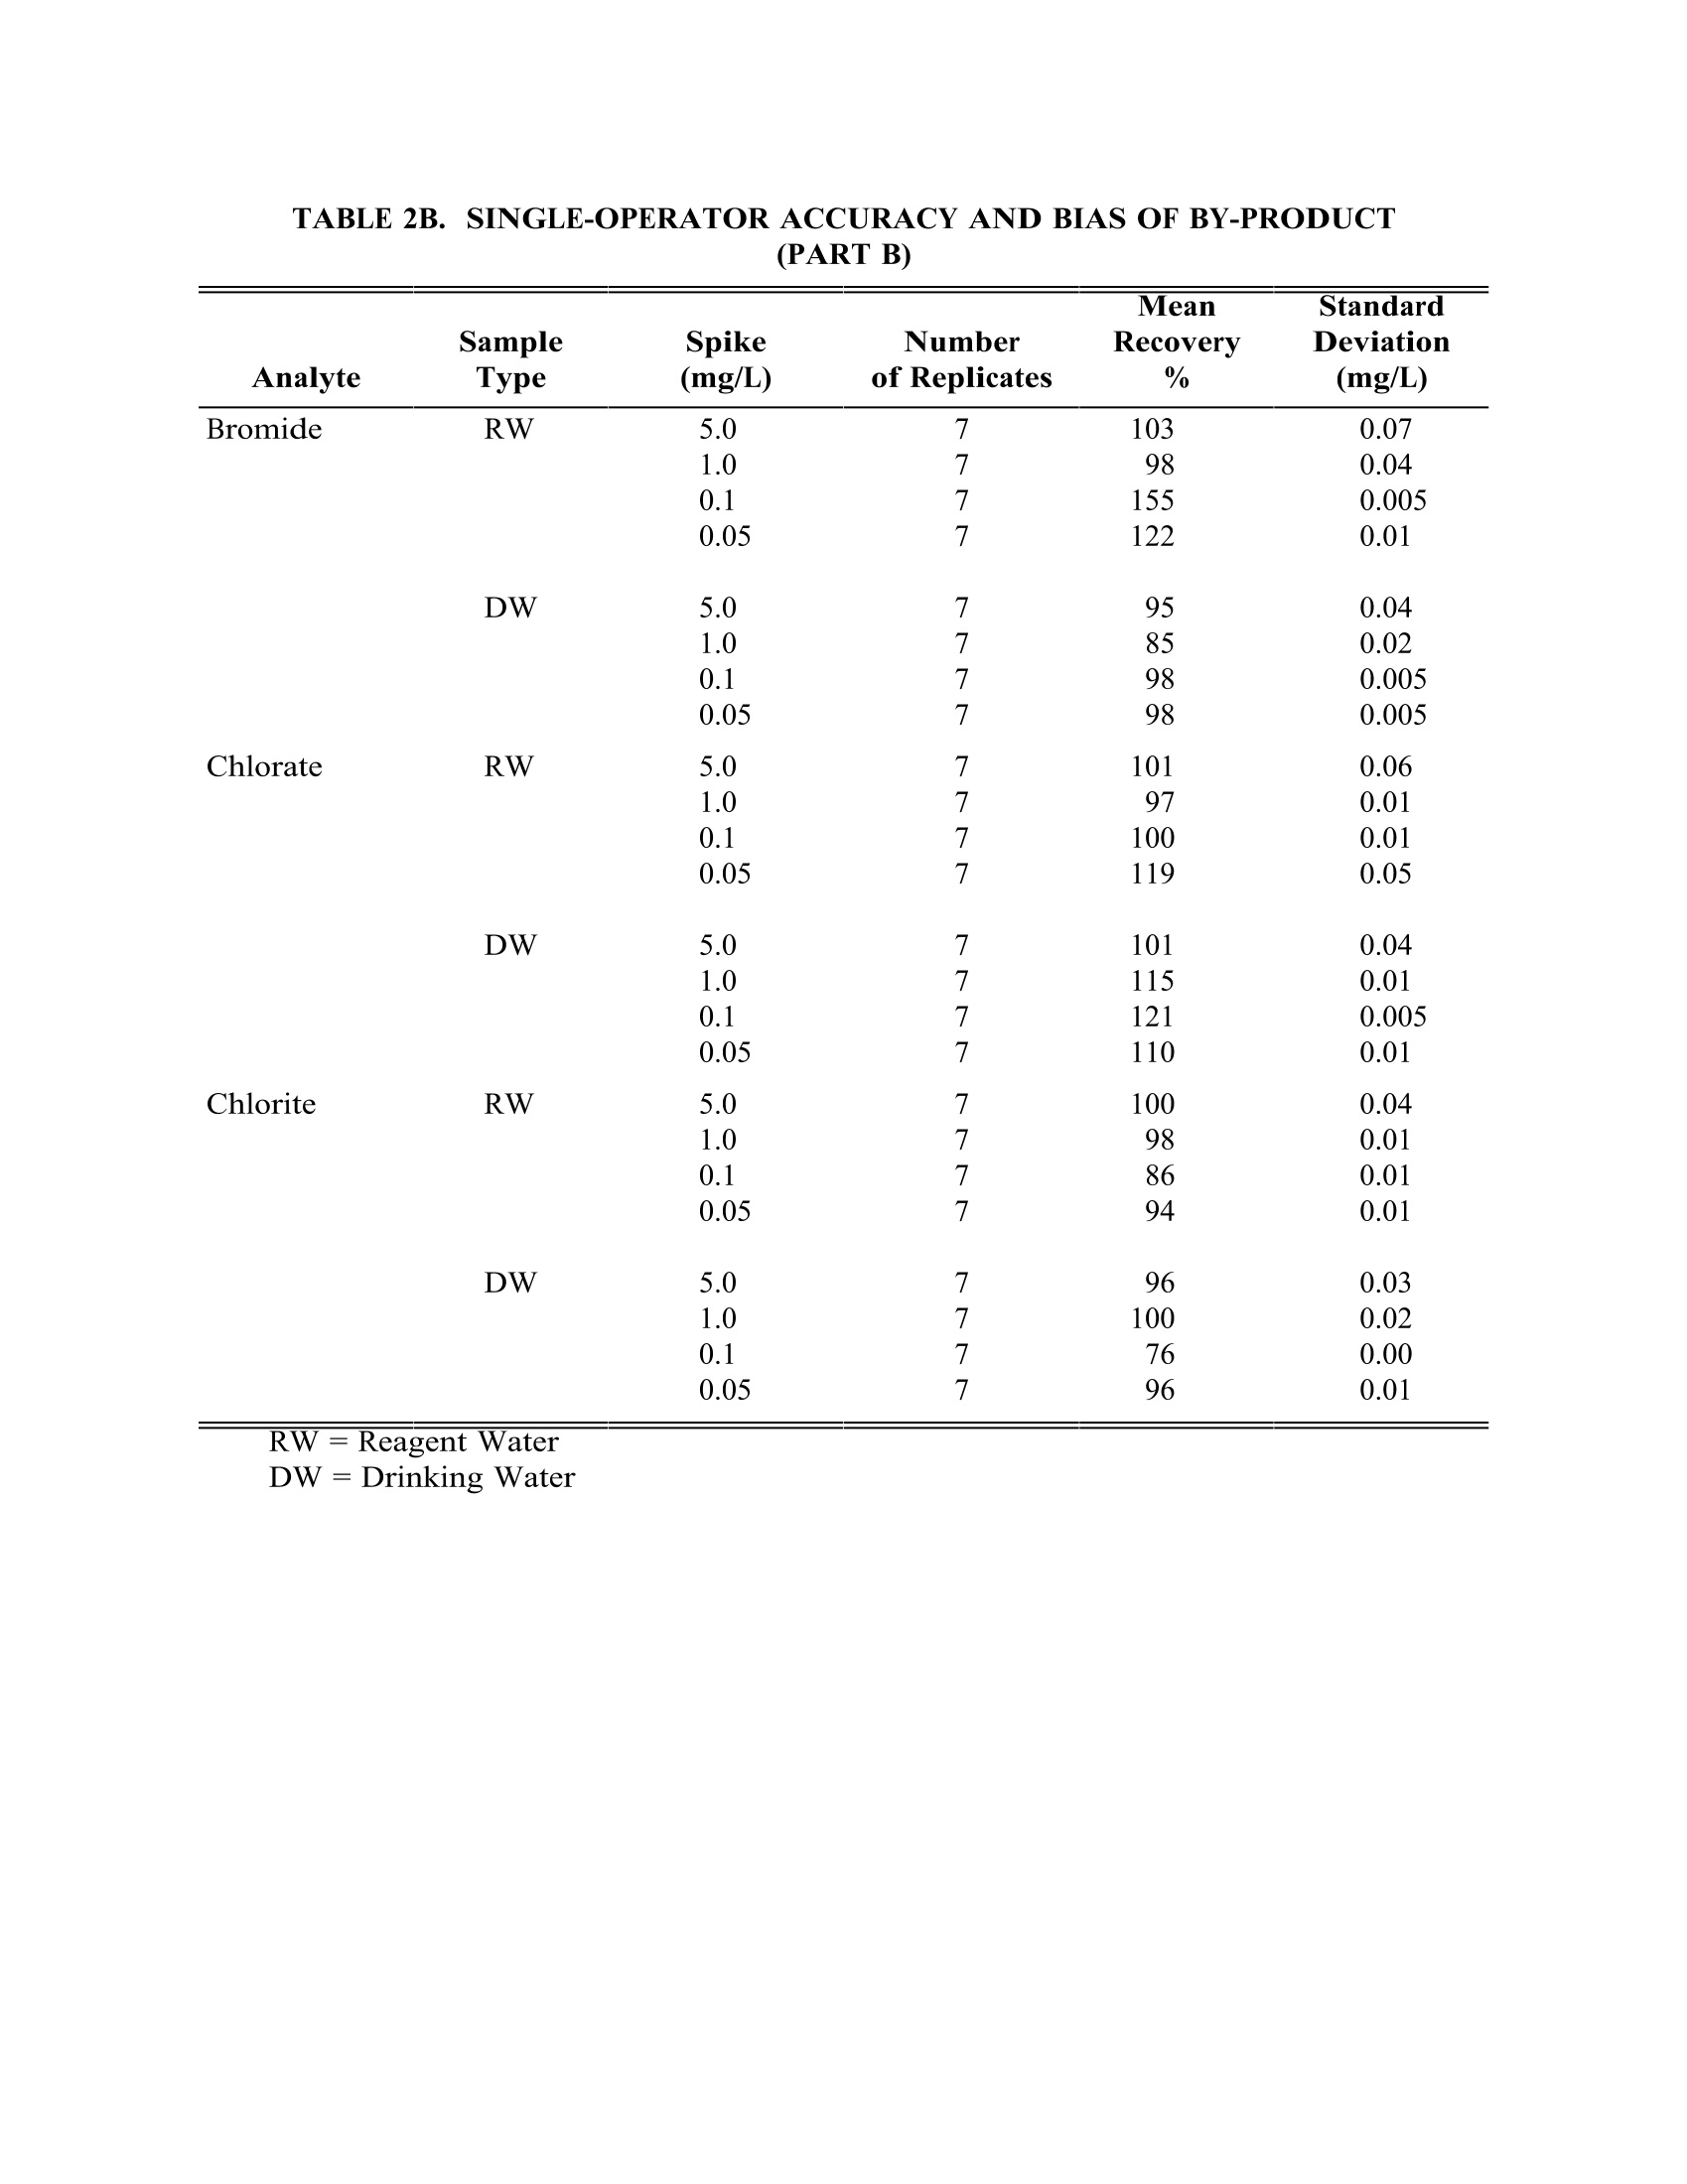
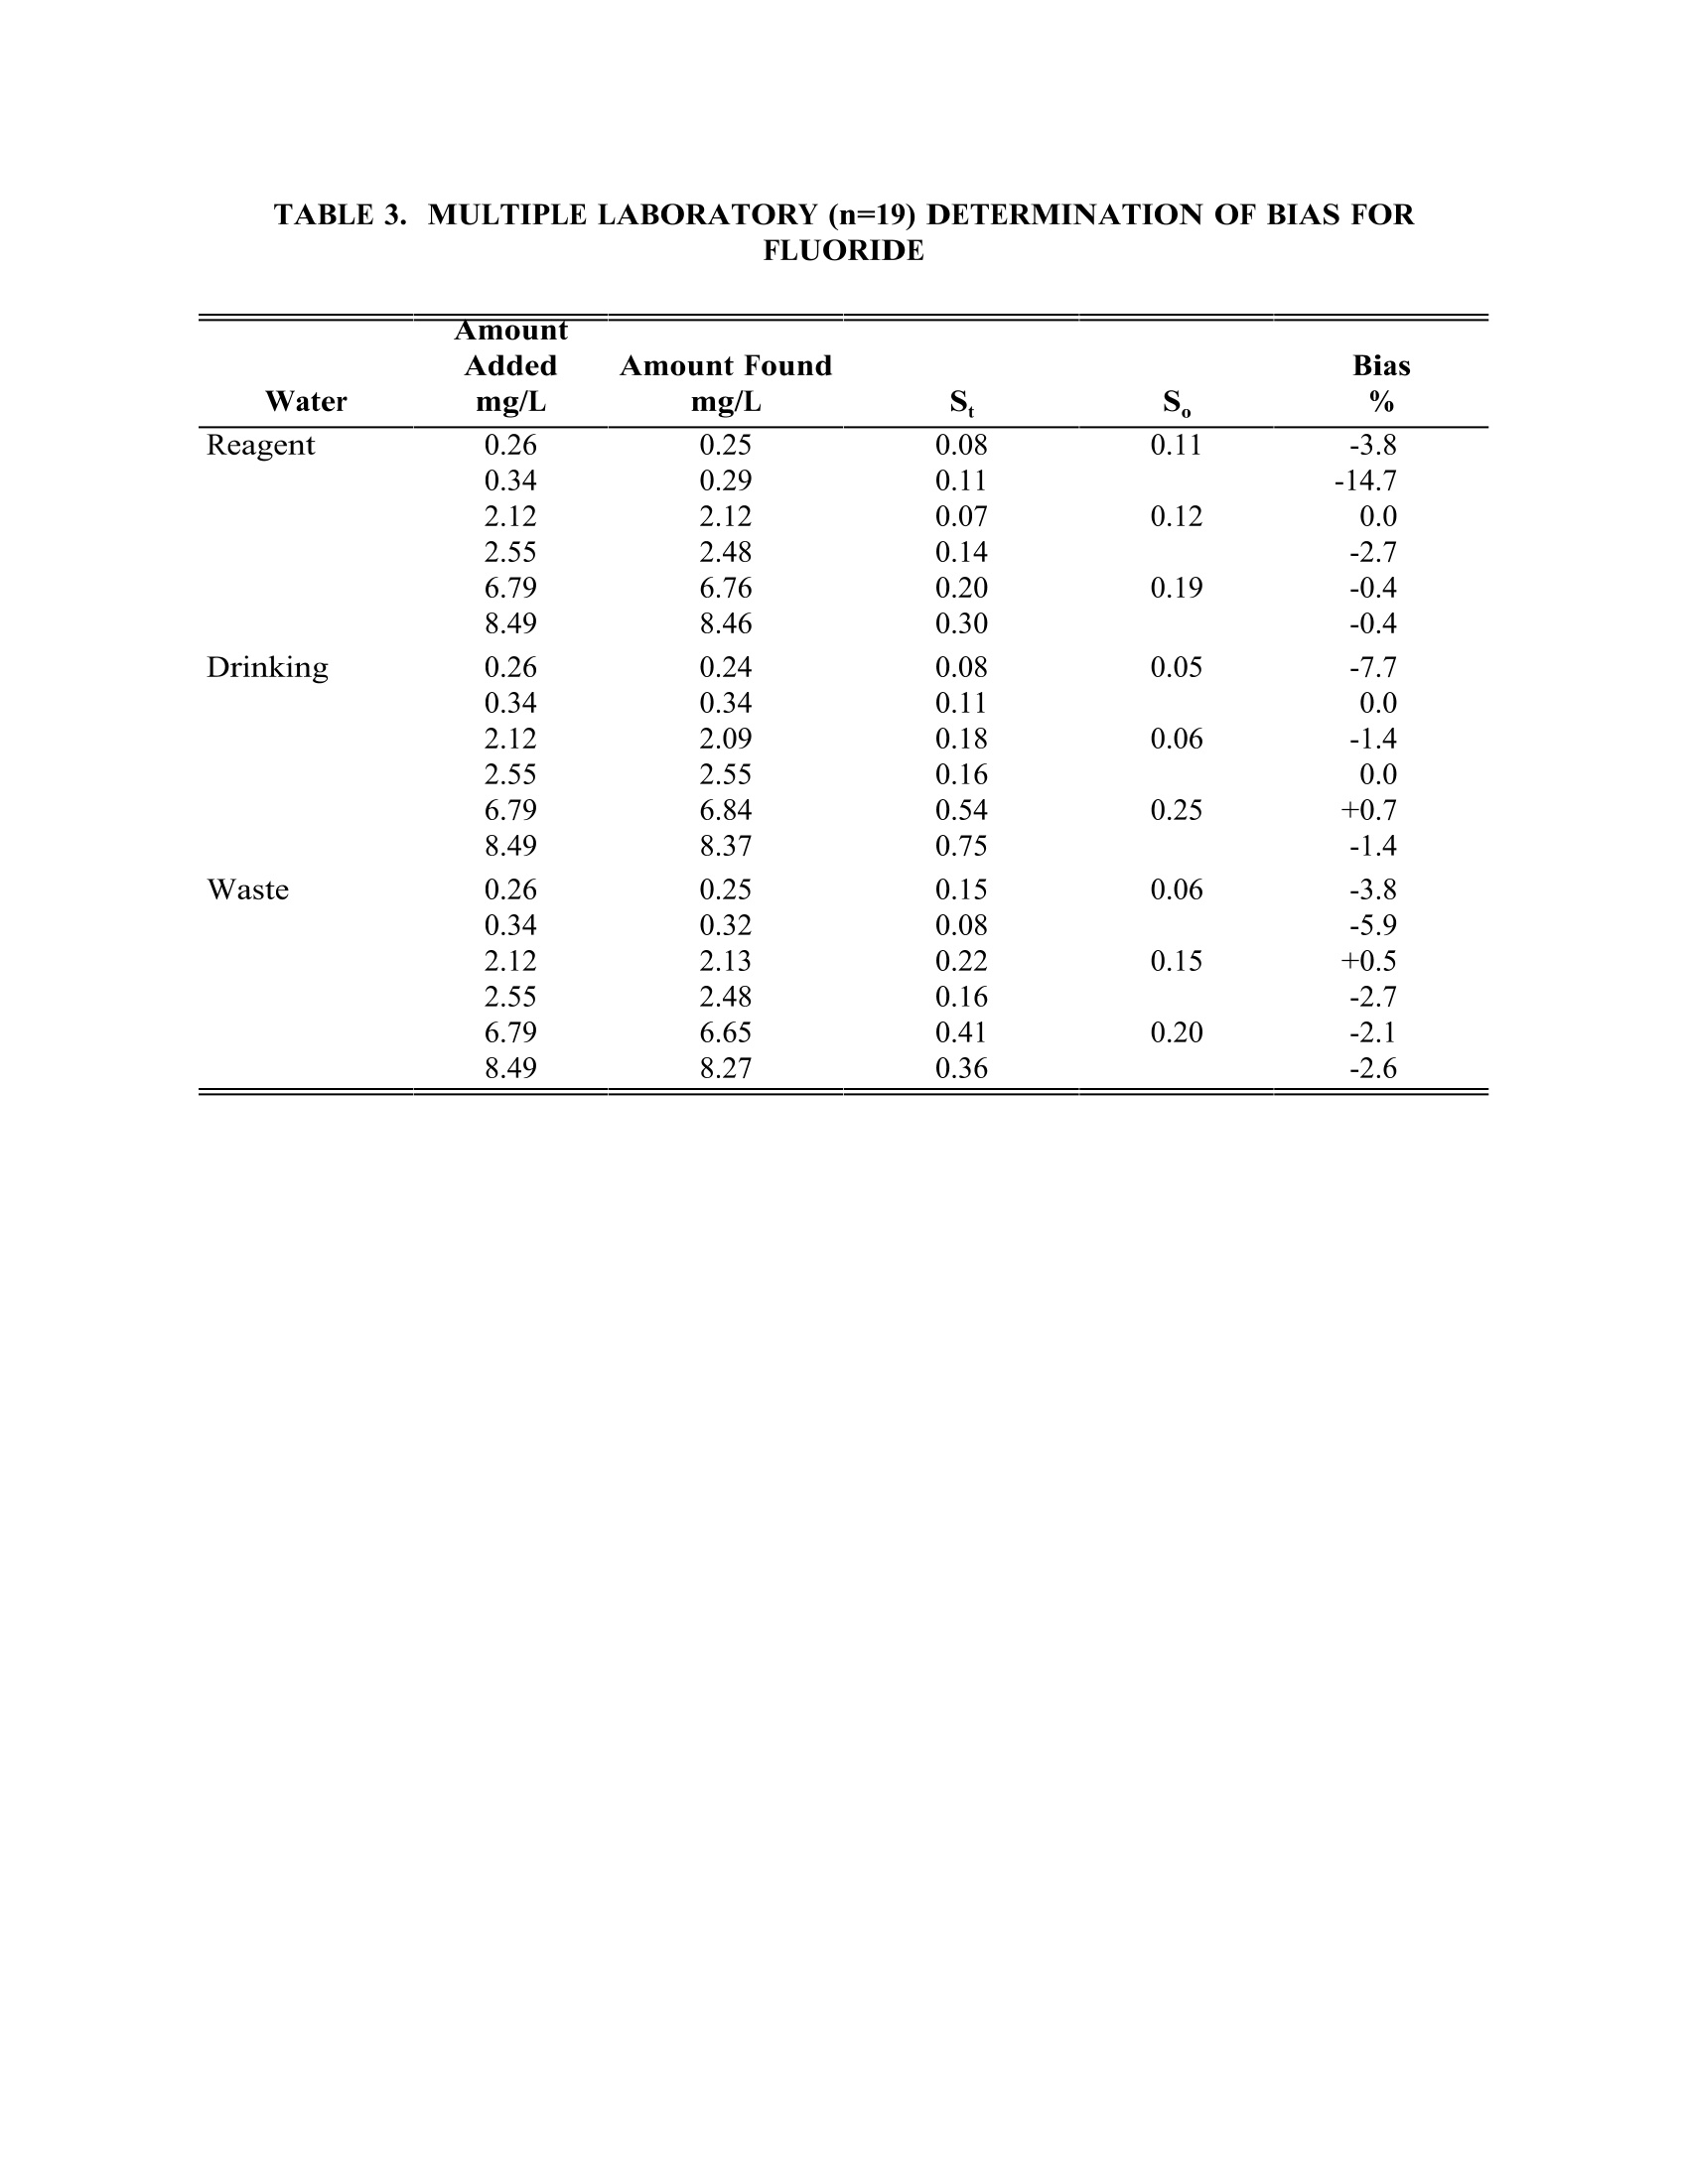
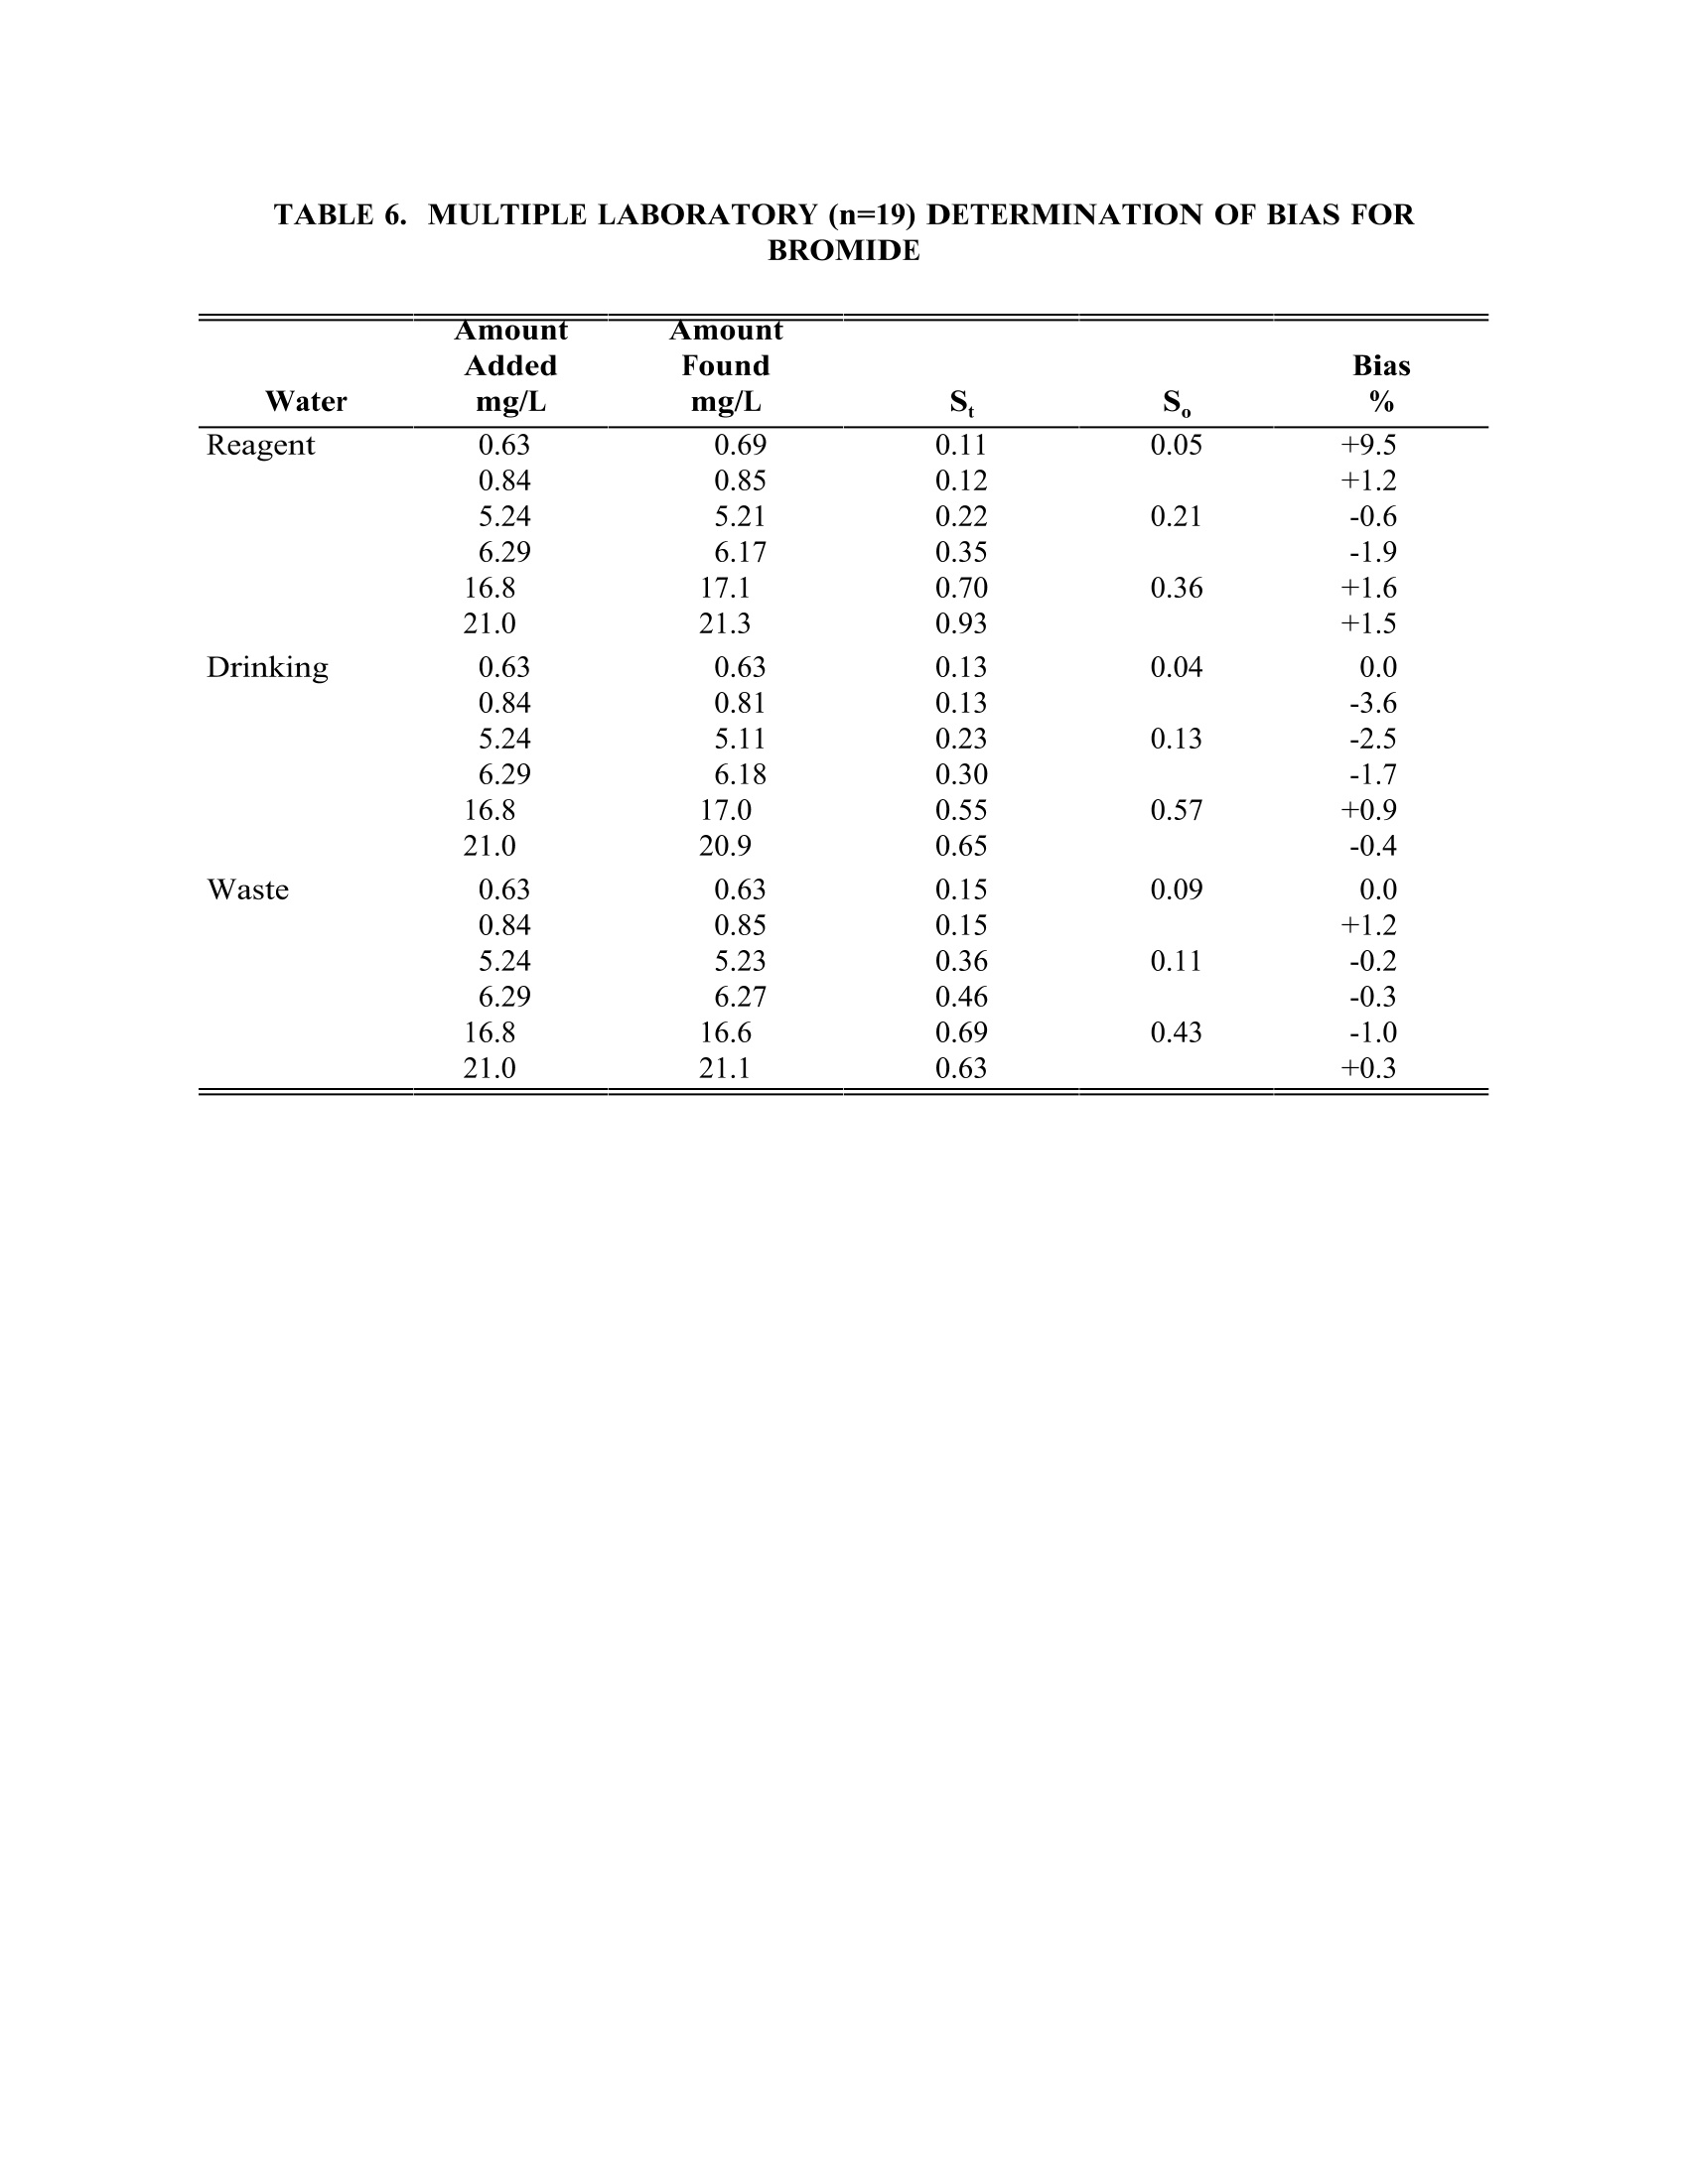
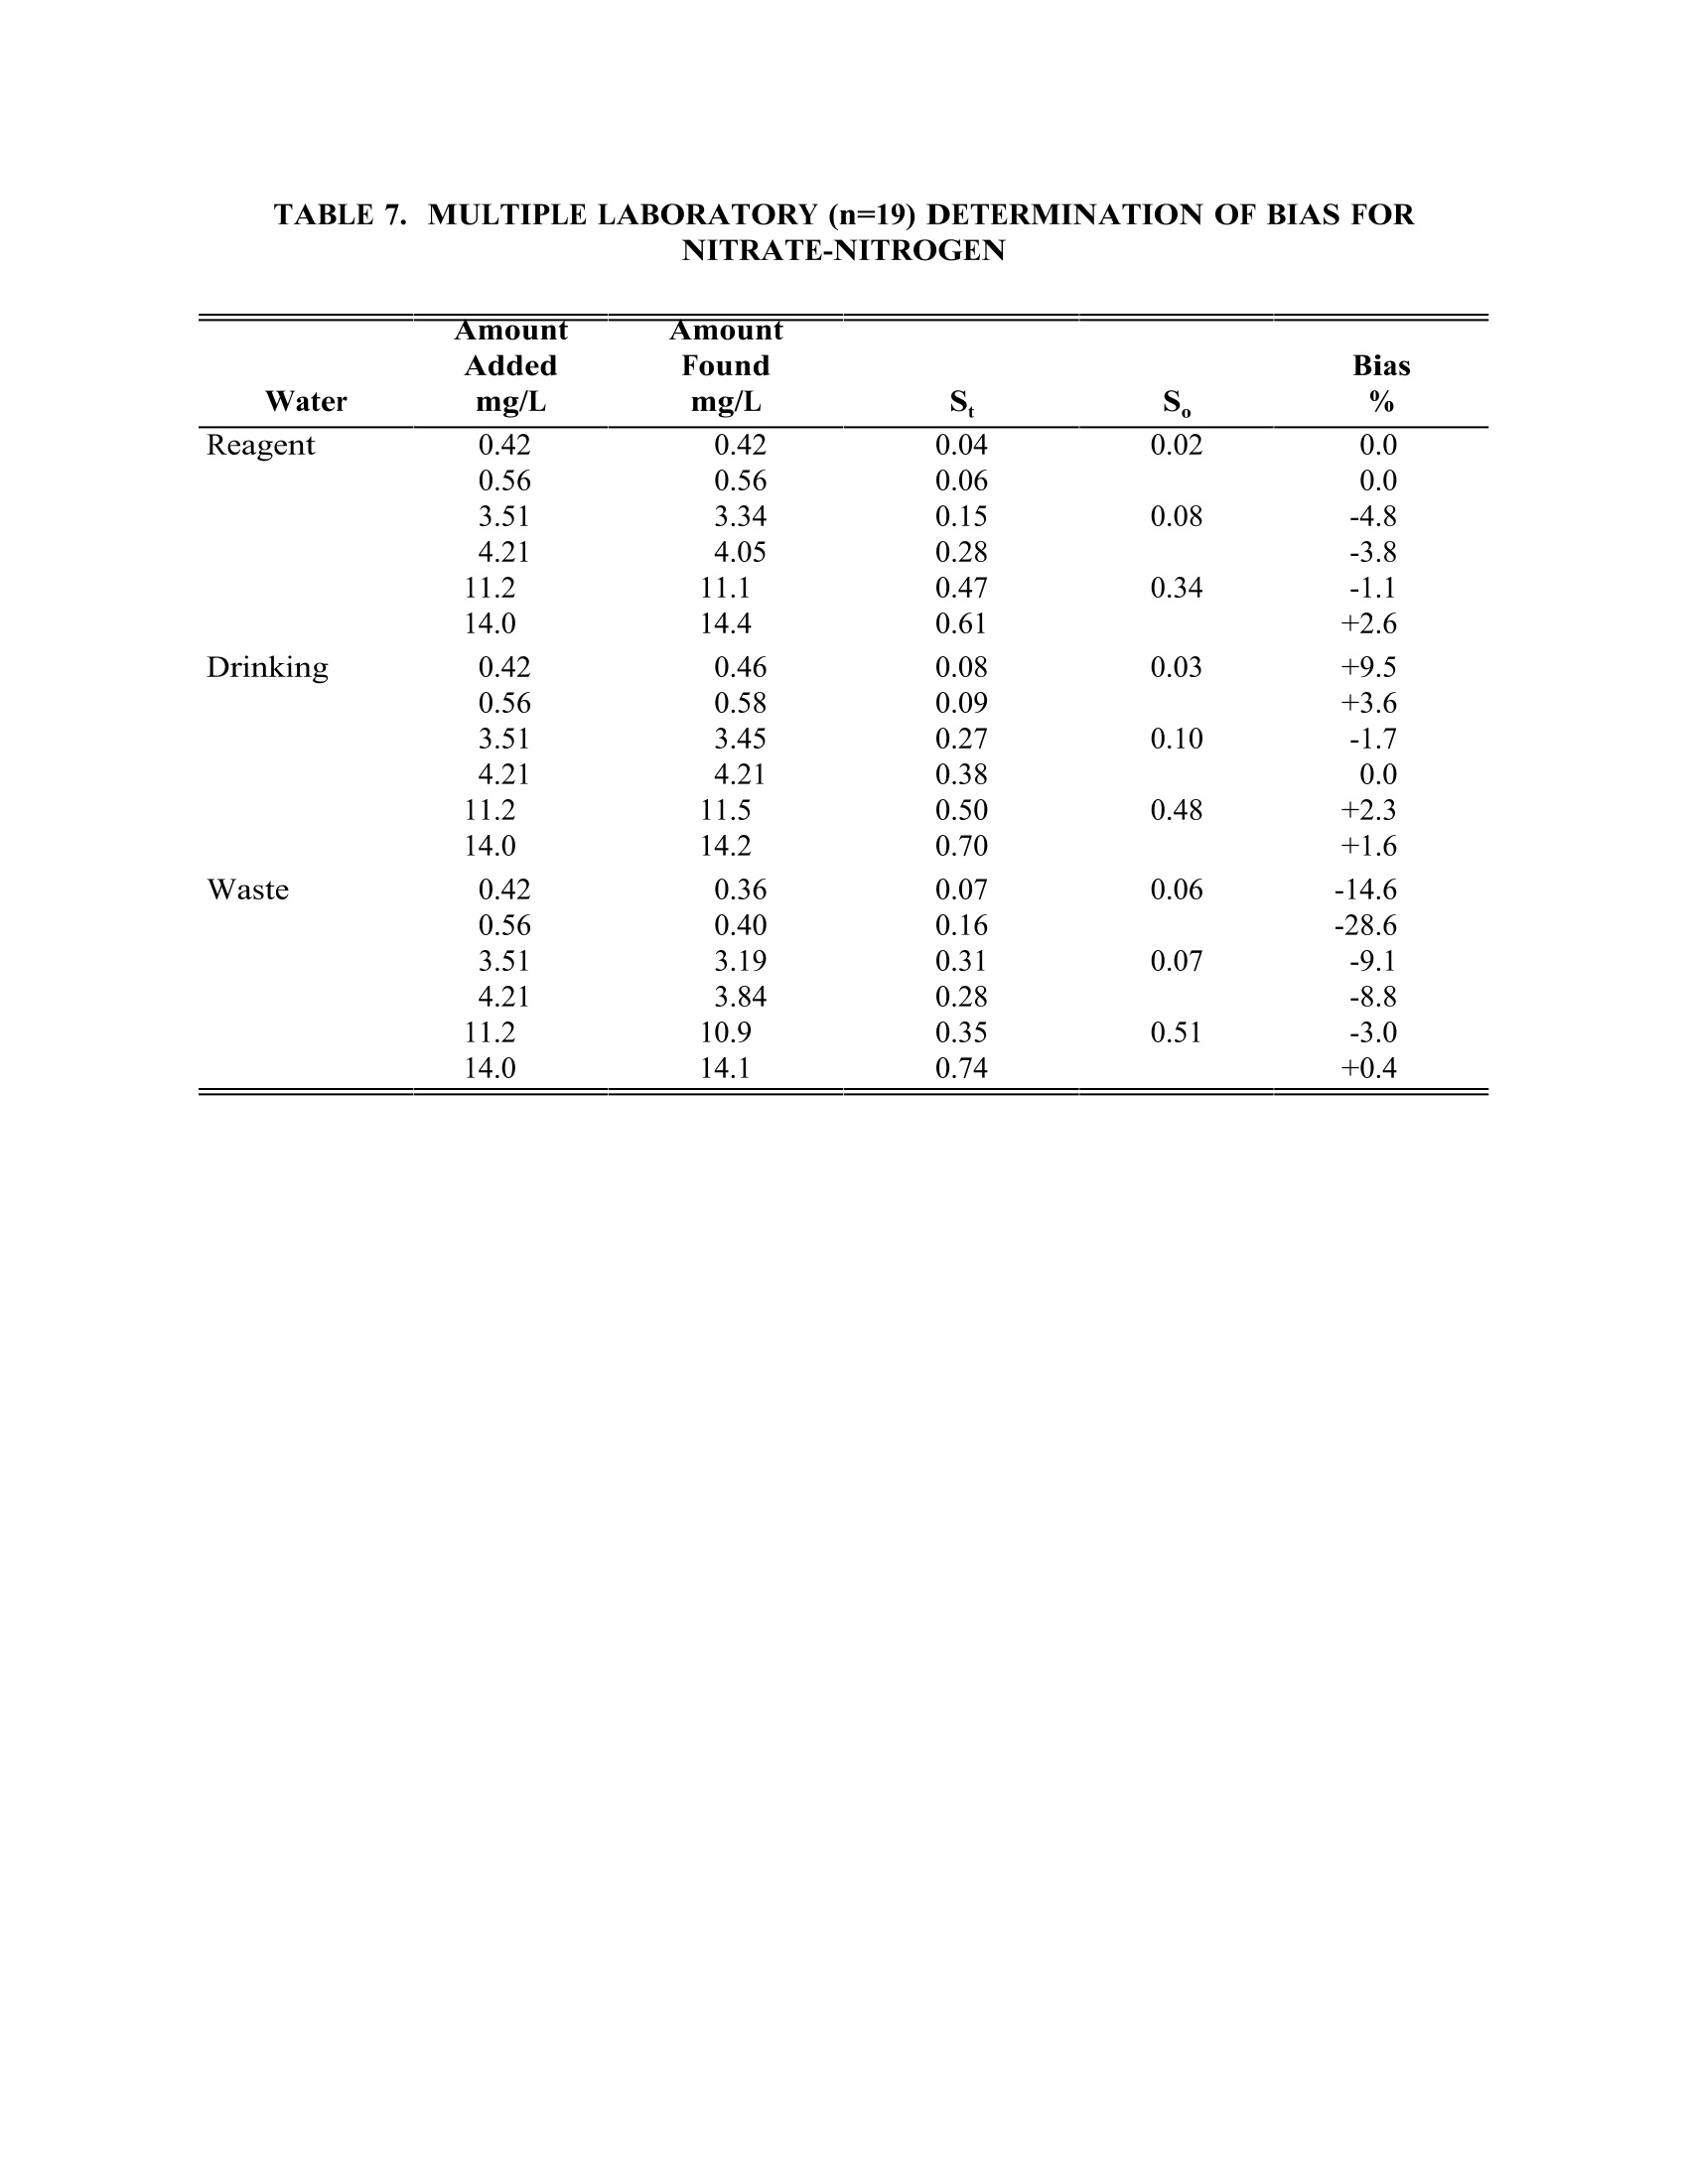
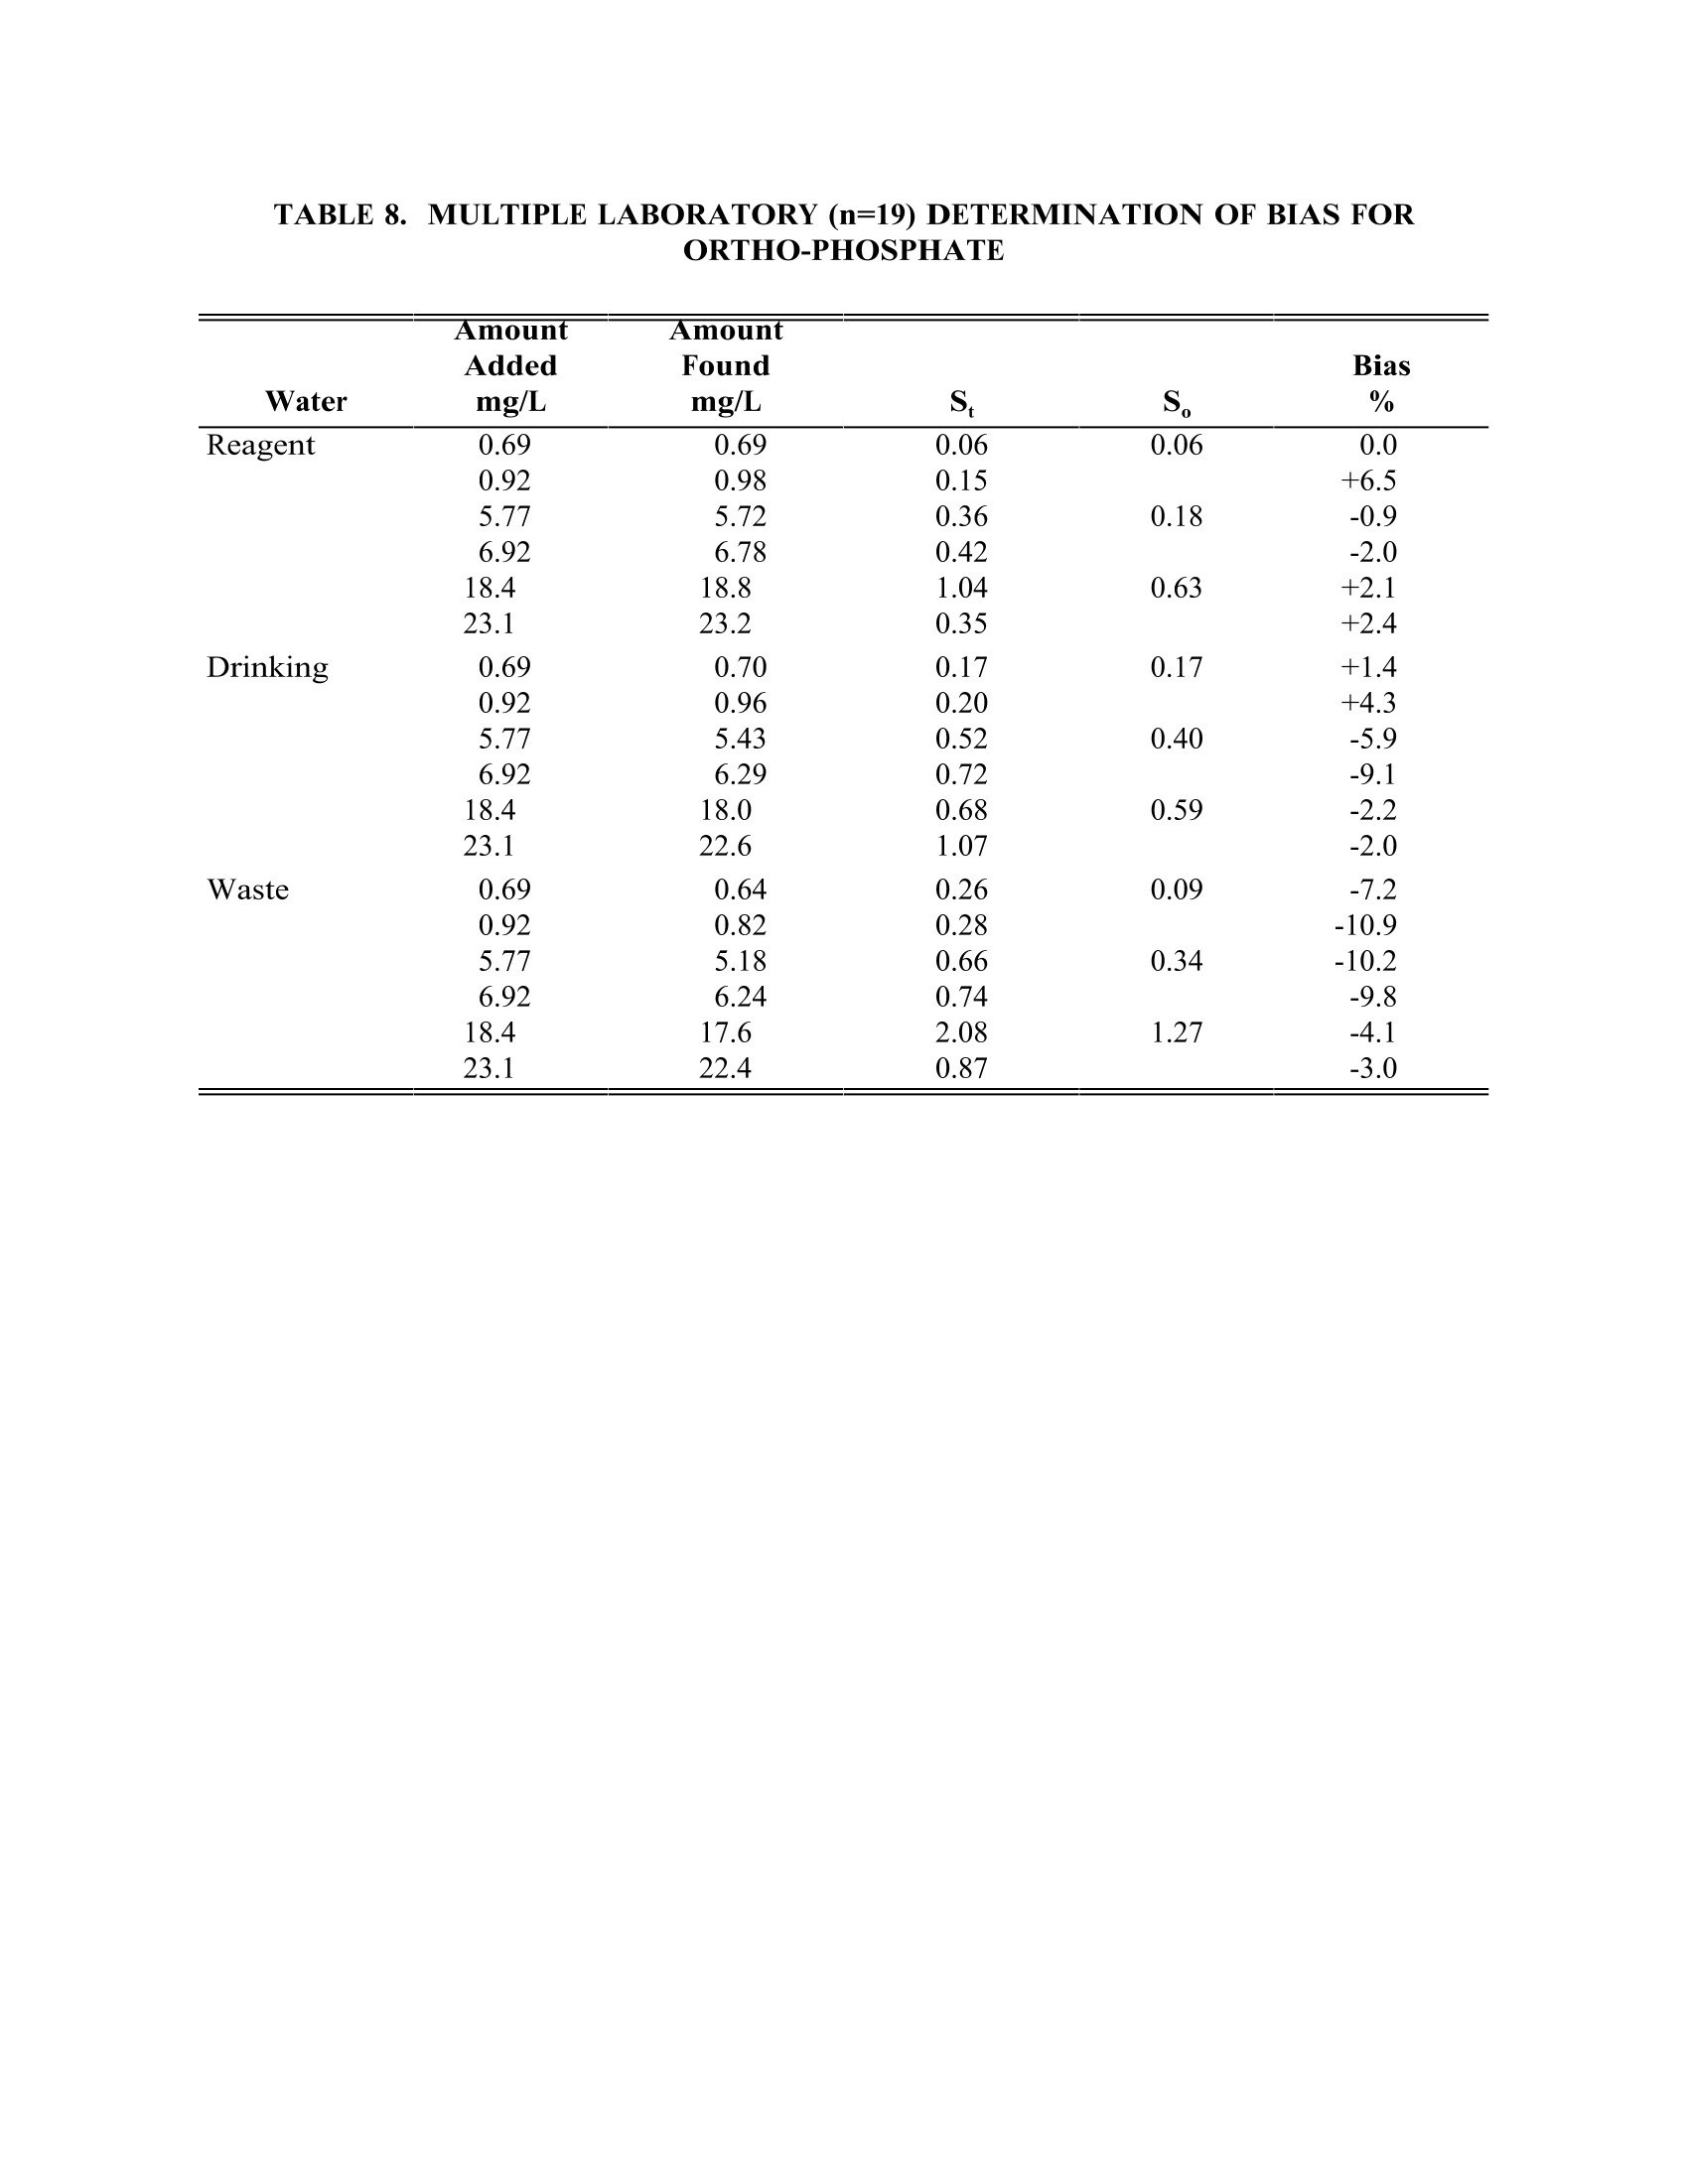
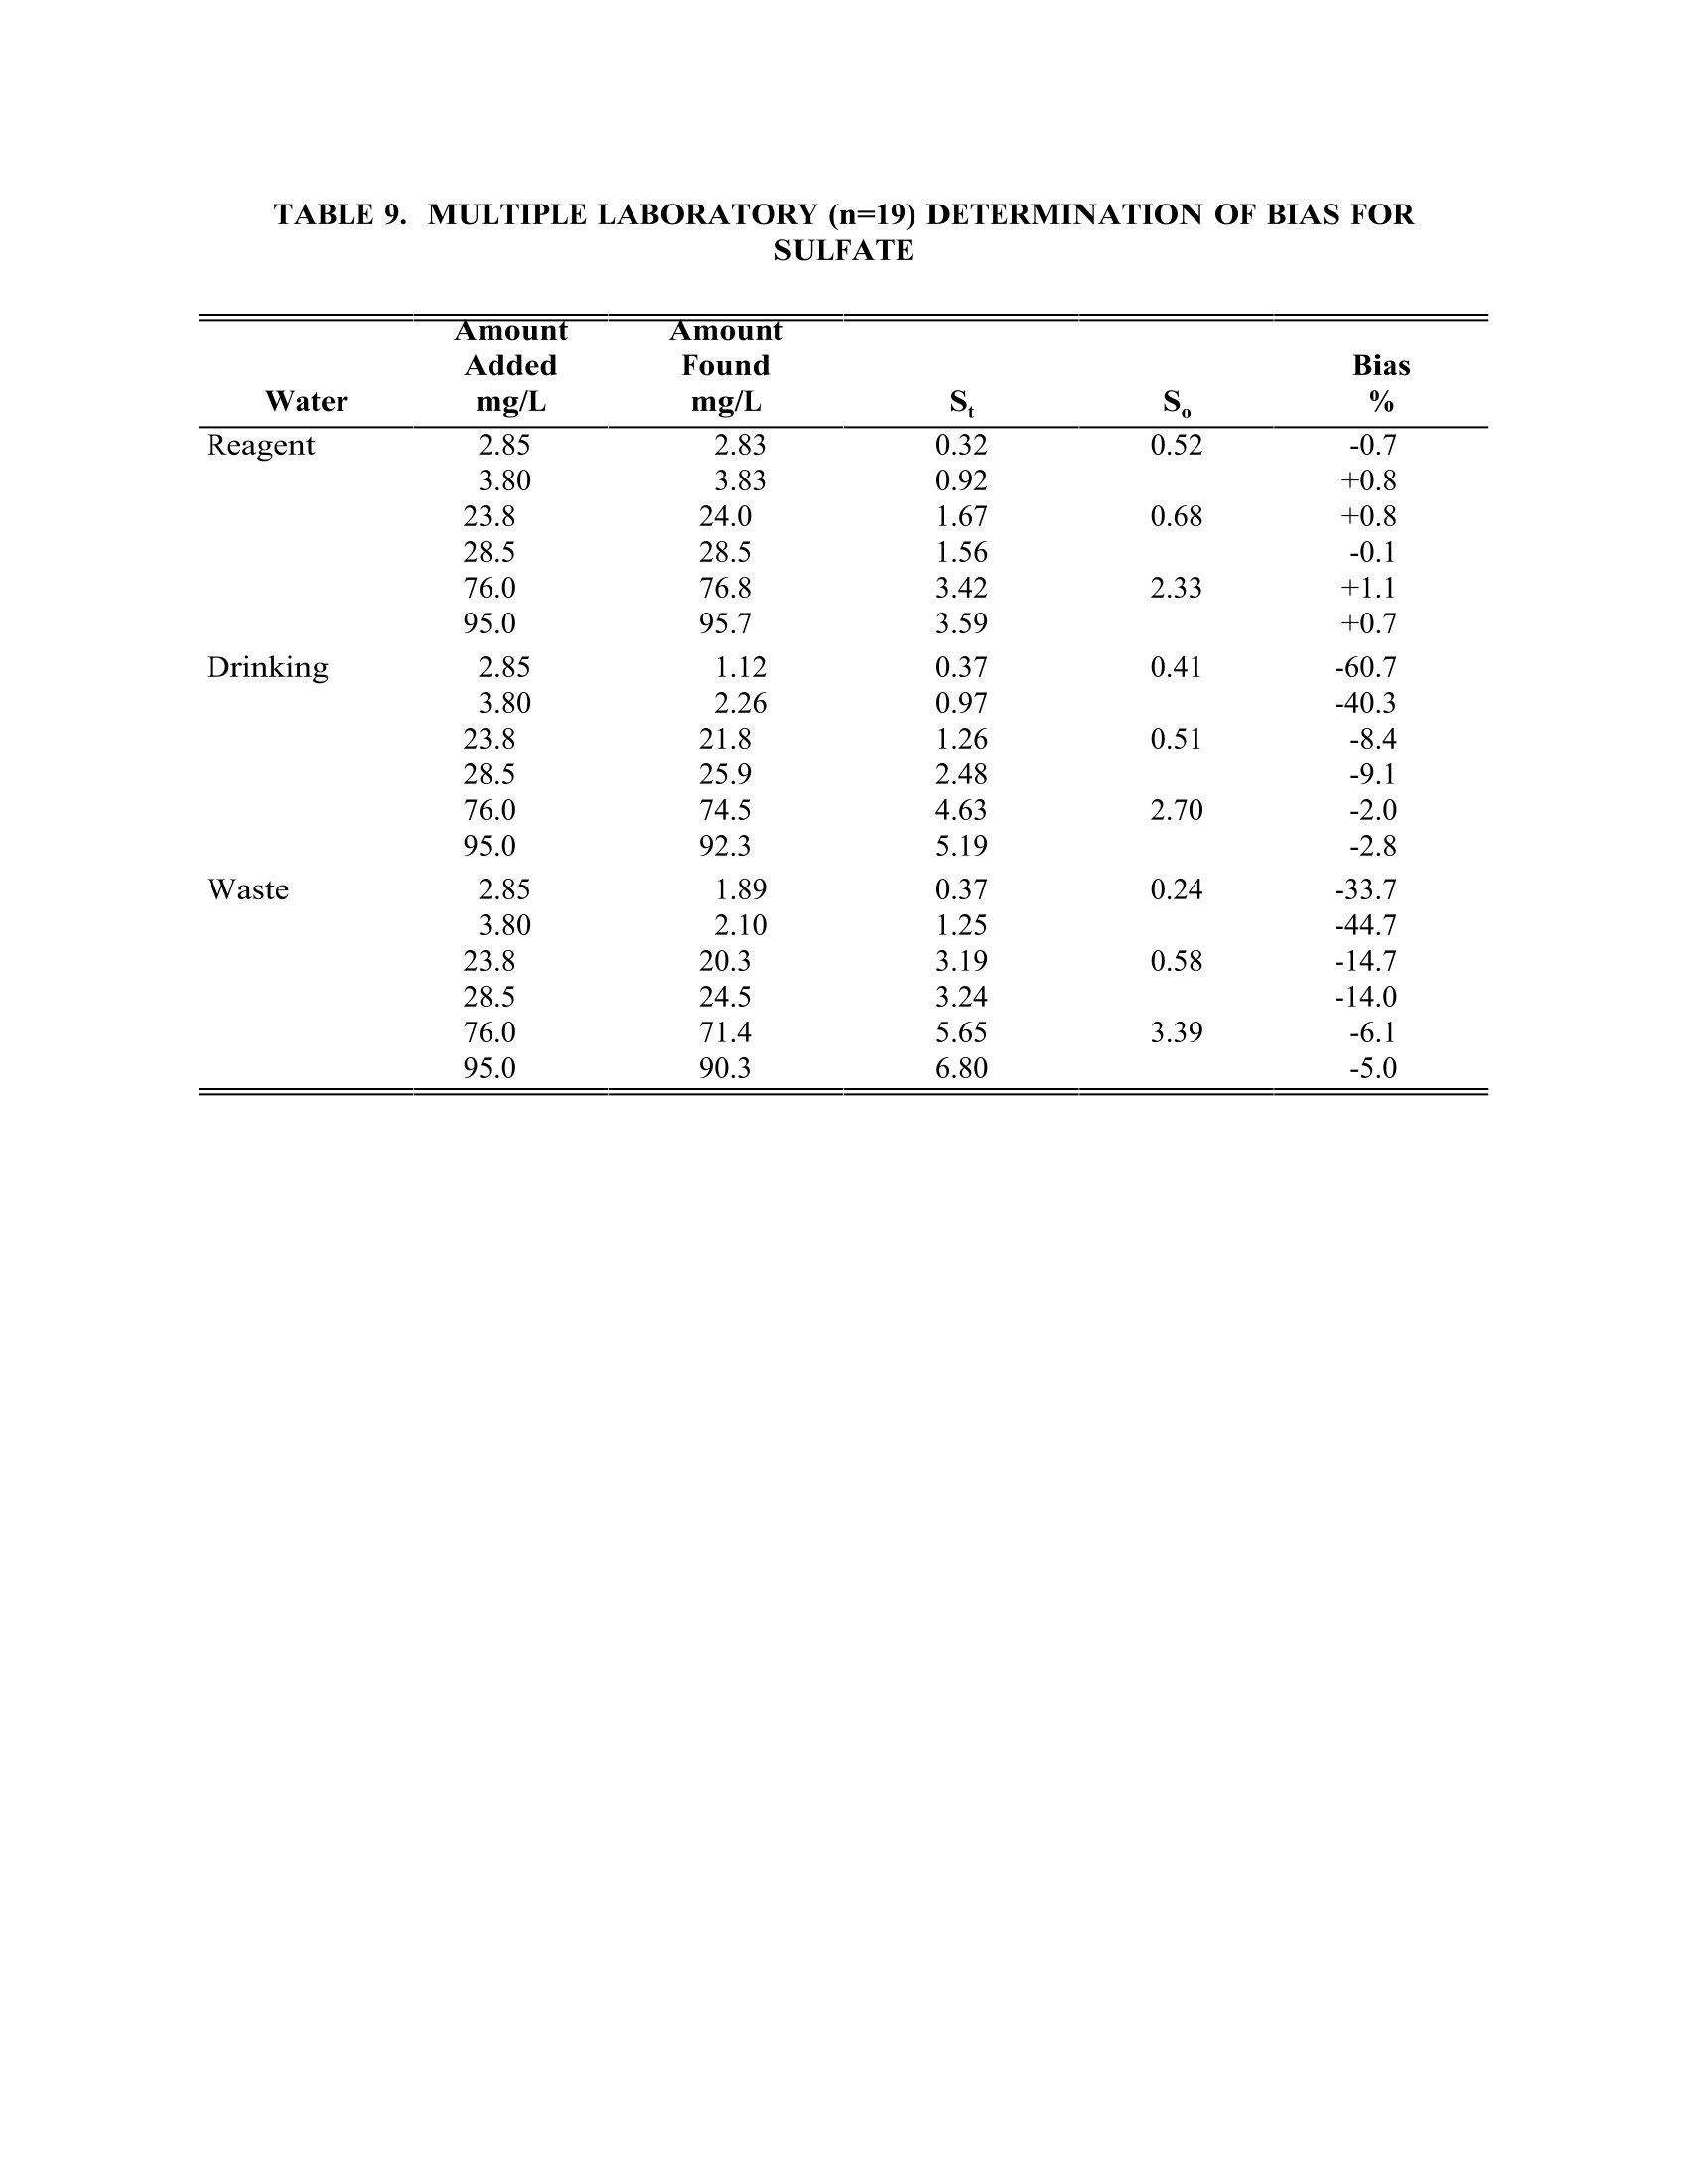
TABLE4. IMULTIPLE LABORATORY (n=19) DETERMINATION OF BIAS FORCHLORIDE METHOD 300.0DETERMINATION OF INORGANIC ANIONS BY ION CHROMATOGRAPHY John D. Pfaff Inorganic Chemistry Branch Chemistry Research Division Revision 2.1 August 1993 ENVIRONMENTAL MONITORING SYSTEMS LABORATORY OFFICE OF RESEARCH AND DEVELOPMENT U.S. ENVIRONMENTAL PROTECTION AGENCY CINCINNATI,OHIO 45268 METHOD 300.0DETERMINATION OF INORGANIC ANIONS BY ION CHROMATOGRAPHY 1.0 SCOPE AND APPLICATION 1.1 This method covers the determination of the following inorganic anions: PART A. Bromide Nitrite ChlorideOrtho-Phosphate-PFluorideSulfate Nitrate PART B. Bromate Chlorite Chlorate 1.2 The matrices applicable to each method are shown below: 1.2.1 Drinking water, surface water, mixed domestic and industrialwastewaters, groundwater, reagent waters, solids (after extraction 11.7),leachates (when no acetic acid is used). 1.2.2 Drinking water and reagent waters 1.3 The single laboratory Method Detection Limit (MDL defined in Section 3.2) forthe above analytes is listed in Tables 1A and 1B. The MDL for a specificmatrix may differ from those listed, depending upon the nature of the sample. 1.4 Method A is recommended for drinking and wastewaters.The multilaboratoryranges tested for each anion are as follows: Bromide 0.63-21.0 Chloride 0.78-26.0 Fluoride 0.26-8.49 Nitrate-N 0.42-14.0 Nitrite-N 0.36-12.0 Otho-Phosphate-P 0.69-23.1 Sulfate 2.85-95.0 1.5 This method is recommended for use only by or under the supervision ofanalysts experienced in the use of ion chromatography and in theinterpretation of the resulting ion chromatograms. 1.6 When this method is used to analyze unfamiliar samples for any of the aboveanions, anion identification should be supported by the use of a fortifiedsample matrix covering the anions of interest.The fortification procedure isdescribed in Section 11.6. 1.7 Users of the method data should state the data-quality objectives prior toanalysis. Users of the method must demonstrate the ability to generateacceptable results with this method, using the procedures described inSection 9.0. 2.0 SUMMARY OF METHOD 2.1 A small volume of sample, typically 2-3 mL, is introduced into an ionchromatograph. The anions of interest are separated and measured, using asystem comprised of a guard column, analytical column, suppressor device,and conductivity detector. 2.2 The main differences between Parts A and B are the separator columns andguard columns. Sections 6.0 and 7.0 will elicit the differences. 2.3 An extraction procedure must be performed to use this method for solids(See Section 11.7). 2.4 Limited performance-based method modifications may be acceptable providedthey are fully documented and meet or exceed requirements expressed inSection 9.0, Quality Control. 3.0 DEFINITIONS 3.1 Calibration Blank (CB)-- A volume of reagent water fortified with the samematrix as the calibration standards, but without the analytes, internalstandards, or surrogate analytes. 3.2 Calibration Standard (CAL)-- A solution prepared from the primary dilutionstandard solution or stock standard solutions and the internal standards andsurrogate analytes. The CAL solutions are used to calibrate the instrumentresponse with respect to analyte concentration. 3.3 Field Duplicates (FD) --Two separate samples collected at the same time andplaced under identical circumstances and treated exactly the same throughoutfield and laboratory procedures. Analyses of field duplicates indicate theprecision associated with sample collection, preservation and storage, as wellas with laboratory procedures. 3.4 Instrument Performance Check Solution (IPC) -- A solution of one or moremethod analytes, surrogates, internal standards, or other test substances usedto evaluate the performance of the instrument system with respect to a definedset of criteria. 3.5 Laboratory Fortified Blank (LFB)-- An aliquot of reagent water or other blankmatrices to which known quantities of the method analytes are added in thelaboratory. The LFB is analyzed exactly like a sample, and its purpose is todetermine whether the methodology is in control, and whether the laboratoryis capable of making accurate and precise measurements. 3.6 Laboratory Fortified Sample Matrix (LFM) -- An aliquot of an environmentalsample to which known quantities of the method analytes are added in thelaboratory. The LFM is analyzed exactly like a sample, and its purpose is todetermine whether the sample matrix contributes bias to the analytical results.The background concentrations of the analytes in the sample matrix must bedetermined in a separate aliquot and the measured values in the LFMcorrected for background concentrations. 3.7 Laboratory Reagent Blank (LRB) -- An aliquot of reagent water or other blankmatrices that are treated exactly as a sample including exposure to allglassware, equipment, solvents, reagents, internal standards, and surrogatesthat are used with other samples. The LRB is used to determine if methodanalytes or other interferences are present in the laboratory environment, thereagents, or the apparatus. 3.8 Linear Calibration Range (LCR) -- The concentration range over which theinstrument response is linear. 3.9 Material Safety Data Sheet (MSDS) -- Written information provided byvendors concerning a chemical's toxicity, health hazards, physical properties,fire, and reactivity data including storage, spill,and handling precautions. 3.10 Method Detection Limit (MDL) --The minimum concentration of an analytethat can be identified, measured and reported with 99% confidence that theanalyte concentration is greater than zero. 3.11 Performance Evaluation Sample (PE)-- A solution of method analytes distributed by the Quality Assurance Research Division (QARD),Environmental Monitoring Systems Laboratory (EMSL-Cincinnati), U. S.Environmental Protection Agency, Cincinnati, Ohio, to multiple laboratories foranalysis. A volume of the solution is added to a known volume of reagentwater and analyzed with procedures used for samples. Results of analyses areused by QARD to determine statistically the accuracy and precision that can beexpected when a method is performed by a competent analyst. Analyte truevalues are unknown to the analyst. 3.12 Quality Control Sample (QCS)--A solution of method analytes of knownconcentrations that is used to fortify an aliquot of LRB or sample matrix.TheQCS is obtained from a source external to the laboratory and different fromthe source of calibration standards. It is used to check laboratory performancewith externally prepared test materials. 3.13 Stock Standard Solution (SSS) -- A concentrated solution containing one ormore method analytes prepared in the laboratory using assayed referencematerials or purchased from a reputable commercial source. 4.0 INTERFERENCES 4.1 Interferences can be caused by substances with retention times that are similarto and overlap those of the anion of interest. Large amounts of an anion caninterfere with the peak resolution of an adjacent anion. Sample dilutionand/or fortification can be used to solve most interference problems associatedwith retention times. 4.2 The water dip or negative peak that elutes near, and can interfere with, thefluoride peak can usually be eliminated by the addition of the equivalent of 1mL of concentrated eluent (7.3 100X) to 100 mL of each standard and sample. 4.3 Method interferences may be caused by contaminants in the reagent water,reagents, glassware, and other sample processing apparatus that lead todiscrete artifacts or elevated baseline in ion chromatograms. 4.4 Samples that contain particles larger than 0.45 microns and reagent solutionsthat contain particles larger than 0.20 microns require filtration to preventdamage to instrument columns and flow systems. 4.5 Any anion that is not retained by the column or only slightly retained willelute in the area of fluoride and interfere. Known coelution is caused bycarbonate and other small organic anions. At concentrations of fluoride above1.5 mg/L, this interference may not be significant, however, it is theresponsibility of the user to generate precision and accuracy information ineach sample matrix. 4.6 The acetate anion elutes early during the chromatographic run. The retentiontimes of the anions also seem to differ when large amounts of acetate arepresent. Therefore, this method is not recommended for leachates of solidsamples when acetic acid is used for pH adjustment. 4.7 The quantitation of unretained peaks should be avoided, such as lowmolecular weight organic acids (formate, acetate, propionate etc.) which areconductive and coelute with or near fluoride and would bias the fluoridequantitation in some drinking and most waste waters. 4.8 Any residual chlorine dioxide present in the sample will result in theformation of additional chlorite prior to analysis. If any concentration ofchlorine dioxide is suspected in the sample purge the sample with an inert gas(argon or nitrogen) for about five minutes or until no chlorine dioxide remains. 5.0 SAFETY 5.1 The toxicity or carcinogenicity of each reagent used in this method have notbeen fully established. Each chemical should be regarded as a potential healthhazard and exposure should be as low as reasonably achievable. Cautions areincluded for known extremely hazardous materials or procedures. 5.2 Each laboratory is responsible for maintaining a current awareness file ofOSHA regulations regarding the safe handling of the chemicals specified inthis method. A reference file of Material Safety Data Sheets (MSDS) should bemade available to all personnel involved in the chemical analysis..Thepreparation of a formal safety plan is also advisable. 5.3 The following chemicals have the potential to be highly toxic or hazardous,consult MSDS. 5.3.1 Sulfuric acid (Section 7.4) 6.0 EQUIPMENT AND SUPPLIES 6.1 Balance -- Analytical, capable of accurately weighing to the nearest 0.0001 g. 6.2 Ion chromatograph -- Analytical system complete with ion chromatograph andall required accessories including syringes, analytical columns, compressedgasses and detectors. 6.2.1 Anion guard column: A protector of the separator column. If omittedfrom the system the retention times will be shorter. Usually packedwith a substrate the same as that in the separator column. 6.2.2 n separator column: This column produces the separation shownin Figures 1 and 2. 6.2.2.1 Anion analytical column (Method A): The separation shown in Figure1 was generated using a Dionex AS4A column (P/N 37041). Anoptional column may be used if comparable resolution of peaks isobtained, and the requirements of Section 9.2 can be met. 6.2.2.2 Anion analytical column (Method B): The separation shown in Figure 2was generated using a Dionex AS9 column (P/N 42025). An optionalcolumn may be used if comparable resolution of peaks is obtained andthe requirements of Section 9.2 can be met. 6.2.3 Anion suppressor device: The data presented in this method weregenerated using a Dionex anion micro membrane suppressor(P/N 37106). 6.2.4 Detector -- Conductivity cell: Approximately 1.25 uL internal volume,(Dionex, or equivalent) capable of providing data as required inSection 9.2. 6.3 The Dionex AI-450 Data Chromatography Software was used to generate allthe data in the attached tables. Systems using a stripchart recorder andintegrator or other computer based data system may achieve approximatelythe same MDL's but the user should demonstrate this by the procedureoutlined in Section 9.2. 7.0 REAGENTS AND STANDARDS 7.1 Sample bottles: Glass or polyethylene of sufficient volume to allow replicateanalyses of anions of interest. 7.2 Reagent water: Distilled or deionized water, free of the anions of interest.Water should contain particles no larger than 0.20 microns. 7.3 Eluent solution (Method A and Method B): Sodium bicarbonate(CASRN 144-55-8) 1.7 mM, sodium carbonate (CASRN 497-19-8) 1.8 mM.Dissolve 0.2856 g sodium bicarbonate (NaHCO;) and 0.3816 g of sodiumcarbonate (Na,CO,) in reagent water (Section 7.2) and dilute to 2 L. 7.4 Regeneration solution (micro membrane suppressor): Sulfuric acid(CASRN-7664-93-9) 0.025N. Dilute 2.8 mL conc. sulfuric acid (H,SO) to 4 Lwith reagent water. 7.5 Stock standard solutions, 1000 mg/L (1 mg/mL): Stock standard solutionsmay be purchased as certified solutions or prepared from ACS reagent gradematerials (dried at 105°℃ for 30 minutes) as listed below. 7.5.1 Bromide (Br) 1000 mg/L: Dissolve 1.2876 g sodium bromide (NaBr,CASRN 7647-15-6) in reagent water and dilute to 1 L. 7.5.2 Bromate (BrO,)1000 mg/L: Dissolve 1.1798g of sodium bromate(NaBrO3, CASRN 7789-38-0) in reagent water and dilute to 1 L. 7.5.3 Chlorate (C10,) 1000 mg/L: Dissolve 1.2753g of sodium chlorate(NaC10, CASRN 7775-09-9) in reagent water and dilute to 1 L. 7.5.4 Chloride (Cl) 1000 mg/L: Dissolve 1.6485 g sodium chloride (NaCl,CASRN 7647-14-5) in reagent water and dilute to 1 L. 7.5.5 Chlorite (C10,) 1000 mg/L: Dissolve 1.3410g of sodium chlorite(NaC10, CASRN 7758-19-2) in reagent water and dilute to 1 L. 7.5.6 Fluoride (F ) 1000 mg/L: Dissolve 2.2100g sodium fluoride (NaF,CASRN 7681-49-4) in reagent water and dilute to 1 L. 7.5.7 Nitrate (NO,-N) 1000 mg/L: Dissolve 6.0679 g sodium nitrate (NaNO,CASRN 7631-99-4) in reagent water and dilute to 1 L. 7.5.8 Nitrite (NO,-N) 1000 mg/L: Dissolve 4.9257 g sodium nitrite (NaNO,CASRN 7632-00-0) in reagent water and dilute to 1 L. 7.5.9 Phosphate (PO 4-P) 1000 mg/L: Dissolve 4.3937 g potassium phosphate(KH,PO4, CASRN 7778-77-0) in reagent water and dilute to 1 L. 7.5.10Sulfate (SO4) 1000 mg/L: Dissolve 1.8141 g potassium sulfate (K SQ,CASRN 7778-80-5) in reagent water and dilute to 1 L. Note: Stability of standards: Stock standards (7.5) are stable for atleast one month when stored at 4°C. Except for the chlorite standardwhich is only stable for two weeks. Dilute working standards shouldbe prepared weekly, except those that contain nitrite and phosphateshould be prepared fresh daily. 7.6 Ethylenediamine preservation solution: Dilute 10 mL of ethylenediamine (99%)(CASRN 107-15-3) to 200 mL with reagent water. Use 1 mL of this dilution toeach 1 L of sample taken. 8.0 SAMPLE COLLECTION.PRESERVATION AND STORAGE 8.1 Samples should be collected in plastic or glass bottles. All bottles must bethoroughly cleaned and rinsed with reagent water. Volume collected shouldbe sufficient to insure a representative sample, allow for replicate analysis, ifrequired, and minimize waste disposal. 8.2 Sample preservation and holding times for the anions that can be determinedby this method are as follows: Bromate None required 28 days Bromide None required 28 days Chlorate None required 28 days Chloride None required 28 days Chlorite Cool to 4°C immediately Fluoride None required 28 days Nitrate-N Cool to 4°C 48 hours Combined conc. H,SO4 28 days (Nitrate/Nitrite) to a pH<2 Nitrite-N Cool to 4°C 48 hours 0-Phosphate-P Cool to 4°C 48 hours Sulfate Cool to 4°C 28 days Note: If the determined value for the combined nitrate/nitrite exceeds0.5 mg/L as N, a resample must be analyzed for the individual concentrationsof nitrate and nitrite. 8.3 The method of preservation and the holding time for samples analyzed by thismethod are determined by the anions of interest. In a given sample, the anionthat requires the most preservation treatment and the shortest holding timewill determine the preservation treatment. It is recommended that all samples be cooled to 4C and held for no longer than 28 days for Method A andanalyzed immediately in Method B. Note: If the sample cannot be analyzed for chlorite within ≤10 minutes, thesample may be preserved by adding 1 mL of the ethylenediamine (EDA)preservation solution (Section 7.6) to 1 L of sample. This will preserve theconcentration of the chlorite for up to 14 days. This addition of EDA has noeffect on bromate or chlorate, so they can also be determined in a samplepreserved with EDA. Residual chlorine dioxide should be removed from thesample (per Section 4.8) prior to the addition of EDA. 9.0 QUALITY CONTROL 9.1 Each laboratory using this method is required to operate a formal qualitycontrol (QC) program. The minimum requirements of this program consist ofan initial demonstration of laboratory capability, and the periodic analysis oflaboratory reagent blanks, fortified blanks and other laboratory solutions as acontinuing check on performance. The laboratory is required to maintainperformance records that define the quality ofthe data that are generated. 9.2 INITIAL DEMONSTRATION OF PERFORMANCE 9.2.1 The initial demonstration of performance is used to characterizeinstrument performance (determination of LCRs and analysis of QCS)and laboratory performance (determination of MDLs) prior toperforming analyses by this method. 9.2.2 Linear Calibration Range (LCR)-- The LCR must be determinedinitially and verified every six months or whenever a significant changein instrument response is observed or expected. The initialdemonstration of linearity must use sufficient standards to insure thatthe resulting curve is linear. The verification of linearity must use aminimum of a blank and three standards. If any verification dataexceeds the initial values by ±10%, linearity must be reestablished. Ifany portion of the range is shown to be nonlinear, sufficient standardsmust be used to clearly define the nonlinear portion. 9.2.3 Quality Control Sample (QCS) -- When beginning the use of thismethod, on a quarterly basis or as required to meet data-quality needs,verify the calibration standards and acceptable instrument performancewith the preparation and analyses of a QCS. If the determinedconcentrations are not within ±10% of the stated values, performance ofthe determinative step of the method is unacceptable. The source ofthe problem must be identified and corrected before either proceedingwith the initial determination of MDLs or continuing with on-goinganalyses. 9.2.4 Method Detection Limit (MDL)--MDLs must be established for allanalytes, using reagent water (blank) fortified at a concentration oftwo to three times the estimated instrument detection limit (6) To determineMDL values,take seven replicate aliquots of the fortified reagent waterand process through the entire analytical method. Perform allcalculations defined in the method and report the concentration valuesin the appropriate units. Calculate the MDL as follows: where. t =Student's t value for a 99% confidence leveland a standard deviation estimate with n-1degrees of freedom [t= 3.14 for seven replicates] S = standard deviation of the replicate analyses MDLs should be determined every six months, when a new operatorbegins work or whenever there is a significant change in thebackground or instrument response. 9.3 ASSESSING LABORATORY PERFORMANCE 9.3.1 Laboratory Reagent Blank (LRB) -- The laboratory must analyze at leastone LRB with each batch of samples. Data produced are used to assesscontamination from the laboratory environment..Values that exceed theMDL indicate laboratory or reagent contamination should be suspectedand corrective actions must be taken before continuing the analysis. 9.3.2 Laboratory Fortified Blank (LFB) -- The laboratory must analyze at leastone LFB with each batch of samples. Calculate accuracy as percentrecovery (Section 9.4.2). If the recovery of any analyte falls outside therequired control limits of 90-110%, that analyte is judged out of control,and the source of the problem should be identified and resolved beforecontinuing analyses. 9.3.3 The laboratory must use LFB analyses data to assess laboratoryperformance against the required control limits of 90-110%.Whensufficient internal performance data become available (usually aminimum of 20-30 analyses), optional control limits can be developedfrom the percent mean recovery (x) and the standard deviation (S) ofthe mean recovery. These data can be used to establish the upper andlower control limits as follows: The optional control limits must be equal to or better than the requiredcontrol limits of 90-110%. After each five to 10 new recoverymeasurements, new control limits can be calculated using only the mostrecent 20-30 data points. Also, the standard deviation (S) data should be used to establish an on-going precision statement for the level ofconcentrations included in the LFB. These data must be kept on fileand be available for review. 9.3.4 Instrument Performance Check Solution (IPC) -- For all determinationsthe laboratory must analyze the IPC (a mid-range check standard) anda calibration blank immediately following daily calibration, after everytenth sample (or more frequently, if required) and at the end of thesample run. Analysis of the IPC solution and calibration blankimmediately following calibration must verify that the instrument iswithin ±10% of calibration.Subsequent analyses of the IPC solutionmust verify the calibration is still within ±10%. If the calibration cannotbe verified within the specified limits, reanalyze the IPC solution. If thesecond analysis of the IPC solution confirms calibration to be outsidethe limits, sample analysis must be discontinued, the cause determinedand/or in the case of drift, the instrument recalibrated. All samplesfollowing the last acceptable IPC solution must be reanalyzed. Theanalysis data of the calibration blank and IPC solution must be kept onfile with the sample analyses data. 9.4 ASSESSING ANALYTE RECOVERY AND DATA QUALITY 9.4.1 Laboratory Fortified Sample Matrix (LFM) -- The laboratory must add aknown amount of analyte to a minimum of 10% of the routine samples.In each case the LFM aliquot must be a duplicate of the aliquot usedfor sample analysis..The analyte concentration must be high enough tobe detected above the original sample and should not be less than fourtimes the MDL. The added analyte concentration should be the sameas that used in the laboratory fortified blank. 9.4.1.1 If the concentration of fortification is less than 25% of thebackground concentration of the matrix the matrix recoveryshould not be calculated. 9.4.2 Calculate the percent recovery for each analyte, corrected forconcentrations measured in the unfortified sample, and compare thesevalues to the designated LFM recovery range 90-110%. Percentrecovery may be calculated using the following equation: where. R=percent recovery C=fortified sample concentration C= sample background concentration s= concentration equivalent of analyte added to sample 9.4.3 Until sufficient data becomes available (usually a minimum of 20-30analysis), assess laboratory performance against recovery limits forMethod A of 80-120% and 75-125% for Method B.. When sufficientinternal performance data becomes available develop control limitsfrom percent mean recovery and the standard deviation of the meanrecovery. 9.4.4 If the recovery of any analyte falls outside the designated LFM recoveryrange and the laboratory performance for that analyte is shown to be incontrol (Section 9.3), the recovery problem encountered with the LFM isjudged to be either matrix or solution related, not system related. 9.4.5 Where reference materials are available, they should be analyzed toprovide additional performance data. The analysis of reference samplesis a valuable tool for demonstrating the ability to perform the methodacceptably. 9.4.6 In recognition of the rapid advances occurring in chromatography, theanalyst is permitted certain options, such as the use of differentcolumns and/or eluents, to improve the separations or lower the cost ofmeasurements. Each time such modifications to the method are made,the analyst is required to repeat the procedure in Section 9.2. 9.4.7 It is recommended that the laboratory adopt additional qualityassurance practices for use with this method. The specific practices thatare most productive depend upon the needs of the laboratory and thenature of the samples. Field duplicates may be analyzed to monitor theprecision of the sampling technique. When doubt exists over theidentification of a peak in the chromatogram, confirmatory techniquessuch as sample dilution and fortification, must be used. Wheneverpossible, the laboratory should perform analysis of quality controlcheck samples and participate in relevant performance evaluationsample studies. 9.4.8 At least quarterly, replicates of LFBs should be analyzed to determinethe precision of the laboratory measurements. Add these results to theon-going control charts to document data quality. 9.4.9 When using Part B, the analyst should be aware of the purity of thereagents used to prepare standards. Allowances must be made whenthe solid materials are less than 99% pure. 10.0 CALIBRATION AND STANDARDIZATION 10.1 Establish ion chromatographic operating parameters equivalent to thoseindicated in Tables 1A or 1B. 10.2 For each analyte of interest, prepare calibration standards at a minimum ofthree concentration levels and a blank by adding accurately measured volumesof one or more stock standards (Section 7.5) to a volumetric flask and diluting to volume with reagent water. If a sample analyte concentration exceeds thecalibration range the sample may be diluted to fall within the range. If this isnot possible then three new calibration concentrations must be chosen, two ofwhich must bracket the concentration of the sample analyte of interest. Eachattenuation range of the instrument used to analyze a sample must becalibrated individually. 10.3 Using injections of 0.1-1.0 mL (determined by injection loop volume) of eachcalibration standard, tabulate peak height or area responses against theconcentration. The results are used to prepare a calibration curve for eachanalyte. During this procedure, retention times must be recorded. 10.4 The calibration curve must be verified on each working day, or whenever theanion eluent is changed, and after every 20 samples. If the response orretention time for any analyte varies from the expected values by more than±10%, the test must be repeated, using fresh calibration standards. If theresults are still more than ±10%, a new calibration curve must be prepared forthat analyte. 10.5 Nonlinear response can result when the separator column capacity is exceeded(overloading). The response of the detector to the sample when diluted 1:1,and when not diluted, should be compared. If the calculated responses are thesame, samples of this total anionic concentration need not be diluted. 11.0 PROCEDURE 11.1 Tables 1A and 1B summarize the recommended operating conditions for theion chromatograph. Included in these tables are estimated retention times thatcan be achieved by this method. Other columns, chromatographic conditions,or detectors may be used if the requirements of Section 9.2 are met. 11.2 Check system calibration daily and, if required, recalibrate as described inSection 10.0. 11.3 Load and inject a fixed amount of well mixed sample. Flush injection loopthoroughly, using each new sample. Use the same size loop for standards andsamples. Record the resulting peak size in area or peak height units. Anautomated constant volume injection system may also be used. 11.4 The width of the retention time window used to make identifications shouldbe based upon measurements of actual retention time variations of standardsover the course of a day. Three times the standard deviation of a retentiontime can be used to calculate a suggested window size for each analyte.However, the experience of the analyst should weigh heavily in theinterpretation of chromatograms. 11.5 If the response for the peak exceeds the working range of the system, dilutethe sample with an appropriate amount of reagent water and reanalyze. 11.6 If the resulting chromatogram fails to produce adequate resolution, or ifidentification of specific anions is questionable, fortify the sample with anappropriate amount of standard and reanalyze. Note: Retention time is inversely proportional to concentration. Nitrate andsulfate exhibit the greatest amount of change, although all anions are affectedto some degree. In some cases this peak migration may produce poorresolution or identification. 11.7 The following extraction should be used for solid materials. Add an amountof reagent water equal to 10 times the weight of dry solid material taken as asample. This slurry is mixed for 10 minutes using a magnetic stirring device.Filter the resulting slurry before injecting using a 0.45 u membrane type filter.This can be the type that attaches directly to the end of the syringe. Careshould be taken to show that good recovery and identification of peaks isobtained with the user's matrix through the use of fortified samples. 11.8 It has been reported that lower detection limits for bromate (~7 ug/L) can beobtained using a borate based eluent". The use of this eluent or other eluentsthat improve method performance may be considered as a minor modificationof the method and as such still are acceptable. 11.9 Should more complete resolueItion be needed between peaks the eluent (7.3) canbe diluted. This will spread out the run but will also cause the later elutinganions to be retained longer. The analyst must determine to what extent theeluent is diluted. This dilution should not be considered a deviation from themethod. 12.0 DATA ANALYSIS AND CALCULATIONS 12.1 Prepare a calibration curve for each analyte by plotting instrument responseagainst standard concentration. Compute sample concentration by comparingsample response with the standard curve. Multiply answer by appropriatedilution factor. 12.2 Report only those values that fall between the lowest and the highestcalibration standards. Samples exceeding the highest standard should bediluted and reanalyzed. 12.3 Report results in mg/L. 12.4 Report NO, as N NO, as N HPO as P 13.0 METHODS PERFORMANCE 13.1 Tables 1A and 2A give the single laboratory (EMSL-Cincinnati) MDL for eachanion included in the method under the conditions listed. 13.2 Tables 2A and 2B give the single laboratory (EMSL-Cincinnati) standarddeviation for each anion included in the method in a variety of waters for thelisted conditions. 13.3 Multiple laboratory accuracy and bias data (S,) and estimated single operatorvalues (S,) for reagent, drinking and waste water using Method A are givenfor each anion in Tables 3 through 9. Data from 19 laboratories were used forthis data. 13.4 Some of the bias statements, for example chloride and sulfate, may bemisleading due to spiking small increments of the anion into large naturallyoccurring concentrations of the same anion. 14.0 POLLUTION PREVENTION 14.1 Pollution prevention encompasses any technique that reduces or eliminates thequantity or toxicity of waste at the point of generation. Numerousopportunities for pollution prevention exist in laboratory operation. The EPAhas established a preferred hierarchy of environmental management techniquesthat places pollution prevention as the management option of first choice.Whenever feasible, laboratory personnel should use pollution preventiontechniques to address their waste generation. When wastes cannot be feasiblyreduced at the source, the Agency recommends recycling as the next bestoption. 14.2 Quantity of the chemicals purchased should be based on expected usageduring its shelf life and disposal cost of unused material. Actual reagentpreparation volumes should reflect anticipated usage and reagent stability. 14.3 For information about pollution prevention that may be applicable tolaboratories and research institutions, consult "Less is Better: LaboratoryChemical Management for Waste Reduction," available from the AmericanChemical Society's Department of Government Regulations and Science Policy,1155 16th Street N.W., Washington, D.C. 20036, (202) 872-4477. 15.0 WASTE MANAGEMENT 15.1 The Environmental Protection Agency requires that laboratory wastemanagement practices be conducted consistent with all applicable rules andregulations. Excess reagents, samples and method process wastes should becharacterized and disposed of in an acceptable manner. The Agency urgeslaboratories to protect the air, water, and land by minimizing and controllingall releases from hoods and bench operations, complying with the letter andspirit of any waste discharge permit and regulations, and by complying withall solid and hazardous waste regulations, particularly the hazardous wasteidentification rules and land disposal restrictions. For further information onwaste management consult the "Waste Management Manual for LaboratoryPersonnel",available from the American Chemical Society at the address listedin Section 14.3. 16.0 REFERENCES 1. "Determination of Inorganic Disinfection By-Products by Ion Chromatography",J. Pfaff, C. Brockhoff. J. Am. Water Works Assoc., Vol 82, No. 4, pg 192. 2. Standard Methods for the Examination of Water and Wastewater, Method4110B, "Anions by Ion Chromatography", 18th Edition of Standard Methods(1992). 3. Dionex, System 4000 Operation and Maintenance Manual, Dionex Corp.,Sunnyvale, California 94086,1988. 4. Method Detection Limit (MDL) as described in "Trace Analyses forWastewater", J. Glaser, D. Foerst, G. McKee, S. Quave, W. Budde,Environmental Science and Technology, Vol. 15, Number 12, page 1426,December, 1981. 5. American Society for Testing and Materials. Test Method for Anions in Waterby Chemically-Suppressed Ion Chromatography D4327-91. Annual Book ofStandards, Vol 11.01(1993). 6. Code of Federal Regulations 40, Ch. 1, Pt. 136, Appendix B. 7. Hautman, D.P. & Bolyard, M. Analysis of Oxyhalide Disinfection By-productsand other Anions of Interest in Drinking Water by Ion Chromatography. Jour.of Chromatog., 602,(1992), 65-74. 17.0 TABLES.DIAGRAMS.FLOWCHARTS AND VALIDATIONDATA TABLE 1A. CHROMATOGRAPHIC CONDITIONS AND DETECTION LIMITSIN REAGENT WATER (PART A) Analyte Retention Time MDL Peak ##* (min) (mg/L) Fluoride 1 1.2 0.01 Chloride 2 1.7 0.02 Nitrite-N 3 2.0 0.004 Bromide 4 2.9 0.01 Nitrate-N 5 3.2 0.002 o-Phosphate-P 6 5.4 0.003 Sulfate 7 6.9 0.02 Standard Conditions: Columns: as specified in Sesction 6.2.2.1 Detector: as specified in Section 6.2.4 Pump Rate: 2.0 mL/min. Eluent: as specified in Section 7.3S am p le L oo p :5 0 u L MDL calculated from data system using a y-axis selection of 1000 ns and with astripchart recorder with an attenuator setting of 1 uMHO full scale. *See Figure 1 TABLE 1B.CHROMATOGRAPHIC CONDITIONS AND DETECTION LIMITSIN REAGENT WATER (PART B) Retention Time MDL Analyte Peak # (min) (mg/L) Chlorite 1 2.8 0.01 Bromate 2 3.2 0.02 Chlorate 4 7.1 0.003 Standard Conditions: Column: as specified in Section 6.2.2.2 Detector: as specified in Section 6.2.4 Eluent: as specified in Section 7.3 TABLE 2A. SINGLE-OPERATOR ACCURACY AND BIAS OF STANDARD ANIONS(METHOD A) TABLE 2A. SINGLE-OPERATOR ACCURACY AND BIAS OF STANDARD ANIONS(METHOD A) Mean Standard Sample Known Conc. Number Recovery Deviation Analyte Type (mg/L) of Replicates % (mg/L) TABLE 2B. SINGLE-OPERATOR ACCURACY AND BIAS OF BY-PRODUCT(PART B) Mean Standard Sample Spike Number Recovery Deviation Analyte Type (mg/L) of Replicates % (mg/L) Bromide RW 5.0 7 103 0.07 1.0 98 0.04 0.1 155 0.005 0.05 122 0.01 DW 0.04 0.02 0.005 0.05 0.005 Chlorate RW 97 0.06 0.01 100 0.01 0.05 119 0.05 DW 101 0.04 115 0.01 121 0.005 0.05 110 0.01 Chlorite RW 100 0.04 0.01 0.01 0.05 7 0.01 DW 96 0.03 100 0.02 0.00 0.05 7 9 0.0)11 RW=Reagent Water DW=Drinking Water TABLE 3. MULTIPLE LABORATORY (n=19) DETERMINATION OF BIAS FORFLUORIDE Amount Added Amount Found Bias Water mg/L mg/L S. S. % Reagent 0.26 0.25 0.08 0.11 -3.8 0.34 0.29 0.11 -14.7 2.12 2.12 0.07 0.12 0.0 2.55 2.48 0.14 -2.7 6.79 6.76 0.20 0.19 -0.4 8.49 8.46 0.30 -0.4 Drinking 0.26 0.24 0.08 0.05 -7.7 0.34 0.34 0.11 0.0 2.12 2.09 0.18 0.06 -1.4 2.55 2.55 0.16 0.0 6.79 6.84 0.54 0.25 +0.7 8.49 8.37 0.75 -1.4 Waste 0.26 0.25 0.15 0.06 -3.8 0.34 0.32 0.08 -5.9 2.12 2.13 0.22 0.15 +0.5 2.55 2.48 0.16 -2.7 6.79 6.65 0.41 0.20 -2.1 8.49 8.27 0.36 -2.6 Amount Added Amount Found Bias Water mg/L mg/L S. S. % Reagent 0.78 0.79 0.17 0.29 +1.3 1.04 1.12 0.46 +7.7 6.50 6.31 0.27 0.14 -2.9 7.80 7.76 0.39 -0.5 20.8 20.7 0.54 0.62 -0.5 26.0 25.9 0.58 -0.4 Drinking 0.78 0.54 0.35 0.20 -30.8 1.04 0.51 0.38 -51.0 6.50 5.24 1.35 1.48 -19.4 7.80 6.02 1.90 -22.8 20.8 20.0 2.26 1.14 -3.8 26.0 24.0 2.65 -7.7 Waste 0.78 0.43 0.32 0.39 -44.9 1.04 0.65 0.48 -37.5 6.50 4.59 1.82 0.83 -29.4 7.80 5.45 2.02 -30.1 20.8 18.3 2.41 1.57 -11.8 26.0 23.0 2.50 -11.5 Amount Amount Added Found Bias Water mg/L mg/L S. S. % Reagent 0.36 0.37 0.04 0.04 +2.8 0.48 0.48 0.06 0.0 3.00 3.18 0.12 0.06 +6.0 3.60 3.83 0.12 +6.4 9.60 9.84 0.36 0.26 +2.5 12.0 12.1 0.27 +0.6 Drinking 0.36 0.30 0.13 0.03 -16.7 0.48 0.40 0.14 -16.7 3.00 3.02 0.23 0.12 +0.7 3.60 3.62 0.22 +0.6 9.60 9.59 0.44 0.28 -0.1 12.0 11.6 0.59 -3.1 Waste 0.36 0.34 0.06 0.04 -5.6 0.48 0.46 0.07 -4.2 3.00 3.18 0.13 0.10 +6.0 3.60 3.76 0.18 +4.4 9.60 9.74 0.49 0.26 +1.5 12.0 12.0 0.56 +0.3 TABLE 6. MULTIPLE LABORATORY (n=19) DETERMINATION OF BIAS FORBROMIDE Amount Amount Added Found Bias Water mg/L mg/L S. % Reagent 0.63 0.69 0.11 0.05 +9.5 0.84 0.85 0.12 +1.2 5.24 5.21 0.22 0.21 -0.6 6.29 6.17 0.35 -1.9 16.8 17.1 0.70 0.36 +1.6 21.0 21.3 0.93 +1.5 Drinking 0.63 0.63 0.13 0.04 0.0 0.84 0.81 0.13 -3.6 5.24 5.11 0.23 0.13 -2.5 6.29 6.18 0.30 -1.7 16.8 17.0 0.55 0.57 +0.9 21.0 20.9 0.65 -0.4 Waste 0.63 0.63 0.15 0.09 0.0 0.84 0.85 0.15 +1.2 5.24 5.23 0.36 0.11 -0.2 6.29 6.27 0.46 -0.3 16.8 16.6 0.69 0.43 -1.0 21.0 21.1 0.63 +0.3 Amount Amount Added Found Bias Water mg/L mg/L S S. % Reagent 0.42 0.42 0.04 0.02 0.0 0.56 0.56 0.06 0.0 3.51 3.34 0.15 0.08 -4.8 4.21 4.05 0.28 -3.8 11.2 11.1 0.47 0.34 -1.1 14.0 14.4 0.61 +2.6 Drinking 0.42 0.46 0.08 0.03 +9.5 0.56 0.58 0.09 +3.6 3.51 3.45 0.27 0.10 -1.7 4.21 4.21 0.38 0.0 11.2 11.5 0.50 0.48 +2.3 14.0 14.2 0.70 +1.6 Waste 0.42 0.36 0.07 0.06 -14.6 0.56 0.40 0.16 -28.6 3.51 3.19 0.31 0.07 -9.1 4.21 3.84 0.28 -8.8 11.2 10.9 0.35 0.51 -3.0 14.0 14.1 0.74 +0.4 Amount Amount Added Found Bias Water mg/L mg/L S S. % Reagent 0.69 0.69 0.06 0.06 0.0 0.92 0.98 0.15 +6.5 5.77 5.72 0.36 0.18 -0.9 6.92 6.78 0.42 -2.0 18.4 18.8 1.04 0.63 +2.1 23.1 23.2 0.35 +2.4 Drinking 0.69 0.70 0.17 0.17 +1.4 0.92 0.96 0.20 +4.3 5.77 5.43 0.52 0.40 -5.9 6.92 6.29 0.72 -9.1 18.4 18.0 0.68 0.59 -2.2 23.1 22.6 1.07 -2.0 Waste 0.69 0.64 0.26 0.09 -7.2 0.92 0.82 0.28 -10.9 5.77 5.18 0.66 0.34 -10.2 6.92 6.24 0.74 -9.8 18.4 17.6 2.08 1.27 -4.1 23.1 22.4 0.87 -3.0 TABLE 9. MULTIPLE LABORATORY (n=19) DETERMINATION OF BIAS FORSULFATE Amount Amount Added Found Bias Water mg/L mg/L S. S % Reagent 2.85 2.83 0.32 0.52 -0.7 3.80 3.83 0.92 +0.8 23.8 24.0 1.67 0.68 +0.8 28.5 28.5 1.56 -0.1 76.0 76.8 3.42 2.33 +1.1 95.0 95.7 3.59 +0.7 Drinking 2.85 1.12 0.37 0.41 -60.7 3.80 2.26 0.97 -40.3 23.8 21.8 1.26 0.51 -8.4 28.5 25.9 2.48 -9.1 76.0 74.5 4.63 2.70 -2.0 95.0 92.3 5.19 -2.8 Waste 2.85 1.89 0.37 0.24 -33.7 3.80 2.10 1.25 -44.7 23.8 20.3 3.19 0.58 -14.7 28.5 24.5 3.24 -14.0 76.0 71.4 5.65 3.39 -6.1 95.0 90.3 6.80 -5.0
确定


还剩26页未读,是否继续阅读?

产品配置单

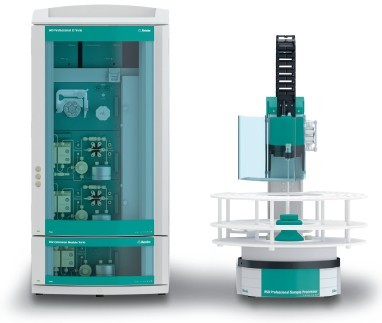
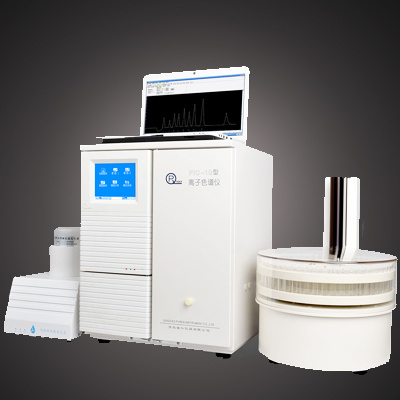
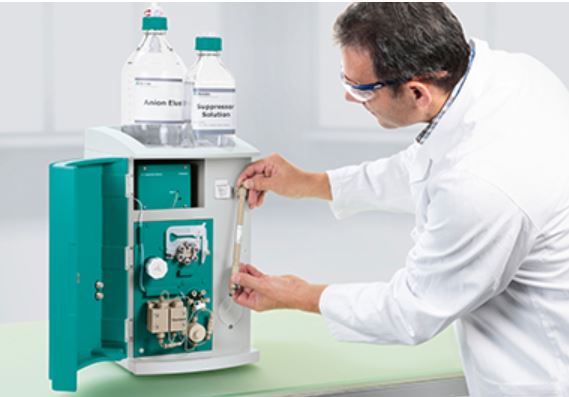
赛默飞色谱与质谱为您提供《饮用水中无机阴离子检测方案 》,该方案主要用于饮用水中无机阴离子检测,参考标准--,《饮用水中无机阴离子检测方案 》用到的仪器有赛默飞戴安ICS-900离子色谱仪、赛默飞ICS5000多功能离子色谱、赛默飞戴安ICS-5000+高压离子色谱系统
推荐专场
相关方案
更多
该厂商其他方案
更多