


方案详情
文
本文报导了一种以最轻微破坏方式取样,鉴定藏书和档案纸中有机成分的快速、直接方法,该方法能够满足收藏、法庭科学和其它应用的需求。采用实时直接分析质谱(DART-MS)分析了已知厂商16种参照纸的纸浆组分和树脂污染物。不经提取、衍生、色谱分离和其它耗费时间和化学试剂的样品处理,即获得了牛皮纸、化学预热机械纸和石墨浆纸的实时质谱图。漂白硬木牛皮纸中含植物甾醇,而漂白软木牛皮纸中没有,这是二者的区别。是否为化学预热机械纸浆牛皮纸,可用木质素热裂解产物进行区分:丁香酚基产物来自硬木、愈创木酚基和香豆素类产物来自软木、化学预热机械纸浆纸。磨木浆纸与其它所有纸张都不同,含大量挥发性提取物。本方法还能立刻区分含松香和烷基烯酮二聚体(AKD)施胶剂的纸。DART-MS方法快速、简便,质谱图可重复。只要用镊子从纸的表面夹取10μg左右的微量样品即可进行分析。得到的标准图谱可用于进一步DART-MS纸张研究,也可以用于Library of Congress开发的打印和书写纸DART-MS可检索谱库。
打印和书写纸张的化学成分因厂商和年代不同而不同。最稳定的欧洲纸是约1650年前用高质量亚麻布手工制作的。这种纸含纤维素长纤维,常常因为碳酸钙和碳酸镁而呈碱性pH,用明胶等外施胶剂进行浸渍处理,以减少或防止用墨水书写时洇纸。17世纪后半叶,机械化和新兴的化学学科开始在造纸业中发挥重要作用。开始用造纸明矾(硫酸铝,Al2(SO4)3•18H2O)改善纸张质量,但那时还不知道Al3+在有水时会发生水解形成酸性(pKa = 5.0)。1世纪和19世纪的工业革命带来了新的造纸设备,并用硫酸和氯作为漂白剂,用麦秆、蔬菜代替布料纤维,用松香胶明矾内施胶剂代替明胶。机械纸浆纤维较短而且纯度低,含有大量木质素和其它植物化学物质,或带酸性或能分解成酸,并造成纸张泛黄。松香施胶剂含有松香酸,需要明矾和酸性pH才能有效施胶。直到20世纪发明了漂白化学木浆,并用碳酸钙作为滤料。20世纪后期,开始出现碱性造纸,采用合成施胶剂烷基烯酮二聚体(AKD)和烯烃基琥珀酸酐(ASA),以及无氯漂白工艺。但世界各地仍在生产含松香明矾施胶剂的酸性纸。目前,国际上倡导绿色技术,21世纪的纸张将使用高产率的化学预热机械和废料再循环纸浆。由此可见,藏书和档案纸张在不断变化,并以不同速度发生着化学降解。
测定不同纸张的各种化学成分,及其对物理和光学长期稳定性的影响,以及保存方式对这些成分的影响,是一项具有挑战性的工作。虽然普遍认为纸张的酸性是稳定性的主要影响因素,但其它化学成分,包括金属离子、木质素、添加剂和降解产物,以及温度、湿度、氧气、光纤和化学污染物等,也将对降解构成影响。研究年代久远的纸张对了解其降解过程非常有益,但纸张原来的性质及其保存条件是多变的,可能以不为人知的方式影响了纸张的理化性质。 为了减少这些变数,现在的研究广泛采用已知厂商的当代参照纸,进行加速老化实验,模拟旧版纸的老化行为。这些参照纸包括二十世纪九十年代初期为欧洲保存委员会生产的一批纸张,以及1995年为ASTM国际标
其它分析方法也用于纸张的研究。用带或不带光谱解卷积和化学计量学分析功能的傅里叶变换(FT)红外、近红外和FT-拉曼光谱,研究纸张降解。这些非破坏性的光谱分析可以发现主要化合物的官能团,但却不能进行特异性的化合物鉴定。用衍生或不衍生的裂解GC(Py-GC)和Py-GC–MS分析纸张和添加物,这些轻微破坏性方法可以对挥发性和/或裂解生成化合物进行鉴定,但GC法受化合物挥发性和热稳定性的限制,而且分析用时较长。
纸张研究需要一种最轻微破坏性取样,能够进行快速高通量分析,及有机化合物鉴定的分析技术。实时直接分析质谱(DART-MS)是一种较新的质谱方法,不经提取、衍生和色谱分离,就能够检测各种基质中全部挥发性、半挥发性、非挥发性极性有机化合物。所分析的固体样品包括书写墨水、细菌全细胞、蝇类昆虫、植物和玩具等。对离子形成机制和灵敏度、重现性影响因素的研究已有报导。
本文首次报导了用正离子DART-MS表征打印和书写纸张的方法。对Whatmann #1 100%棉纤维素纸和15种ASTM-ISR参照纸进行了分析。提出了用特殊技术对微型样品进行全面分析的可重现的灵敏方法。本文比较了用DART-MS和Py-MS得到的正离子,对固体物质DART-MS的离子形成进行了探讨。
方案详情

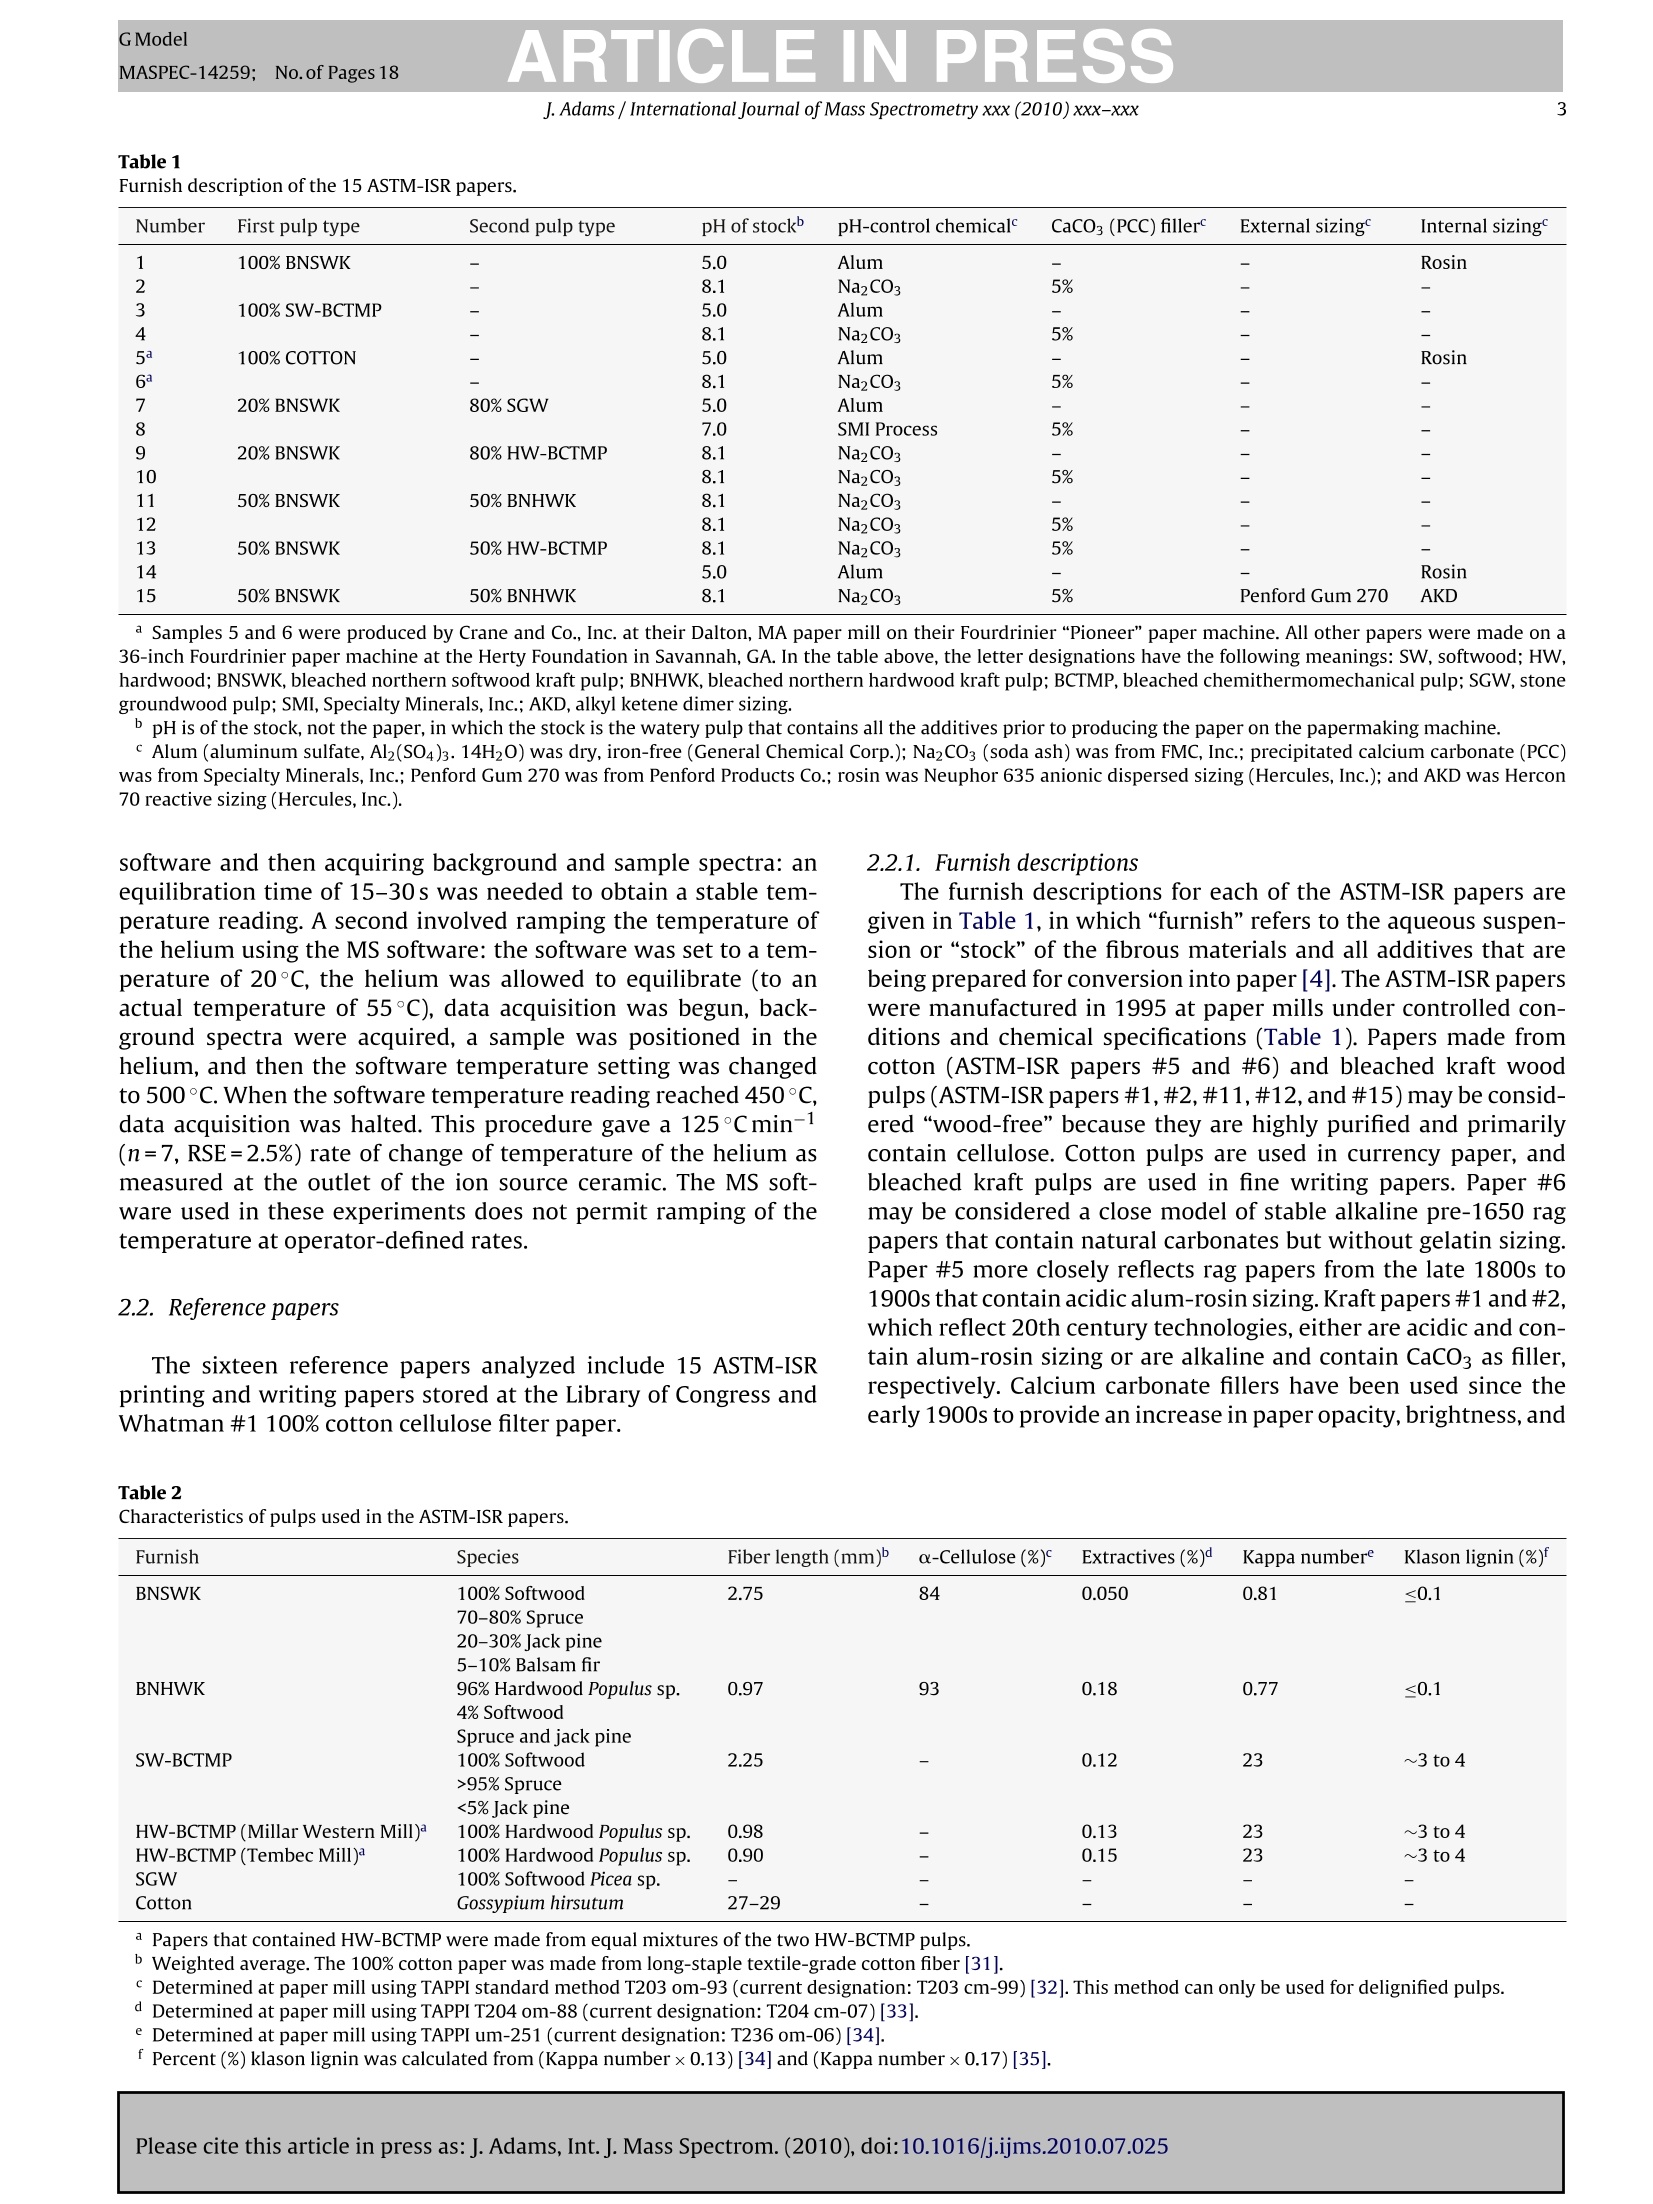
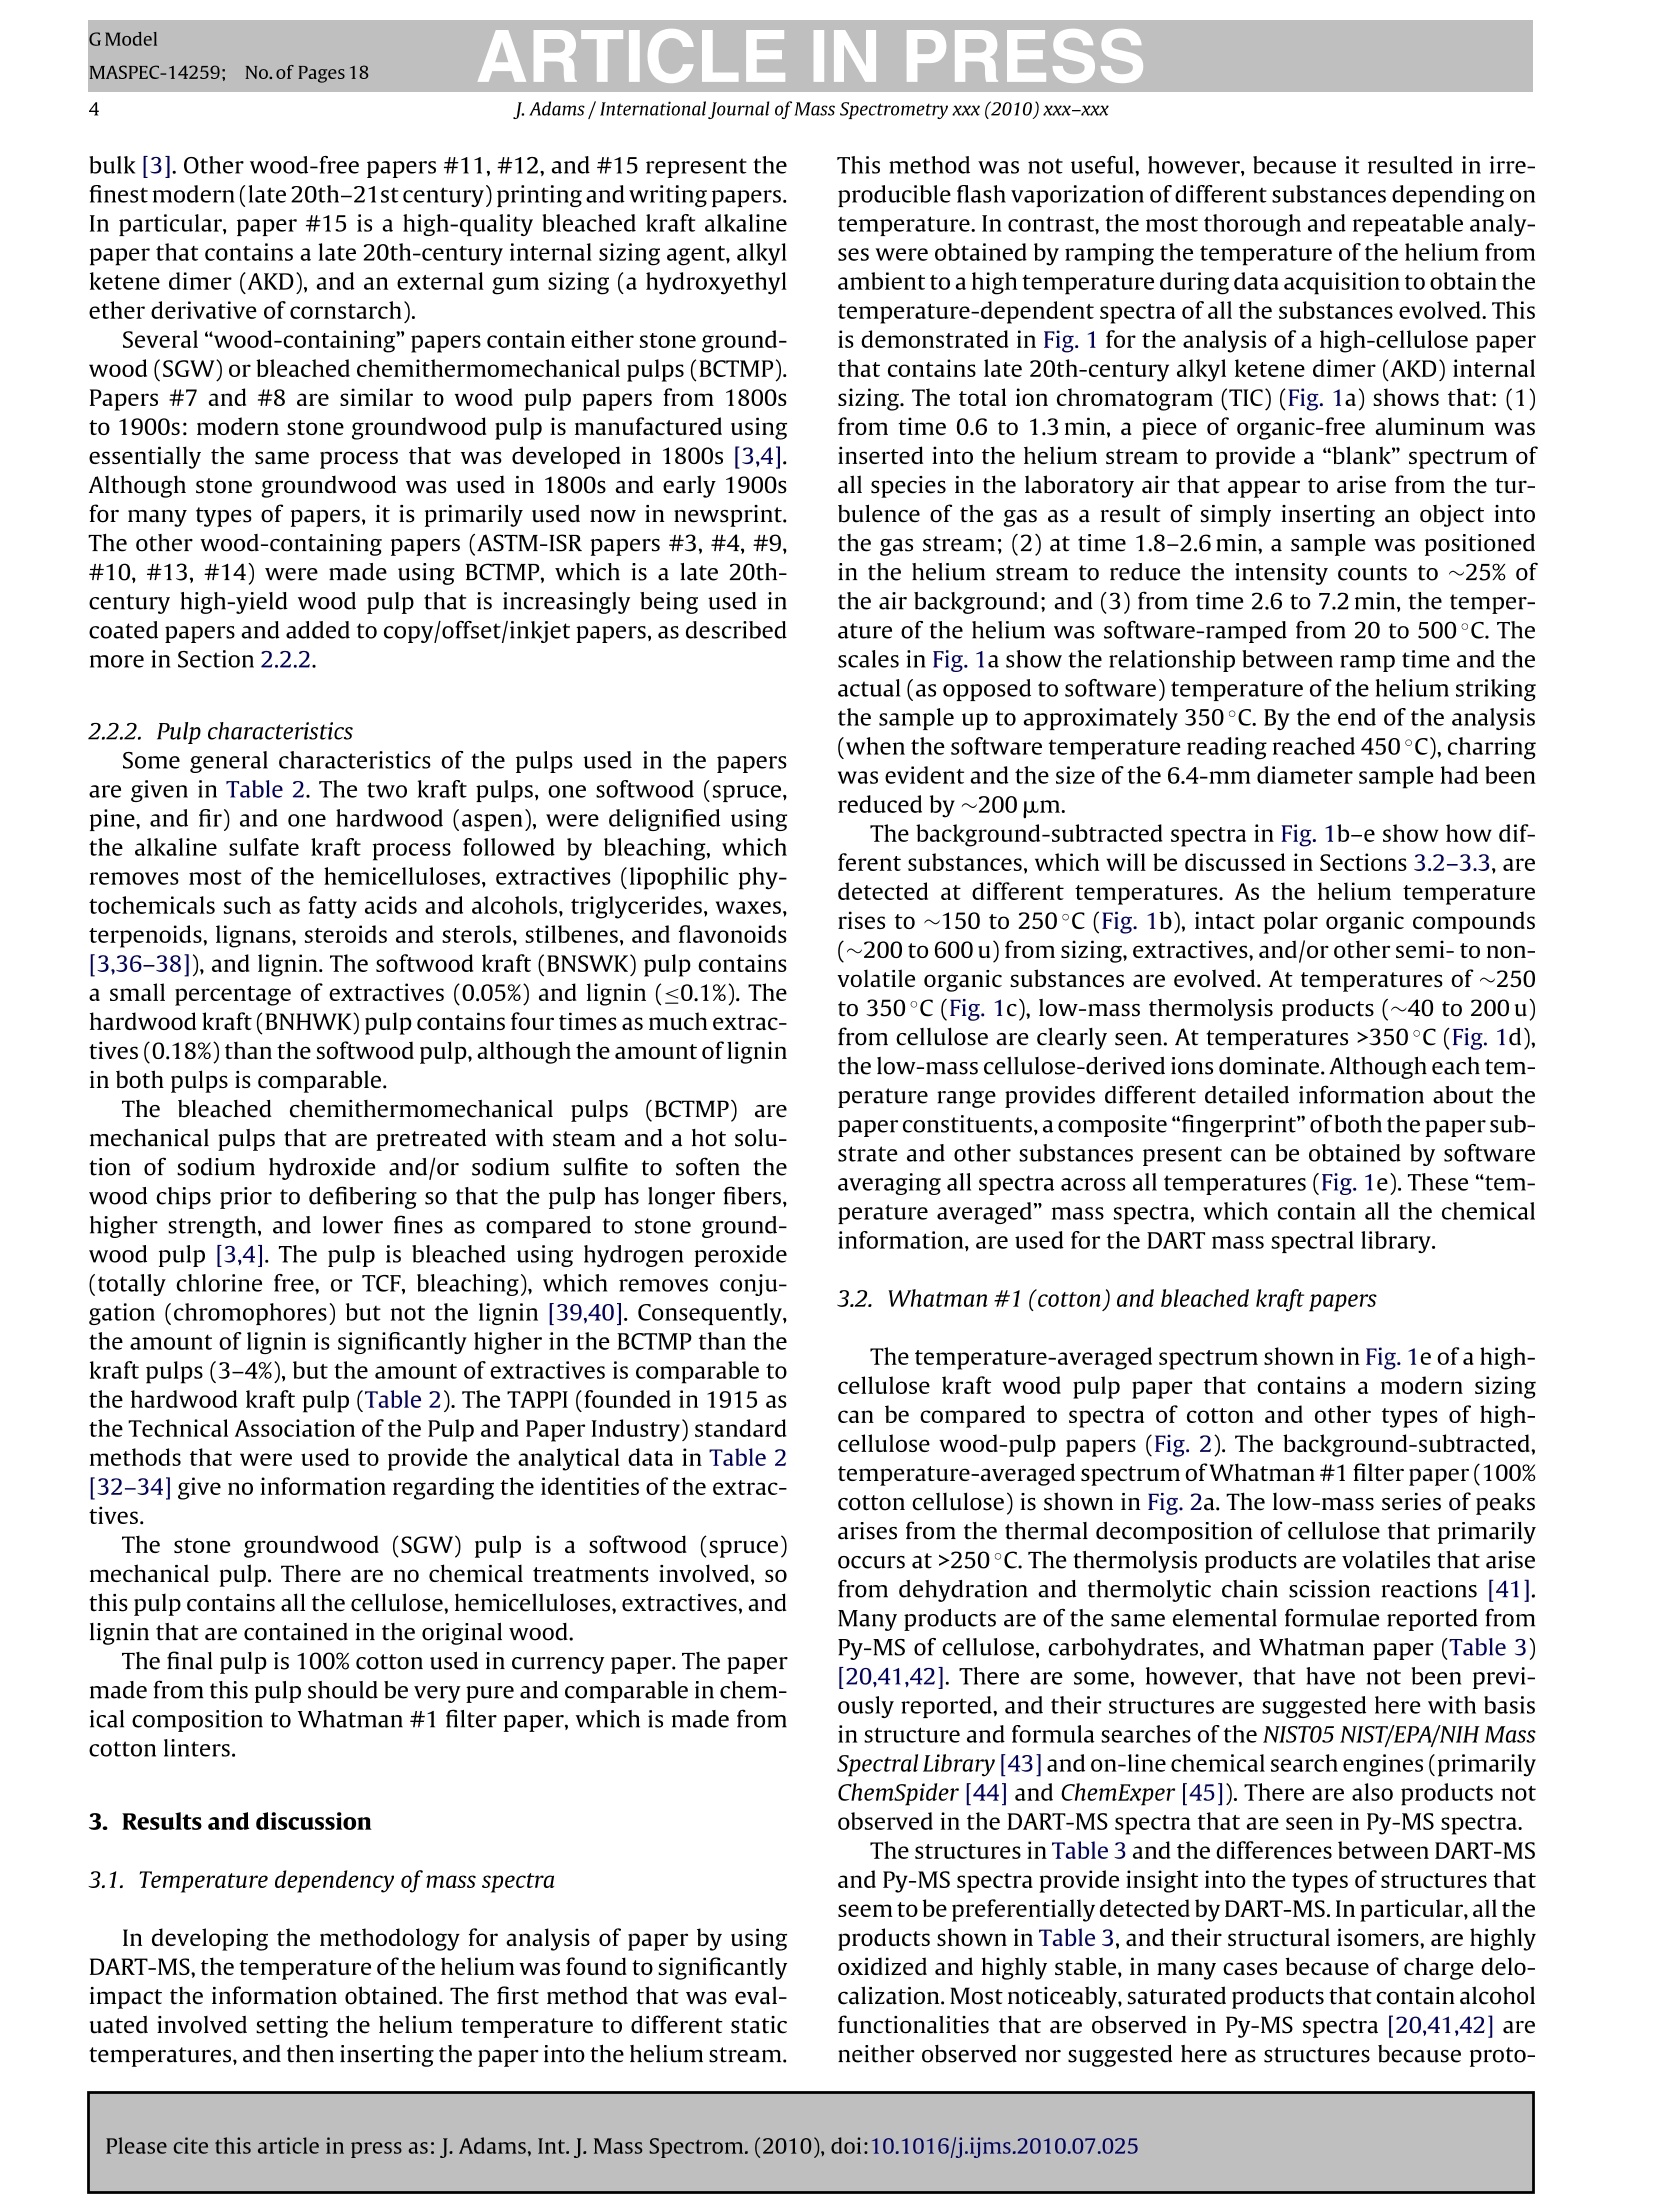
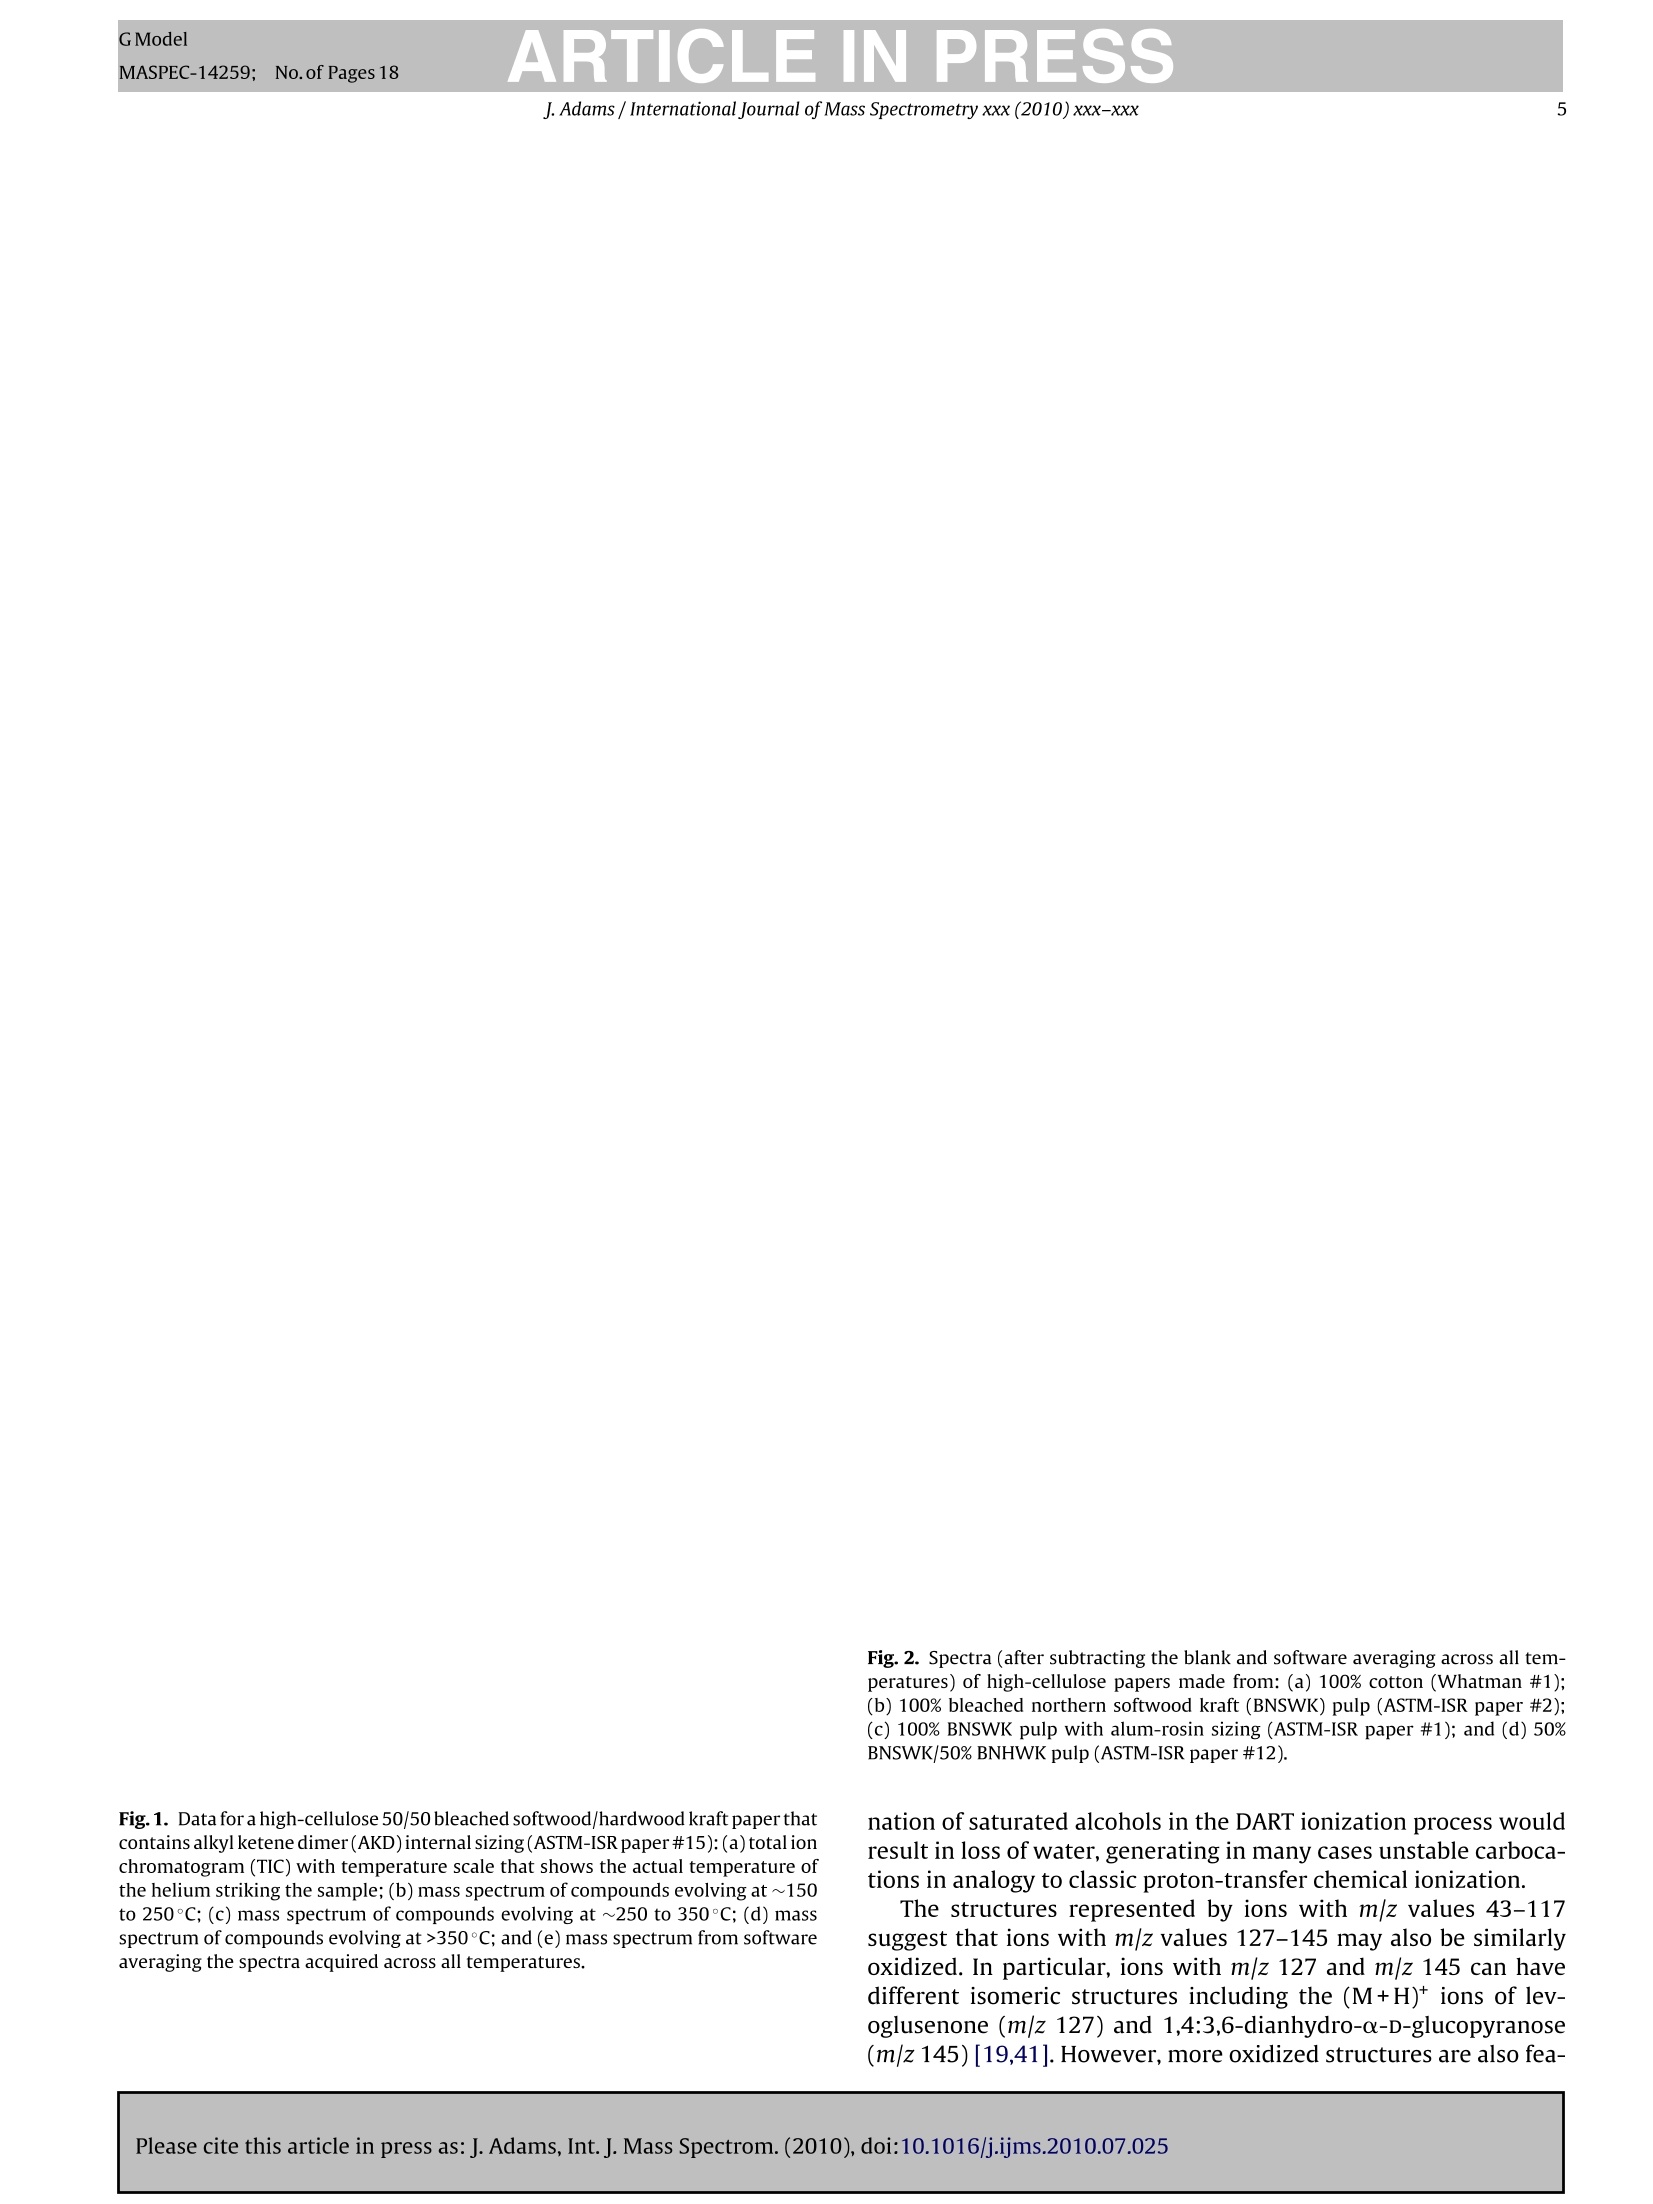
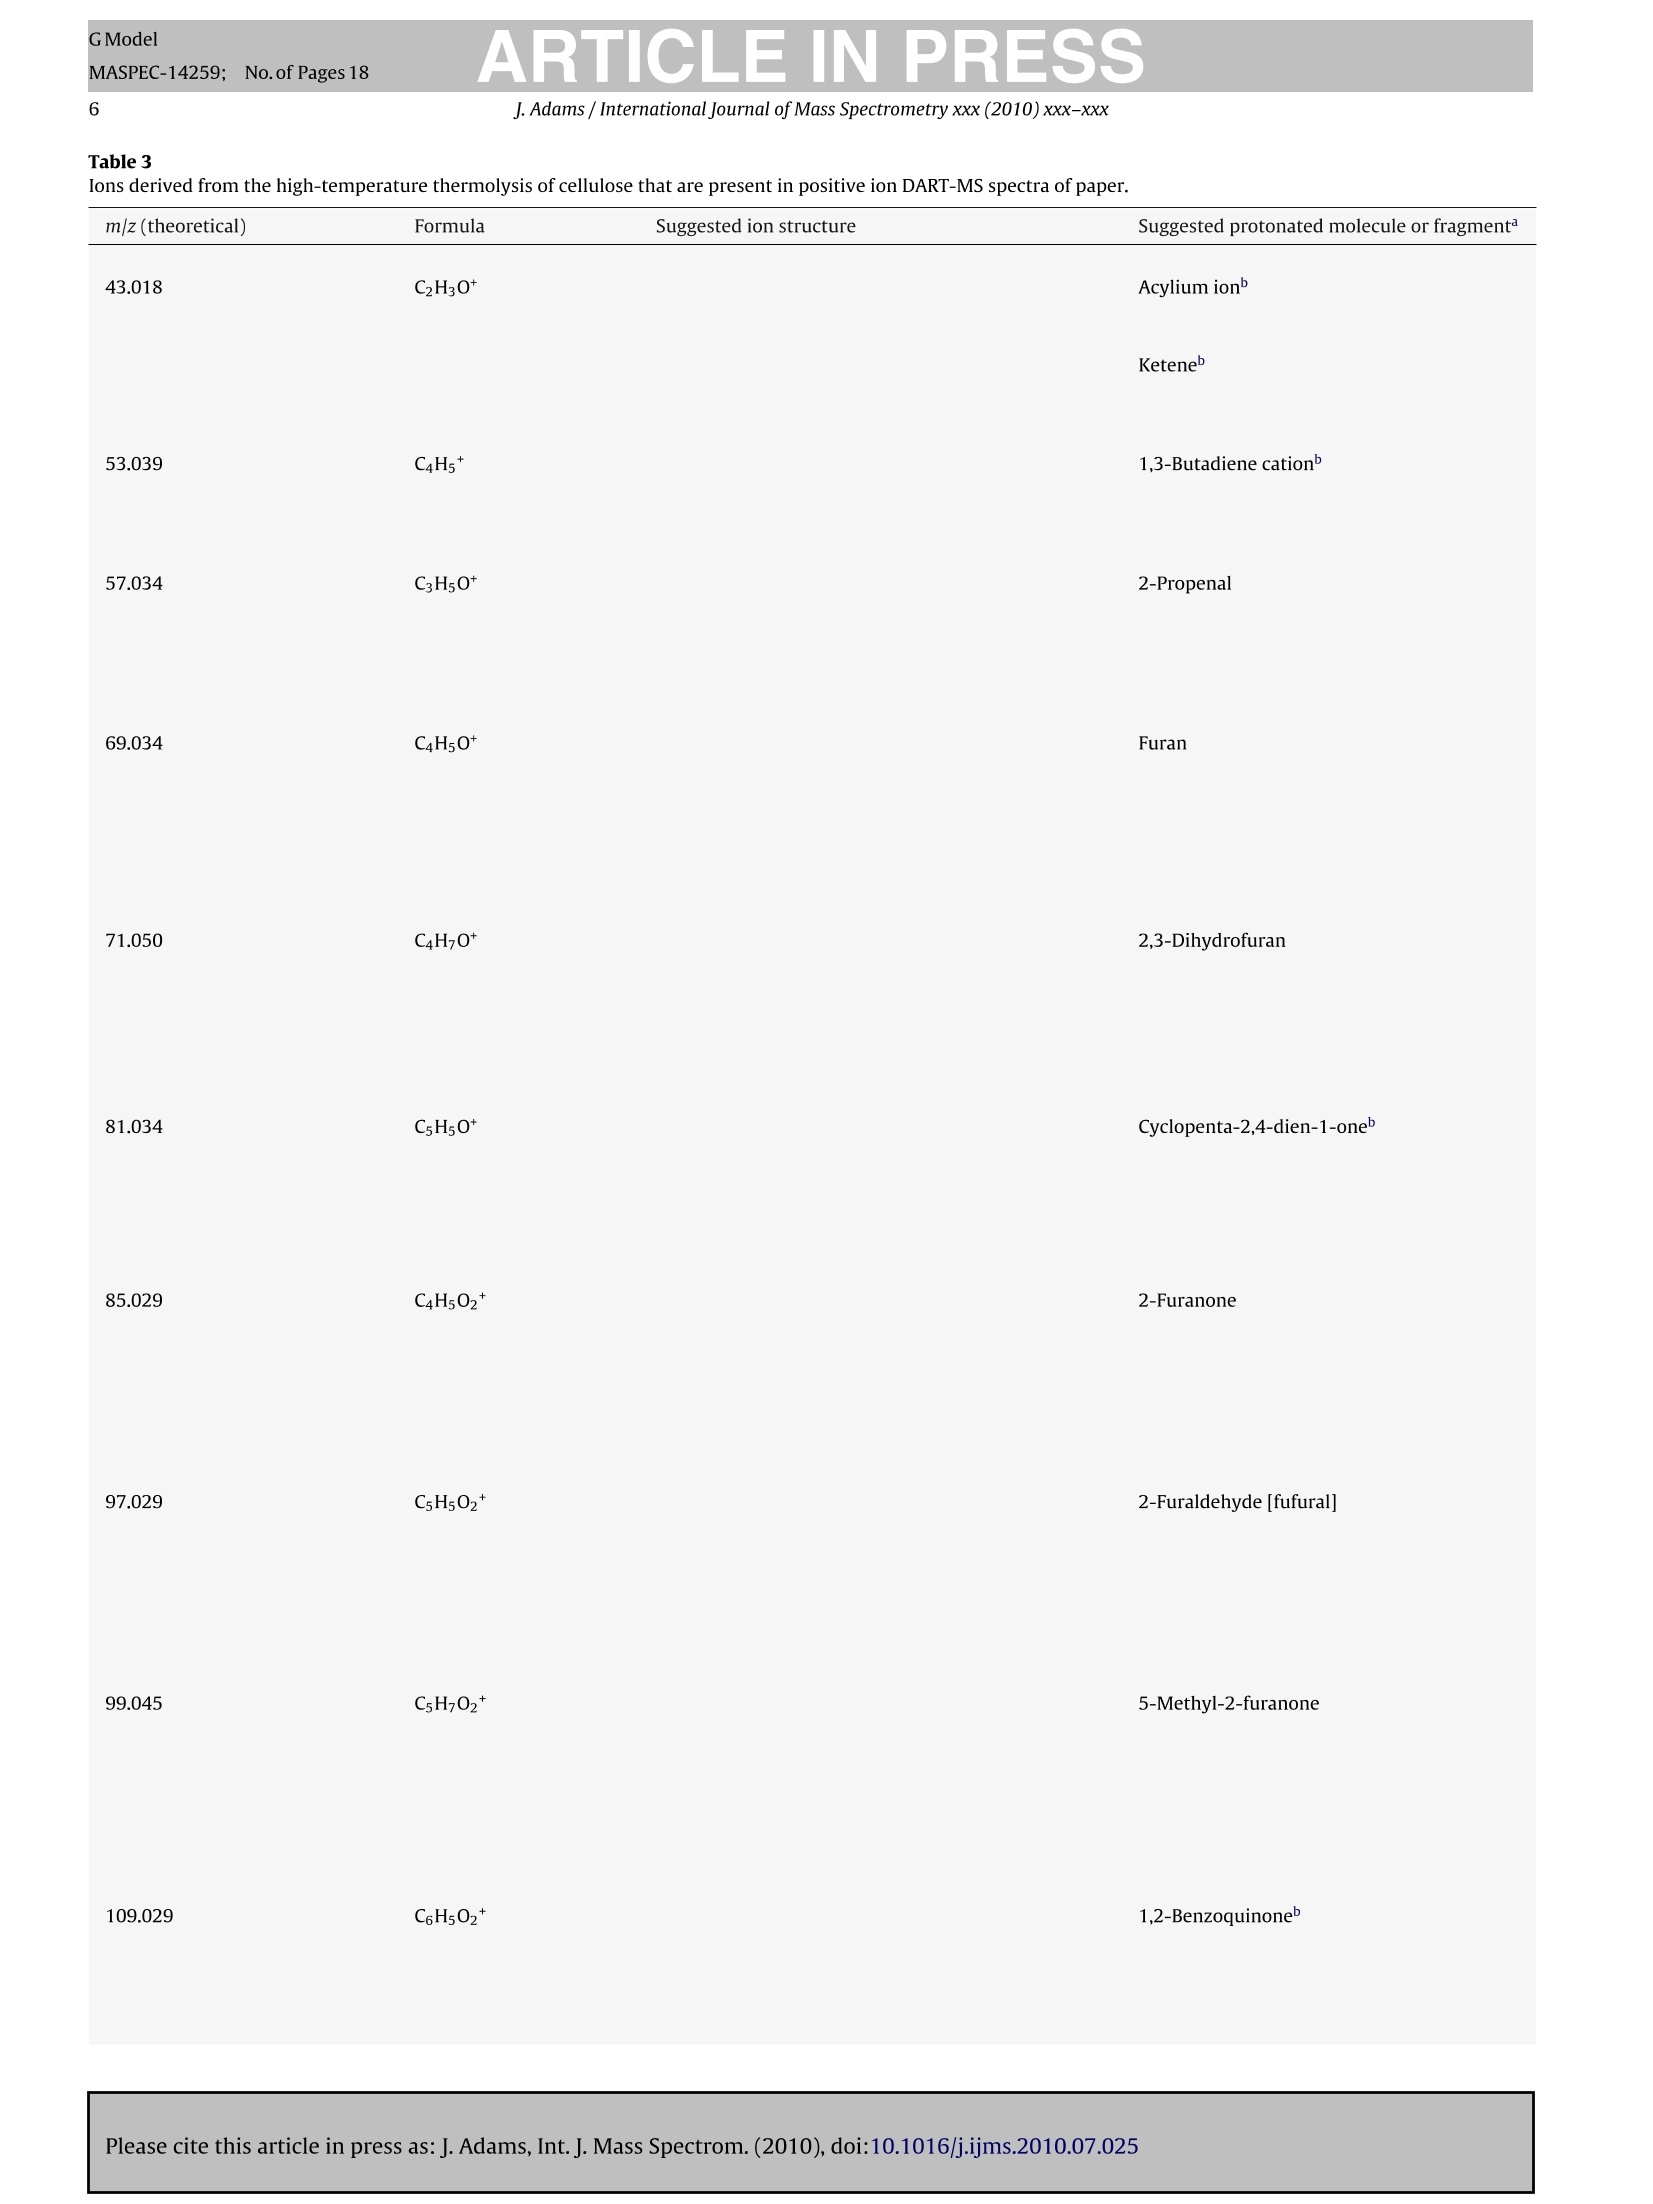
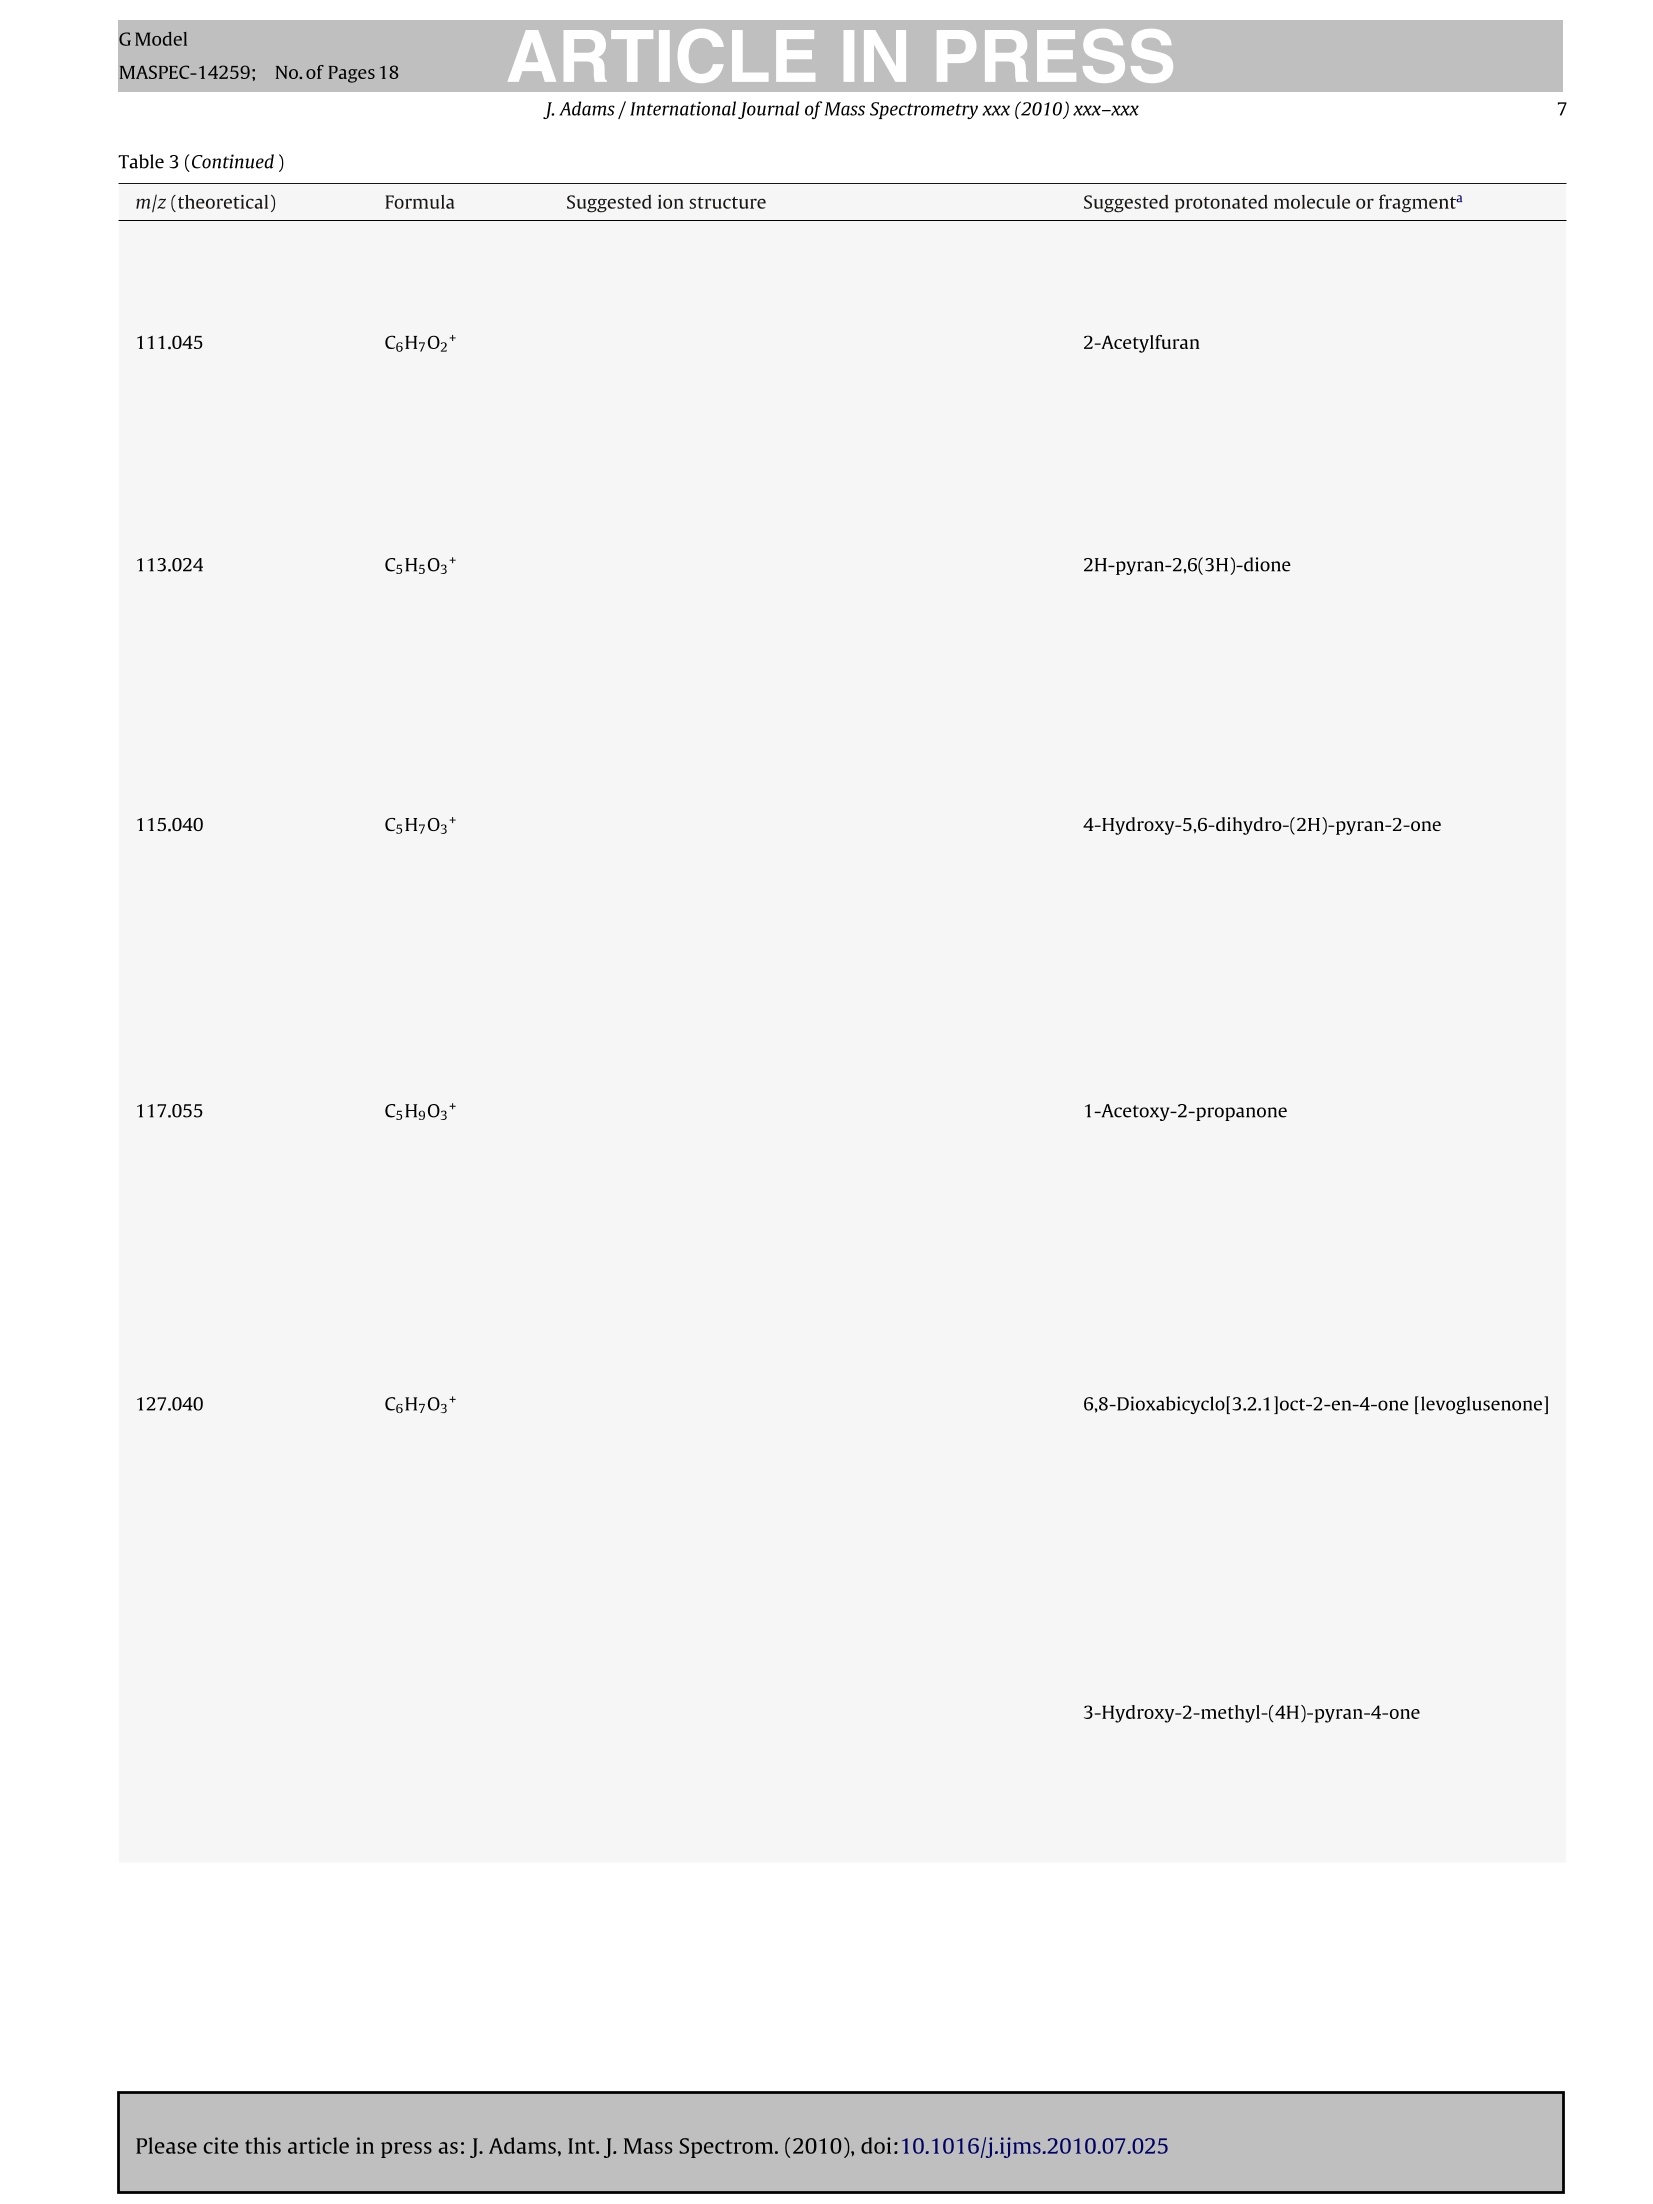
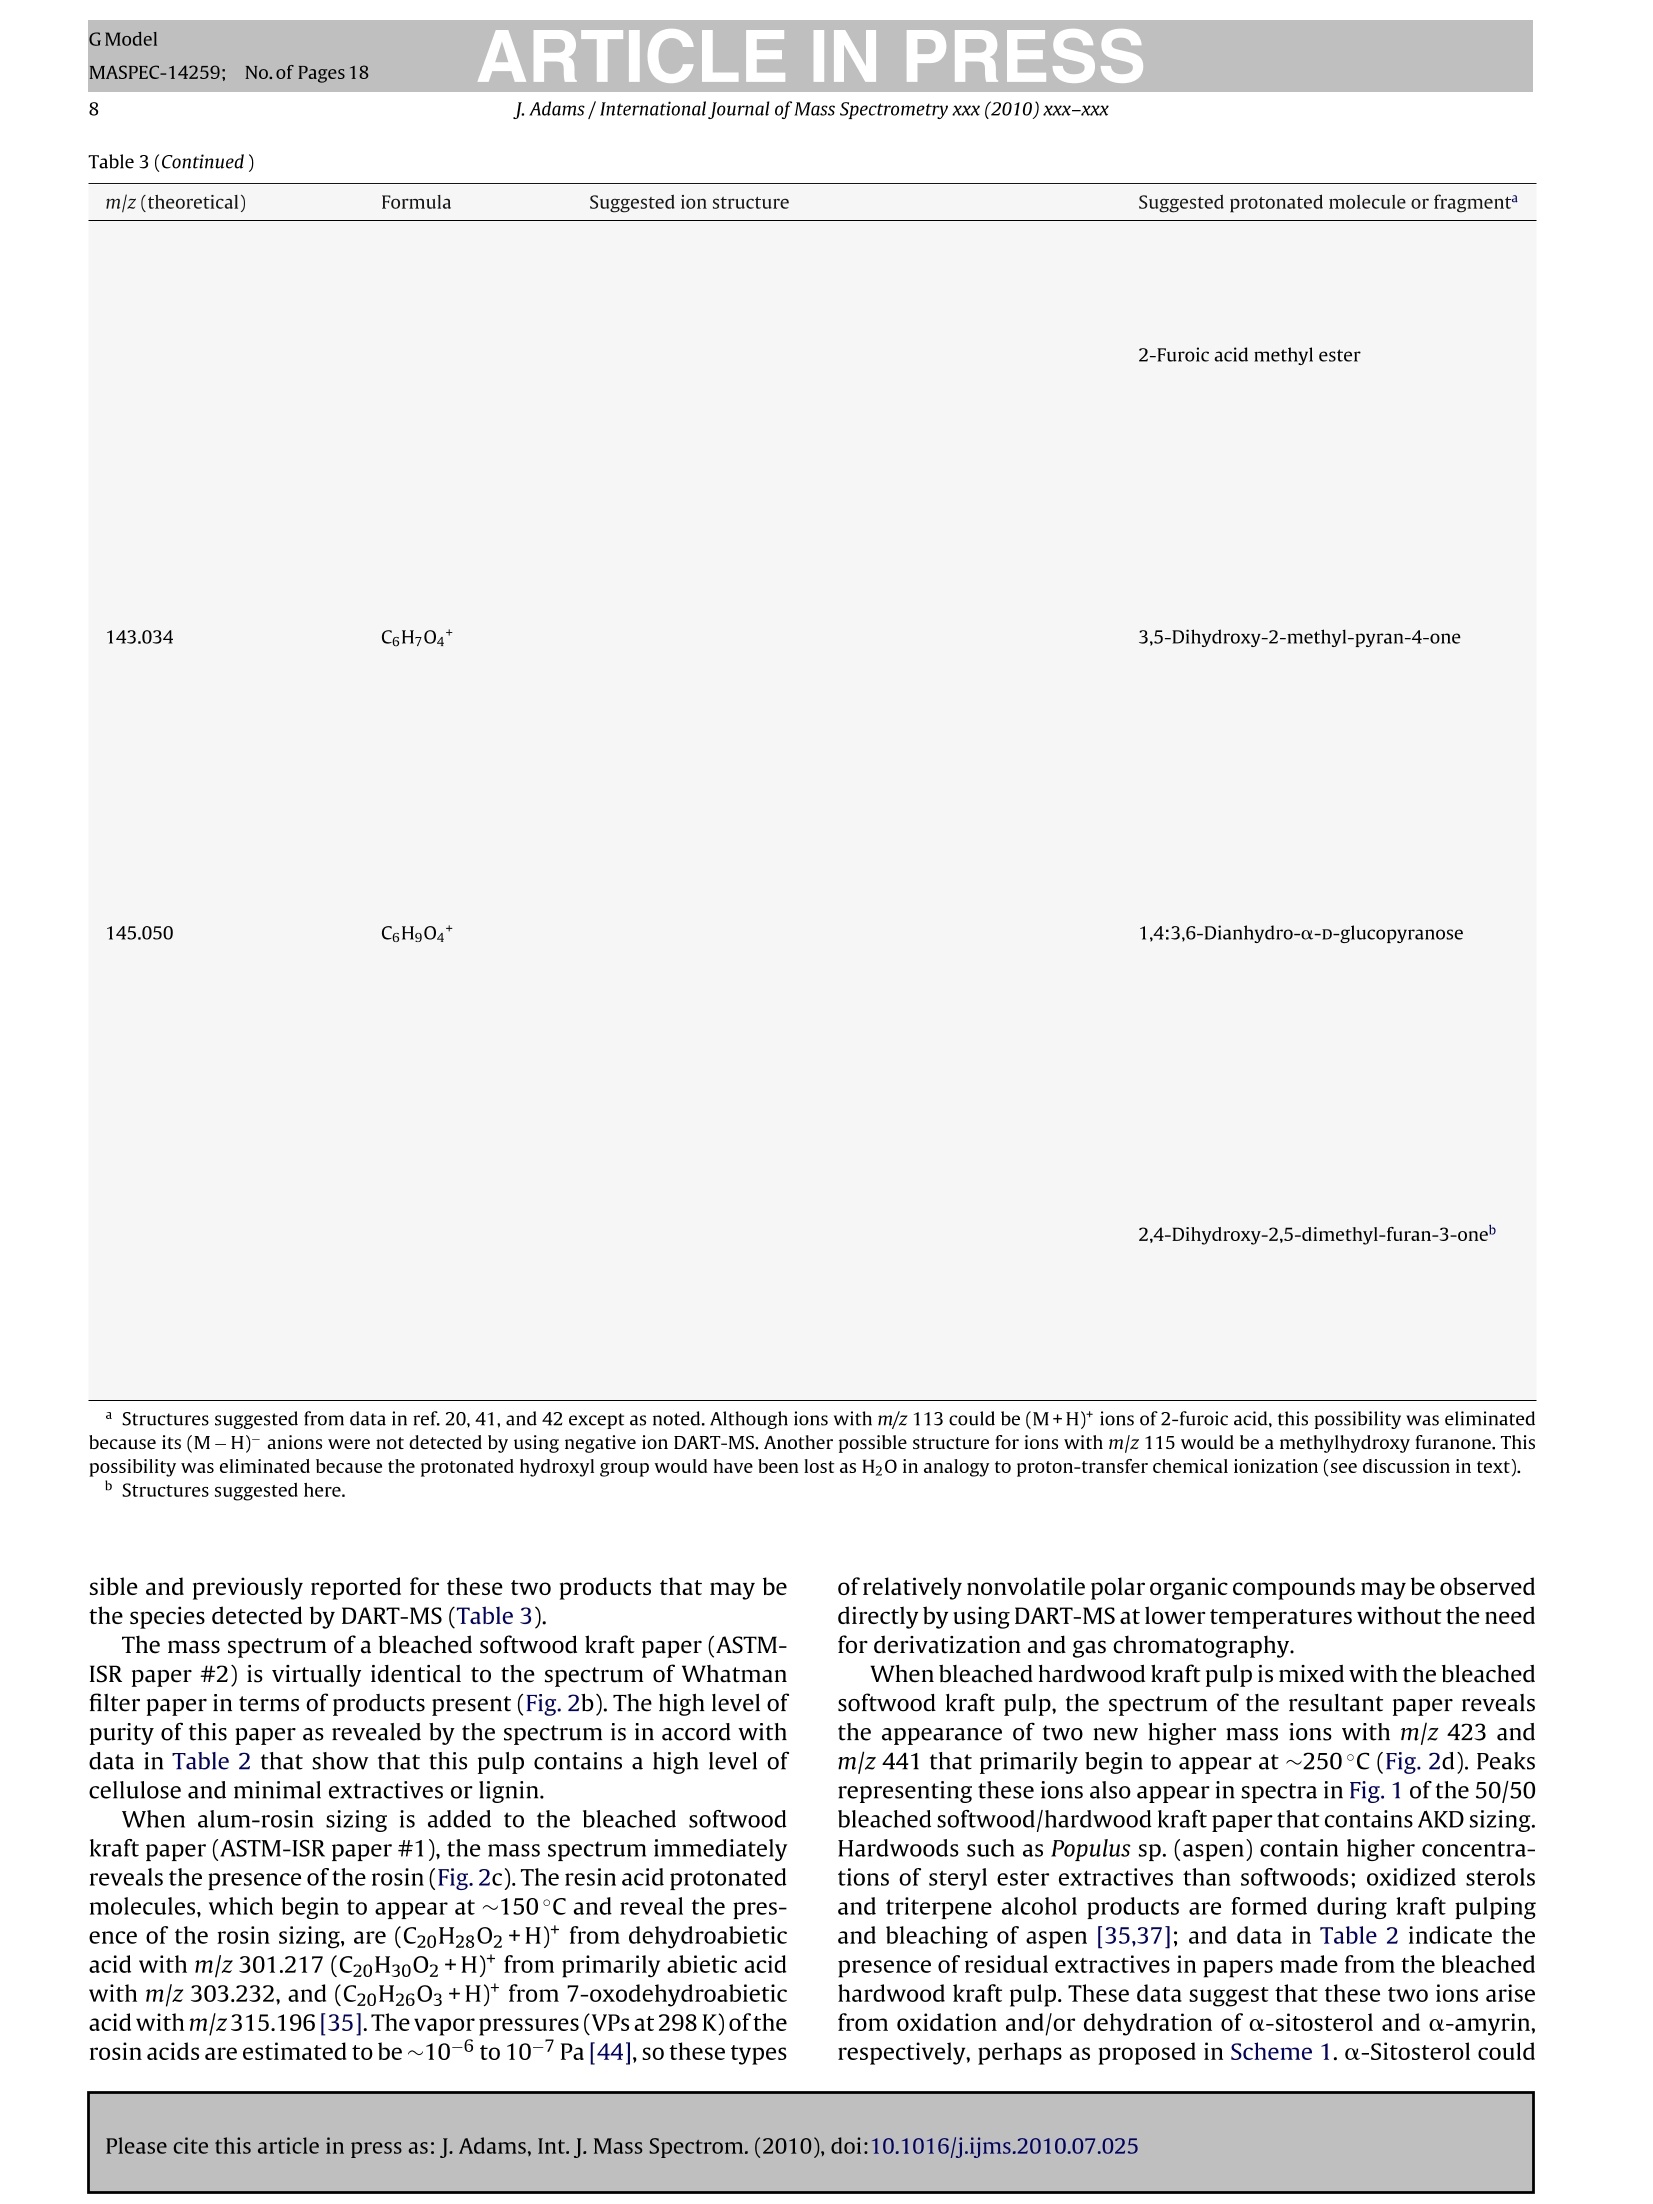
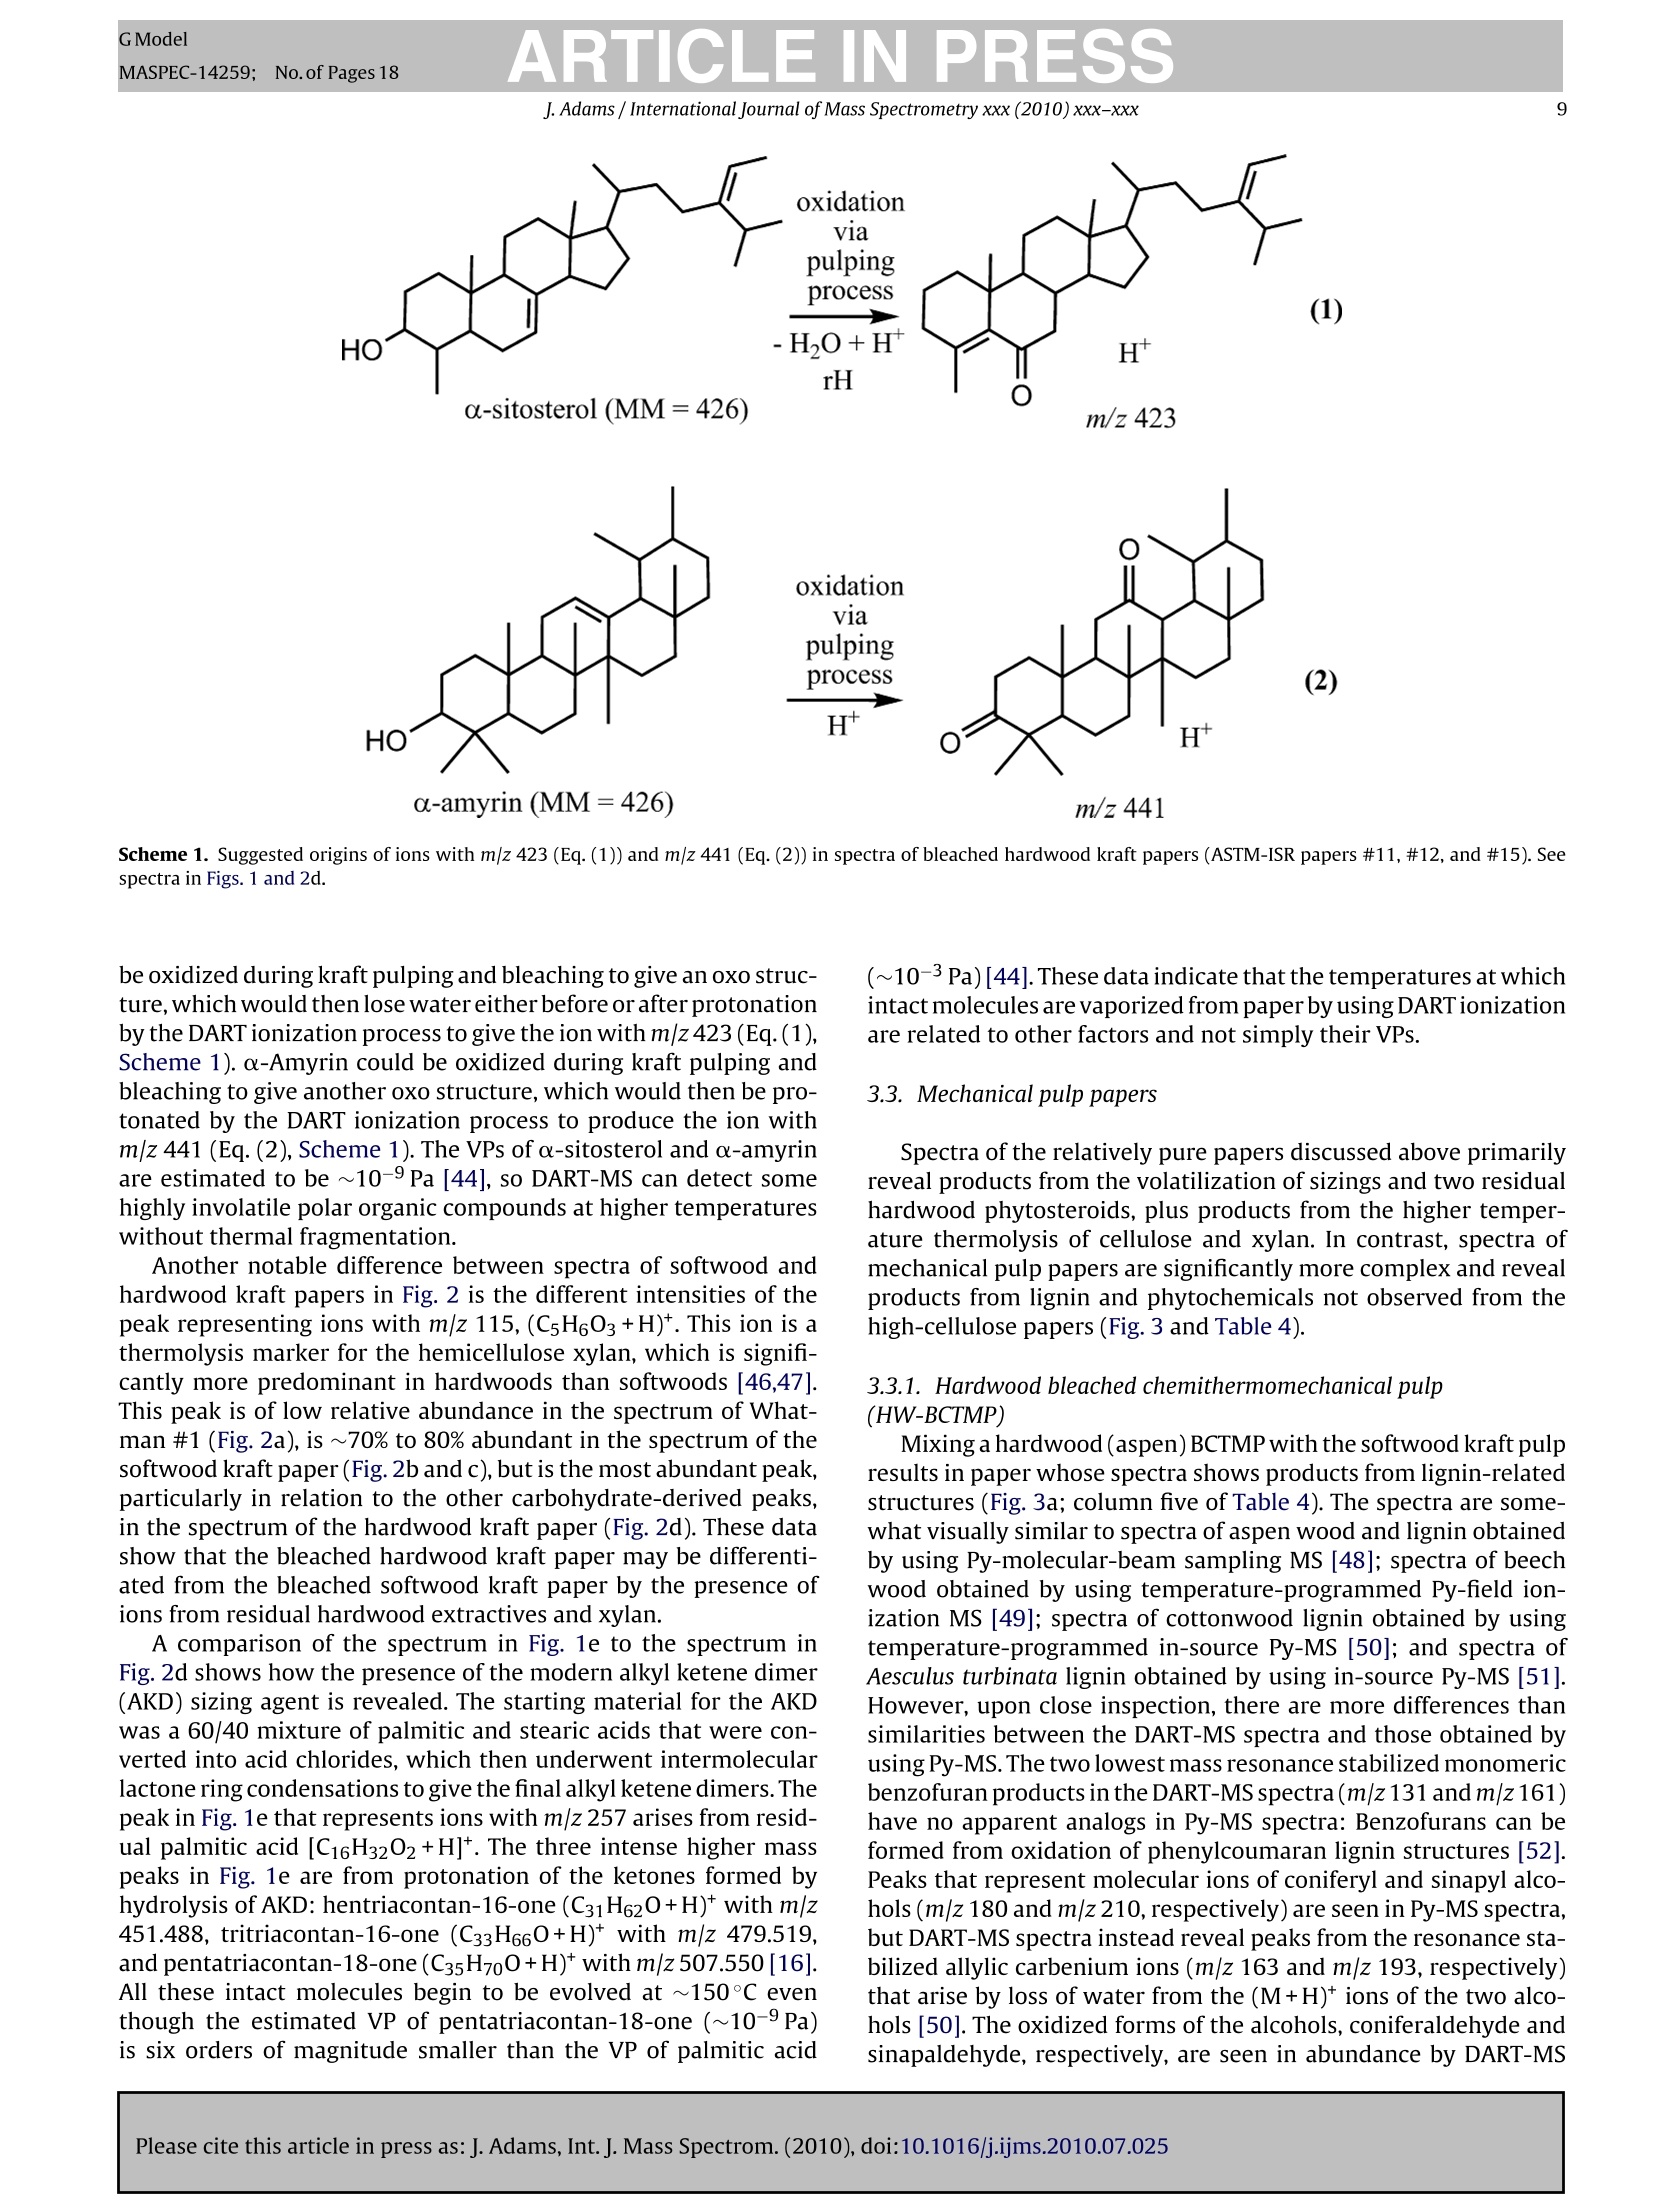
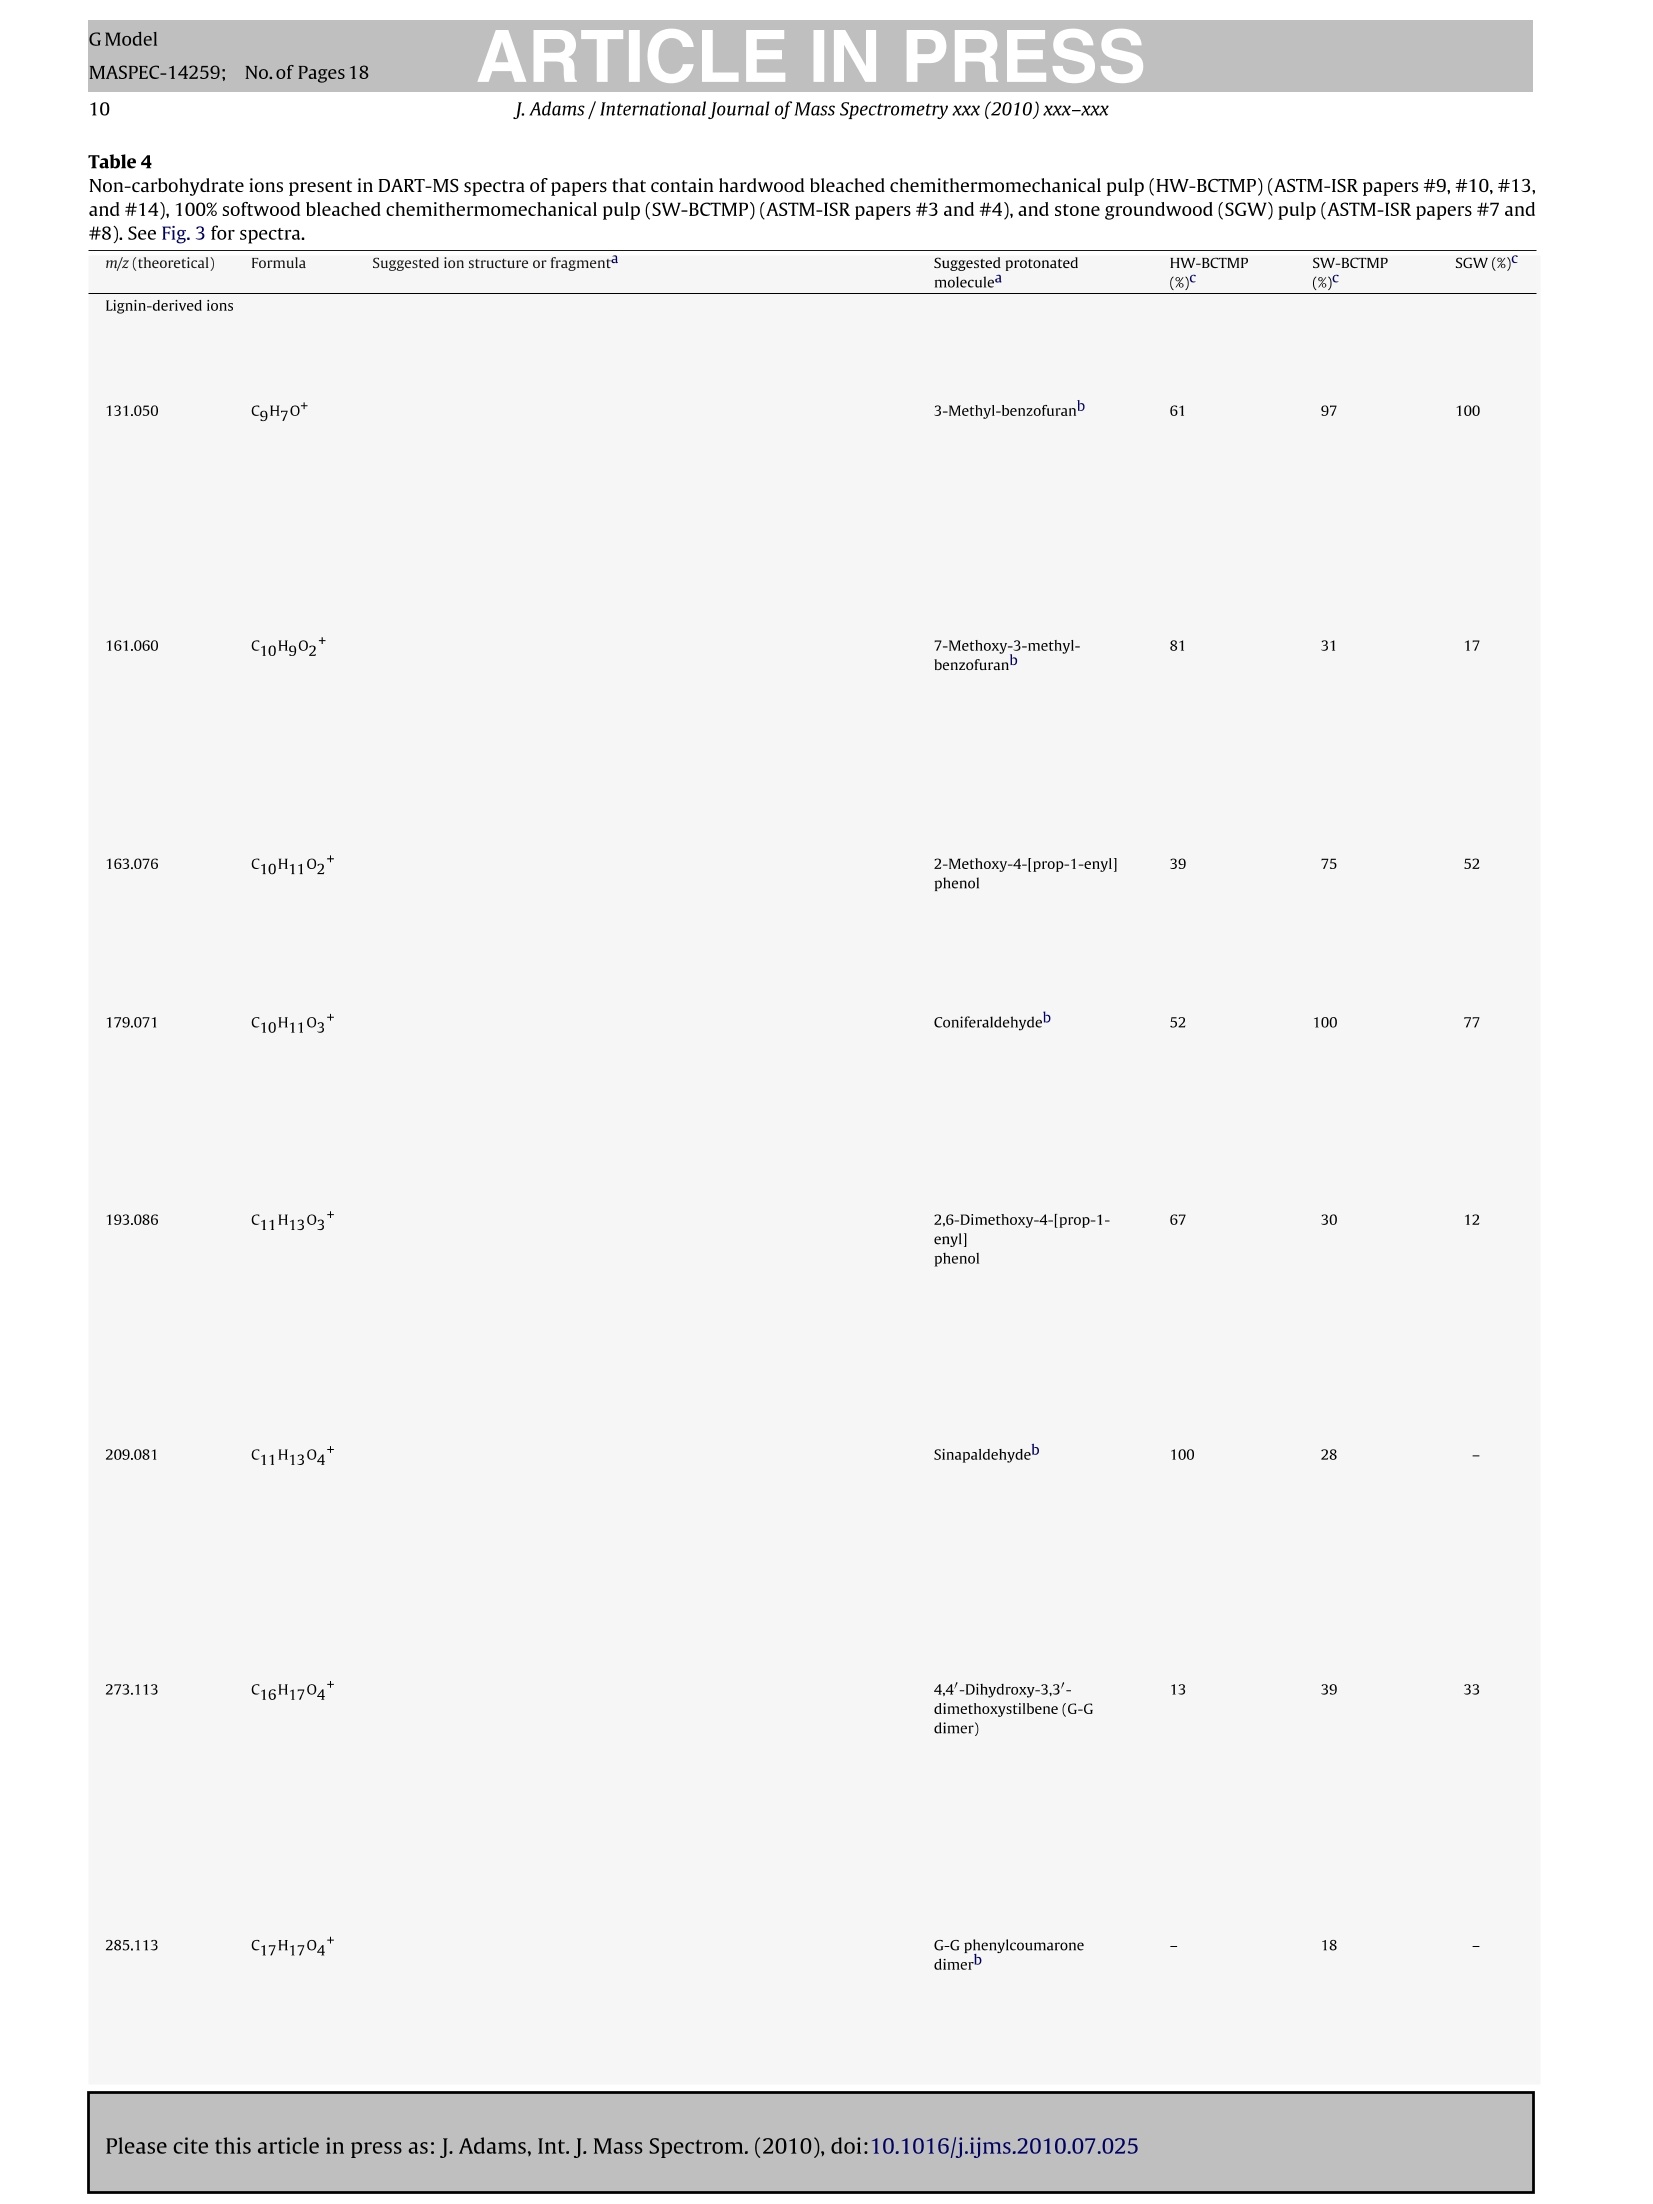
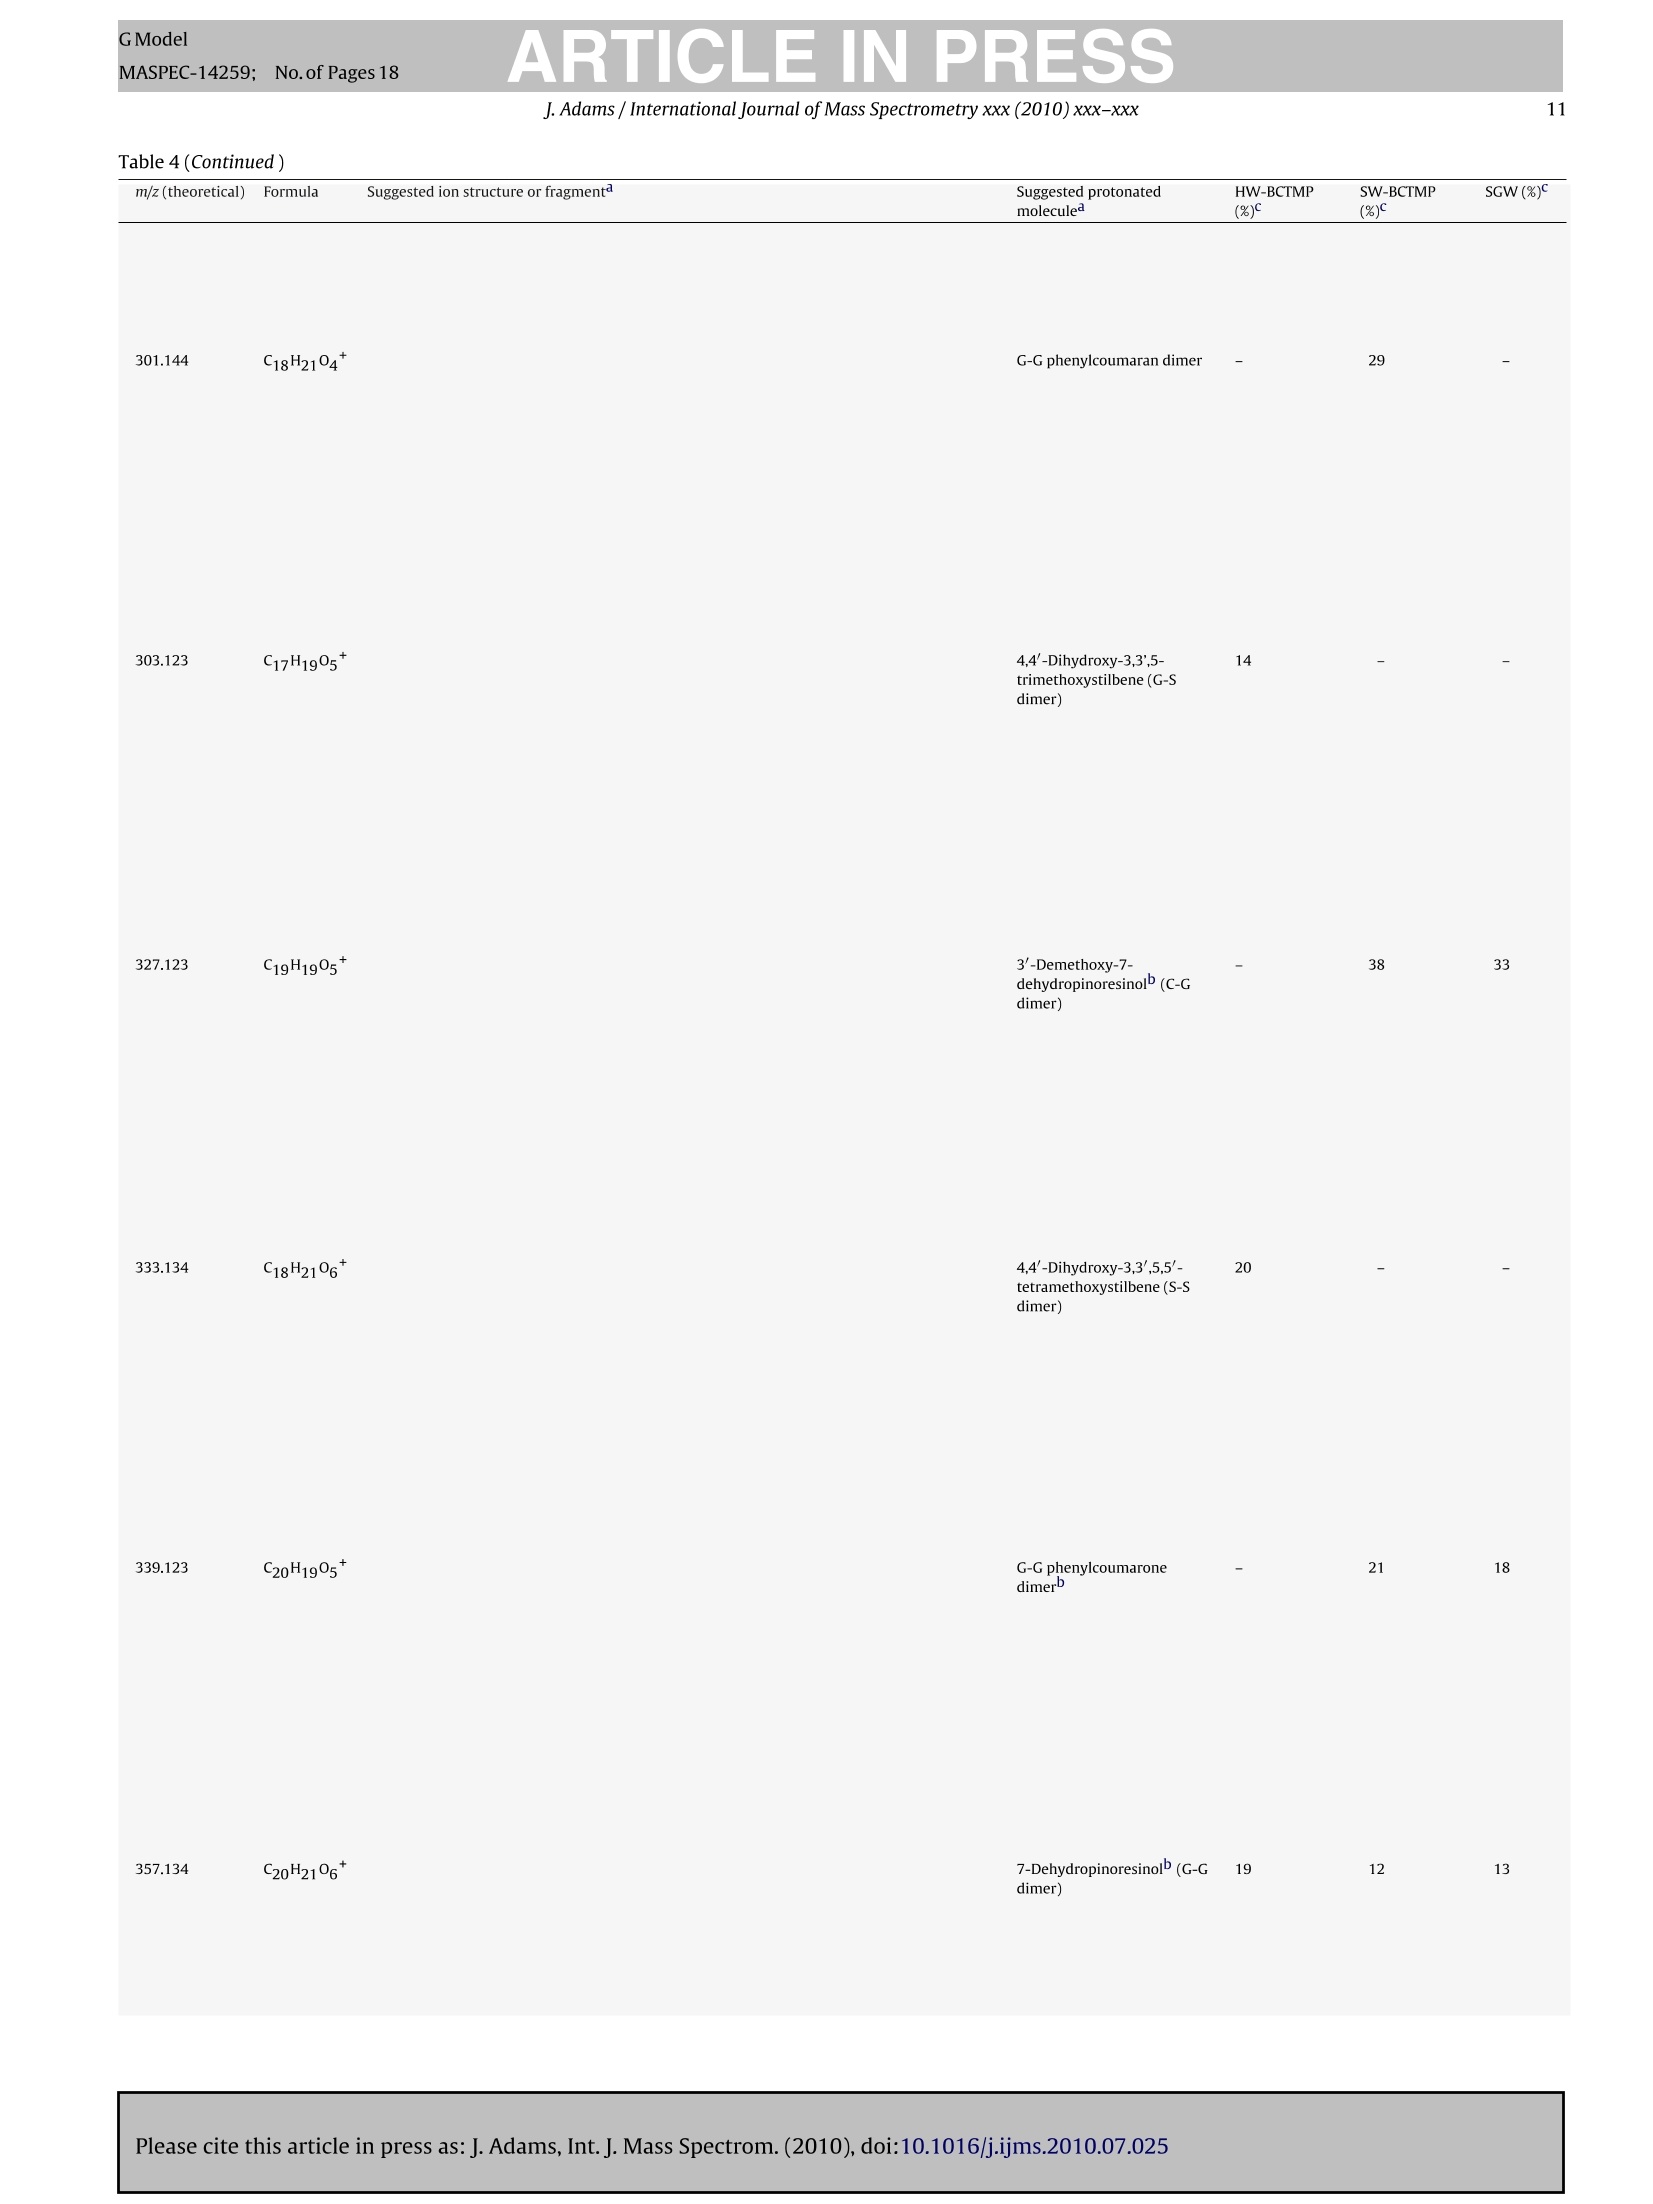
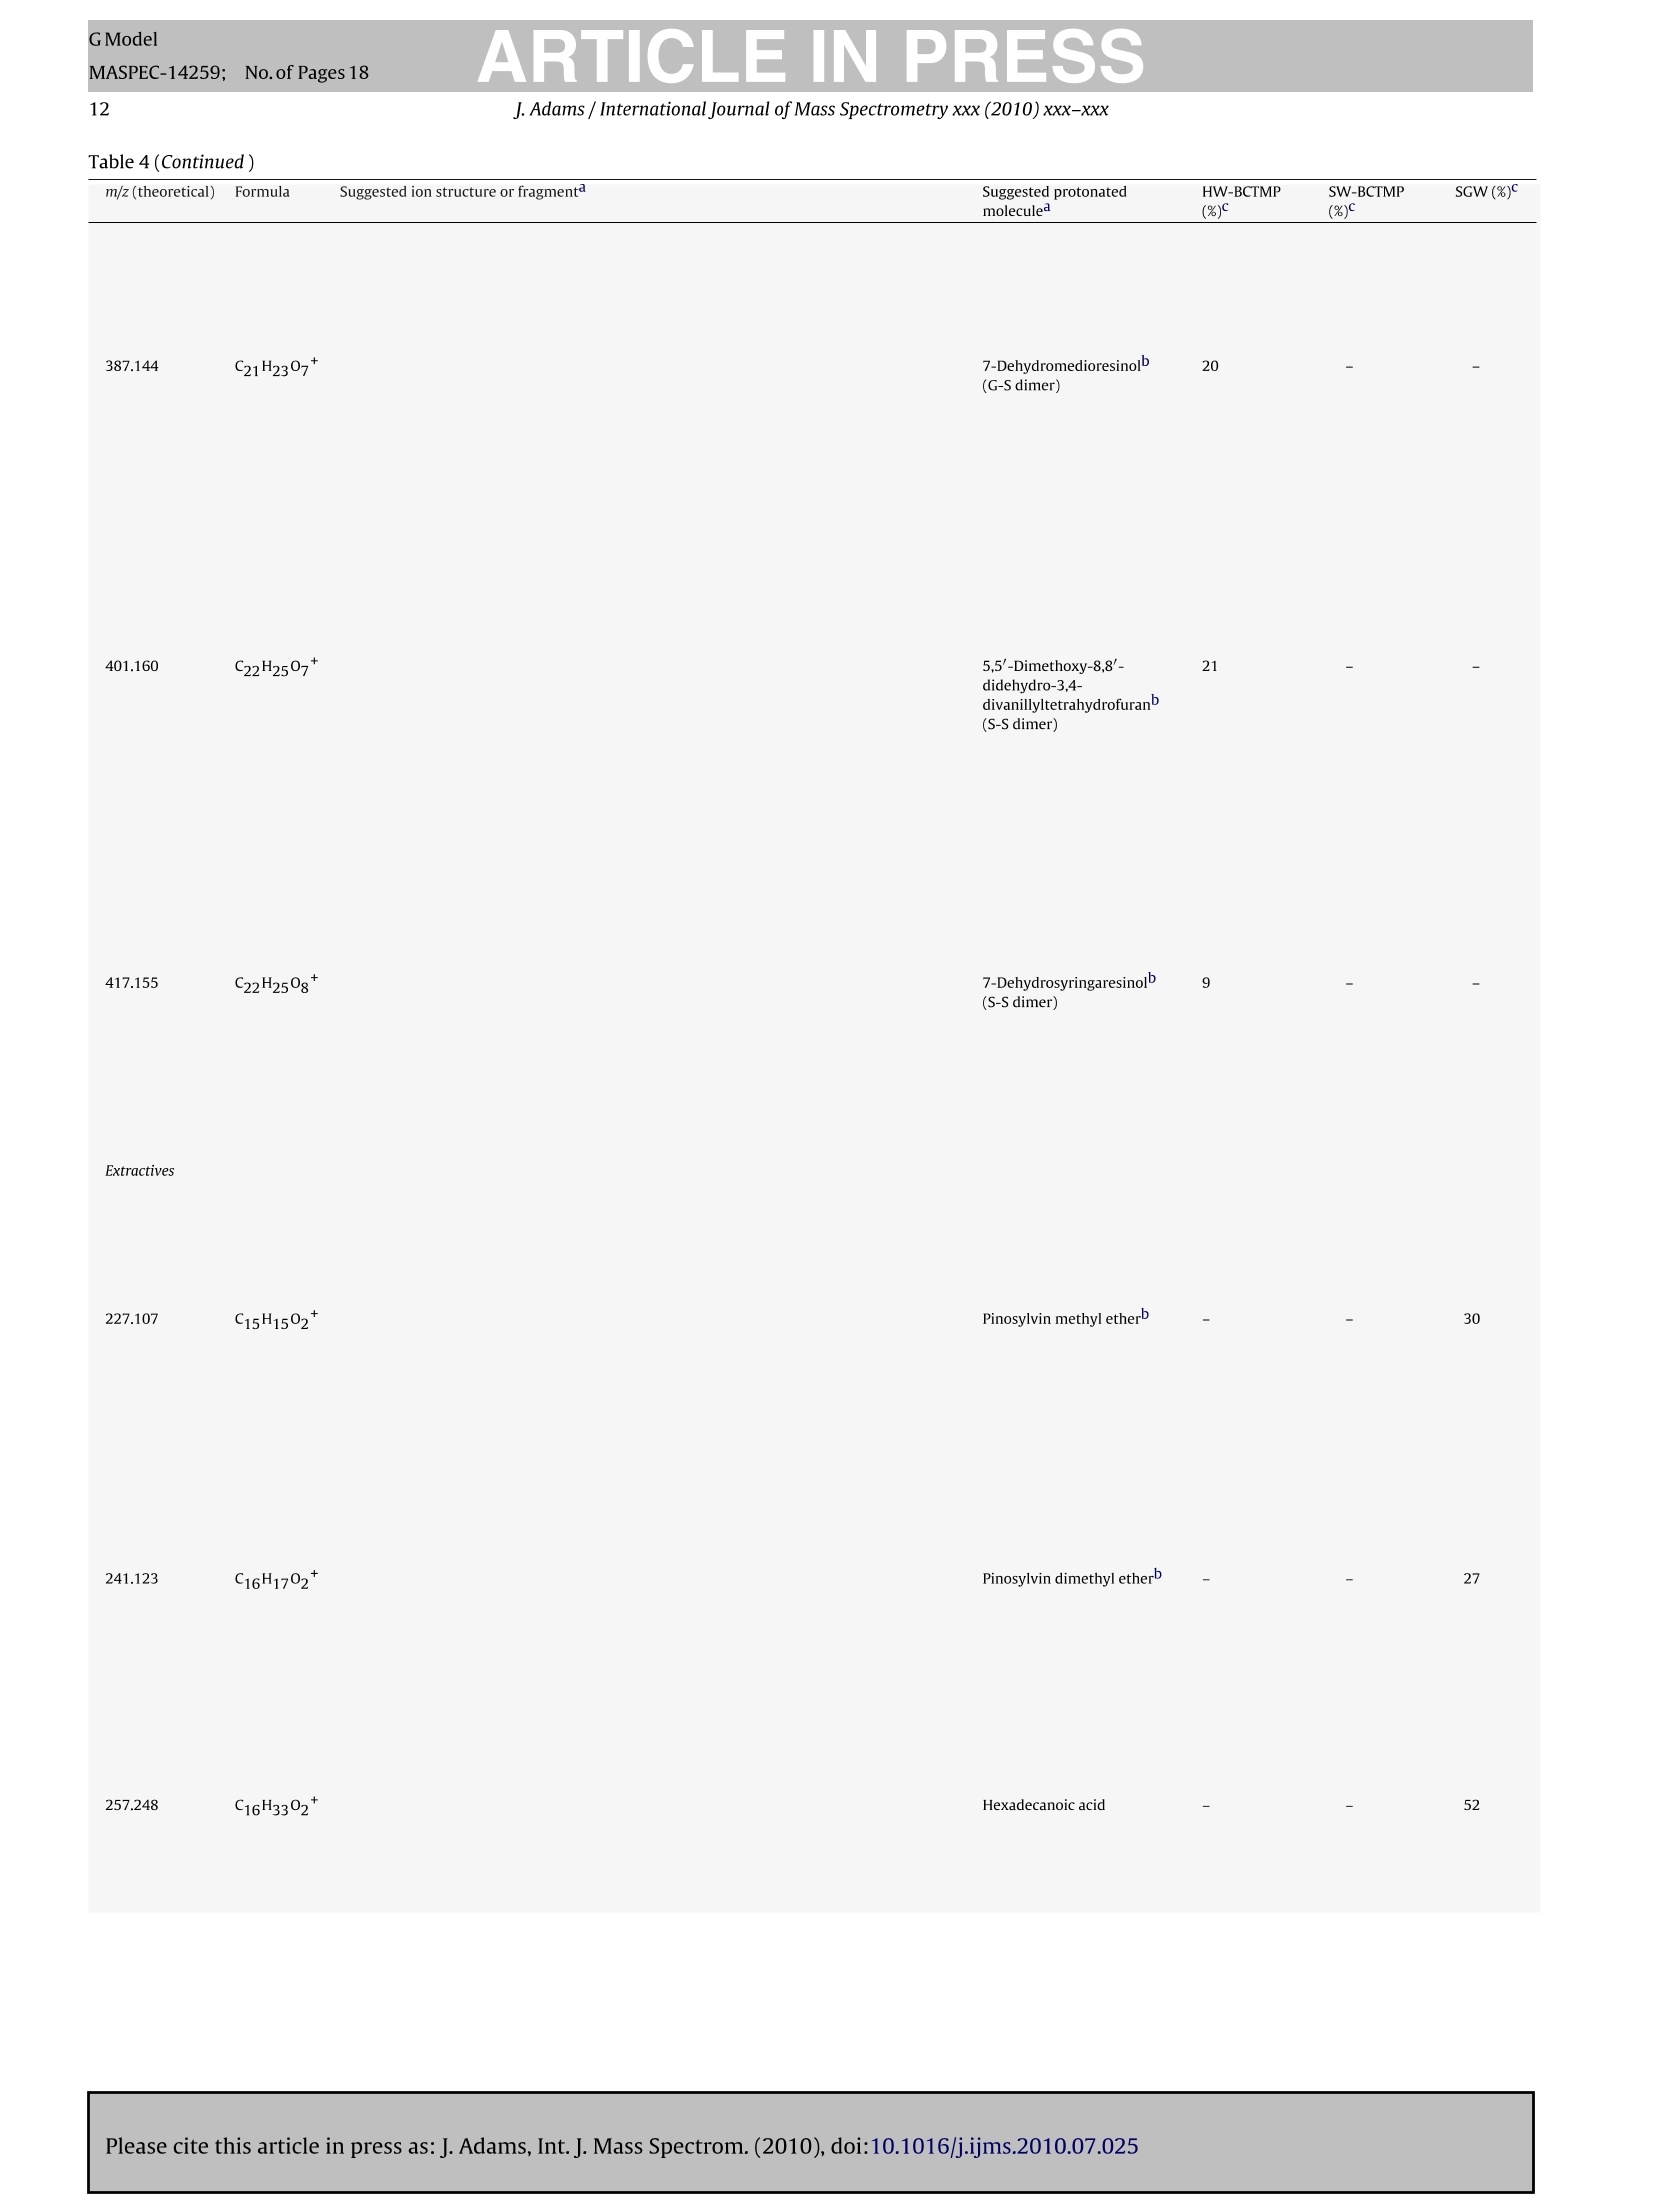
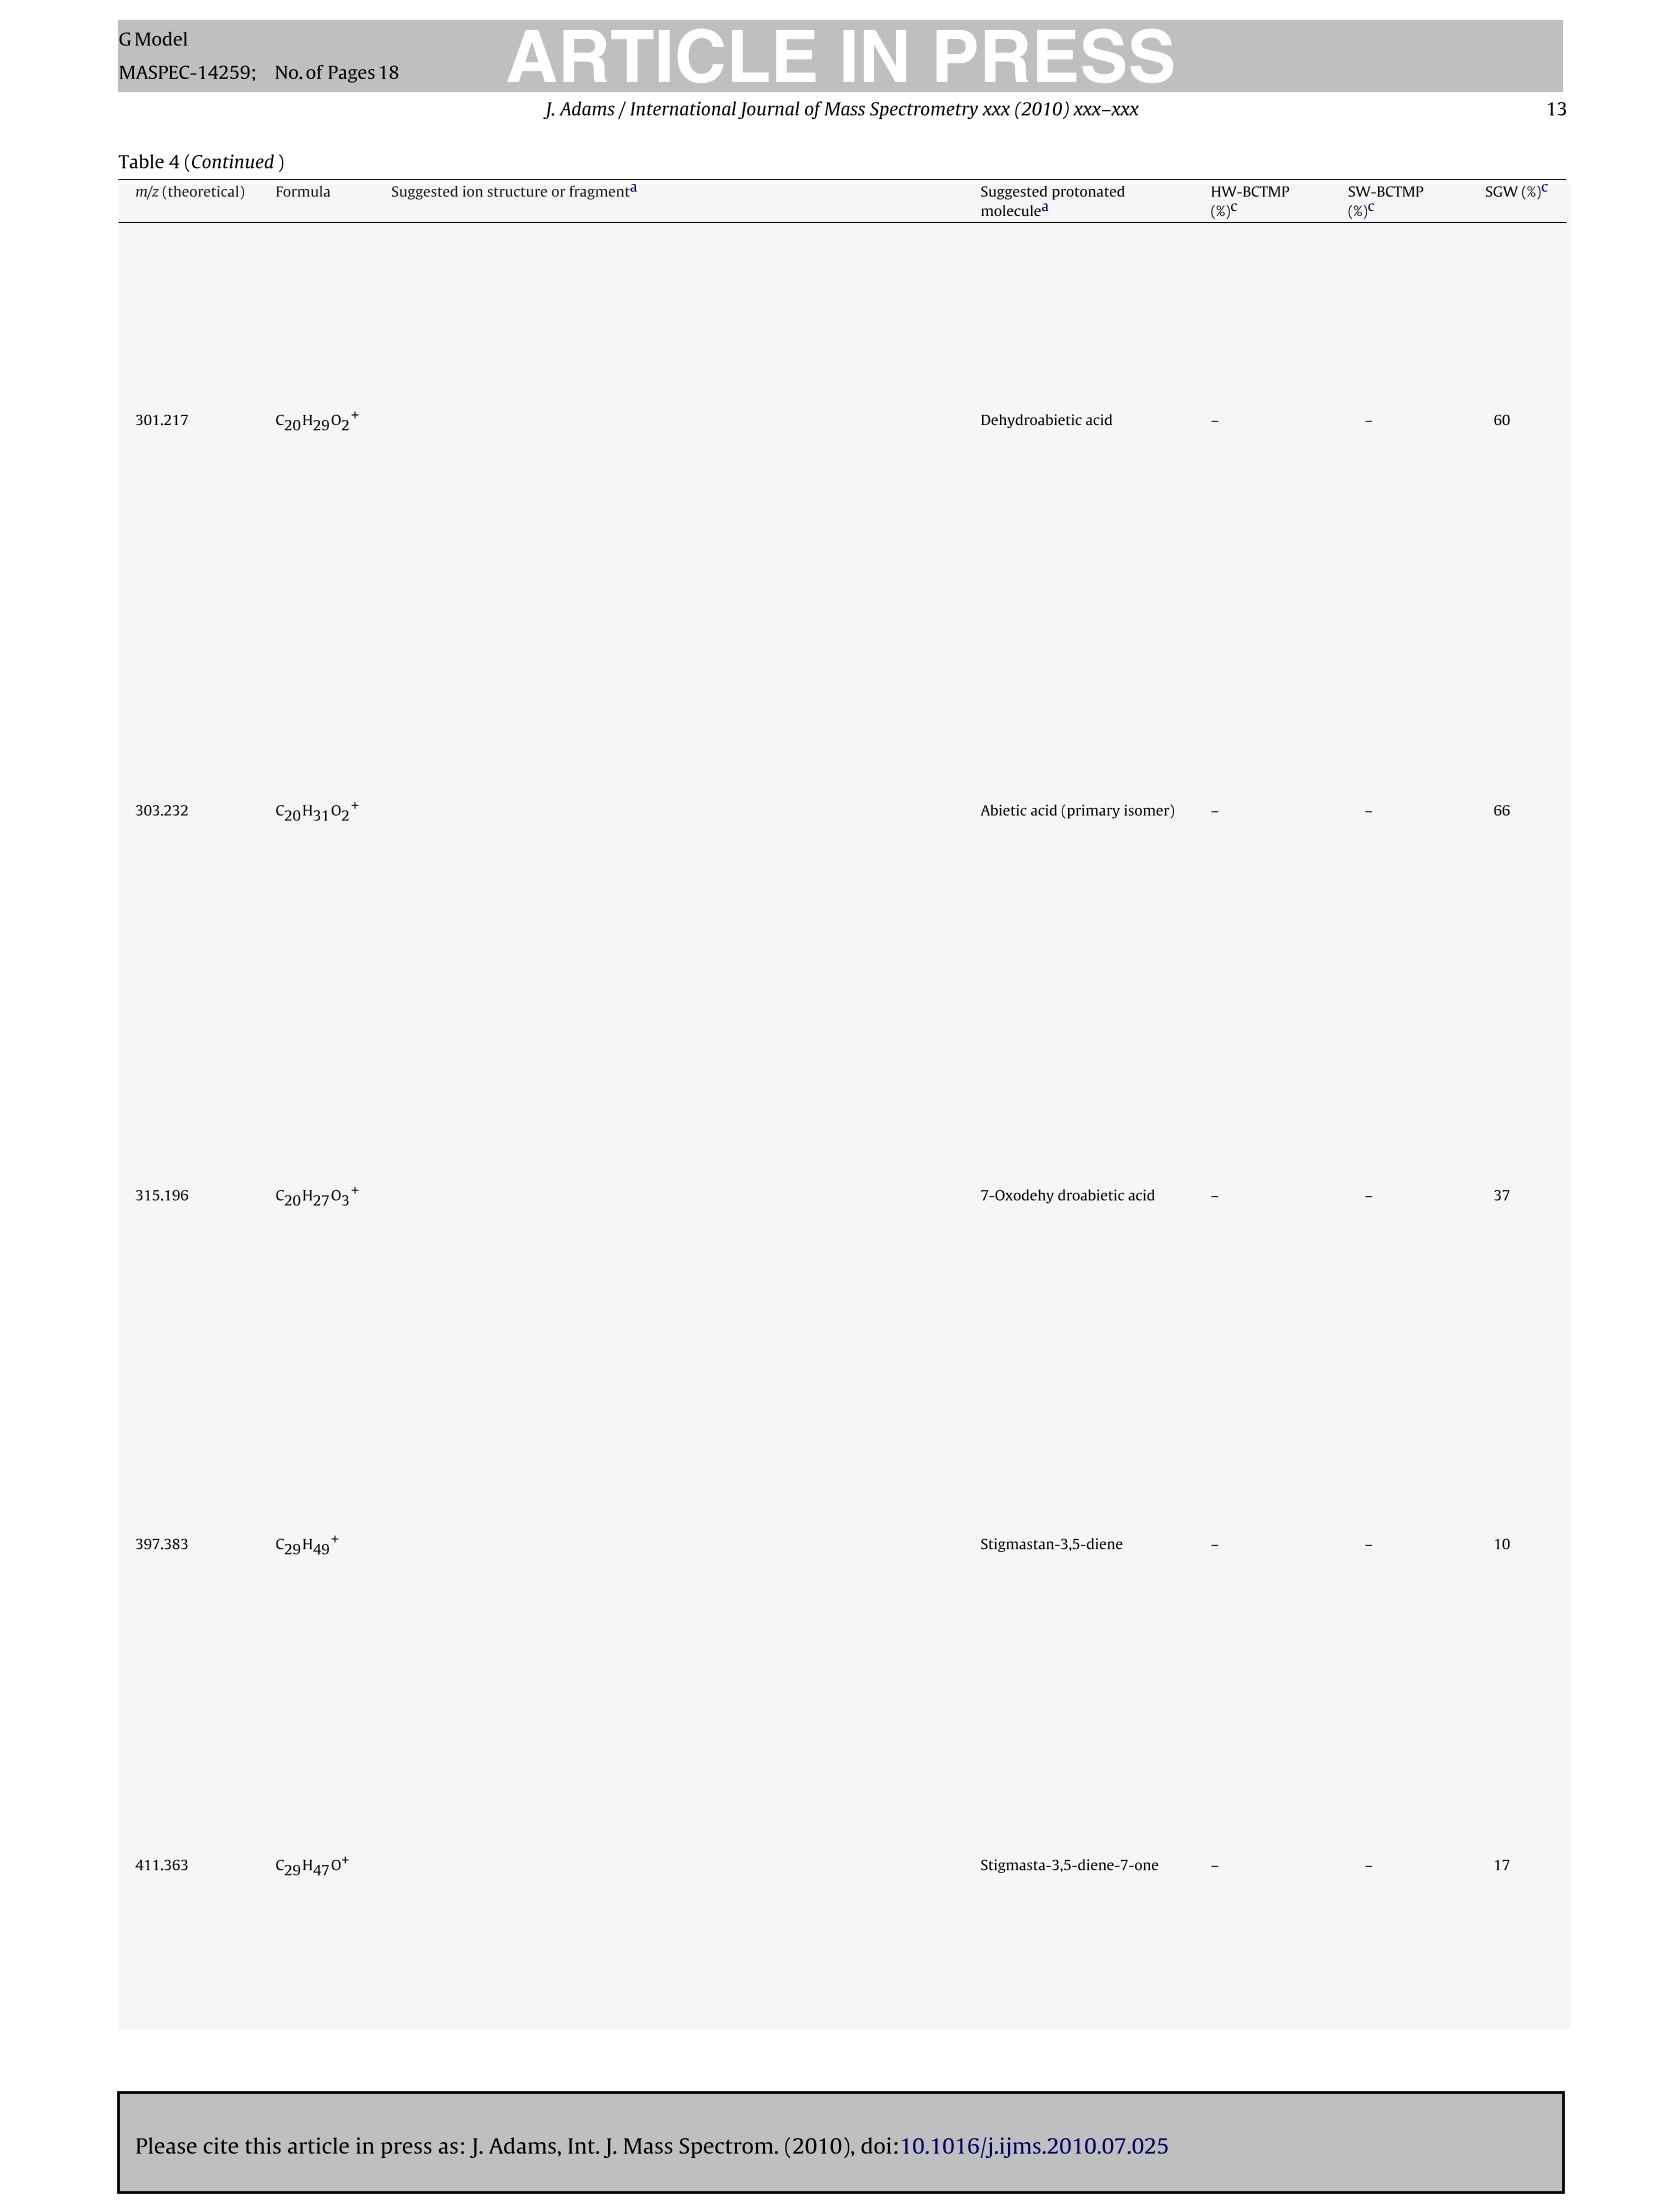
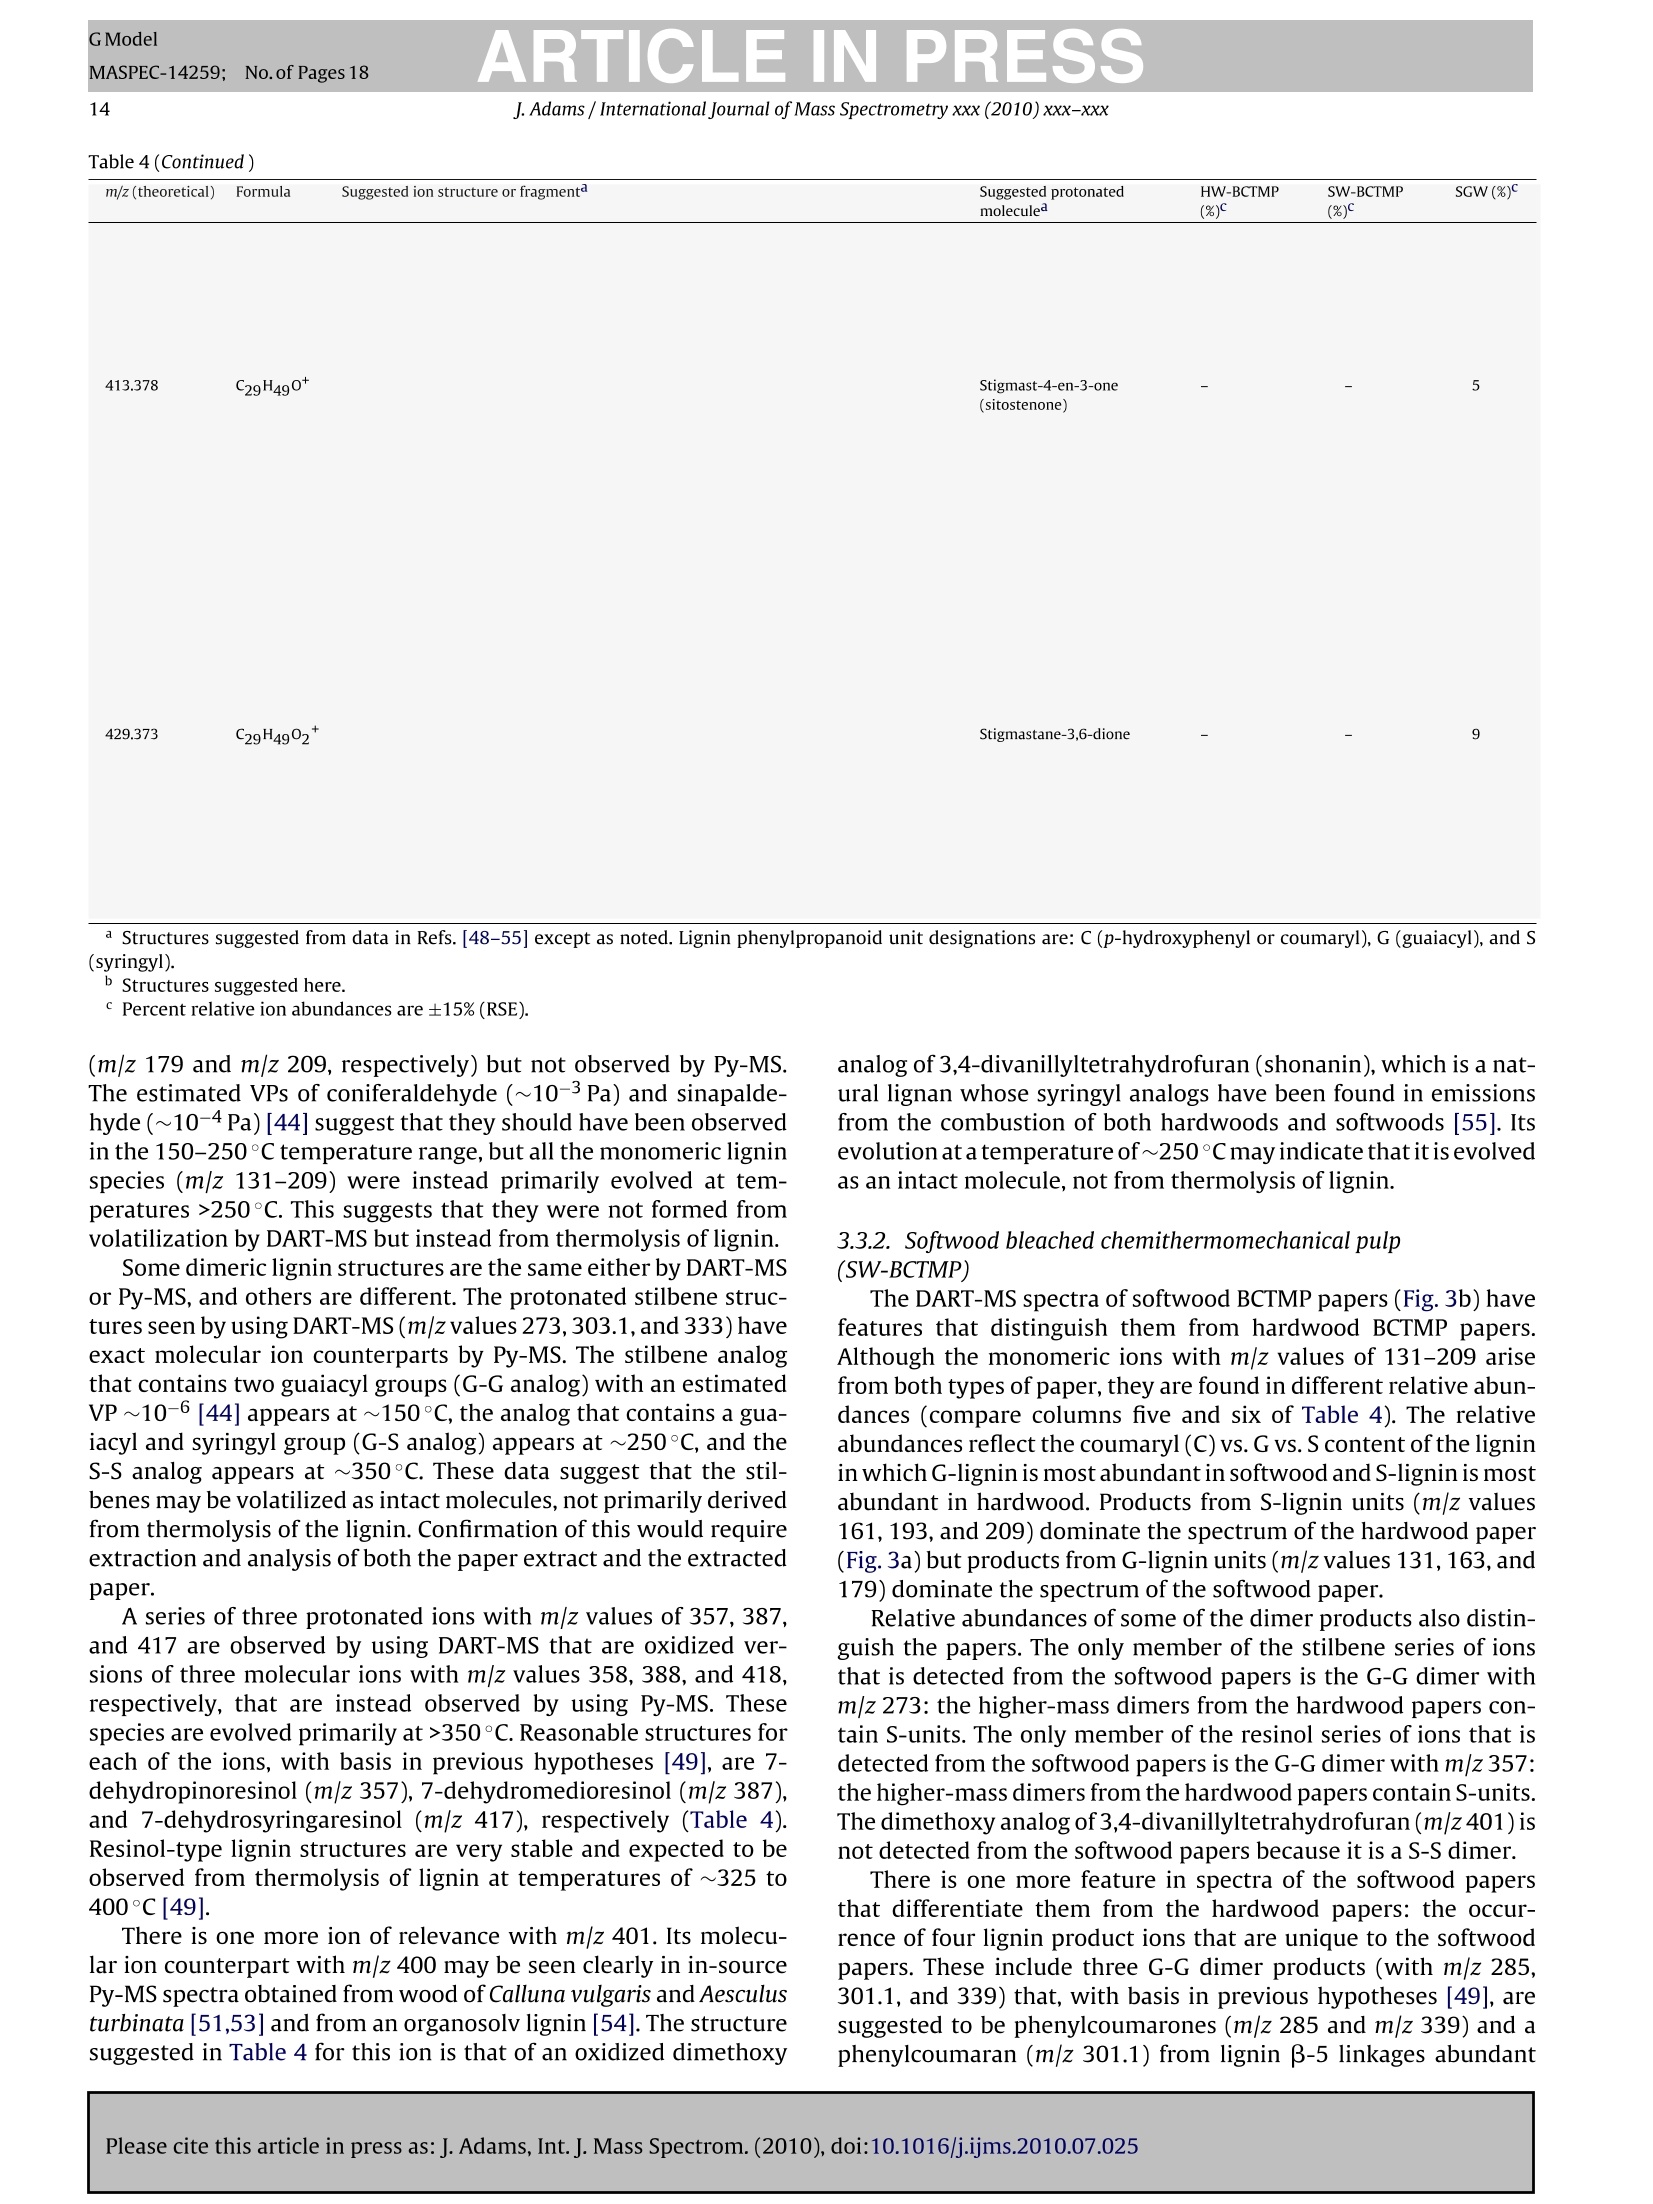
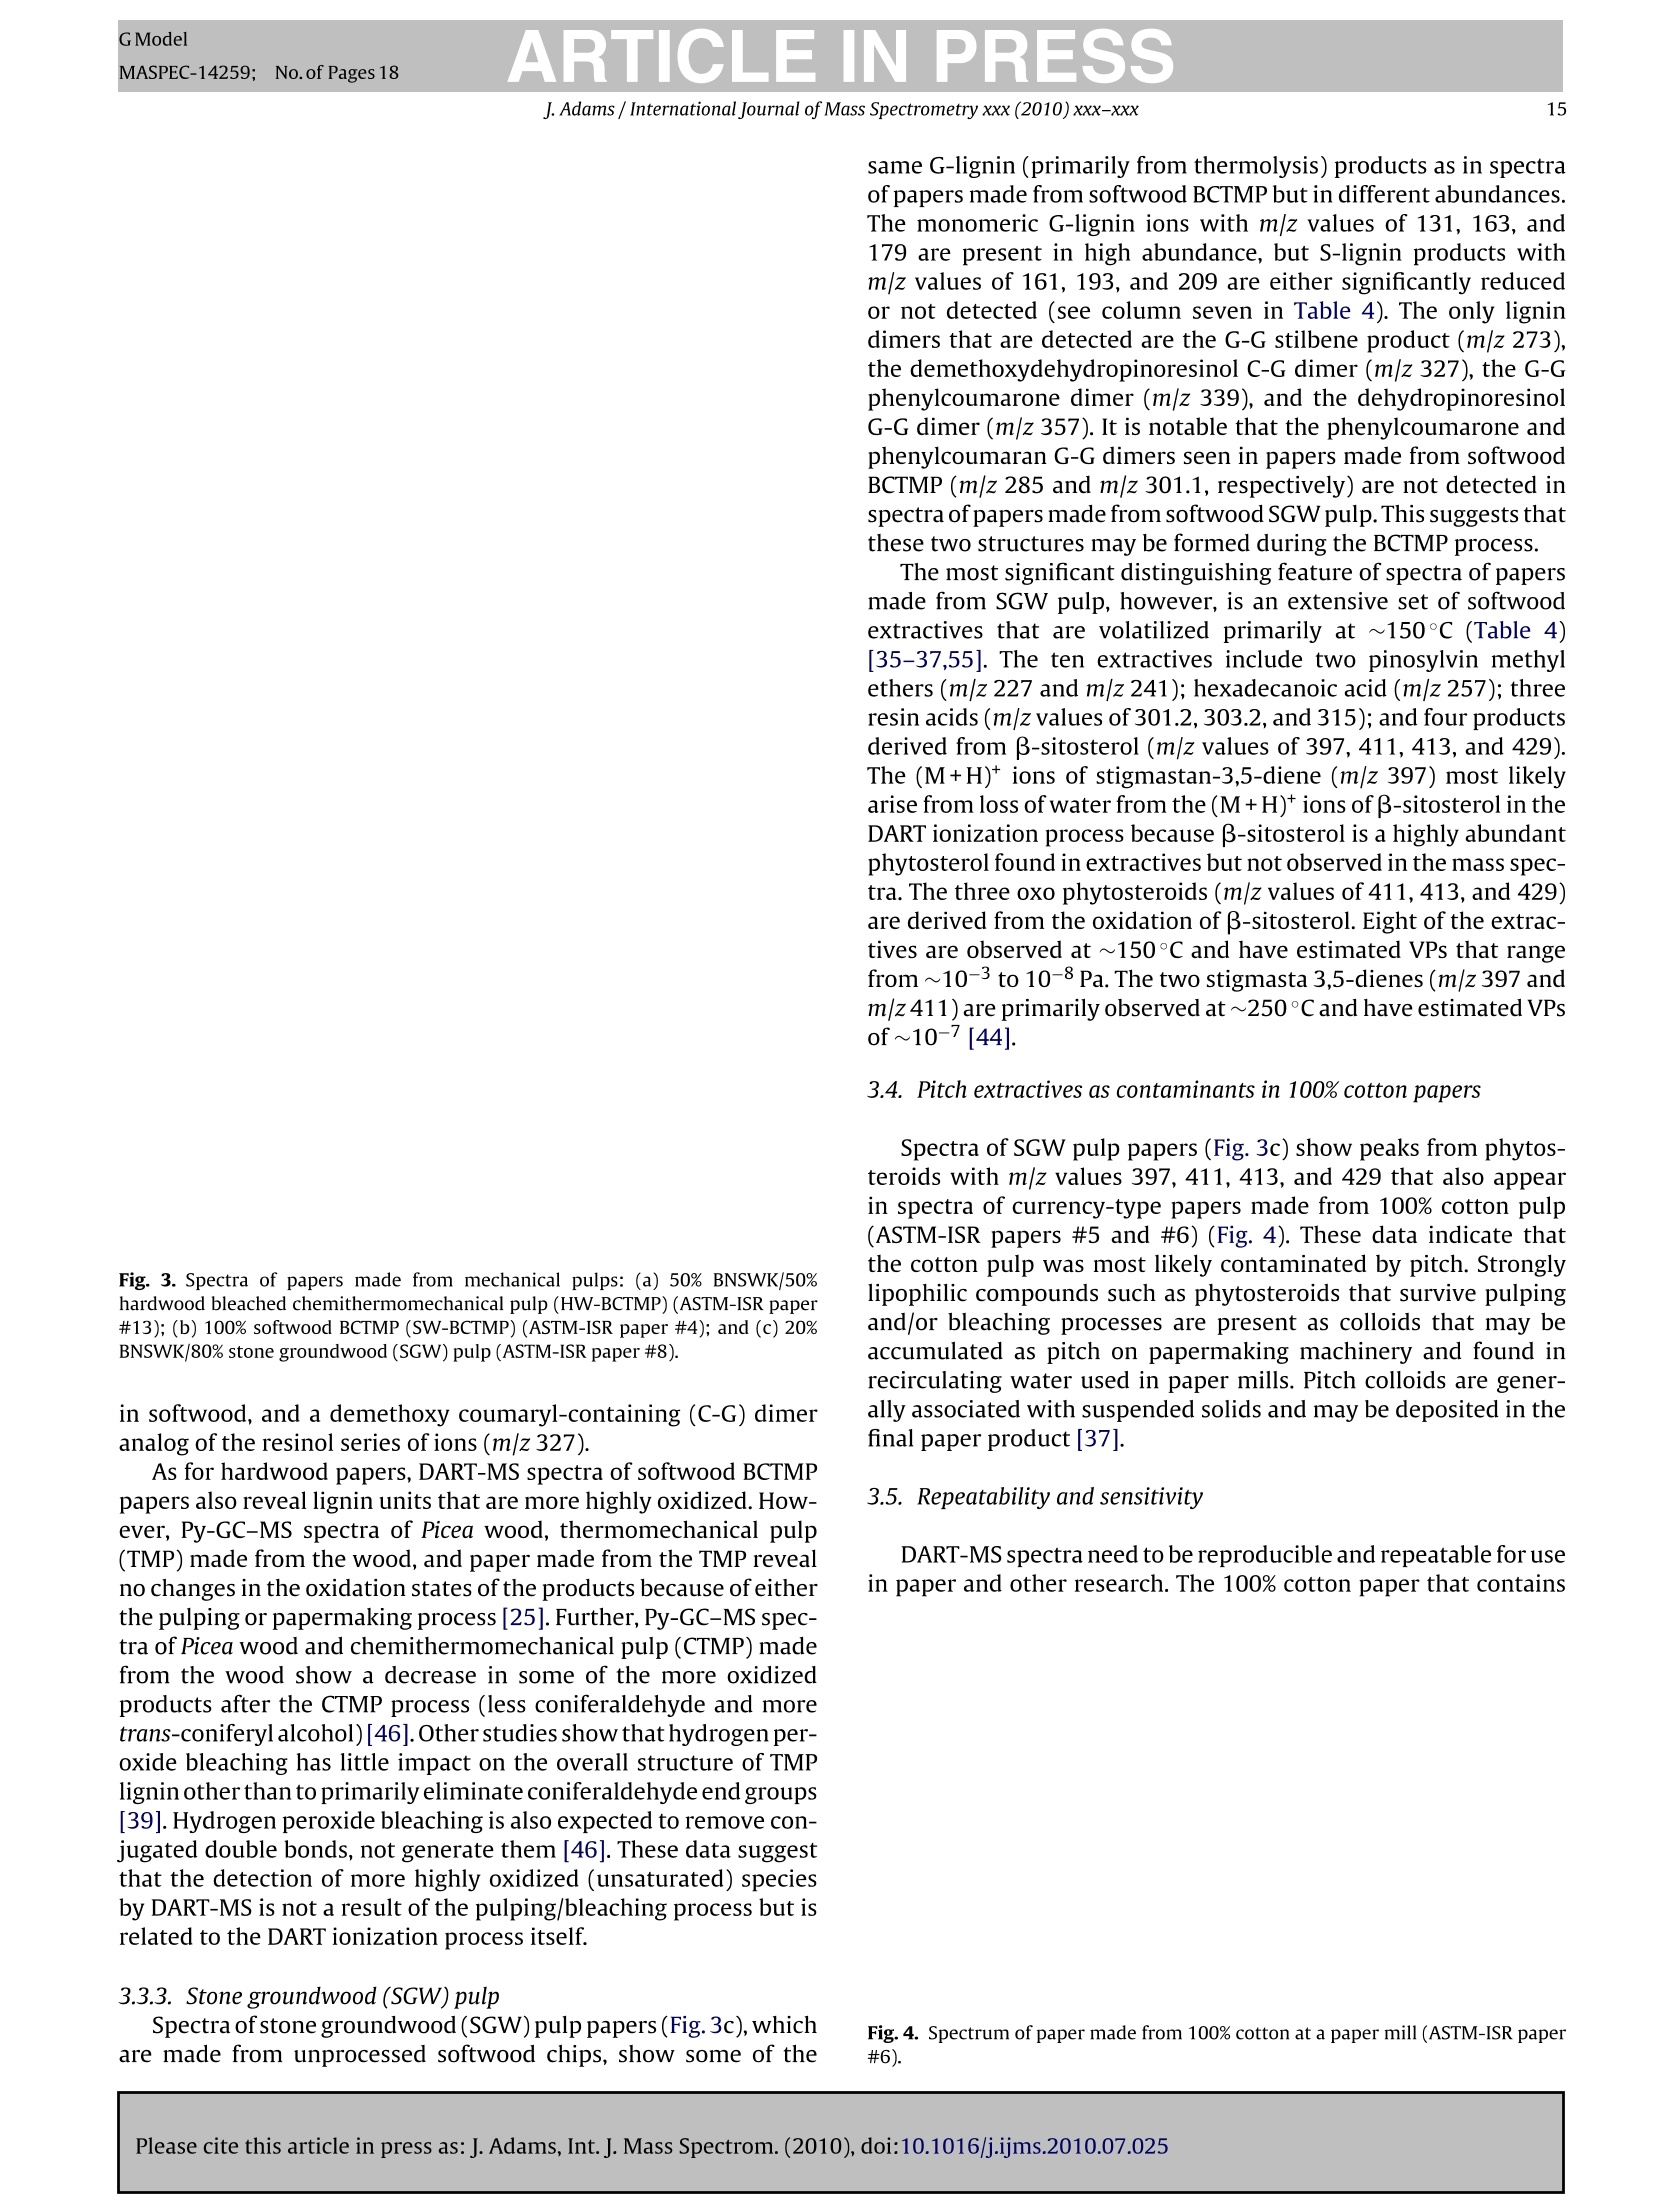
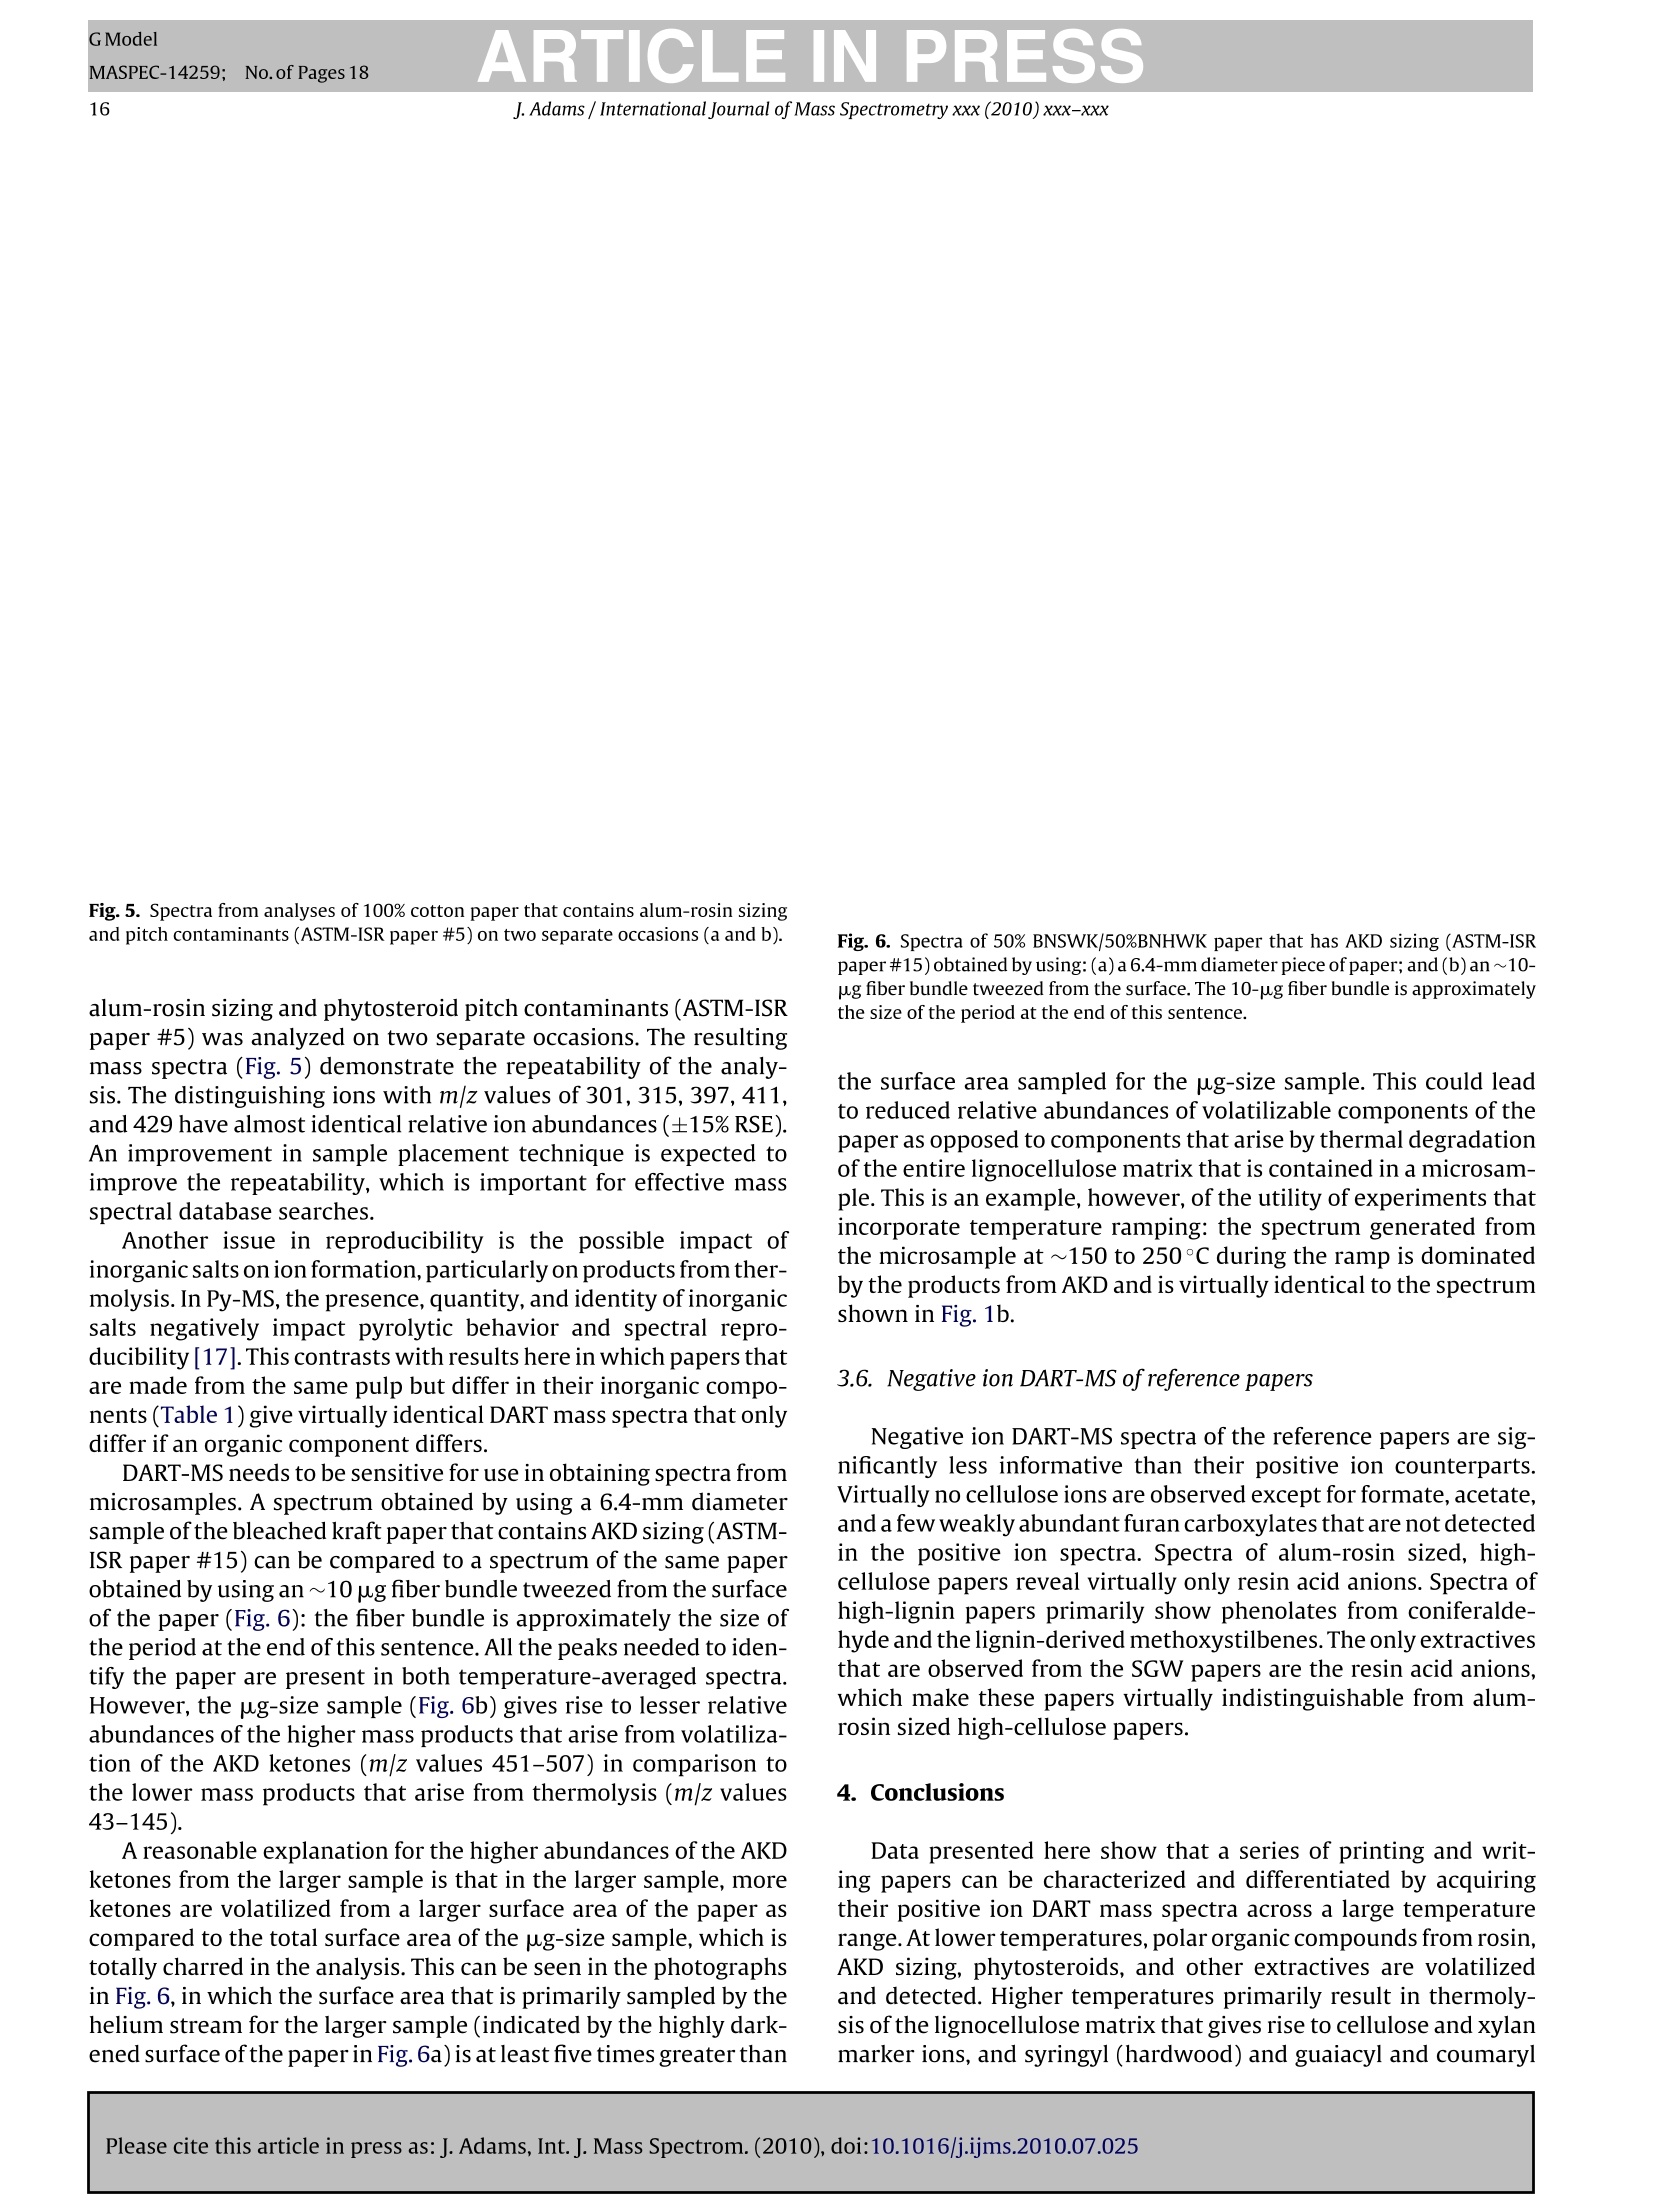
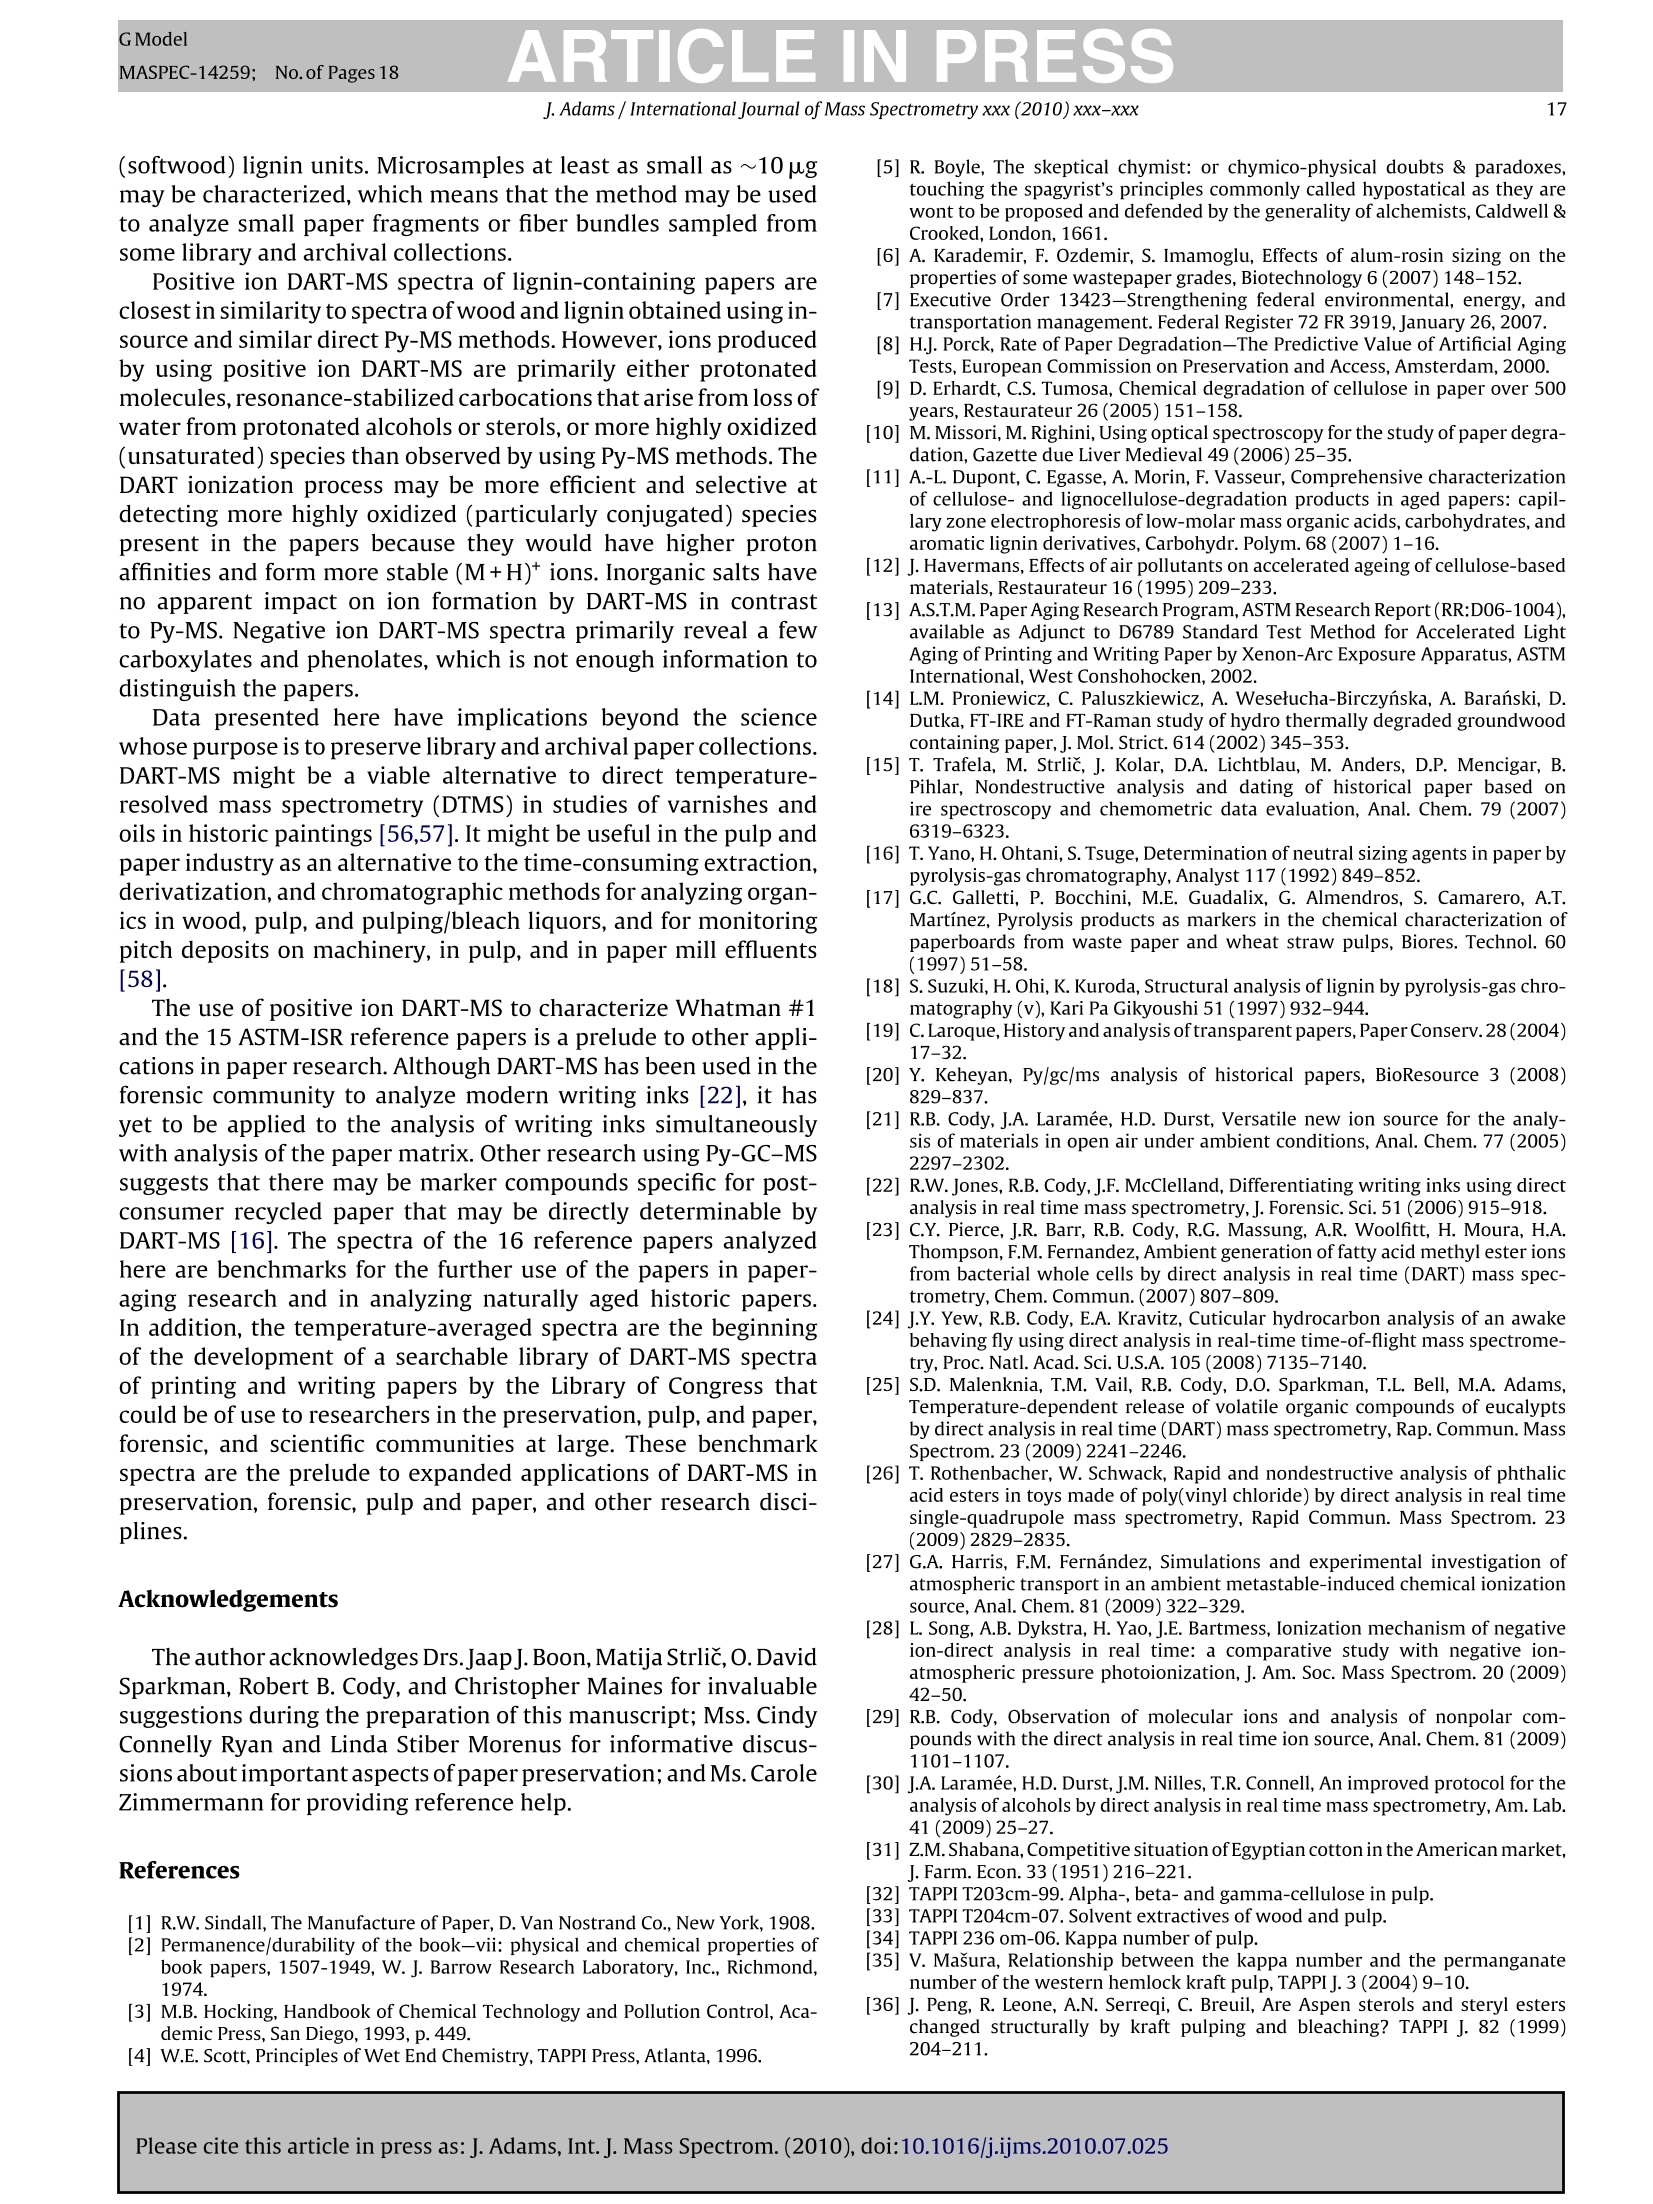
GModelMASPEC-14259; No.of Pages 18 ARTICLE IN PRESSGModelMASPEC-14259:;1No.of Pages 18J. Adams / International Journal of Mass Spectrometry xxx (2010) xxx-xxx2 International journal of Mass Spectrometry xxx (2010) xxx-xxx Contents lists available at ScienceDirect Mass Spectrocetry International Journal of Mass Spectrometry ELSEVIER journal homepage: www.elsevier.com/locate/ijms Analysis of printing and writing papers by using direct analysisin real time mass spectrometry Ieanette Adams* Binding and Collections Care Division,Library of Congress, 101 Independence Ave., SE, Washington, DC 20540-4520, USA ARTICLE IN F O ABSTRAC T Article history: Received 31 March 2010Received in revised form 16 July 2010Accepted 26 July 2010 Available online xxx Keywords: DARTDirect analysis in real timePaperLigninExtractivesPulp A quick and direct method for identifying organic components of papers in library and archival col-lections with minimal destructive sampling is needed for preservation, forensic, and general purposes.Direct analysis in real time mass spectrometry (DART-MS) is used for characterizing 16 reference papersofknown manufacture in terms of their pulp composition and pitch contaminants. Unique mass spectraare obtained from bleached kraft, chemithermomechanical, and stone groundwood pulp papers in realtime without extractions, derivatizations,chromatographic separations, and other time- and chemical-consuming sample preparations. Phytosteroids are volatilized from bleached hardwood kraft but notfrom bleached softwood kraft papers, which differentiates the two of them. The kraft papers are in turndifferentiated from chemithermomechanical pulp papers by lignin-derived thermolyis products: syringylproducts arise from hardwood, but guaiacyl and coumaryl products arise from softwood,chemithermo-mechanical pulp papers. Stone groundwood papers contain a number of extractives that are volatilized,which serve to differentiate them from all the other papers. Papers that contain rosin vs. alkyl ketenedimer (AKD) sizings are immediately differentiated. The DART-MS methodology is fast and simple, andthe spectra are repeatable. Microsamples as small as ~10 pg tweezed from the paper surface may beanalyzed. These benchmark spectra are the prelude to further applications of DART-MS in paper researchand the beginning of the development of a searchable library of DART-MS spectra of printing and writingpapers by the Library of Congress. Published by Elsevier B.V. 1.Introduction The chemical composition of printing and writing papers varieswith manufacture and age [1-4]. Some of the most stable Euro-pean papers were hand-made prior to approximately 1650 fromhigh-quality linen rags. These papers contain long celulose fibers,frequently have an alkaline pH from calcium and magnesium car-bonates, and are impregnated with gelatin as an external sizingagent, which was used to either decrease or prevent ink from feath-ering when applied to the paper. During the latter half of the 17thcentury,mechanization and the newly born science of chemistry[5] began to play greater roles in paper production. Papermaker'salum(aluminum sulfate,Al2(SO4)3·18H20)began to be used to helpset the gelatin sizing and improve the properties of the sheet, butit was not yet known that Al3+ would undergo hydrolysis in thepresence of water to generate acidity(pKa=5.0) [4]. The Indus-trial Revolutions of the 18th and 19th centuries then gave rise tonew papermaking machinery that severely macerated the pulp and *Corresponding author. Tel.:+1202 707 1031; fax: +1 202 707 3434.E-mail address: jead@loc.gov. fast heat-dried the paper. This was coupled with the use of sul-furic acid and chlorine as bleaches; the substitution of rag fiberswith straw, vegetable, and ultimately, in 1840s, mechanical stonegroundwood; and the replacement of gelatin with alum-rosininter-nal sizing. Mechanical pulp fibers are short and unpurified so theycontain high levels of lignin and other phytochemicals that areeither inherently acidic, can decompose to produce acids, and/orcan cause photoyellowing. Rosin sizing contains abietic and sim-ilar acids, and requires alum and an acidic pH for efficient sizing.Deterioration of the physicochemical properties of paper continuedinto the 20th century in spite of the invention of delignified chemi-cal wood pulp and the introduction of calcium carbonate as a filler.During the late 20th century, alkaline papermaking using the syn-thetic sizing agents alkyl ketene dimer (AKD) and alkenyl succinicanhydride (ASA) and chlorine-free bleaching processes began to beused in response to environmental regulations and concerns aboutthe archival permanence ofpaper. However, acidic papers that con-tain alum-rosin sizing continue to be produced around the world[6]. International movements toward green technology are settingtargets for the use of high-yield chemithermomechanical and post-consumer recycled pulps in 21st century papers [7]. Consequently,the paper substrate that is the base material in library and archivalwritten and printed collections is and will continue to be inherently highly variable and subject to chemical degradation at variablerates. Determining the various chemical components of differentpaper substrates and their impact on long-term physical and opticalstability, and determining the impact of conservation treatmentson the components, is a challenge. Although the acidity of paper iswell accepted as having a major impact on stability, other chemicalcomponents including metal ions, lignin, additives, and degrada-tion products, and effects of temperature, humidity, oxygen, light,and pollutants on the chemical components, also impact degrada-tion [8]. Studies of historic naturally aged papers have provideduseful insights into some degradation processes [2,9-11], but theoriginal properties of the papers and the conditions under whichthey have been stored are variables that can impact their physic-ochemical properties in unknown ways. To reduce the variables,studies of modern reference papers of known manufacture are nowbeing used more extensively in accelerated aging experiments tomodel aging behavior of naturally aged papers. These referencepapers include one set made in the early 1990s for researchers inthe European conservation community [12] and another set madein 1995 for the ASTM International Institute for Standards Research(ASTM-ISR) as part of the ASTM Paper Aging Research Program [13].Aqueous and organic extracts of some of the ASTM-ISR papers, ofwhich the Library of Congress is steward, were analyzed before andafter accelerated aging, but the chromatographic methodologieswere indirect and compound-class specific: capillary electrophore-sis (CE) with either UV or photodiode array detection was used todetect low-mass water soluble aliphatic acids and either water-or methanol-soluble monomeric lignin degradation products; highperformance liquid chromatography (HPLC) with UV detection wasused to detect methanol-soluble monomeric lignin degradationproducts; ion chromatography with pulsed amperometric detec-tion was used to detect low-mass water soluble sugars; and gaschromatography-mass spectrometry (GC-MS) was used to detectmethyl-t-butyl ether soluble fatty and resin acids after silylation. Other analytical methods have also been used to study paper.Fourier transform (FT) infrared, near infrared, and FT-Ramanspectroscopy, with or without either spectral deconvolution orchemometric analysis, have been used to study paper degrada-tion [14,15]. These non-destructive spectroscopic methods mayreveal functional groups of predominant compounds but not spe-cific compound identification. Pyrolysis GC (Py-GC)and Py-GC-MShave been used to analyze paper and additives with and withoutderivatization [16-20]. These micro-destructive methods provideforidentification of compounds volatilized and/or formed by pyrol-ysis, but GC is limited by compound volatility and thermal stability,and the analyses are time consuming. An analytical technique that provides fast sample throughputand identification of relevant organic compounds with minimaldestructive sampling would be invaluable in paper research. Directanalysis in real time mass spectrometry (DART-MS) is a relativelynew MS method that directly and quickly identifies intact volatile,semivolatile, and nonvolatile polar organic compounds in a varietyof matrices without extractions, derivatizations, and chromato-graphic separations [21]. Analyses of solid samples have includedwriting inks [22], bacterial whole cells [23], flies [24], plant materi-als [25], and toys [26]. Several studies have addressed mechanismsof ion formation and factors that impact sensitivity and repro-ducibility [21,27-29]. This article is the first to describe methods to characterize print-ing and writing papers by using positive ion DART-MS. Whatman#1 100%cotton cellulose filter paper and the 15 ASTM-ISR referencepapers were analyzed. Specific techniques that provide a thoroughanalysis, and the repeatability and sensitivity of the method foranalyzing microsamples, are addressed. Positive ions observed byusing DART-MS are discussed in relation to ions observed by using Py-MS, which provides added insight into ion formation from solidmaterials by using DART-MS. 2. Experimental 2.1. Instrumental analysis The mass spectrometer used in these experiments is a JEOL JMS-T100 DART AccuTOF-D (JEOL USA, Peabody, MA) equipped with asecond-generation DART ion source (IonSense, Saugus, MA). Thepertinent settings for the interface between the pinhole orifice atatmospheric pressure and the low-pressure of the time-of-flight(TOF) mass analyzer were: Orifice One (01), 30V and 120°C; ringlens, 10V; and orifice 2, 5V. These settings maximized the proto-nated water dimer [(H20)2+H]+ with m/z 37, which implied thatcollision-induced decompositions that occur in the interface wereminimized. To maximize sensitivity across a broad mass range of10-1000u, the radio frequency (RF) ion guide voltage was sweptfrom 100 to 2500V, with an initial hold time of 60% and a sweeptime of 20% of the spectrum record time, during acquisition of eachspectrum. The spectrum recording interval was 1.00 s, wait time0.03 s, and data sampling interval 1 ns. The mass resolving power(m/Am) of the TOF was 6000 (full width at half maximum,FWHM)at 700 u. The m/z scale was calibrated using water and methanolclusters, and polyethylene glycol (PEG-600), ions from a methanolsolution in a global calibration (calibration file acquired indepen-dently of sample file). This method of calibration in conjunctionwith scanning the ion guide resulted in an average mass accuracyof ±3 mmu across the mass range, which is equivalent to ±8 ppmat mz 40 and ±1 ppm at mz 500. This is less accurate than themanufacturer specified ±2 mmu and significantly less than whatis achievable by using a static ion guide voltage and internal cali-bration (spectrum of calibrant acquired as partof sample file)[30].Background spectra were acquired for all analyses and were sub-tracted from the spectra of the samples. The DART ion source was operated using a flow of helium thatwas registered as 5.0Lmin-1 by the MS software but was mea-sured actually to be 5.77 L min-1(number of measurements (n)=5;relative standard error(RSE)=1.01%).The actual flow rate was mea-sured by using a Gilmont GF-8522-1606 rotameter that had beencalibrated by the National Institute of Standards and Technology(NIST) as reporting a flow rate for helium of 20.4Lmin-1at themaximum scale reading. Measurements were made by connectingthe rotameter to the ceramic outlet of the ion source using Tygontubing. The ceramic outlet of the ion source was positioned 10 mm fromthe pinhole orifice that leaks into the mass analyzer. The tempera-ture of the helium exiting the ion source was measured at a distanceof1 mm from the ceramic outlet using a Control Company TraceableDual-Channel Thermometer with a type-K beaded thermocoupleprobe. This digital thermometer has a sampling time of 0.8-1.0 sand an accuracy of ±0.75% or ±1°C (whichever is greater). All equipment to contact paper samples was cleaned usingrinses of purified water, acetone, and dichloromethane (PesticideResidue Analysis or comparable grades, Fisher Scientific) to removeplasticizers and other organic contaminants. Paper sheets wereeither cut into 6.4 mm diameter samples using a commercial hand-held paper hole punch, or microsamples were obtainedby tweezingfiber bundles from the papers under a microscope. Samples werepositioned at roomtemperature in the helium at a distance of 1 mmfrom the ceramic outlet of the ion source by using fine-point stain-less steel tweezers. Two types of experiments were conducted that involved heat-ing the helium to higher temperatures.One involved equilibratingthe helium at different temperatures that were set using the MS ( Please cite this article in press as:J. Adams, Int. J. Mass Spectrom. (2010), doi:10.1016/j . ijms.2010.07.025 ) Table 1Furnish description of the 15 ASTM-ISR papers. Number First pulp type Second pulp type pH of stock pH-control chemicalC CaCO3 (PCC) filler External sizing Internal sizing 1 100% BNSWK 5.0 Alum Rosin 2 8.1 Na2CO3 5% - - 3 100% SW-BCTMP 5.0 Alum - - 4 - 8.1 Na2CO3 5% 5 100% COTTON - 5.0 Alum - - Rosin 6 8.1 Na2CO3 5% - 7 20%BNSWK 80% SGW 5.0 Alum - - - 8 7.0 SMI Process 5% 9 20% BNSWK 80%HW-BCTMP 8.1 Na2CO3 10 8.1 Na2CO3 5% - 11 50% BNSWK 50% BNHWK 8.1 Na2CO3 - 12 8.1 Na2CO3 5% - - 13 50%BNSWK 50% HW-BCTMP 8.1 Na2CO3 5% - 14 5.0 Alum Rosin 15 50% BNSWK 50% BNHWK 8.1 Na2CO3 5% Penford Gum 270 AKD a Samples 5 and 6 were produced by Crane and Co., Inc. at their Dalton, MA paper mill on their Fourdrinier “Pioneer”paper machine. All other papers were made on a36-inch Fourdrinier paper machine at the Herty Foundation in Savannah, GA. In the table above, the letter designations have the following meanings: SW, softwood; HW,hardwood; BNSWK, bleached northern softwood kraft pulp;BNHWK, bleached northern hardwood kraft pulp; BCTMP, bleached chemithermomechanical pulp;SGW, stonegroundwood pulp; SMI, Specialty Minerals, Inc.; AKD, alkyl ketene dimer sizing. pH is of the stock, not the paper, in which the stock is the watery pulp that contains all the additives prior to producing the paper on the papermaking machine.Alum (aluminum sulfate, Al2(SO4)3.14H2O) was dry, iron-free (General Chemical Corp.); Na2CO3 (soda ash) was from FMC, Inc.; precipitated calcium carbonate (PCC)was from Specialty Minerals, Inc.; Penford Gum 270 was from Penford Products Co.; rosin was Neuphor 635 anionic dispersed sizing (Hercules, Inc.); and AKD was Hercon70 reactive sizing (Hercules, Inc.). software and then acquiring background and sample spectra: anequilibration time of 15-30s was needed to obtain a stable tem-perature reading. A second involved ramping the temperature ofthe helium using the MS software: the software was set to a tem-perature of 20°C, the helium was allowed to equilibrate (to anactual temperature of 55°C), data acquisition was begun, back-ground spectra were acquired, a sample was positioned in thehelium, and then the software temperature setting was changedto 500°C. When the software temperature reading reached 450°C,data acquisition was halted. This procedure gave a 125°Cmin-(n=7, RSE=2.5%) rate of change of temperature of the helium asmeasured at the outlet of the ion source ceramic. The MS soft-ware used in these experiments does not permit ramping of thetemperature at operator-defined rates. 2.2. Reference papers The sixteen reference papers analyzed include 15 ASTM-ISRprinting and writing papers stored at the Library of Congress andWhatman #1 100% cotton cellulose filter paper. 2.2.1. Furnish descriptions The furnish descriptions for each of the ASTM-ISR papers aregiven in Table 1, in which "furnish"refers to the aqueous suspen-sion or“stock”of the fibrous materials and all additives that arebeing prepared for conversion into paper [4]. The ASTM-ISR paperswere manufactured in 1995 at paper mills under controlled con-ditions and chemical specifications (Table 1). Papers made fromcotton (ASTM-ISR papers #5 and #6) and bleached kraft woodpulps (ASTM-ISR papers #1,#2,#11,#12,and #15) may be consid-ered“wood-free”because they are highly purified and primarilycontain cellulose. Cotton pulps are used in currency paper, andbleached kraft pulps are used in fine writing papers. Paper #6may be considered a close model of stable alkaline pre-1650 ragpapers that contain natural carbonates but without gelatin sizing.Paper #5 more closely reflects rag papers from the late 1800s to1900s that contain acidic alum-rosin sizing. Kraft papers #1 and #2,which reflect 20th century technologies, either are acidic and con-tain alum-rosin sizing or are alkaline and contain CaCO3 as filler,respectively. Calcium carbonate fillers have been used since theearly 1900s to provide an increase in paper opacity,brightness,and Furnish Species Fiber length (mm)b a-Cellulose (%) Extractives (%)d Kappa number° Klason lignin(%) BNSWK 100% Softwood 2.75 84 0.050 0.81 <0.1 70-80%Spruce 20-30% Jack pine BNHWK 5-10%Balsam fir 96% Hardwood Populus sp. 4% Softwood Spruce and jack pine 100% Softwood >95% Spruce 0.97 93 0.18 0.77 ≤0.1 SW-BCTMP 2.25 0.12 23 ~3 to 4 <5%Jack pine HW-BCTMP (Millar Western Mill)a 100%Hardwood Populus sp. 0.98 0.13 23 ~3 to 4 HW-BCTMP (Tembec Mill)a 100%Hardwood Populus sp. 0.90 - 0.15 23 ~3 to 4 SGW 100% Softwood Picea sp. 一 Cotton Gossypium hirsutum 27-29 一 - a Papers that contained HW-BCTMP were made from equal mixtures of the two HW-BCTMP pulps. Weighted average. The 100% cotton paper was made from long-staple textile-grade cotton fiber [31]. · Determined at paper mill using TAPPI standard method T203 om-93 (current designation: T203 cm-99)[32].This method can only be used for delignified pulps. Determined at paper mill using TAPPI T204 om-88(current designation: T204 cm-07)[33]. e Determined at paper mill using TAPPI um-251 (current designation: T236 om-06)[34]. I Percent(%) klason lignin was calculated from (Kappa numberx0.13)[34]and (Kappa numberx0.17)[35]. bulk [3]. Other wood-free papers #11, #12, and #15 represent thefinest modern (late 20th-21stcentury)printing and writing papers.In particular, paper #15 is a high-quality bleached kraft alkalinepaper that contains a late 20th-century internal sizing agent, alkylketene dimer (AKD), and an external gum sizing (a hydroxyethylether derivative of cornstarch). Several“wood-containing"papers contain either stone ground-wood (SGW) or bleached chemithermomechanical pulps (BCTMP).Papers #7 and #8 are similar to wood pulp papers from 1800sto 1900s: modern stone groundwood pulp is manufactured usingessentially the same process that was developed in 1800s [3,4].Although stone groundwood was used in 1800s and early 1900sfor many types of papers, it is primarily used now in newsprint.The other wood-containing papers (ASTM-ISR papers #3,#4, #9,#10, #13,#14) were made using BCTMP, which is a late 20th-century high-yield wood pulp that is increasingly being used incoated papers and added to copy/offset/inkjet papers, as describedmore in Section 2.2.2. 2.2.2. Pulp characteristics Some general characteristics of the pulps used in the papersare given in Table 2. The two kraft pulps, one softwood (spruce,pine, and fir) and one hardwood (aspen), were delignified usingthe alkaline sulfate kraft process followed by bleaching, whichremoves most of the hemicelluloses, extractives (lipophilic phy-tochemicals such as fatty acids and alcohols, triglycerides, waxes,terpenoids, lignans, steroids and sterols, stilbenes, and flavonoids[3,36-38]), and lignin. The softwood kraft (BNSWK) pulp containsa small percentage of extractives (0.05%) and lignin (≤0.1%). Thehardwood kraft (BNHWK) pulp contains four times as much extrac-tives (0.18%) than the softwood pulp, although the amount of ligninin both pulps is comparable. The bleached chemithermomechanical pulps (BCTMP) aremechanical pulps that are pretreated with steam and a hot solu-tion of sodium hydroxide and/or sodium sulfite to soften thewood chips prior to defibering so that the pulp has longer fibers,higher strength, and lower fines as compared to stone ground-wood pulp [3,4]. The pulp is bleached using hydrogen peroxide(totally chlorine free, or TCF, bleaching), which removes conju-gation (chromophores) but not the lignin [39,40]. Consequently,the amount of lignin is significantly higher in the BCTMP than thekraft pulps (3-4%), but the amount of extractives is comparable tothe hardwood kraft pulp (Table 2). The TAPPI (founded in 1915 asthe Technical Association of the Pulp and Paper Industry) standardmethods that were used to provide the analytical data in Table 2[32-34] give no information regarding the identities of the extrac-tives. The stone groundwood (SGW) pulp is a softwood (spruce)mechanical pulp. There are no chemical treatments involved, sothis pulp contains all the cellulose, hemicelluloses, extractives, andlignin that are contained in the original wood. The final pulp is 100% cotton used in currency paper. The papermade from this pulp should be very pure and comparable in chem-ical composition to Whatman #1 filter paper, which is made fromcotton linters. 3. Results and discussion 3.1. Temperature dependency of mass spectra In developing the methodology for analysis of paper by usingDART-MS, the temperature of the helium was found to significantlyimpact the information obtained. The first method that was eval-uated involved setting the helium temperature to different statictemperatures, and then inserting the paper into the helium stream. This method was not useful, however, because it resulted in irre-producible flash vaporization of different substances depending ontemperature. In contrast, the most thorough and repeatable analy-ses were obtained by ramping the temperature of the helium fromambient to a high temperature during data acquisition to obtain thetemperature-dependent spectra of all the substances evolved. Thisis demonstrated in Fig. 1 for the analysis of a high-cellulose paperthat contains late 20th-century alkyl ketene dimer (AKD) internalsizing. The total ion chromatogram (TIC) (Fig. 1a) shows that: (1)from time 0.6 to 1.3 min, a piece of organic-free aluminum wasinserted into the helium stream to provide a“blank”spectrum ofall species in the laboratory air that appear to arise from the tur-bulence of the gas as a result of simply inserting an object intothe gas stream; (2) at time 1.8-2.6 min, a sample was positionedin the helium stream to reduce the intensity counts to ~25% ofthe air background; and (3) from time 2.6 to 7.2 min, the temper-ature of the helium was software-ramped from 20 to 500°C. Thescales in Fig. 1a show the relationship between ramp time and theactual (as opposed to software) temperature of the helium strikingthe sample up to approximately 350°C. By the end of the analysis(when the software temperature reading reached 450°C), charringwas evident and the size of the 6.4-mm diameter sample had beenreduced by ~200 pm. The background-subtracted spectra in Fig. 1b-e show how dif-ferent substances, which will be discussed in Sections 3.2-3.3, aredetected at different temperatures. As the helium temperaturerises to ~150 to 250°C (Fig. 1b), intact polar organic compounds(~200 to 600 u) from sizing, extractives, and/or other semi-to non-volatile organic substances are evolved. At temperatures of ~250to 350°C (Fig.1c), low-mass thermolysis products (~40 to 200 u)from cellulose are clearly seen. At temperatures >350°C (Fig.1d),the low-mass cellulose-derived ions dominate.Although each tem-perature range provides different detailed information about thepaper constituents, a composite“fingerprint”of both the paper sub-strate and other substances present can be obtained by softwareaveraging all spectra across all temperatures (Fig.1e). These “tem-perature averaged” mass spectra, which contain all the chemicalinformation, are used for the DART mass spectral library. 3.2. Whatman #1 (cotton) and bleached kraft papers The temperature-averaged spectrum shown in Fig. 1e of a high-cellulose kraft wood pulp paper that contains a modern sizingcan be compared to spectra of cotton and other types of high-cellulose wood-pulp papers (Fig. 2). The background-subtracted,temperature-averaged spectrum of Whatman #1 filter paper (100%cotton cellulose) is shown in Fig. 2a. The low-mass series of peaksarises from the thermal decomposition of cellulose that primarilyoccurs at>250°C. The thermolysis products are volatiles that arisefrom dehydration and thermolytic chain scission reactions [41].Many products are of the same elemental formulae reported fromPy-MS of cellulose, carbohydrates, and Whatman paper (Table 3)[20,41,42]. There are some, however, that have not been previ-ously reported, and their structures are suggested here with basisin structure and formula searches of the NIST05 NIST/EPA/NIH MassSpectral Library [43]and on-line chemical search engines (primarilyChemSpider [44] and ChemExper [45]). There are also products notobserved in the DART-MS spectra that are seen in Py-MS spectra. The structures in Table 3 and the differences between DART-MSand Py-MS spectra provide insight into the types of structures thatseem to be preferentially detected by DART-MS. In particular, all theproducts shown in Table 3, and their structural isomers, are highlyoxidized and highly stable, in many cases because of charge delo-calization. Most noticeably,saturated products that contain alcoholfunctionalities that are observed in Py-MS spectra [20,41,42] areneither observed nor suggested here as structures because proto- ( Please cite this article in press as: J. Adams, Int. J. Mass Spectrom. (2010), doi:10.1016/ j .ijms.2010.07.025 ) Fig. 1. Data for a high-cellulose 50/50 bleached softwood/hardwood kraft paper thatcontains alkyl ketene dimer(AKD)internal sizing (ASTM-ISR paper #15):(a)totalionchromatogram (TIC) with temperature scale that shows the actual temperature ofthe helium striking the sample; (b) mass spectrum of compounds evolving at ~150to 250C; (c) mass spectrum of compounds evolving at ~250 to 350°C; (d) massspectrum of compounds evolving at>350°C; and(e) mass spectrum from softwareaveraging the spectra acquired across all temperatures. Fig. 2. Spectra (after subtracting the blank and software averaging across all tem-peratures) of high-cellulose papers made from:(a) 100% cotton (Whatman #1);(b) 100% bleached northern softwood kraft (BNSWK) pulp (ASTM-ISR paper #2);(c) 100% BNSWK pulp with alum-rosin sizing (ASTM-ISR paper #1); and (d) 50%BNSWK/50% BNHWK pulp (ASTM-ISR paper #12). nation of saturated alcohols in the DART ionization process wouldresult in loss of water, generating in many cases unstable carboca-tions in analogy to classic proton-transfer chemical ionization. The structures represented by ions with mz values 43-117suggest that ions with m|z values 127-145 may also be similarlyoxidized. In particular, ions with m|z 127 and mz 145 can havedifferent isomeric structures including the (M+H)+ions of lev-oglusenone (m|z 127) and 1,4:3,6-dianhydro-a-D-glucopyranose(m|z 145)[19,41]. However, more oxidized structures are also fea- J.Adams /International Journal of Mass Spectrometry xxx (2010) xxx-xxx Table 3 Ions derived from the high-temperature thermolysis of cellulose that are present in positive ion DART-MS spectra of paper. m|z (theoretical) Formula Suggested ion structure Suggested protonated molecule or fragment Please cite this article in press as:J. Adams, Int. J. Mass Spectrom. (2010), doi:10.1016/j.ijms.2010.07.025 GModel GModel MASPEC-14259;No.of Pages 18 ARTICLE IN PRESS J. Adams / International Journal of Mass Spectrometry xxx (2010) xxx-xxx Table 3 (Continued) m/z (theoretical) Formula Suggested ion structure Suggested protonated molecule or fragment GModel J. Adams / International Journal of Mass Spectrometry xxx (2010)xxx-xxx a Structures suggested from data in ref. 20,41, and 42 except as noted. Although ions with m/z 113 could be (M+H)*ions of 2-furoic acid, this possibility was eliminatedbecause its (M-H)- anions were not detected by using negative ion DART-MS. Another possible structure for ions with m/z 115 would be a methylhydroxy furanone. Thispossibility was eliminated because the protonated hydroxyl group would have been lost as H2O in analogy to proton-transfer chemical ionization (see discussion in text).B Structures suggested here. sible and previously reported for these two products that may bethe species detected by DART-MS (Table 3). The mass spectrum of a bleached softwood kraft paper (ASTM-ISR paper #2) is virtually identical to the spectrum of Whatmanfilter paper in terms of products present (Fig.2b). The high level ofpurity of this paper as revealed by the spectrum is in accord withdata in Table 2 that show that this pulp contains a high level ofcellulose and minimal extractives or lignin. When alum-rosin sizing is added to the bleached softwoodkraft paper (ASTM-ISR paper #1), the mass spectrum immediatelyreveals the presence of the rosin (Fig.2c). The resin acid protonatedmolecules, which begin to appear at ~150°C and reveal the pres-ence of the rosin sizing, are (C20H2802+H)+ from dehydroabieticacid with m|z 301.217(C20H3002+H)+ from primarily abietic acidwith m/z 303.232, and (C20H2603+H)+from 7-oxodehydroabieticacid with m|z315.196[35].The vapor pressures (VPs at 298 K)oftherosin acids are estimated to be~10-6 to10-7 Pa[44], so these types ofrelatively nonvolatile polar organic compounds may be observeddirectly by using DART-MS at lower temperatures without the needfor derivatization and gas chromatography. When bleached hardwood kraft pulp is mixed with the bleachedsoftwood kraft pulp, the spectrum of the resultant paper revealsthe appearance of two new higher mass ions with m|z 423 andm/z 441 that primarily begin to appear at~250C (Fig.2d). Peaksrepresenting these ions also appear in spectra in Fig. 1 of the 50/50bleached softwood/hardwood kraft paper that contains AKD sizing.Hardwoods such as Populus sp. (aspen) contain higher concentra-tions of steryl ester extractives than softwoods; oxidized sterolsand triterpene alcohol products are formed during kraft pulpingand bleaching of aspen [35,37]; and data in Table 2 indicate thepresence of residual extractives in papers made from the bleachedhardwood kraft pulp. These data suggest that these two ions arisefrom oxidation and/or dehydration of a-sitosterol and a-amyrin,respectively, perhaps as proposed in Scheme 1. a-Sitosterol could ( Please cite this article in press as: J. Adams, Int. J. Mass Spectrom. (2010), doi:10.1016/ j .ijms.2010.07.025 ) Scheme 1. Suggested origins of ions with m|z 423 (Eq. (1)) and m/z 441 (Eq. (2)) in spectra of bleached hardwood kraft papers (ASTM-ISR papers #11, #12, and #15). Seespectra in Figs. 1 and 2d. be oxidized during kraft pulping and bleaching to give an oxo struc-ture,which would then lose water either before or after protonationby the DARTionization process to give the ion with m|z 423(Eq.(1),Scheme 1). a-Amyrin could be oxidized during kraft pulping andbleaching to give another oxo structure, which would then be pro-tonated by the DART ionization process to produce the ion withm|z 441 (Eq. (2), Scheme 1). The VPs of a-sitosterol and a-amyrinare estimated to be ~10-9Pa [44], so DART-MS can detect somehighly involatile polar organic compounds at higher temperatureswithout thermal fragmentation. Another notable difference between spectra of softwood andhardwood kraft papers in Fig. 2 is the different intensities of thepeak representing ions with m|z 115, (C5H603+H)*. This ion is athermolysis marker for the hemicellulose xylan, which is signifi-cantly more predominant in hardwoods than softwoods [46,47].This peak is of low relative abundance in the spectrum of What-man #1 (Fig. 2a), is ~70% to 80% abundant in the spectrum of thesoftwood kraft paper (Fig.2b and c), but is the most abundant peak,particularly in relation to the other carbohydrate-derived peaks,in the spectrum of the hardwood kraft paper (Fig. 2d). These datashow that the bleached hardwood kraft paper may be differenti-ated from the bleached softwood kraft paper by the presence ofions from residual hardwood extractives and xylan. A comparison of the spectrum in Fig. 1e to the spectrum inFig. 2d shows how the presence of the modern alkyl ketene dimer(AKD) sizing agent is revealed. The starting material for the AKDwas a 60/40 mixture of palmitic and stearic acids that were con-verted into acid chlorides, which then underwent intermolecularlactone ring condensations to give the final alkyl ketene dimers. Thepeak in Fig. 1e that represents ions with m|z 257 arises from resid-ual palmitic acid [C16H3202+H]t. The three intense higher masspeaks in Fig. 1e are from protonation of the ketones formed byhydrolysis of AKD: hentriacontan-16-one(C31H62O+H)+ with m/z451.488, tritriacontan-16-one (C33H660+H)* with m|z 479.519,and pentatriacontan-18-one(C35H70O+H)* with m/z 507.550[16].All these intact molecules begin to be evolved at ~150°C eventhough the estimated VP of pentatriacontan-18-one(~10-9 Pa) is six orders of magnitude smaller than the VP of palmitic acid (~10-3Pa)[44]. These data indicate that the temperatures at whichintact molecules are vaporized from paper by using DARTionizationare related to other factors and not simply their VPs. 3.3. Mechanical pulp papers Spectra of the relatively pure papers discussed above primarilyreveal products from the volatilization of sizings and two residualhardwood phytosteroids, plus products from the higher temper-ature thermolysis of cellulose and xylan. In contrast, spectra ofmechanical pulp papers are significantly more complex and revealproducts from lignin and phytochemicals not observed from thehigh-cellulose papers (Fig. 3 and Table 4). 3.3.1. Hardwood bleached chemithermomechanical pulp(HW-BCTMP) Mixing a hardwood(aspen)BCTMP with the softwood kraft pulpresults in paper whose spectra shows products from lignin-relatedstructures (Fig. 3a; column five of Table 4).The spectra are some-what visually similar to spectra of aspen wood and lignin obtainedby using Py-molecular-beam sampling MS [48]; spectra of beechwood obtained by using temperature-programmed Py-field ion-ization MS [49]; spectra of cottonwood lignin obtained by usingtemperature-programmed in-source Py-MS [50]; and spectra ofAesculus turbinata lignin obtained by using in-source Py-MS [51].However, upon close inspection, there are more differences thansimilarities between the DART-MS spectra and those obtained byusing Py-MS.The twolowest mass resonance stabilized monomericbenzofuran products in the DART-MS spectra(m|z 131 and m|z161)have no apparent analogs in Py-MS spectra: Benzofurans can beformed from oxidation of phenylcoumaran lignin structures [52].Peaks that represent molecular ions of coniferyl and sinapyl alco-hols (m|z 180 and m|z 210, respectively) are seen in Py-MS spectra,but DART-MS spectra instead reveal peaks from the resonance sta-bilized allylic carbenium ions (m/z 163 and m/z 193, respectively)that arise by loss of water from the (M+H)ions of the two alco-hols [50]. The oxidized forms of the alcohols, coniferaldehyde andsinapaldehyde, respectively, are seen in abundance by DART-MS GModel J. Adams/International Journal of Mass Spectrometry xxx (2010) xxx-xxx Table4 Non-carbohydrate ions present in DART-MS spectra of papers that contain hardwood bleached chemithermomechanical pulp(HW-BCTMP)(ASTM-ISR papers #9,#10,#13,and #14), 100% softwood bleached chemithermomechanical pulp (SW-BCTMP)(ASTM-ISR papers #3 and #4), and stone groundwood (SGW) pulp (ASTM-ISR papers #7 and#8). See Fig. 3 for spectra. Lignin-derived ions H2CQ moleculed (%) (%) 131.050 CgHz0+ 3-Methyl-benzofuran 61 97 100 H2C@ 161.060 C10Hg02 7-Methoxy-3-methyl- 81 31 17benzofuran 0. .CH2 163.076 C10H1102 2-Methoxy-4-[prop-1-enyl] 39 75 52 phenol HO 0. 0 179.071 C10H1103 H Coniferaldehyde 52 100 77 HO .0.CH2 193.086 C11H13°3 HO 2,6-Dimethoxy-4-[prop-1- 67 30 12 enyl] phenol 0. 209.081 C11H1304* HO Sinapaldehyde 100 28 0. 0- 273.113 C16H1704 ·OH 4,4'-Dihydroxy-3,3'-dimethoxystilbene (G-G 13 39 33 HO· dimer) H* HO- 285.113 C17H1704* G-G phenylcoumarone 180dimerb H 0. GModel MASPEC-14259;No.of Pages 18 ARTICLE IN PRESS J. Adams / International Journal of Mass Spectrometry xxx (2010) xxx-xxx m/z (theoretical) Formula Suggested ion structure or fragment Suggested protonated HW-BCTMP SW-BCTMP SGW(%)moleculea (%)C (%) Please cite this article in press as:J. Adams, Int.J. Mass Spectrom.(2010), doi:10.1016/j.ijms.2010.07.025 12 J. Adams/ International Journal of Mass Spectrometry xxx (2010) xxx-xxx Table 4 (Continued) (%)C molecule (%) -O 0HO· 8 387.144 3' C21H2307* 7-Dehydromedioresinol 20 (G-S dimer) 4'-OH H 9 6' 5' 0. 9 8 8' 3' 401.160 C22H2507,+HO -OH 5,5'-Dimethoxy-8,8'- 217 7' didehydro-3,4- divanillyltetrahydrofuran 75 6 6'(S-S dimer) 二O 0 HO· 8 3' 417.155 C22H25°87-Dehydrosyringaresinol 95 6 7 4-OH(S-S dimer) H十 9 6'5 O- Extractives 227.107 C15H1502 Pinosylvin methyl ether 30 241.123 HO C16H1702 H+ Pinosylvin dimethyl ether 27 0 257.248 C16H33°2 CH3(CH2)14" Hexadecanoic acid 52 H OH J. Adams / International Journal of Mass Spectrometry xxx (2010) xxx-xxx Table 4 (Continued) m/z (theoretical) Formula Suggested ion structure or fragment m/z (theoretical) Formula Suggested ion structure or fragment Suggested protonated HW-BCTMP SW-BCTMP sGW(%)Cmoleculea (%) (%) Please cite this article in press as:J. Adams, Int.J. Mass Spectrom.(2010), doi:10.1016/j.ijms.2010.07.025 MASPEC-14259: J. Adams/International Journal of Mass Spectrometry xxx (2010) xxx-xxx a Structures suggested from data in Refs. [48-55] except as noted. Lignin phenylpropanoid unit designations are: C (p-hydroxyphenyl or coumaryl), G (guaiacyl), and S(syringyl). Structures suggested here. (m|z 179 and m|z 209, respectively) but not observed by Py-MS.The estimated VPs of coniferaldehyde (~10-3 Pa) and sinapalde-hyde(~10-4 Pa)[44] suggest that they should have been observedin the 150-250°Ctemperature range, but all the monomeric ligninspecies (m|z 131-209) were instead primarily evolved at tem-peratures >250°C. This suggests that they were not formed fromvolatilization by DART-MS but instead from thermolysis of lignin. Some dimeric lignin structures are the same either by DART-MSor Py-MS, and others are different. The protonated stilbene struc-tures seen by using DART-MS (m/z values 273, 303.1, and 333) haveexact molecular ion counterparts by Py-MS. The stilbene analogthat contains two guaiacyl groups (G-G analog) with an estimatedVP~10-6 [44] appears at ~150°C, the analog that contains a gua-iacyl and syringyl group (G-S analog) appears at ~250°C, and theS-S analog appears at ~350°C. These data suggest that the stil-benes may be volatilized as intact molecules, not primarily derivedfrom thermolysis of the lignin. Confirmation of this would requireextraction and analysis of both the paper extract and the extractedpaper. A series of three protonated ions with m|z values of 357, 387,and 417 are observed by using DART-MS that are oxidized ver-sions of three molecular ions with m|z values 358, 388, and 418,respectively, that are instead observed by using Py-MS. Thesespecies are evolved primarily at>350°C. Reasonable structures foreach of the ions, with basis in previous hypotheses [49], are 7-dehydropinoresinol (m|z 357), 7-dehydromedioresinol (m/z 387),and 7-dehydrosyringaresinol (m|z 417), respectively (Table 4).Resinol-type lignin structures are very stable and expected to beobserved from thermolysis of lignin at temperatures of ~325 to400°C[49]. There is one more ion of relevance with m|z 401. Its molecu-lar ion counterpart with mz 400 may be seen clearly in in-sourcePy-MS spectra obtained from wood of Calluna vulgaris and Aesculusturbinata [51,53] and from an organosolv lignin [54]. The structuresuggested in Table 4 for this ion is that of an oxidized dimethoxy analog of 3,4-divanillyltetrahydrofuran (shonanin), which is a nat-ural lignan whose syringyl analogs have been found in emissionsfrom the combustion of both hardwoods and softwoods [55]. Itsevolution at a temperatureof~250°Cmay indicate that it is evolvedas an intact molecule, not from thermolysis of lignin. 3.3.2. Softwood bleached chemithermomechanical pulp(SW-BCTMP) The DART-MS spectra of softwood BCTMP papers (Fig.3b) havefeatures that distinguish them from hardwood BCTMP papers.Although the monomeric ions with m|z values of 131-209 arisefrom both types of paper, they are found in different relative abun-dances (compare columns five and six of Table 4). The relativeabundances reflect the coumaryl (C) vs.G vs. S content of the ligninin which G-lignin is most abundant in softwood and S-lignin is mostabundant in hardwood. Products from S-lignin units (m|z values161, 193, and 209) dominate the spectrum of the hardwood paper(Fig. 3a) but products from G-lignin units (m|z values 131,163, and179) dominate the spectrum of the softwood paper. Relative abundances of some of the dimer products also distin-guish the papers. The only member of the stilbene series of ionsthat is detected from the softwood papers is the G-G dimer withm|z 273: the higher-mass dimers from the hardwood papers con-tain S-units. The only member of the resinol series of ions that isdetected from the softwood papers is the G-G dimer with m|z 357:the higher-mass dimers from the hardwood papers contain S-units.The dimethoxy analog of 3,4-divanillyltetrahydrofuran (m|z 401) isnot detected from the softwood papers because it is a S-S dimer. There is one more feature in spectra of the softwood papersthat differentiate them from the hardwood papers: the occur-rence of four lignin product ions that are unique to the softwoodpapers. These include three G-G dimer products (with m|z 285,301.1, and 339) that, with basis in previous hypotheses [49], aresuggested to be phenylcoumarones (m|z 285 and m|z 339) and aphenylcoumaran (m|z 301.1) from lignin B-5 linkages abundant Fig. 3. Spectra of papers made from mechanical pulps: (a) 50% BNSWK/50%hardwood bleached chemithermomechanical pulp (HW-BCTMP) (ASTM-ISR paper#13); (b)100%softwood BCTMP (SW-BCTMP)(ASTM-ISR paper #4); and (c) 20%BNSWK/80% stone groundwood (SGW) pulp (ASTM-ISR paper #8). in softwood, and a demethoxy coumaryl-containing (C-G) dimeranalog of the resinol series of ions (m|z 327). As for hardwood papers, DART-MS spectra of softwood BCTMPpapers also reveal lignin units that are more highly oxidized. How-ever, Py-GC-MS spectra of Picea wood, thermomechanical pulp(TMP) made from the wood, and paper made from the TMP revealno changes in the oxidation states of the products because of eitherthe pulping or papermaking process [25]. Further,Py-GC-MS spec-tra of Picea wood and chemithermomechanical pulp (CTMP) madefrom the wood show a decrease in some of the more oxidizedproducts after the CTMP process (less coniferaldehyde and moretrans-coniferylalcohol)[46].Other studies show that hydrogen per-oxide bleaching has little impact on the overall structure of TMPlignin other than to primarily eliminate coniferaldehyde end groups[39].Hydrogen peroxide bleaching is also expected to remove con-jugated double bonds, not generate them [46]. These data suggestthat the detection of more highly oxidized (unsaturated) speciesby DART-MS is not a result of the pulping/bleaching process but isrelated to the DART ionization process itself. 3.3.3. Stone groundwood (SGW) pulp Spectra of stone groundwood(SGW)pulp papers (Fig.3c), whichare made from unprocessed softwood chips, show some of the same G-lignin (primarily from thermolysis) products as in spectraof papers made from softwood BCTMP but in different abundances.The monomeric G-lignin ions with m/z values of 131, 163, and179 are present in high abundance, but S-lignin products withm|z values of 161, 193, and 209 are either significantly reducedor not detected (see column seven in Table 4). The only lignindimers that are detected are the G-G stilbene product (m|z 273),the demethoxydehydropinoresinol C-G dimer (m|z 327), the G-Gphenylcoumarone dimer (m|z 339), and the dehydropinoresinolG-G dimer (m|z 357). It is notable that the phenylcoumarone andphenylcoumaran G-G dimers seen in papers made from softwoodBCTMP (m|z 285 and m/z 301.1, respectively) are not detected inspectra of papers made from softwoodSGW pulp. This suggests thatthese two structures may be formed during the BCTMP process. The most significant distinguishing feature of spectra of papersmade from SGW pulp, however, is an extensive set of softwoodextractives that are volatilized primarily at~150°℃ (Table 4)[35-37,55]. The ten extractives include two pinosylvin methylethers (m|z 227 and m/z 241); hexadecanoic acid (m|z 257); threeresin acids (m|z values of 301.2, 303.2, and 315); and four productsderived from B-sitosterol (m/z values of 397, 411, 413, and 429).The (M+H)* ions of stigmastan-3,5-diene (m/z 397) most likelyarise from loss of water from the (M+H)*ions of B-sitosterol in theDART ionization process because B-sitosterol is a highly abundantphytosterol found in extractives but not observed in the mass spec-tra. The three oxo phytosteroids (m|z values of 411, 413, and 429)are derived from the oxidation of B-sitosterol. Eight of the extrac-tives are observed at ~150°℃ and have estimated VPs that rangefrom ~10-3 to 10-8 Pa. The two stigmasta 3,5-dienes (m/z397 andmz411) are primarily observed at~250°C and have estimated VPsof~10-7[44]. 3.4. Pitch extractives as contaminants in 100% cotton papers Spectra of SGW pulp papers (Fig. 3c) show peaks from phytos-teroids with m/z values 397, 411, 413, and 429 that also appearin spectra of currency-type papers made from 100% cotton pulp(ASTM-ISR papers #5 and #6) (Fig.4). These data indicate thatthe cotton pulp was most likely contaminated by pitch. Stronglylipophilic compounds such as phytosteroids that survive pulpingand/or bleaching processes are present as colloids that may beaccumulated as pitch on papermaking machinery and found inrecirculating water used in paper mills. Pitch colloids are gener-ally associated with suspended solids and may be deposited in thefinal paper product [37]. 3.5. Repeatability and sensitivity DART-MS spectra need to be reproducible and repeatable for usein paper and other research. The 100% cotton paper that contains Fig. 4. Spectrum of paper made from 100% cotton at a paper mill (ASTM-ISR paper#6). Fig. 5. Spectra from analyses of 100% cotton paper that contains alum-rosin sizingand pitch contaminants (ASTM-ISR paper #5) on two separate occasions (a and b). alum-rosin sizing and phytosteroid pitch contaminants (ASTM-ISRpaper #5) was analyzed on two separate occasions. The resultingmass spectra (Fig. 5) demonstrate the repeatability of the analy-sis. The distinguishing ions with m/z values of 301, 315, 397, 411,and 429 have almost identical relative ion abundances (±15%RSE).An improvement in sample placement technique is expected toimprove the repeatability, which is important for effective massspectral database searches. Another issue in reproducibility is the possible impact ofinorganic salts on ion formation,particularly on products from ther-molysis. In Py-MS, the presence,quantity, and identity of inorganicsalts negatively impact pyrolytic behavior and spectral repro-ducibility [17].This contrasts with results here in which papers thatare made from the same pulp but differ in their inorganic compo-nents (Table 1) give virtually identical DART mass spectra that onlydiffer if an organic component differs. DART-MS needs to be sensitive for use in obtaining spectra frommicrosamples. A spectrum obtained by using a 6.4-mm diametersample of the bleached kraft paper that contains AKD sizing (ASTM-ISR paper #15) can be compared to a spectrum of the same paperobtained by using an~10 ug fiber bundle tweezed from the surfaceof the paper (Fig. 6): the fiber bundle is approximately the size ofthe period at the end of this sentence. All the peaks needed to iden-tify the paper are present in both temperature-averaged spectra.However, the ug-size sample (Fig.6b) gives rise to lesser relativeabundances of the higher mass products that arise from volatiliza-tion of the AKD ketones (m|z values 451-507) in comparison tothe lower mass products that arise from thermolysis (m|z values43-145). A reasonable explanation for the higher abundances of the AKDketones from the larger sample is that in the larger sample, moreketones are volatilized from a larger surface area of the paper ascompared to the total surface area of the pug-size sample, which istotally charred in the analysis. This can be seen in the photographsin Fig. 6, in which the surface area that is primarily sampled by thehelium stream for the larger sample (indicated by the highly dark-ened surface of the paper in Fig.6a)is at least five times greater than Fig. 6. Spectra of 50% BNSWK/50%BNHWK paper that has AKD sizing (ASTM-ISRpaper#15) obtained by using: (a) a 6.4-mmdiameter piece of paper; and(b)an~10-ug fiber bundle tweezed from the surface. The 10-ug fiber bundle is approximatelythe size of the period at the end of this sentence. the surface area sampled for the ug-size sample. This could leadto reduced relative abundances of volatilizable components of thepaper as opposed to components that arise by thermal degradationof the entire lignocellulose matrix that is contained in a microsam-ple. This is an example, however, of the utility of experiments thatincorporate temperature ramping: the spectrum generated fromthe microsample at ~150 to 250°C during the ramp is dominatedby the products from AKD and is virtually identical to the spectrumshown in Fig. 1b. 3.6. Negative ion DART-MS of reference papers Negative ion DART-MS spectra of the reference papers are sig-nificantly less informative than their positive ion counterparts.Virtually no cellulose ions are observed except for formate, acetate,and a few weakly abundant furan carboxylates that are not detectedin the positive ion spectra. Spectra of alum-rosin sized, high-cellulose papers reveal virtually only resin acid anions. Spectra ofhigh-lignin papers primarily show phenolates from coniferalde-hyde and the lignin-derived methoxystilbenes. The only extractivesthat are observed from the SGW papers are the resin acid anions,which make these papers virtually indistinguishable from alum-rosin sized high-cellulose papers. 4. Conclusions Data presented here show that a series of printing and writ-ing papers can be characterized and differentiated by acquiringtheir positive ion DART mass spectra across a large temperaturerange.At lower temperatures,polar organic compounds from rosin,AKD sizing, phytosteroids, and other extractives are volatilizedand detected. Higher temperatures primarily result in thermoly-sis of the lignocellulose matrix that gives rise to cellulose and xylanmarker ions, and syringyl (hardwood) and guaiacyl and coumaryl ( Please cite this article in press as:J. Adams, Int. J. Mass Spectrom. (2010), doi:10.1016/j . ijms.2010.07.025 ) (softwood) lignin units. Microsamples at least as small as ~10 pgmay be characterized, which means that the method may be usedto analyze small paper fragments or fiber bundles sampled fromsome library and archival collections. Positive ion DART-MS spectra of lignin-containing papers areclosest in similarity to spectra of wood and lignin obtained using in-source and similar direct Py-MS methods. However,ions producedby using positive ion DART-MS are primarily either protonatedmolecules,resonance-stabilized carbocations that arise from loss ofwater from protonated alcohols or sterols, or more highly oxidized(unsaturated) species than observed by using Py-MS methods. TheDART ionization process may be more efficient and selective atdetecting more highly oxidized (particularly conjugated) speciespresent in the papers because they would have higher protonaffinities and form more stable (M+H)ions. Inorganic salts haveno apparent impact on ion formation by DART-MS in contrastto Py-MS. Negative ion DART-MS spectra primarily reveal a fewcarboxylates and phenolates, which is not enough information todistinguish the papers. Data presented here have implications beyond the sciencewhose purpose is to preserve library and archival paper collections.DART-MS might be a viable alternative to direct temperature-resolved mass spectrometry (DTMS) in studies of varnishes andoils in historic paintings [56,57]. It might be useful in the pulp andpaper industry as an alternative to the time-consuming extraction,derivatization, and chromatographic methods for analyzing organ-ics in wood, pulp, and pulping/bleach liquors, and for monitoringpitch deposits on machinery, in pulp, and in paper mill effluents[58]. The use of positive ion DART-MS to characterize Whatman #1and the 15 ASTM-ISR reference papers is a prelude to other appli-cations in paper research. Although DART-MS has been used in theforensic community to analyze modern writing inks [22], it hasyet to be applied to the analysis of writing inks simultaneouslywith analysis of the paper matrix. Other research using Py-GC-MSsuggests that there may be marker compounds specific for post-consumer recycled paper that may be directly determinable byDART-MS [16]. The spectra of the 16 reference papers analyzedhere are benchmarks for the further use of the papers in paper-aging research and in analyzing naturally aged historic papers.In addition, the temperature-averaged spectra are the beginningof the development of a searchable library of DART-MS spectraof printing and writing papers by the Library of Congress thatcould be ofuse to researchers in the preservation, pulp, and paper,forensic, and scientific communities at large. These benchmarkspectra are the prelude to expanded applications of DART-MS inpreservation, forensic, pulp and paper, and other research disci-plines. Acknowledgements The author acknowledges Drs.JaapJ. Boon, Matija Strlic,O.DavidSparkman, Robert B. Cody, and Christopher Maines for invaluablesuggestions during the preparation of this manuscript; Mss. CindyConnelly Ryan and Linda Stiber Morenus for informative discus-sions about important aspects of paper preservation; and Ms. CaroleZimmermann for providing reference help. References ( [ 1 ] R.W. S indall, The Manufacture of Paper, D. Van Nostrand Co., N ew Y o rk, 1908.[2] Permanence/durability o f the book- v ii: physical and chemical p roperties of book papers, 1 507-1949, W . J . Barrow R e search Laboratory, I n c., Richmond, 1974. ) ( [3] M.B. Hocking, Handbook of C h emical Technology and Pol l ution Control, Aca-demic Press, San Diego,1993,p.449. ) ( [ 4] W .E. Scott, Principles of Wet End Chemistry, TAP P I Pres s , Atlanta, 1996 . ) [5] R. Boyle, The skeptical chymist: or chymico-physical doubts & paradoxes,touching the spagyrist's principles commonly called hypostatical as they arewont to be proposed and defended by the generality of alchemists, Caldwell &Crooked,London, 1661. [6] A. Karademir, F. Ozdemir, S. Imamoglu, Effects of alum-rosin sizing on theproperties of some wastepaper grades, Biotechnology 6 (2007)148-152. ( [7] Executive Order 13423-Strengthening federal e n vironmental, energy, and transportation management. Federal R egister 72 FR 3919, January 26,2007. ) [8] H.J.Porck, Rate of Paper Degradation-The Predictive Value of Artificial Aging Tests, European Commission on Preservation and Access, Amsterdam, 2000. ( [9] D. Erhardt, C.S. Tumosa, C hemical degradation of cellulose in paper ov e r 500 years, Restaurateur26 (2005)151-158. ) ( [101 M .Missori, M . Righini, Using optical spectroscopy for the study of paper degra- d ation, Gazette due Liver Medieval 49 (2006)25-35. ) ( [ 1 1 ] A .-L. Dupont, C. Egasse, A. Morin, F. Vasseur, Comprehensive characterizationof cellulose- and lignocellulose-degradation products i n aged papers: capil-lary zone electrophoresis of low-molar mass organic acids, carbohydrates, andaromatic lignin derivatives, Carbohydr.Polym. 68(2007)1-16. ) [12]J.Havermans, Effects of air pollutants on accelerated ageing of cellulose-basedmaterials,Restaurateur 16 (1995) 209-233. ( [13] A.S.T.M. Paper Aging Research Program, ASTM Research Report ( RR:D06-1004), a vailable as Adjunct to D6789 Standard T e st M e thod for Accelerated Light Aging of Printing and Writing Paper by Xenon-Arc Exposure Apparatus, ASTMInternational, West Conshohocken,2002. ) [14] L.M. Proniewicz, C. Paluszkiewicz, A. Weselucha-Birczynska, A. Baranski, D.Dutka, FT-IRE and FT-Raman study of hydro thermally degraded groundwoodcontaining paper, J. Mol. Strict. 614 (2002)345-353. [15] T. Trafela, M. Strlic, J. Kolar, D.A. Lichtblau, M. Anders, D.P. Mencigar, B.Pihlar, Nondestructive analysis and dating of historical paper based onire spectroscopy and chemometric data evaluation, Anal. Chem. 79 (2007)6319-6323. ( [16] T .Yano, H. Ohtani, S. Tsuge, Determination of neutral sizing agents in paper by p yrolysis-gas chromatography, Analyst 117(1992)849-852. ) [17]G.C. Galletti, P. Bocchini, M.E. Guadalix, G. Almendros, S. Camarero, A.T.Martinez, Pyrolysis products as markers in the chemical characterization ofpaperboards from waste paper and wheat straw pulps, Biores. Technol. 60(1997)51-58. ( [18] S . Suzuki, H. Ohi, K. Kuroda, S t ructural analysis of lignin by py r olysis-gas chro- m atography (v), Kari P a Gikyoushi 5 1 ( 1997) 932-944. ) ( [19] C . Laroque, History and analysis oftransparent papers, Paper Conserv.28(2004) 17-32. ) ( [20] Y. Keheyan, P y /gc/ms an a lysis of hi s torical p a pers, B i oResource 3 (20 0 8) 829-837. ) ( [21] R .B. Cody, J .A. Laramee, H.D. Durst, V e rsatile n e w io n so u rce for the ana l y- sis of materials i n open air unde r ambient conditions, Anal. Chem.77 (2005) 2297-2302. ) [22] R.W. Jones, R.B. Cody, J.F. McClelland, Differentiating writing inks using directanalysis in real time mass spectrometry,J. Forensic. Sci. 51 (2006)915-918.vRCM: [23] C.Y. Pierce, J.R. Barr, R.B. Cody, R.G. Massung, A.R. Woolfitt, H. Moura, H.A.Thompson, F.M. Fernandez, Ambient generation of fatty acid methyl ester ionsfrom bacterial whole cells by direct analysis in real time (DART) mass spec-trometry, Chem. Commun.(2007)807-809. [24] J.Y. Yew, R.B. Cody, E.A. Kravitz, Cuticular hydrocarbon analysis of an awakebehaving fly using direct analysis in real-time time-of-flight mass spectrome-try, Proc. Natl. Acad.Sci. U.S.A. 105 (2008)7135-7140. [25] S.D. Malenknia, T.M. Vail, R.B. Cody, D.O. Sparkman, T.L. Bell, M.A. Adams,Temperature-dependent release of volatile organic compounds of eucalyptsby direct analysis in real time (DART) mass spectrometry,Rap. Commun. MassSpectrom. 23 (2009)2241-2246. [26] T. Rothenbacher, W. Schwack, Rapid and nondestructive analysis of phthalicacid esters in toys made of poly(vinyl chloride) by direct analysis in real timesingle-quadrupole mass spectrometry, Rapid Commun. Mass Spectrom.23(2009)2829-2835. [27] G.A. Harris, F.M. Fernandez, Simulations and experimental investigation ofatmospheric transport in an ambient metastable-induced chemical ionizationsource, Anal. Chem. 81 (2009)322-329. ( [28] L . Song, A.B. Dykstra, H. Yao, J. E . Bartmes s , Ionizati o n mechanism of negative ion-direct analysis in rea l time: a comparative study with n egative ion- atmospheric p r essure photoionization, J. Am. Soc. M a ss Spectrom. 20 (2009) 42-50. ) [29] R.B. Cody, Observation of molecular ions and analysis of nonpolar com-pounds with the direct analysis in real time ion source, Anal.Chem. 81(2009)1101-1107. [30] J.A. Laramee, H.D. Durst, J.M. Nilles, T.R. Connell, An improved protocol for theanalysis of alcohols by direct analysis in real time mass spectrometry,Am. Lab.41(2009)25-27. [31] Z.M.Shabana, Competitive situation of Egyptian cotton in the American market,J.Farm. Econ.33 (1951)216-221. [32] TAPPI T203cm-99. Alpha-, beta- and gamma-cellulose in pulp.33 3]TAPPI T204cm-07. Solvent extractives of wood and pulp. [34] TAPPI 236 om-06. Kappa number of pulp. [35] V. Masura, Relationship between the kappa number and the permanganatenumber of the western hemlock kraft pulp, TAPPI J.3(2004)9-10. [36] J. Peng, R. Leone, A.N. Serreqi, C. Breuil, Are Aspen sterols and steryl esterschanged structurally by kraft pulping and bleaching? TAPPI J. 82 (1999)204-211. ( [37] H . H ovelstad, I. Leirset, K. Oyaas, A. Fiksdhl , Screening analysis of pinosylvin s tilbenes, resin acids, an d lignan s in Norwegian conifers, Molecules 11 (2006) 103-114. ) ( [38] S.-J. Shin, N.-S. Cho, Y.-Z . Lai, Residua l extractive s i n Aspen kraft pulps and their impact o n kappa n u mber and Kla s on lignin det e rmination, J. W o od Sci. 53(2007)494-497. ) ( [39] X. Pan, D. Lachenal, C. Lapierre, B. Monties, V. Neirinch, D. Robert, On the behaviour of spruce thermomechanical pulp lignin during hydrogen peroxide bleaching, Holzforschung 48 (1994) 429-435. ) ( [40] D .G. Mancosky, L. A . Lucia, Use of TOF-SIMS for the analysis of su r face metals in H202-bleached lignocellulosic fibers, Pure Appl. Chem. 73 ( 2001)2047-2058. ) ( [41] S .C. Moldoveanu, Analytical P yrolysis of Natural Organic P olymers, Elsevier, Amsterdam, 1998. ) ( nan I [ 4 2] J J.Boon, I. Pastorova,R.E.Botto,P.W.Arisz,Structural studies of cellulose pyrol- y sis and cellulose chars by PYMS, PYGCMS, F T IR, N MR and by wet chemical techniques, Biomass B ioenergy 7 (1994) 25-32. ) [43] The NIST/EPA/NIH Mass Spectral Library, version 2.0d, build April 26, 2005.Standard Reference Data Program of the National Institute of Standards andTechnology,2005. [46] M. Kleen, G. Gellerstedt, Characterization of chemical and mechanical pulpsby pyrolysis-gas chromatography/mass spectrometry, J. Anal. Appl. Pyrol. 19(1991)139-152. [47] J.J.C.M. Van Arendonk, G.J. Niemann, J.J. Boon, The effect of enzymatic removalof proteins from plant leaf material as studied by pyrolysis-mass spectrometry:detection of additional protein marker fragment ions, J. Anal. Appl. Pyrol. 42(1997)33-51. ( [ 48] R .J. Evans, T.A. Milne, M.N. S oltys, Direct m ass-spectrometric st u dies of thepyrolysis of c arbonaceous fu e ls IlI. P r imary py r olysis of lignin, J. Anal. A p pl. Pyrol.9(1986) 207-236. ) [49] R. Hempeling, H.-R. Schulten, Chemical characterization of the organic matterin forest soils by curie point pyrolysis-GC/MS and pyrolysis-field ionizationmass spectrometry, Org. Geochem. 15 (1990) 131-145. [50] E.R.E. van der Hage,M.M.Mulder,J.J. Boon, Structural characterization of ligninpolymers by temperature-resolved in-source pyrolysis-mass spectrometry andcurie-point pyrolysis-gas chromatography/mass spectrometry,J. Anal. Appl.Pyrol.25(1993)149-183. [51] A. Izumi, K. Kuroda, Pyrolysis-mass spectrometry analysis of dehydrogenationlignin polymers with various syringyl/guaiacyl ratios, Rapid Commun. MassSpectrom. 11 (1997)1709-1715. ( [52] C . C anevali, M . Orlandi, L. Pa r di, B. Ri n done, R. Scotti, J. S i p ila, F. Morazzoni, O xidative degradation of monomeric and dimeric phenylpropanoids: rea c tivity a nd mechanistic investigation, J. Chem. Soc. Dalton Trans. (2002)3007-3014. ) ( [53] E .R.E. van der Heijden,J.J. Boon,A combined p yrolysis mass s pectrometric and light microscopic study of peatified calluna wood i solated from raised bog peat deposits,Org. Geochem. 22 (1994)903-919. ) [54] E.R.E. van der Hage,JJ. Boon, On-line Curie-point pyrolysis-high-performanceliquid chromatographic-mass spectrometric analysis of lignin polymers, J.Chromatogr. A 736(1996)61-75. ( [55] B .R.T. Simonelt, W.F. Rogge, M.A. Mazurek, L.J. Standley, L.M. Hildemann, G.R. Cass, Lignin pyrolysis p roducts, lignans, and r esin a cids a s s pecific tracers of plant classes in emissions from biomass combustion,Environ. Sci. Technol. 17 (1993)2533-2541. ) [56G].A. van der Doelen, K.H.van den Berg,J.J. Boon, Comparative chromatographicand mass-spectrometric studies of triterpenoid varnishes: fresh material andaged samples for paintings, Stud. Conserv. 43 (1998)249-264. [57] K. Sutherland, Solvent-extractable components of linseed oil paint films, Stud.Conserv.48 (2003) 111-135. ( [58] A . R igol, S. Lacorte, D. Barcelo, Sample handling and ana l ytical pro t ocols for a nalysis o f resin acids in process waters and effluents f rom p u lp a n d papermills, Trends Ana l . Chem. 22(2003)738-749. ) Please cite this article in press as: J. Adams, Int. J. Mass Spectrom(, doi:j.ijms.
确定

还剩16页未读,是否继续阅读?

华质泰科生物技术(北京)有限公司为您提供《打印和手写纸张中有机成分检测方案(液质联用仪)》,该方案主要用于造纸中有机成分检测,参考标准--,《打印和手写纸张中有机成分检测方案(液质联用仪)》用到的仪器有
相关方案
更多