方案详情
文
Hydrogen isotherms for MOF-177, Zn4O(1,3,5-benzenetribenzoate)2, crystals were independently
measured by volumetric and gravimetric methods at 77 K to confirm its hydrogen uptake capacity
and to establish the importance of calibrating gas adsorption instrumentation prior to evaluating
H2 storage capacities. Reproducibility of hydrogen adsorption experiments is important because
non-systematic errors in measurements can easily occur leading to erroneous reports of capacities.
The surface excess weight percentage of hydrogen uptake in MOF-177 samples is 7.5 wt% at
70 bar, which corresponds to an absolute adsorbed amount of 11 wt%. These values are in
agreement with our previous report and with those found independently by Southwest Research
Institute. Considering its well-known structure and its significant H2 uptake properties, we believe
MOF-177 is an excellent material to serve as a benchmark adsorber.
方案详情

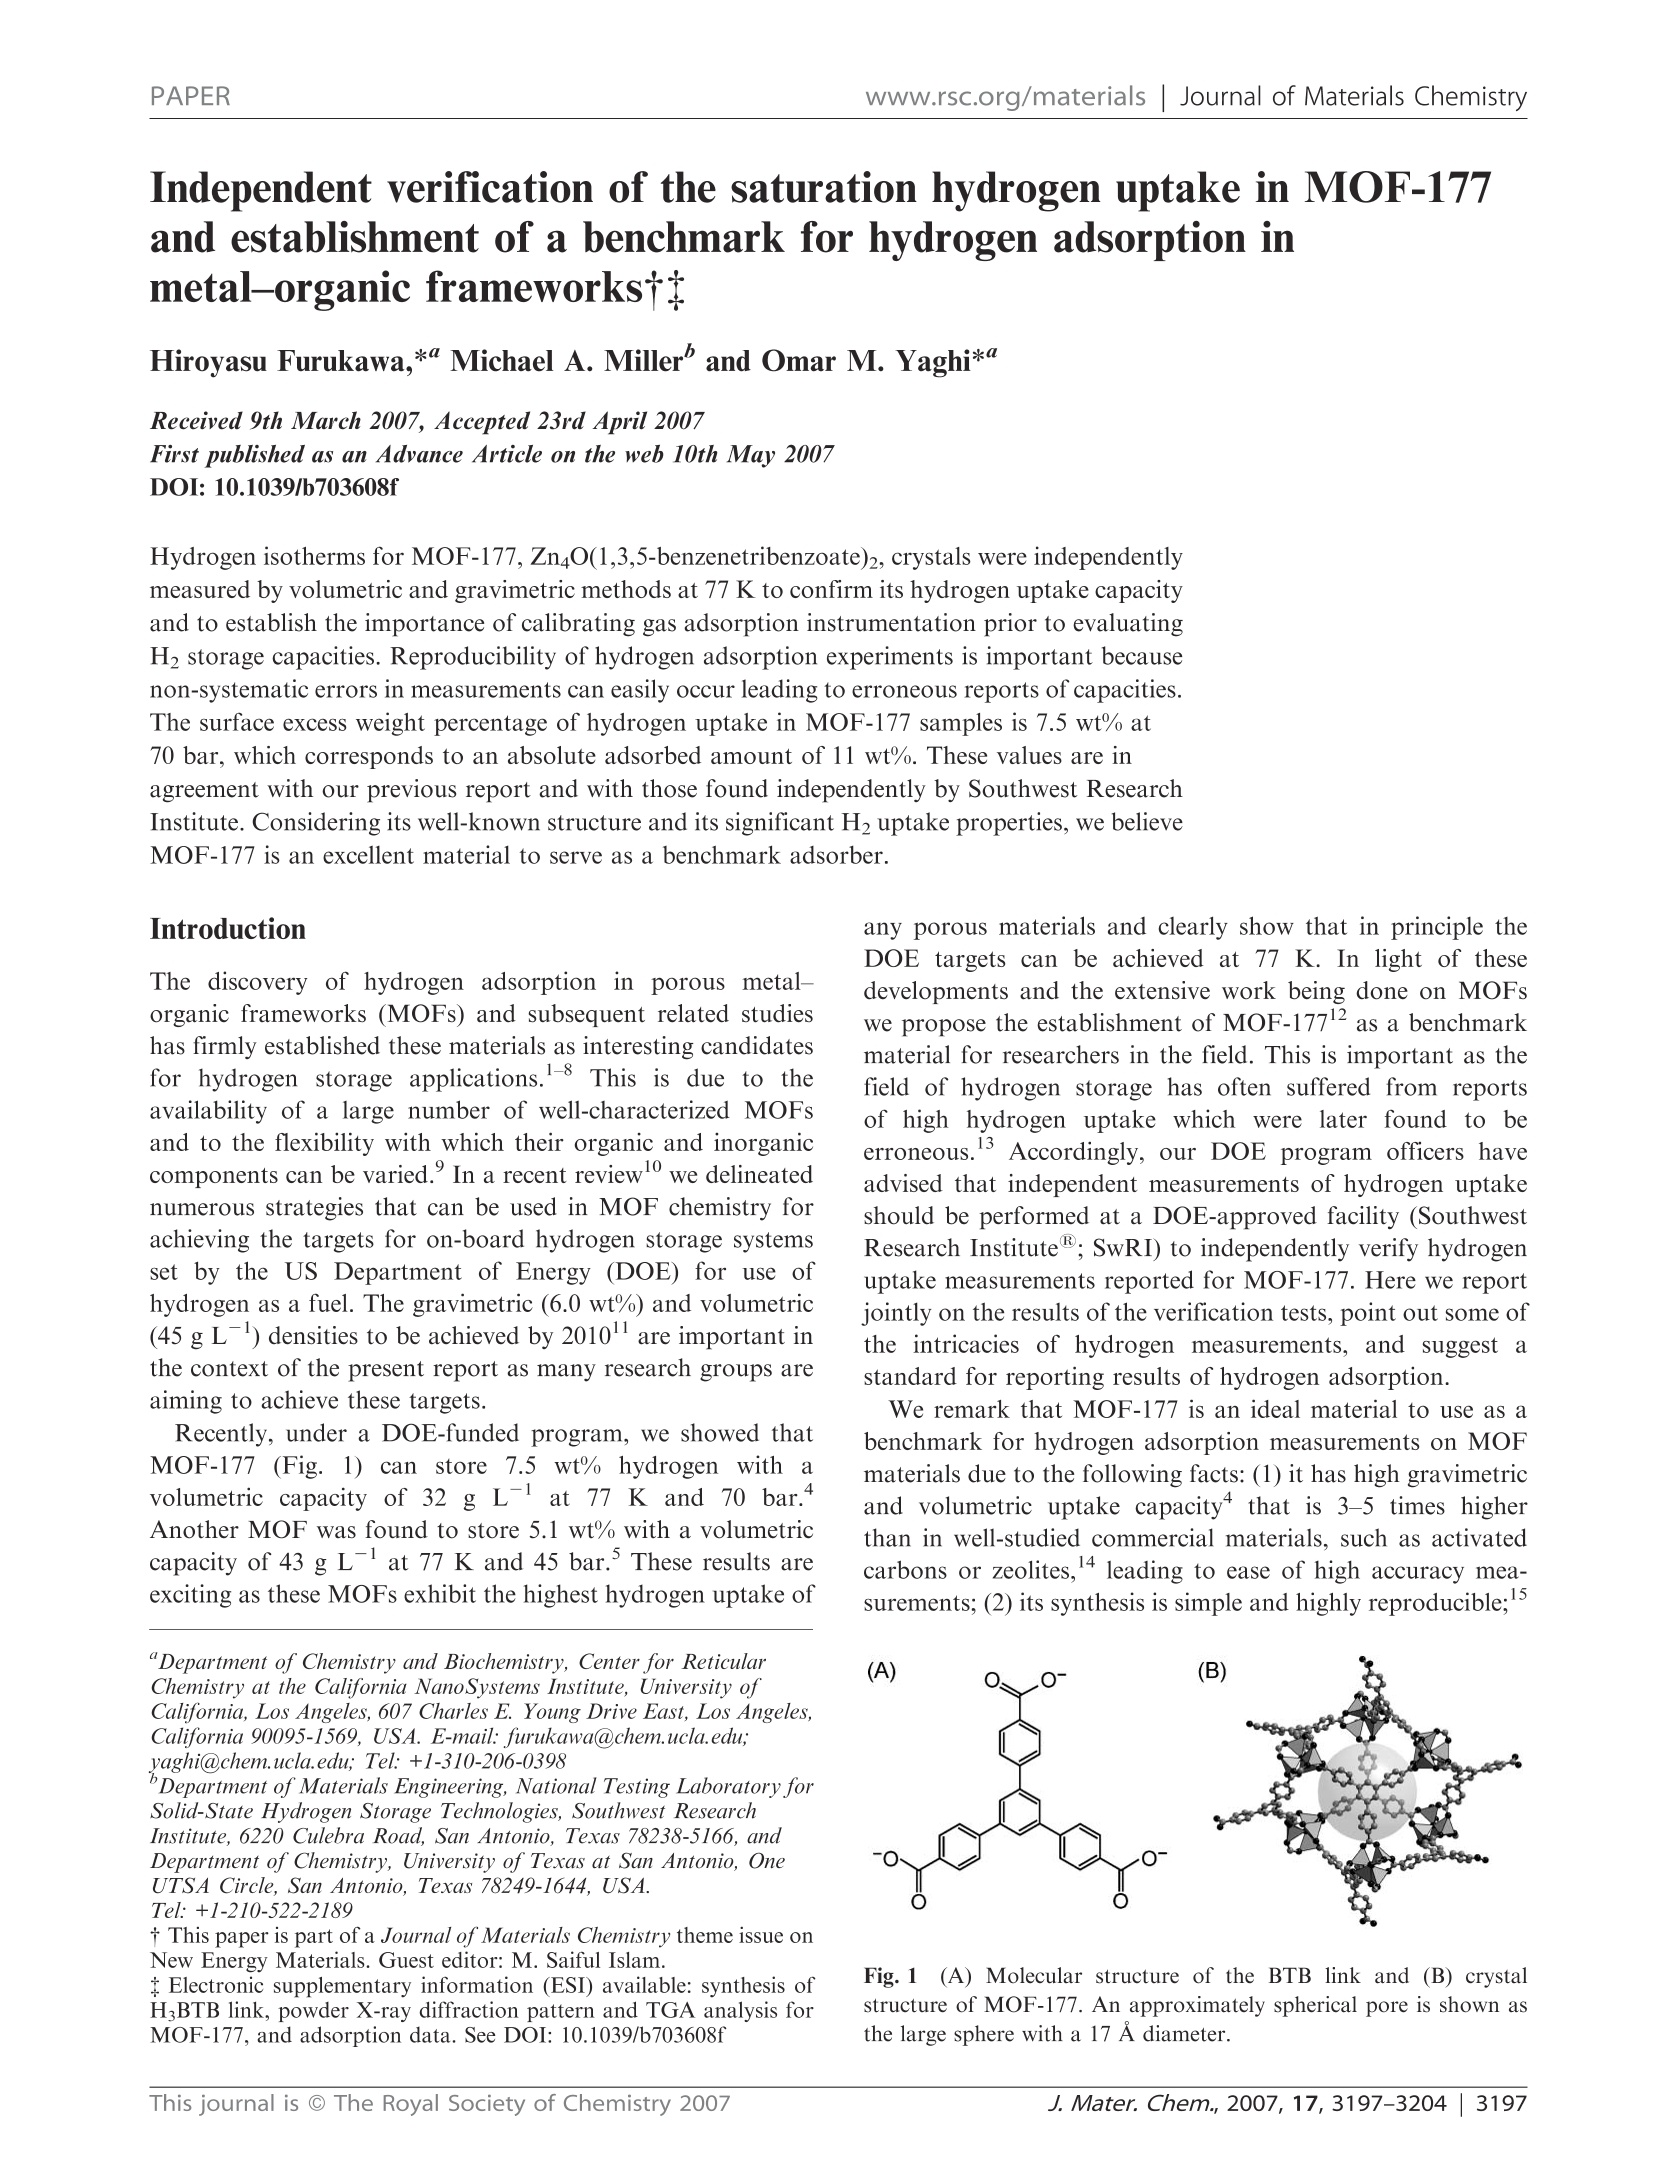
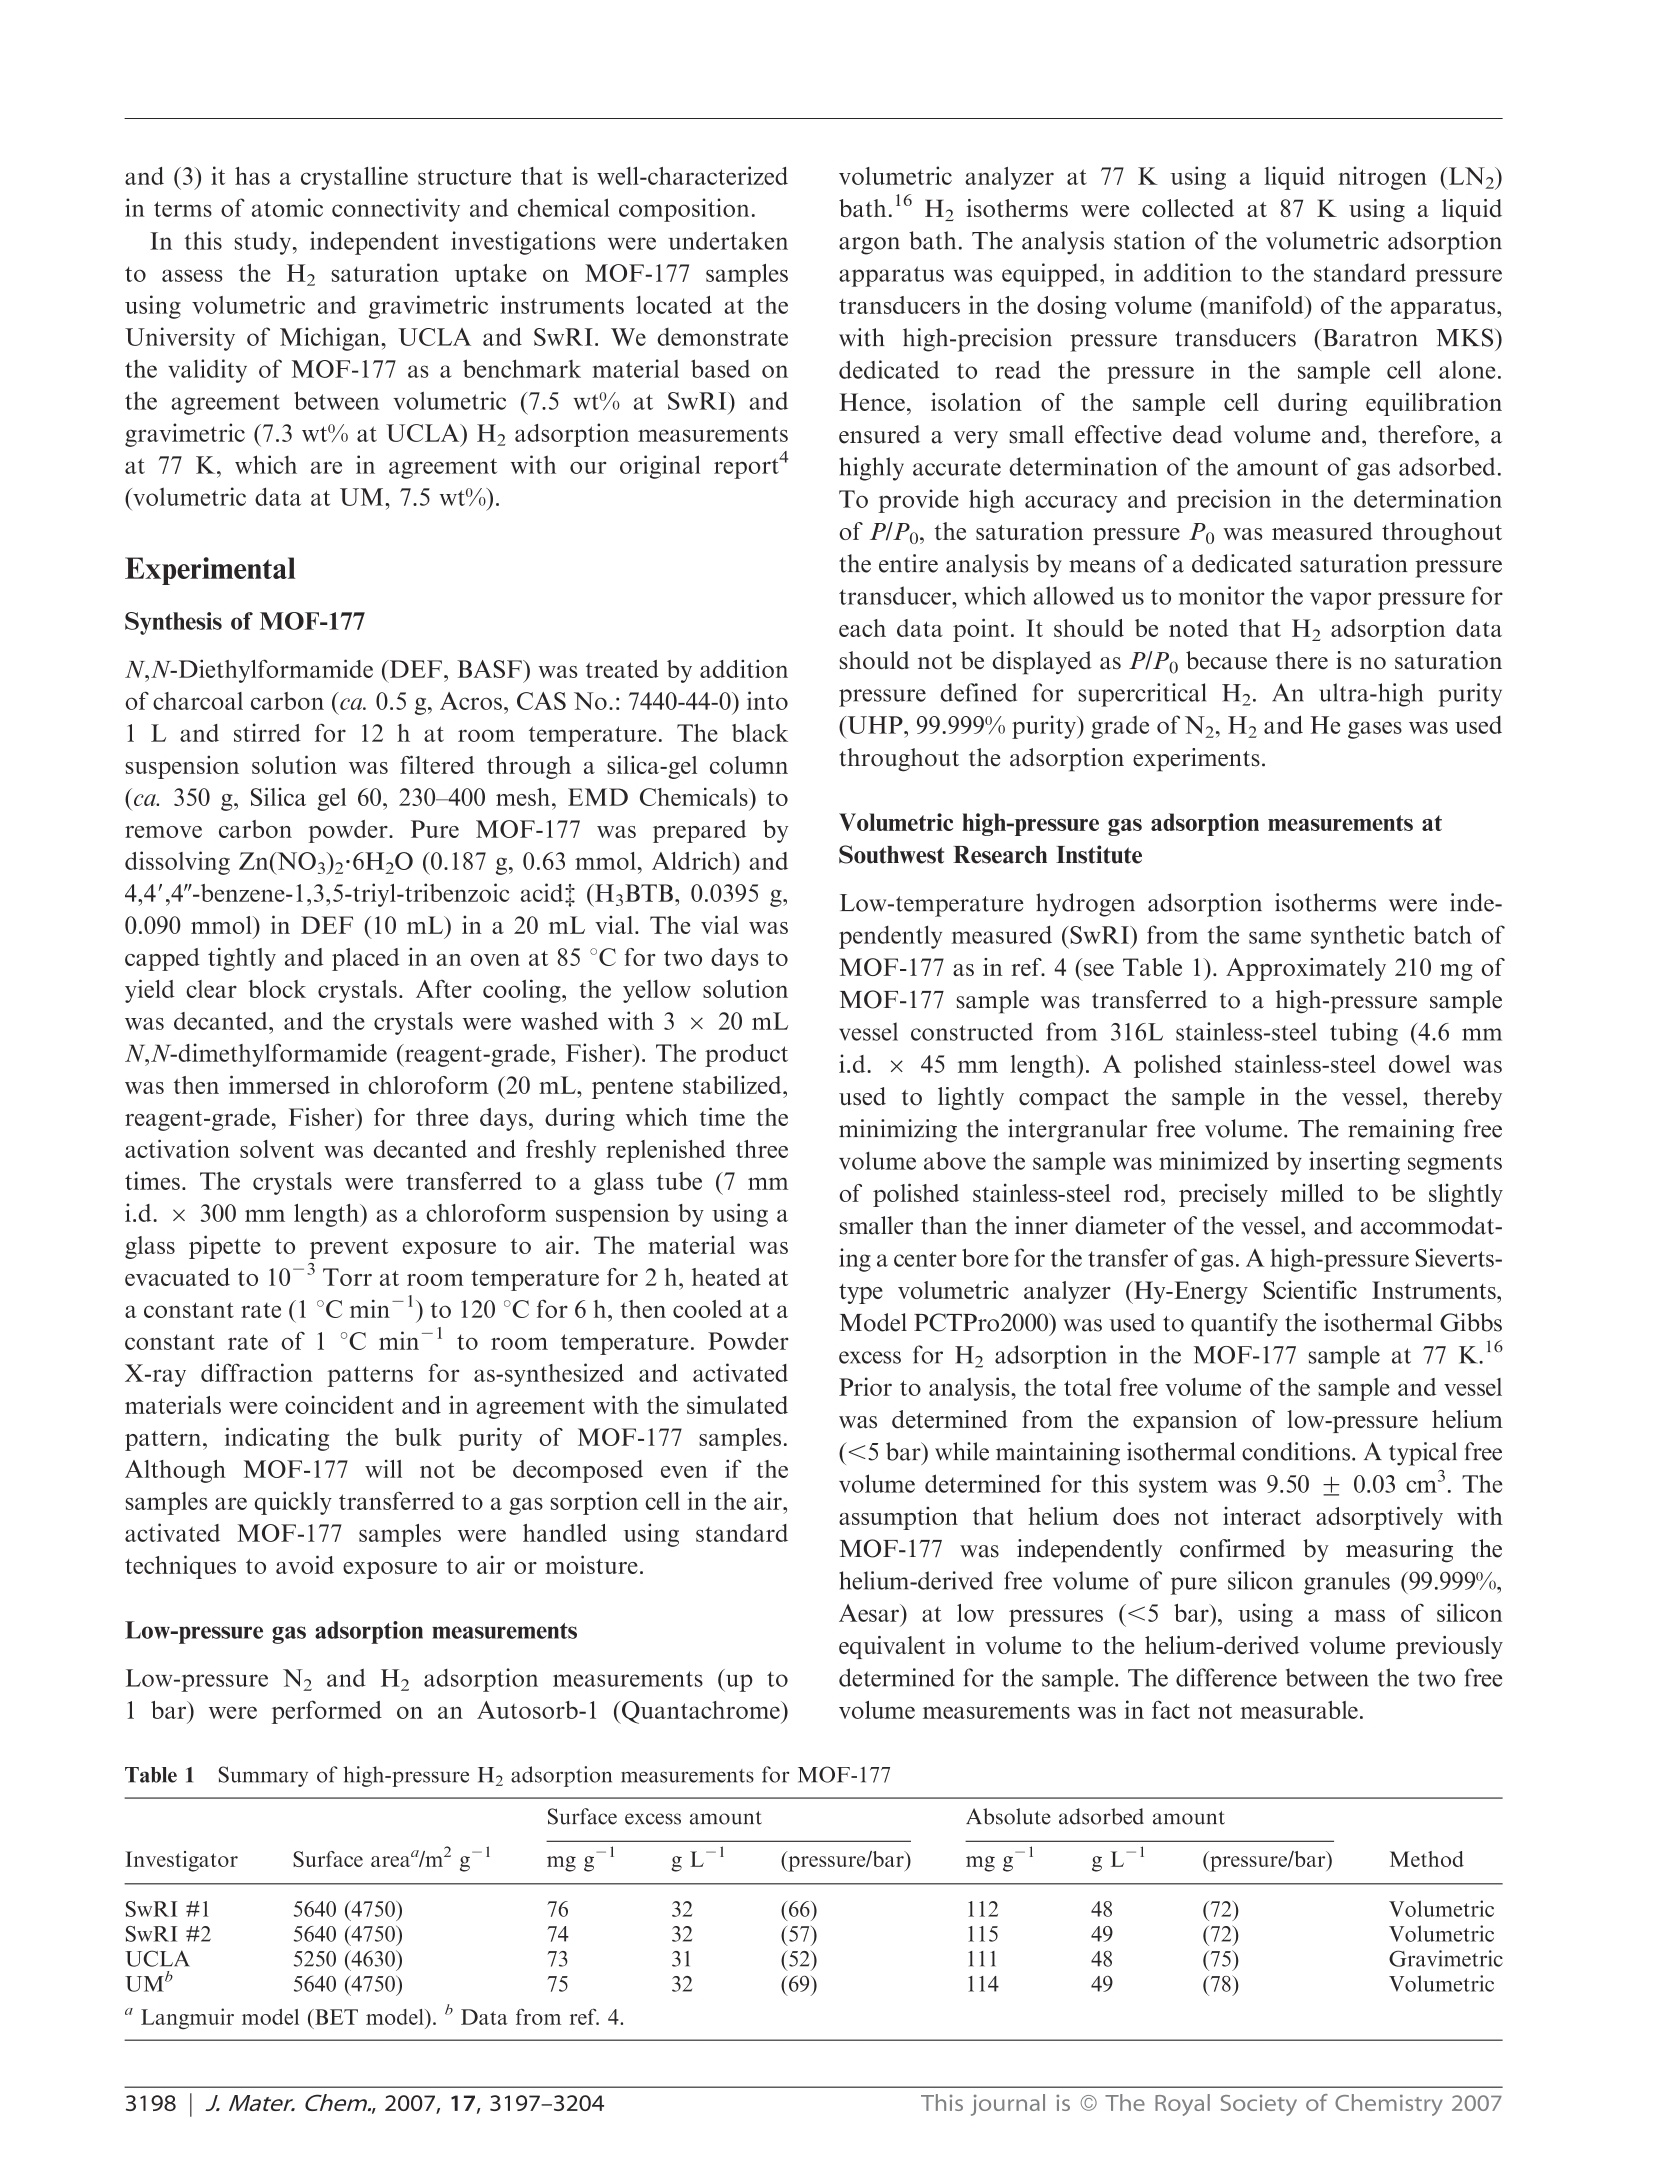
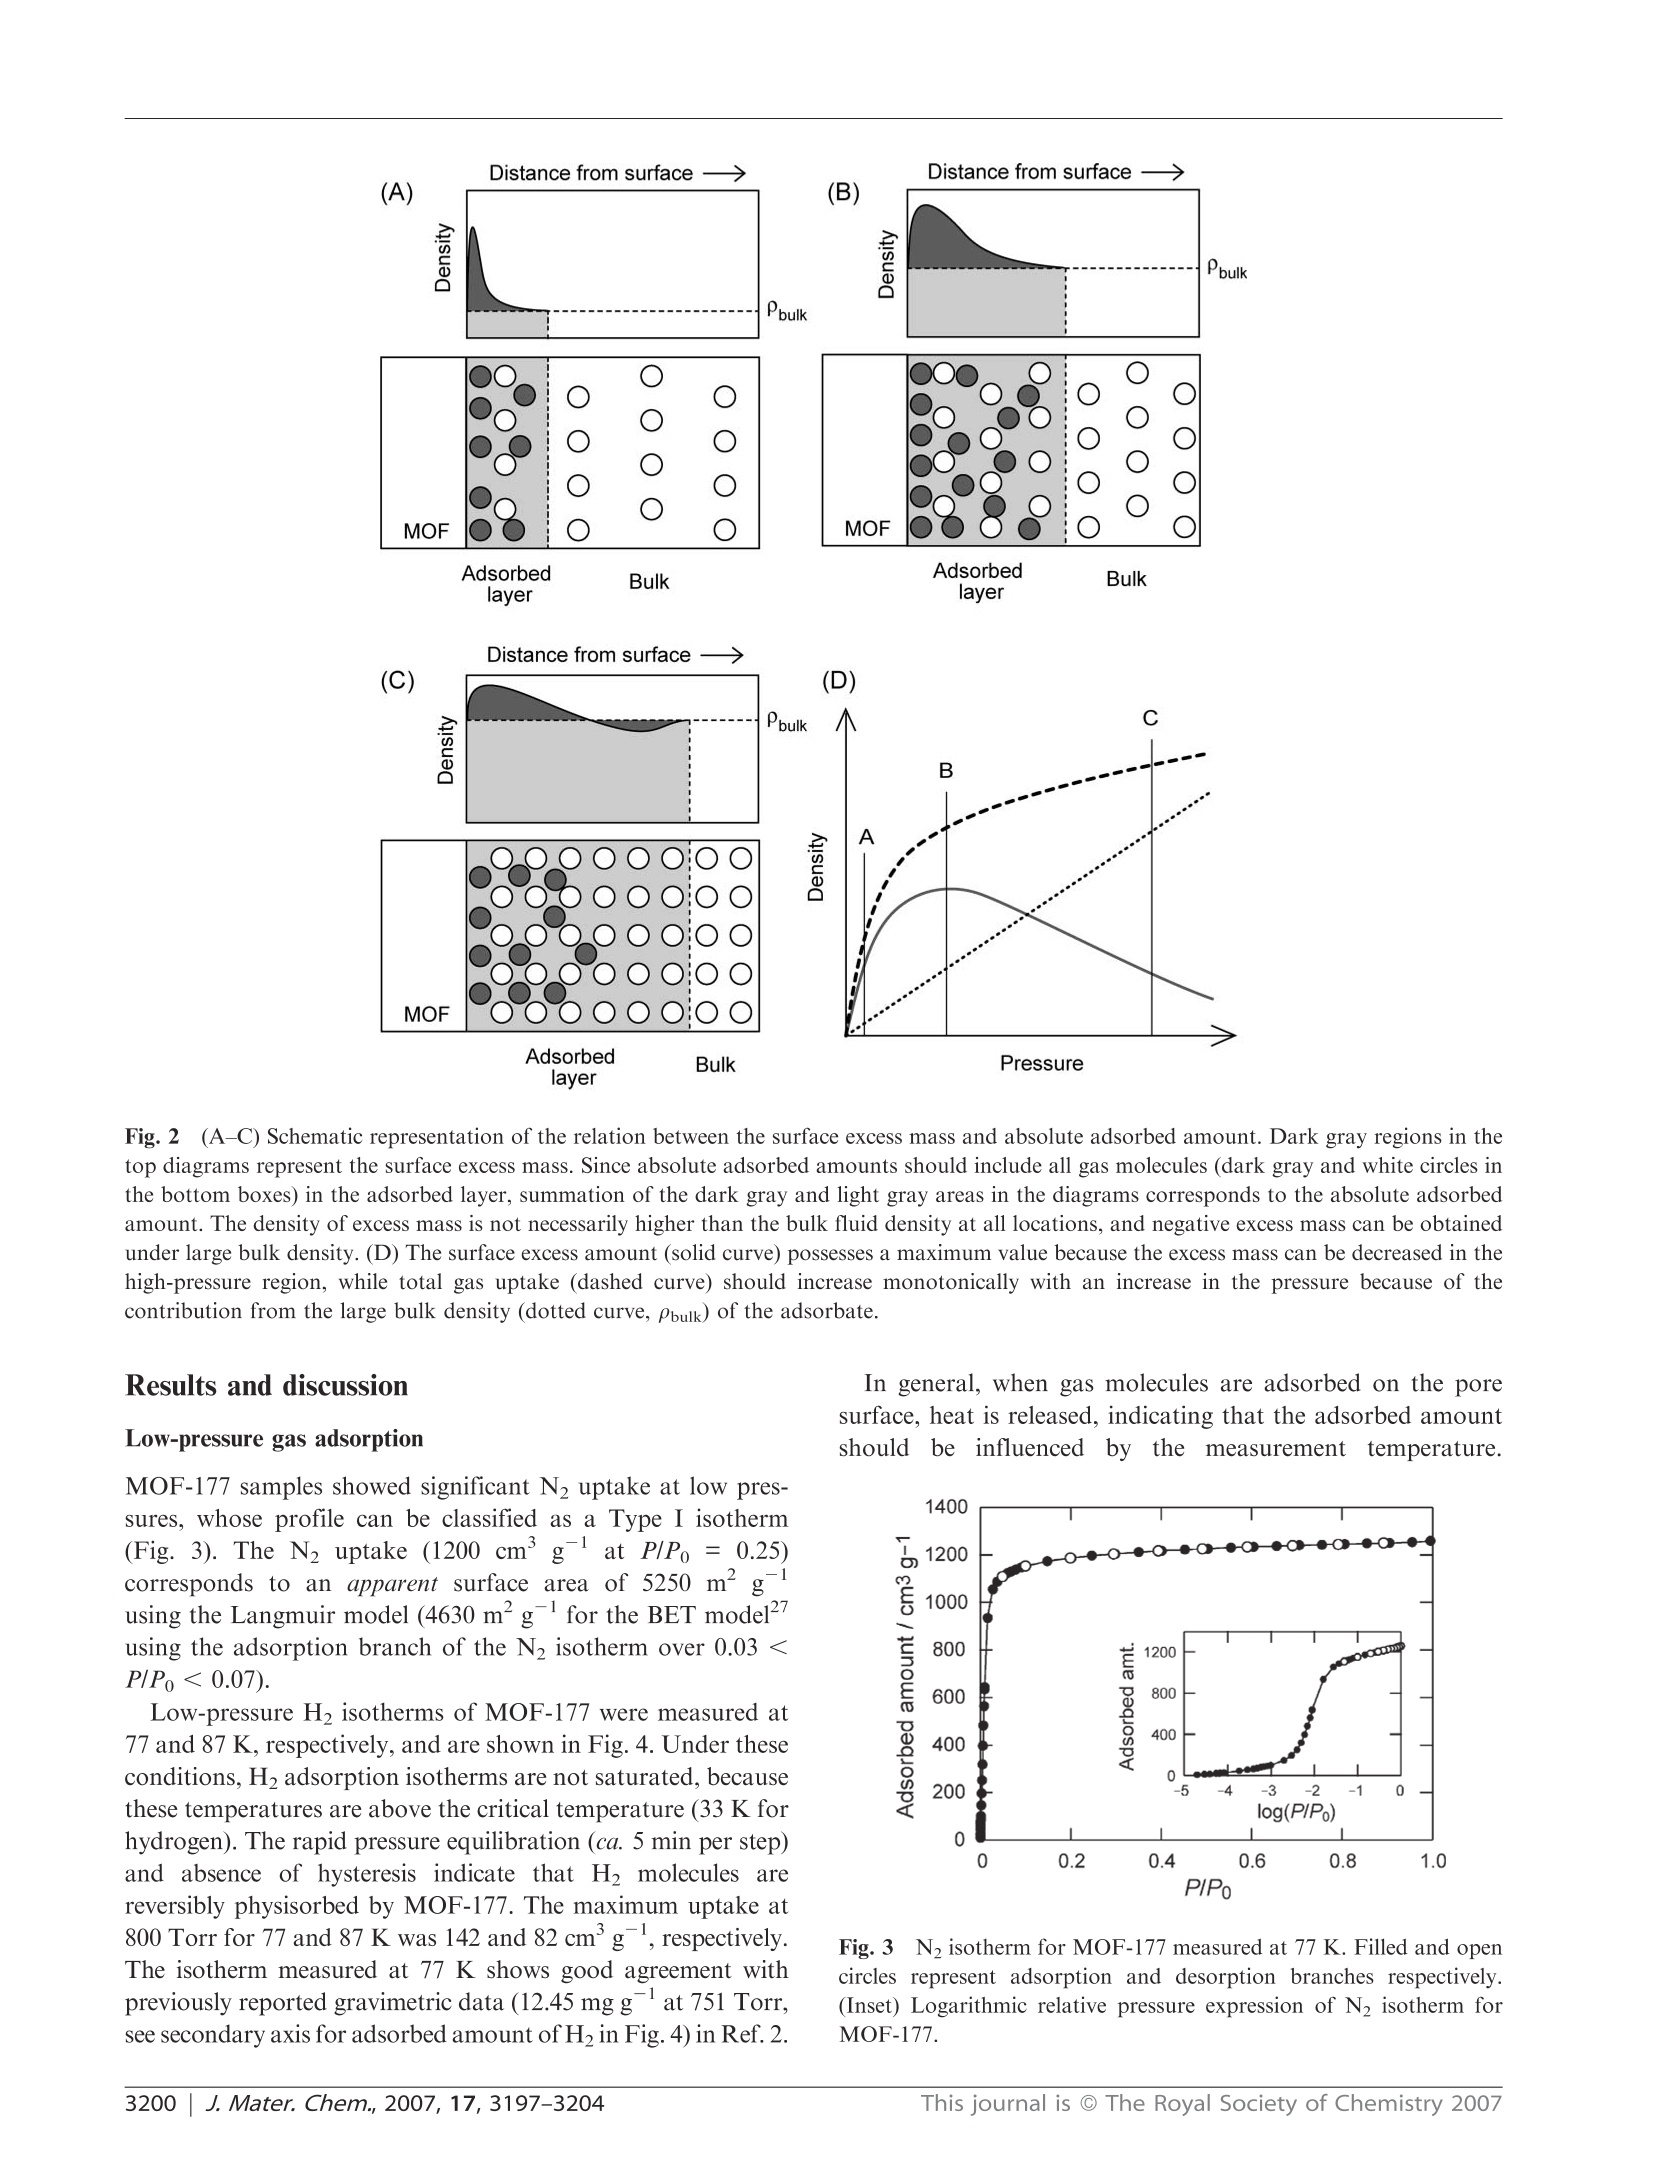
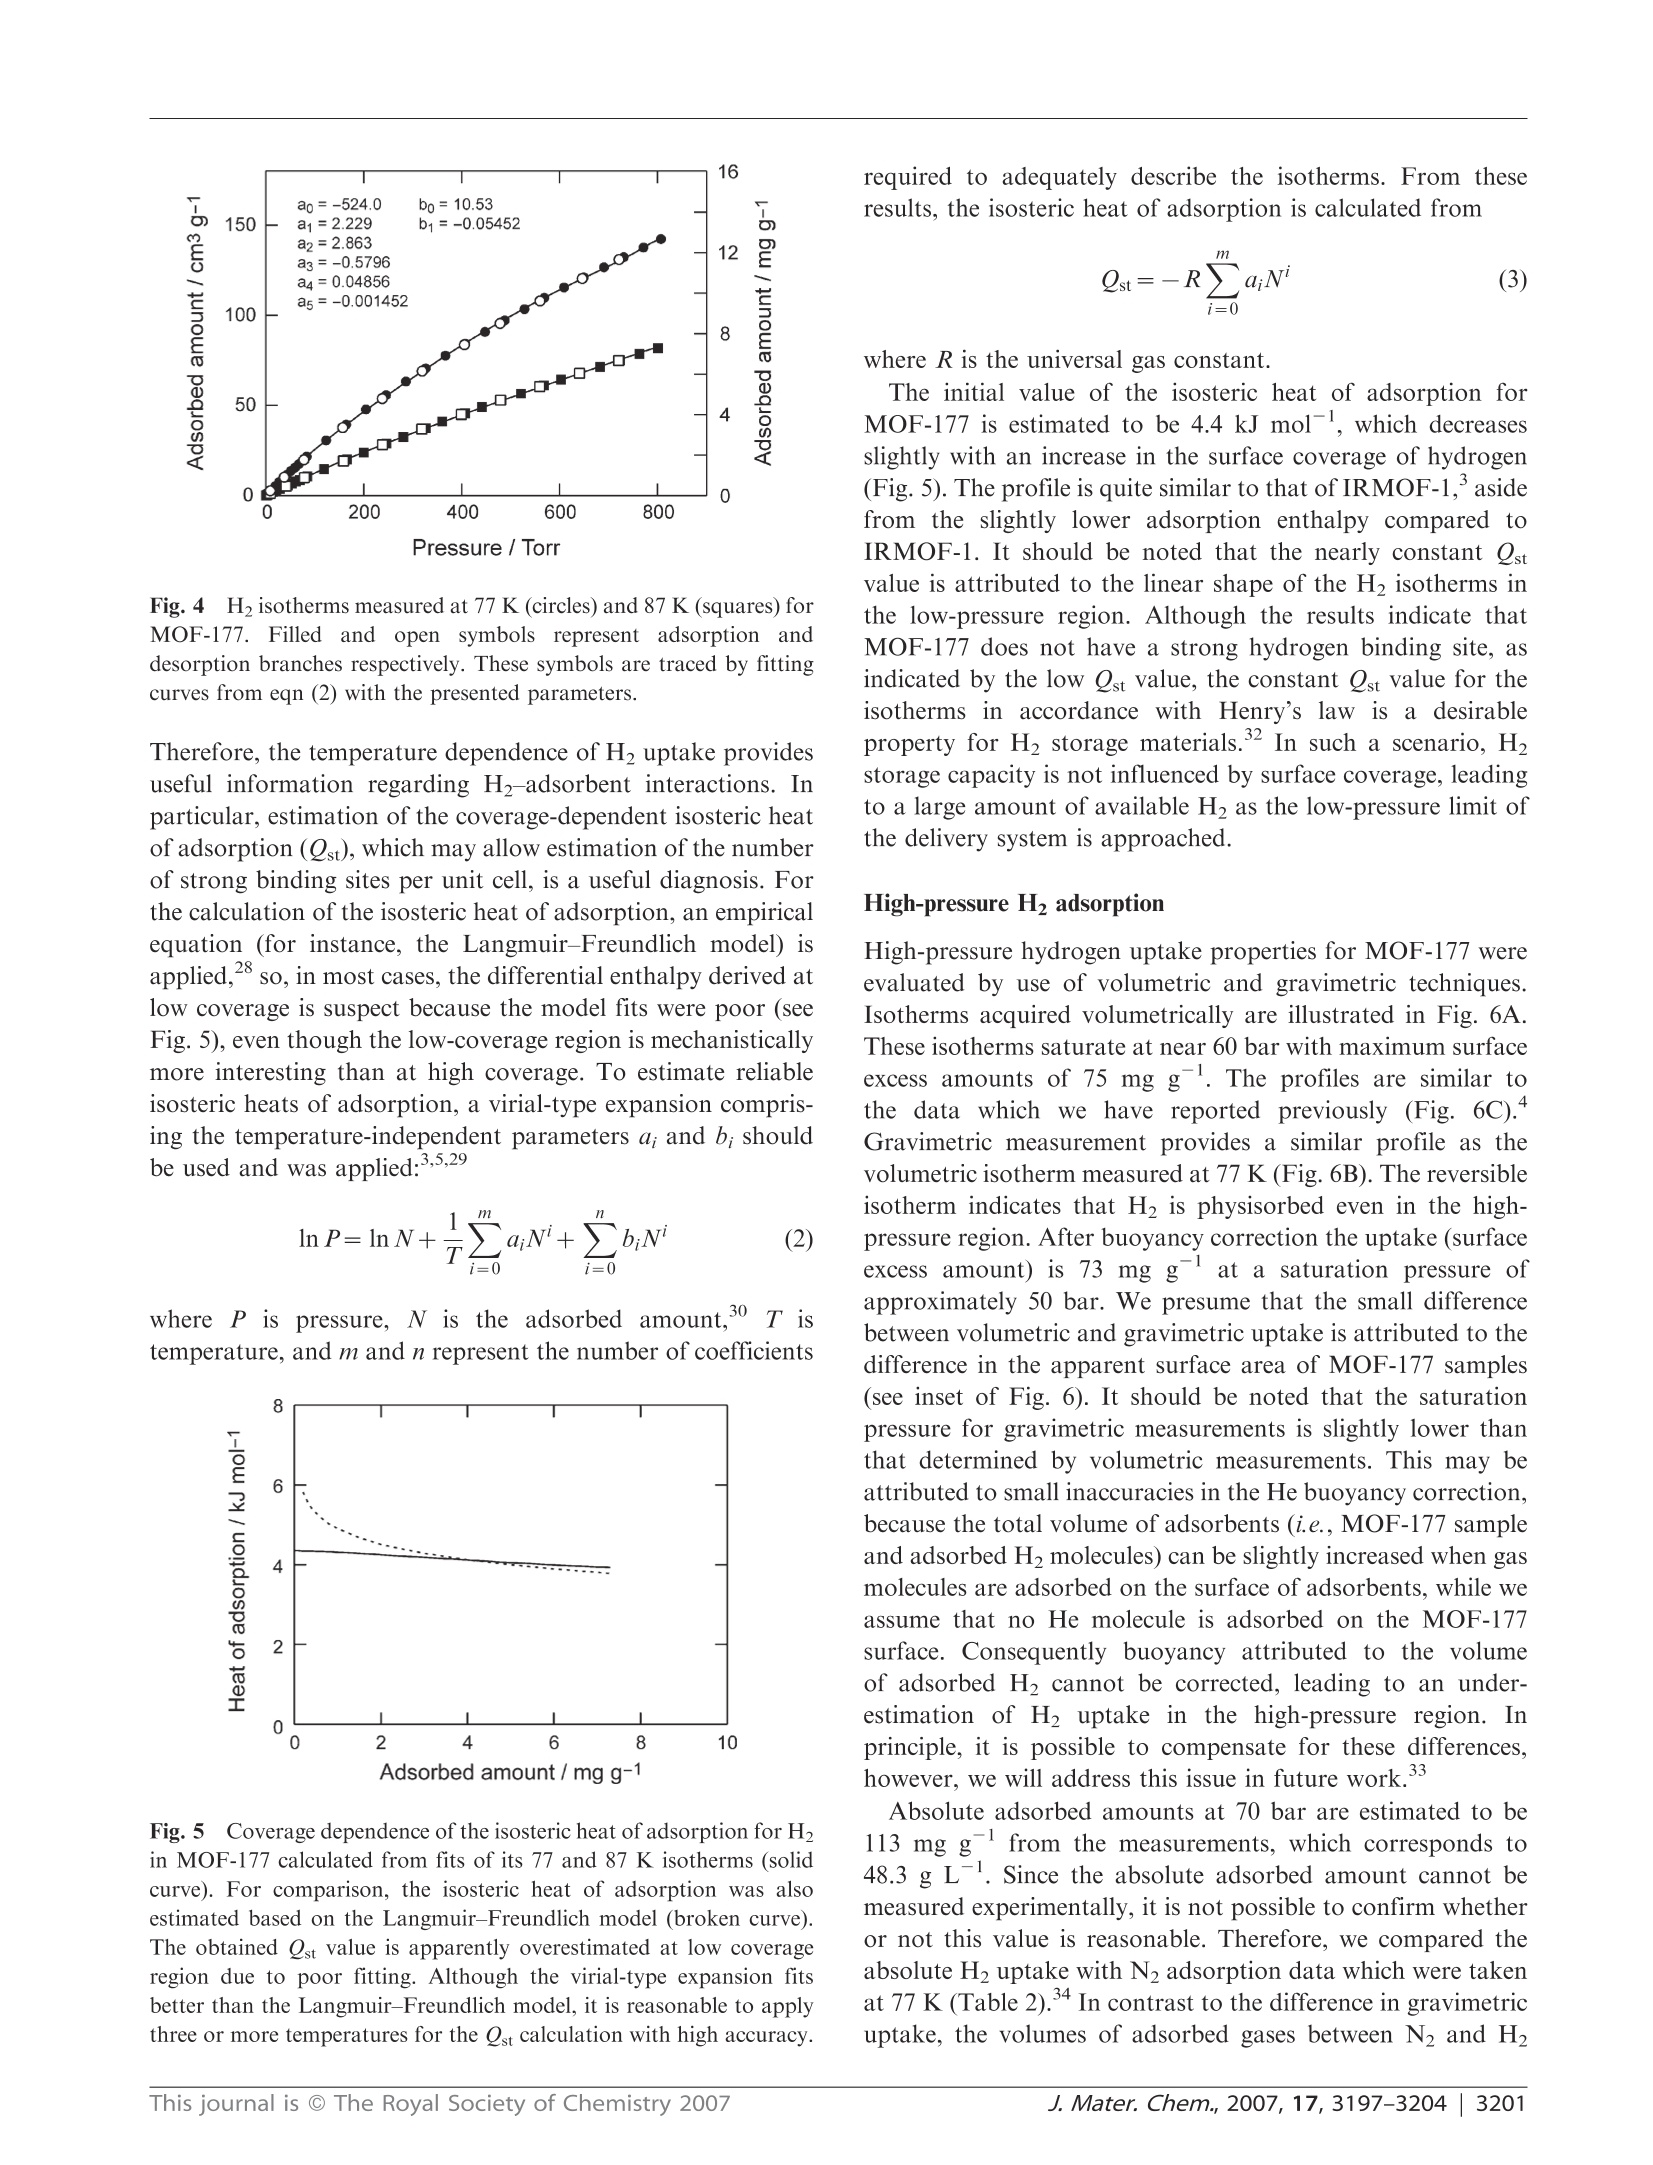
www.rsc.org/materialsJournal of Materials ChemistryPAPER Independent verification of the saturation hydrogen uptake in MOF-177and establishment of a benchmark for hydrogen adsorption inmetal-organic frameworkstt Hiroyasu Furukawa,*“ Michael A. Miller and Omar M. Yaghi*" Received 9th March 2007, Accepted 23rd April 2007 First published as an Advance Article on the web 10th May 2007 DOI:10.1039/b703608f Hydrogen isotherms for MOF-177, Zn4O(1,3,5-benzenetribenzoate)2, crystals were independentlymeasured by volumetric and gravimetric methods at 77 K to confirm its hydrogen uptake capacityand to establish the importance of calibrating gas adsorption instrumentation prior to evaluatingH2 storage capacities. Reproducibility of hydrogen adsorption experiments is important becausenon-systematic errors in measurements can easily occur leading to erroneous reports of capacities.The surface excess weight percentage of hydrogen uptake in MOF-177 samples is 7.5 wt% at70 bar, which corresponds to an absolute adsorbed amount of 11 wt%. These values are inagreement with our previous report and with those found independently by Southwest ResearchInstitute. Considering its well-known structure and its significant H2 uptake properties, we believeMOF-177 is an excellent material to serve as a benchmark adsorber. The discovery of hydrogen adsorption in porous metal-organic frameworks (MOFs) and subsequent related studieshas firmly established these materials as interesting candidatesfor hydrogen storageapplications.1-8 This is due to theavailability of a large number of well-characterized MOFsand to the flexibility with which their organic and inorganiccomponents can be varied. In a recent reviewwe delineatednumerous strategies that can be used in MOF chemistry forachieving the targets for on-board hydrogen storage systemsset by the US Department of Energy (DOE) for use ofhydrogen as a fuel. The gravimetric (6.0 wt%) and volumetric(45 g L-) densities to be achieved by 2010 are important inthe context of the present report as many research groups areaiming to achieve these targets. Recently, under a DOE-funded program, we showed thatMOF-177 (Fig.,..1) can store 77.5wt%hydrogen with avolumetric capacity of 32 g L-lat 77 K and 70 bar.Another MOF was found to store 5.1 wt% with a volumetriccapacity of 43 g Lat 77 K and 45 bar. These results areexciting as these MOFs exhibit the highest hydrogen uptake of ( “Department o f Chemistry a n d Biochemistry, Ce n ter for Re t icular Chemistry at t he California NanoSystems Institute, University ofCalifornia, L o s A ngeles, 6 07 Charles E . Y o ung Drive East, Lo s Angeles, California 90095 - 1569, U SA. E-mail: furukawa@chem.ucla.edu;yaghi@chem.ucla.edu; Tel : +1-310-206-0398 ) ( " Department of M aterials Engineering, National Testing Laborator y for Solid-State Hydrogen Storage Technologies, S outhwest R esearch Institute , 6220 Culebra Road, San Antonio, Texas 7 8 238-5166, andDepartment of Chemistry, U niversity ofTe x as at San Antonio, OneUTSA Circle, S an Antonio, T exas 7 8249-1644, U SA.Tel:+1-210-522-2189 ) ( t This paper i s part of a Journal of Materials Chemistry t heme issue on New E n ergy M a terials. Guest editor:M. S a iful Islam. ) ( tE l ectronic s u pplementary in f ormation (ESI) available: syn t hesis of HBTB link, powder X-ray di f fraction p a ttern and T G A ana l ysis forMOF-177, and adsorption data. See DOI: 1 0.1039/b703608f ) any porous materials and clearly show that in principle theDOE targets can be achieved at 77 K. In light of thesedevelopments and the extensive work being done on MOFswe propose the establishment of MOF-177as a benchmarkmaterial for researchers in the field. This is important as thefield of hydrogen storage has often suffered from reportsof high hydrogen uptake whichwere later found to beerroneous. Accordingly, our DOE program officers haveadvised that independent measurements of hydrogen uptakeshould be performed at a DOE-approved facility (SouthwestResearch Institute; SwRI) to independently verify hydrogenuptake measurements reported for MOF-177.Here we reportjointly on the results of the verification tests, point out some ofthe intricacies of hydrogen measurements, and suggest astandard for reporting results of hydrogen adsorption. We remark that MOF-177 is an ideal material to use as abenchmark for hydrogen adsorption measurements on MOFmaterials due to the following facts: (1) it has high gravimetricand volumetric uptake capacity that is 3-5 times higherthan in well-studied commercial materials, such as activatedcarbons or zeolites,4 leading to ease of high accuracy mea-surements; (2) its synthesis is simple and highly reproducible; Fig. 11(A) Molecular structure of the BTB link and (B) crystalstructure of MOF-177. An approximately spherical pore is shown asthe large sphere with a 17 A diameter. and (3) it has a crystalline structure that is well-characterizedin terms of atomic connectivity and chemical composition. In this study, independent investigations were undertakento assess the H2 saturation uptake on MOF-177 samplesusing volumetric and gravimetric instruments located at theUniversity of Michigan, UCLA and SwRI. We demonstratethe validity of MOF-177 as a benchmark material based onthe agreement between volumetric (7.5 wt% at SwRI) andgravimetric (7.3 wt% at UCLA) H2 adsorption measurementsat 77 K, which are in agreement with our original report"(volumetric data at UM, 7.5 wt%). Experimental Synthesis of MOF-177 N,N-Diethylformamide (DEF, BASF) was treated by additionof charcoal carbon (ca. 0.5 g, Acros, CAS No.: 7440-44-0) intol L and stirred for 12 h at room temperature. The blacksuspension solution was filtered through a silica-gel column(ca. 350 g, Silica gel 60, 230-400 mesh, EMD Chemicals) toremove carbon powder. Pure MOF-177 was prepared bydissolving Zn(NO3)26H2O (0.187 g, 0.63 mmol, Aldrich) and4,4',4"-benzene-1,3,5-triyl-tribenzoic acid: (HBTB, 0.0395 g,0.090 mmol) in DEF (10 mL) in a 20 mL vial. The vial wascapped tightly and placed in an oven at 85 ℃ for two days toyield clear block crystals. After cooling, the yellow solutionwas decanted, and the crystals were washed with 3× 20 mLN,N-dimethylformamide (reagent-grade, Fisher). The productwas then immersed in chloroform (20 mL, pentene stabilized,reagent-grade, Fisher) for three days, during which time theactivation solvent was decanted and freshly replenished threetimes. The crystals were transferred to a glass tube (7 mmi.d. × 300 mm length) as a chloroform suspension by using aglass pipette to prevent exposure to air. The material wasevacuated to 10-Torr at room temperature for 2 h, heated ata constant rate (1C min) to 120 ℃ for 6 h, then cooled at aconstant rate of 1 ℃ min- to room temperature. PowderX-ray diffraction patterns for as-synthesized and activatedmaterials were coincident and in agreement with the simulatedpattern, indicating the bulk purity of MOF-177 samples.Although MOF-177 will not be decomposed even if thesamples are quickly transferred to a gas sorption cell in the air,activated MOF-177 samples were handled using standardtechniques to avoid exposure to air or moisture. Low-pressure gas adsorption measurements Low-pressure N2 and H2 adsorption measurements (up to1 bar) were performed on an Autosorb-1 (Quantachrome) volumetric analyzer at 77 K using a liquid nitrogen (LN2)bath. H2 isotherms were collected at 87 K using a liquidargon bath. The analysis station of the volumetric adsorptionapparatus was equipped, in addition to the standard pressuretransducers in the dosing volume (manifold) of the apparatus,with high-precision pressure transducers (Baratron MKS)dedicated to read the pressure in the sample cell alone.Hence, isolation of the sample cell during equilibrationensured a very small effective dead volume and, therefore, ahighly accurate determination of the amount of gas adsorbed.To provide high accuracy and precision in the determinationof P/Po, the saturation pressure Po was measured throughoutthe entire analysis by means of a dedicated saturation pressuretransducer, which allowed us to monitor the vapor pressure foreach data point. It should be noted that H2 adsorption datashould not be displayed as P/Po because there is no saturationpressure defined for supercritical H2. An ultra-high purity(UHP, 99.999% purity) grade of N2, H2 and He gases was usedthroughout the adsorption experiments. Volumetric high-pressure gas adsorption measurements atSouthwest Research Institute Low-temperature hydrogen adsorption isotherms were inde-pendently measured (SwRI) from the same synthetic batch ofMOF-177 as in ref. 4(see Table 1). Approximately 210 mg ofMOF-177 sample was transferred to a high-pressure samplevessel constructed from 316L stainless-steel tubing (4.6 mmi.d.x 45 mm length). A polished stainless-steel dowel wasused to lightly compact the sample in the vessel, therebyminimizing the intergranular free volume. The remaining freevolume above the sample was minimized by inserting segmentsof polished stainless-steel rod, precisely milled to be slightlysmaller than the inner diameter of the vessel, and accommodat-ing a center bore for the transfer of gas. A high-pressure Sieverts-type volumetric analyzer (Hy-Energy Scientific Instruments,Model PCTPro2000) was used to quantify the isothermal Gibbsexcess for H2 adsorption in the MOF-177 sample at 77 K.Prior to analysis, the total free volume of the sample and vesselwas determined from the expansion of low-pressure helium(<5 bar) while maintaining isothermal conditions. A typical freevolume determined for this system was 9.50 ±0.03 cm. Theassumption that helium does not interact adsorptively withMOF-177 was independently confirmed by measuring thehelium-derived free volume of pure silicon granules (99.999%,Aesar) at low pressures (<5 bar), using a mass of siliconequivalent in volume to the helium-derived volume previouslydetermined for the sample. The difference between the two freevolume measurements was in fact not measurable. Surface excess amount Absolute adsorbed amount Investigator Surface area"/m’g mg gg gL-i (pressure/bar) mgg gL (pressure/bar) Method SwRI #1 5640 (4750) 76 32 (66) 112 48 (72) Volumetric SwRI #2 5640 (4750) 74 32 (57) 115 49 (72) Volumetric UCLA 5250 (4630) 73 31 (52) 111 48 (75) Gravimetric UM 5640 (4750) 75 32 (69) 114 49 (78) Volumetric “Langmuir model (BET model)."Data from ref. 4. After re-evacuating the sample vessel, low-temperatureisotherms were achieved by immersing the sample vessel in aLN2 bath, then allowing the vessel and sample to equilibrate at77 K for 2 h before commencing the experiments. The liquidlevel of LN2 was carefully adjusted to a predefined mark on thesample vessel above the sample position so as to mitigatedensity fluctuations of gas in the column above the vessel,which are reflected as pressure fluctuations by the pressuretransducers of the instrument. H2 adsorption isotherms wereconstructed in replicate by dosing the initially evacuatedsample in a step-wise fashion, allowing sufficient time forequilibration between each pressure increment in the profilesuch that the variance in the time course profile for H2 uptakewas less than 0.001 wt%. To account for the temperature gradient that arises betweenthe calibrated dosing volume (304 K) and the sample vessel(77K), a linear correction factor (C))was derivedbycalibrating the effect of this gradient on the gas density inthis segment of the instrument. Experimental determination ofCr was achieved by replacing the sample with high puritysilicon granules and measuring the adsorption isotherm (77 K)over the requisite pressure regime. Hydrogen gas concentrations were corrected for non-idealbehavior by computing the pressure dependence of thecompressibility factor derived semi-empirically from PVTtables. The adsorbed concentrations of H2 (excess mass)were then computed using the previously measured free-volume and thermal-gradient correction factor (Cf). The accessible volume was calculated in the Void Spaceroutine in Cerius using the default settings (1.3 A probe radiuswhich is half of the kinetic diameter of helium), which was usedfor the estimation of absolute adsorbed amount (i.e., Vpore =1.56 cm’g-).18 In the unit conversion (mg g→gL), thebulk density of MOF-177 (d= 0.427 g cm-3) was applied tothe amount of H2 uptake (i.e., 10 mgg=4.27 g L). Gravimetric high-pressure gas adsorption measurements atUCLA Gravimetric H2 sorption isotherms were measured by use of aGHP-300 (Gravimetric High Pressure analyzer) from the VTICorporation.16 A Rubotherm magnetic suspension balanceMC-5 was used to measure the change in mass of samplessuspended within a tube (22 mm i.d.) constructed from Inconel625 under a chosen atmosphere. Prior to admittance of theanalyte gas, the entire chamber and manifold were evacuatedat room temperature, and the weight of the Al sample bucket(12 mm i.d. × 21 mm length) was measured. After loading theMOF-177 sample (ca. 200 mg) the system was purged at roomtemperature with hydrogen and helium, and the sample wasoutgassed, using a turbomolecular drag pump (Pfeiffer, TSH071 E), until a constant mass was attained. When H2 gas wasused, water and other condensable impurities were removedwith a LN2 trap. Pressure was measured with a MKS Baratrontransducer 120AA (0 to 1000 Torr) and an electronic Bourdongauge-type transducer (Mensor, up to 1500 psi). The adsorbatewas added incrementally, and data points were recorded whenno further change in mass was observed. The temperature inthe Inconel tube was also monitored with a platinum resistancethermometer. To obtain the excess adsorption isotherm, all data pointswere corrected for buoyancy and the thermal gradient thatarises between the balance (313 K) and the sample bucket(77K). Buoyancy and thermal-gradient effects exhibited by thebucket and the components associated with the magneticsuspension balance were corrected on the basis of the changein mass of the empty bucket within the analyte gas at 77 K.The weight loss due to the buoyancy of the adsorbent wasdetermined by multiplying the volume of the MOF-177framework skeleton by the density of H20 (i.e., correctedmass for buoyancy is Vskeleton × Pbulk). The volume of theMOF-177 framework skeletonwasdetermined from thehelium(<15 bar) buoyancy curve at 298 K using the samegravimetric system. The absolute amount of gas adsorbedwas calculated from the density of the framework skeleton(inverse of the skeleton volume) and the crystallographicdensity (d = 0.427 g cm), leading to an accessible porevolume (Vpore =1.69 cm’g-) for MOF-177.18 Estimation of absolute adsorbed amount There are two components of gas adsorption: namely, thesurface excess and the absolute adsorption.Fig.2 illustratesthese components based on the definition of the Gibbs dividingsurface."? When an adsorbent is exposed to gas molecules,some of the gas molecules are physisorbed on the surface.However, since thiss processis; an equilibrium betweenadsorption and desorption, the bulk density (i.e., the amountnot adsorbed but present in the free volume) of the adsorbateis usually not zero. Therefore, the observed mass change in thesample is represented by the difference between the totaladsorbed amount and the bulk density of the adsorbate.Experimental measurements are reported as a surface excessamount.2 To estimate the absolute amount of gas adsorbed,the thickness of the adsorbed layer must be known. However,this variable, and its spatial profile, cannot be measuredexperimentally. Instead, the absolute adsorption can only beestimated theoretically using, for example, Monte Carlosimulations.23 Although the surface excess mass is a useful concept, fromthe viewpoint of hydrogen storage, the total amount that amaterial can store is more relevant to use for hydrogen as afuel. However, at high temperatures and pressures (i.e., abovethe critical temperature and pressure of hydrogen), the densityprofile of the adsorbed phase becomes more diffused and,therefore, it is not possible to distinguish between the adsorbedand bulk phases with the present techniques. In this situationthesurface excess isiStthe only experimentally accessiblequantity, and there is not a reliable method to estimate theabsolute adsorbed amount with high accuracy, although manyefforts have been devoted to resolve this issue.24 Therefore, weestimate the absolute amount of hydrogen adsorbed using asimple equation:25,26 where Nabs is the absolute adsorbed amount, Nex is the surfaceexcess amount, Pbulk is the bulk density of H2,and Vpore isthe pore volume for MOF-177. layer Fig.2(A-C) Schematic representation of the relation between the surface excess mass and absolute adsorbed amount. Dark gray regions in thetop diagrams represent the surface excess mass. Since absolute adsorbed amounts should include all gas molecules (dark gray and white circles inthe bottom boxes) in the adsorbed layer, summation of the dark gray and light gray areas in the diagrams corresponds to the absolute adsorbedamount. The density of excess mass is not necessarily higher than the bulk fluid density at all locations, and negative excess mass can be obtainedunder large bulk density.(D) The surface excess amount (solid curve) possesses a maximum value because the excess mass can be decreased in thehigh-pressure region, while total gas uptake (dashed curve) should increase monotonically with an increase in the pressure because of thecontribution from the large bulk density (dotted curve, pbulk) of the adsorbate. Results and discussion Low-pressure gas adsorption MOF-177 samples showed significant N2 uptake at low pres-sures, whose profile can be classified as a Type I isotherm(Fig. 3). The N2 uptake (1200 cm’g-at P/Po =0.25)corresponds to an apparent surface area of 5250 m’using the Langmuir model (4630 m’gfor the BET modelusing the adsorption branch of the N2 isotherm over 0.03
确定



还剩6页未读,是否继续阅读?
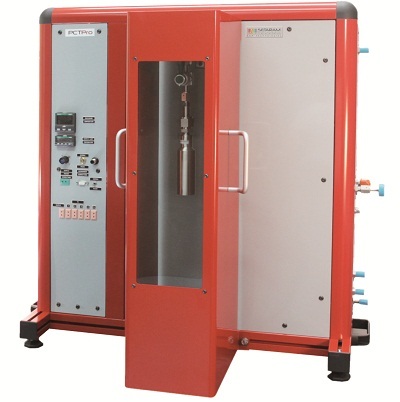
凯璞科技(上海)有限公司为您提供《氢气吸附性能中多孔材料的影响检测方案(化学吸附仪)》,该方案主要用于单质中理化分析检测,参考标准--,《氢气吸附性能中多孔材料的影响检测方案(化学吸附仪)》用到的仪器有PCTPro-Evo气体吸附测量仪
推荐专场

