


方案详情
文
利用必达泰克公司的i-Raman激光拉曼光谱仪来检测硅结晶过程中从非定型硅到多晶硅的晶化率,并获得了满意的效果
方案详情

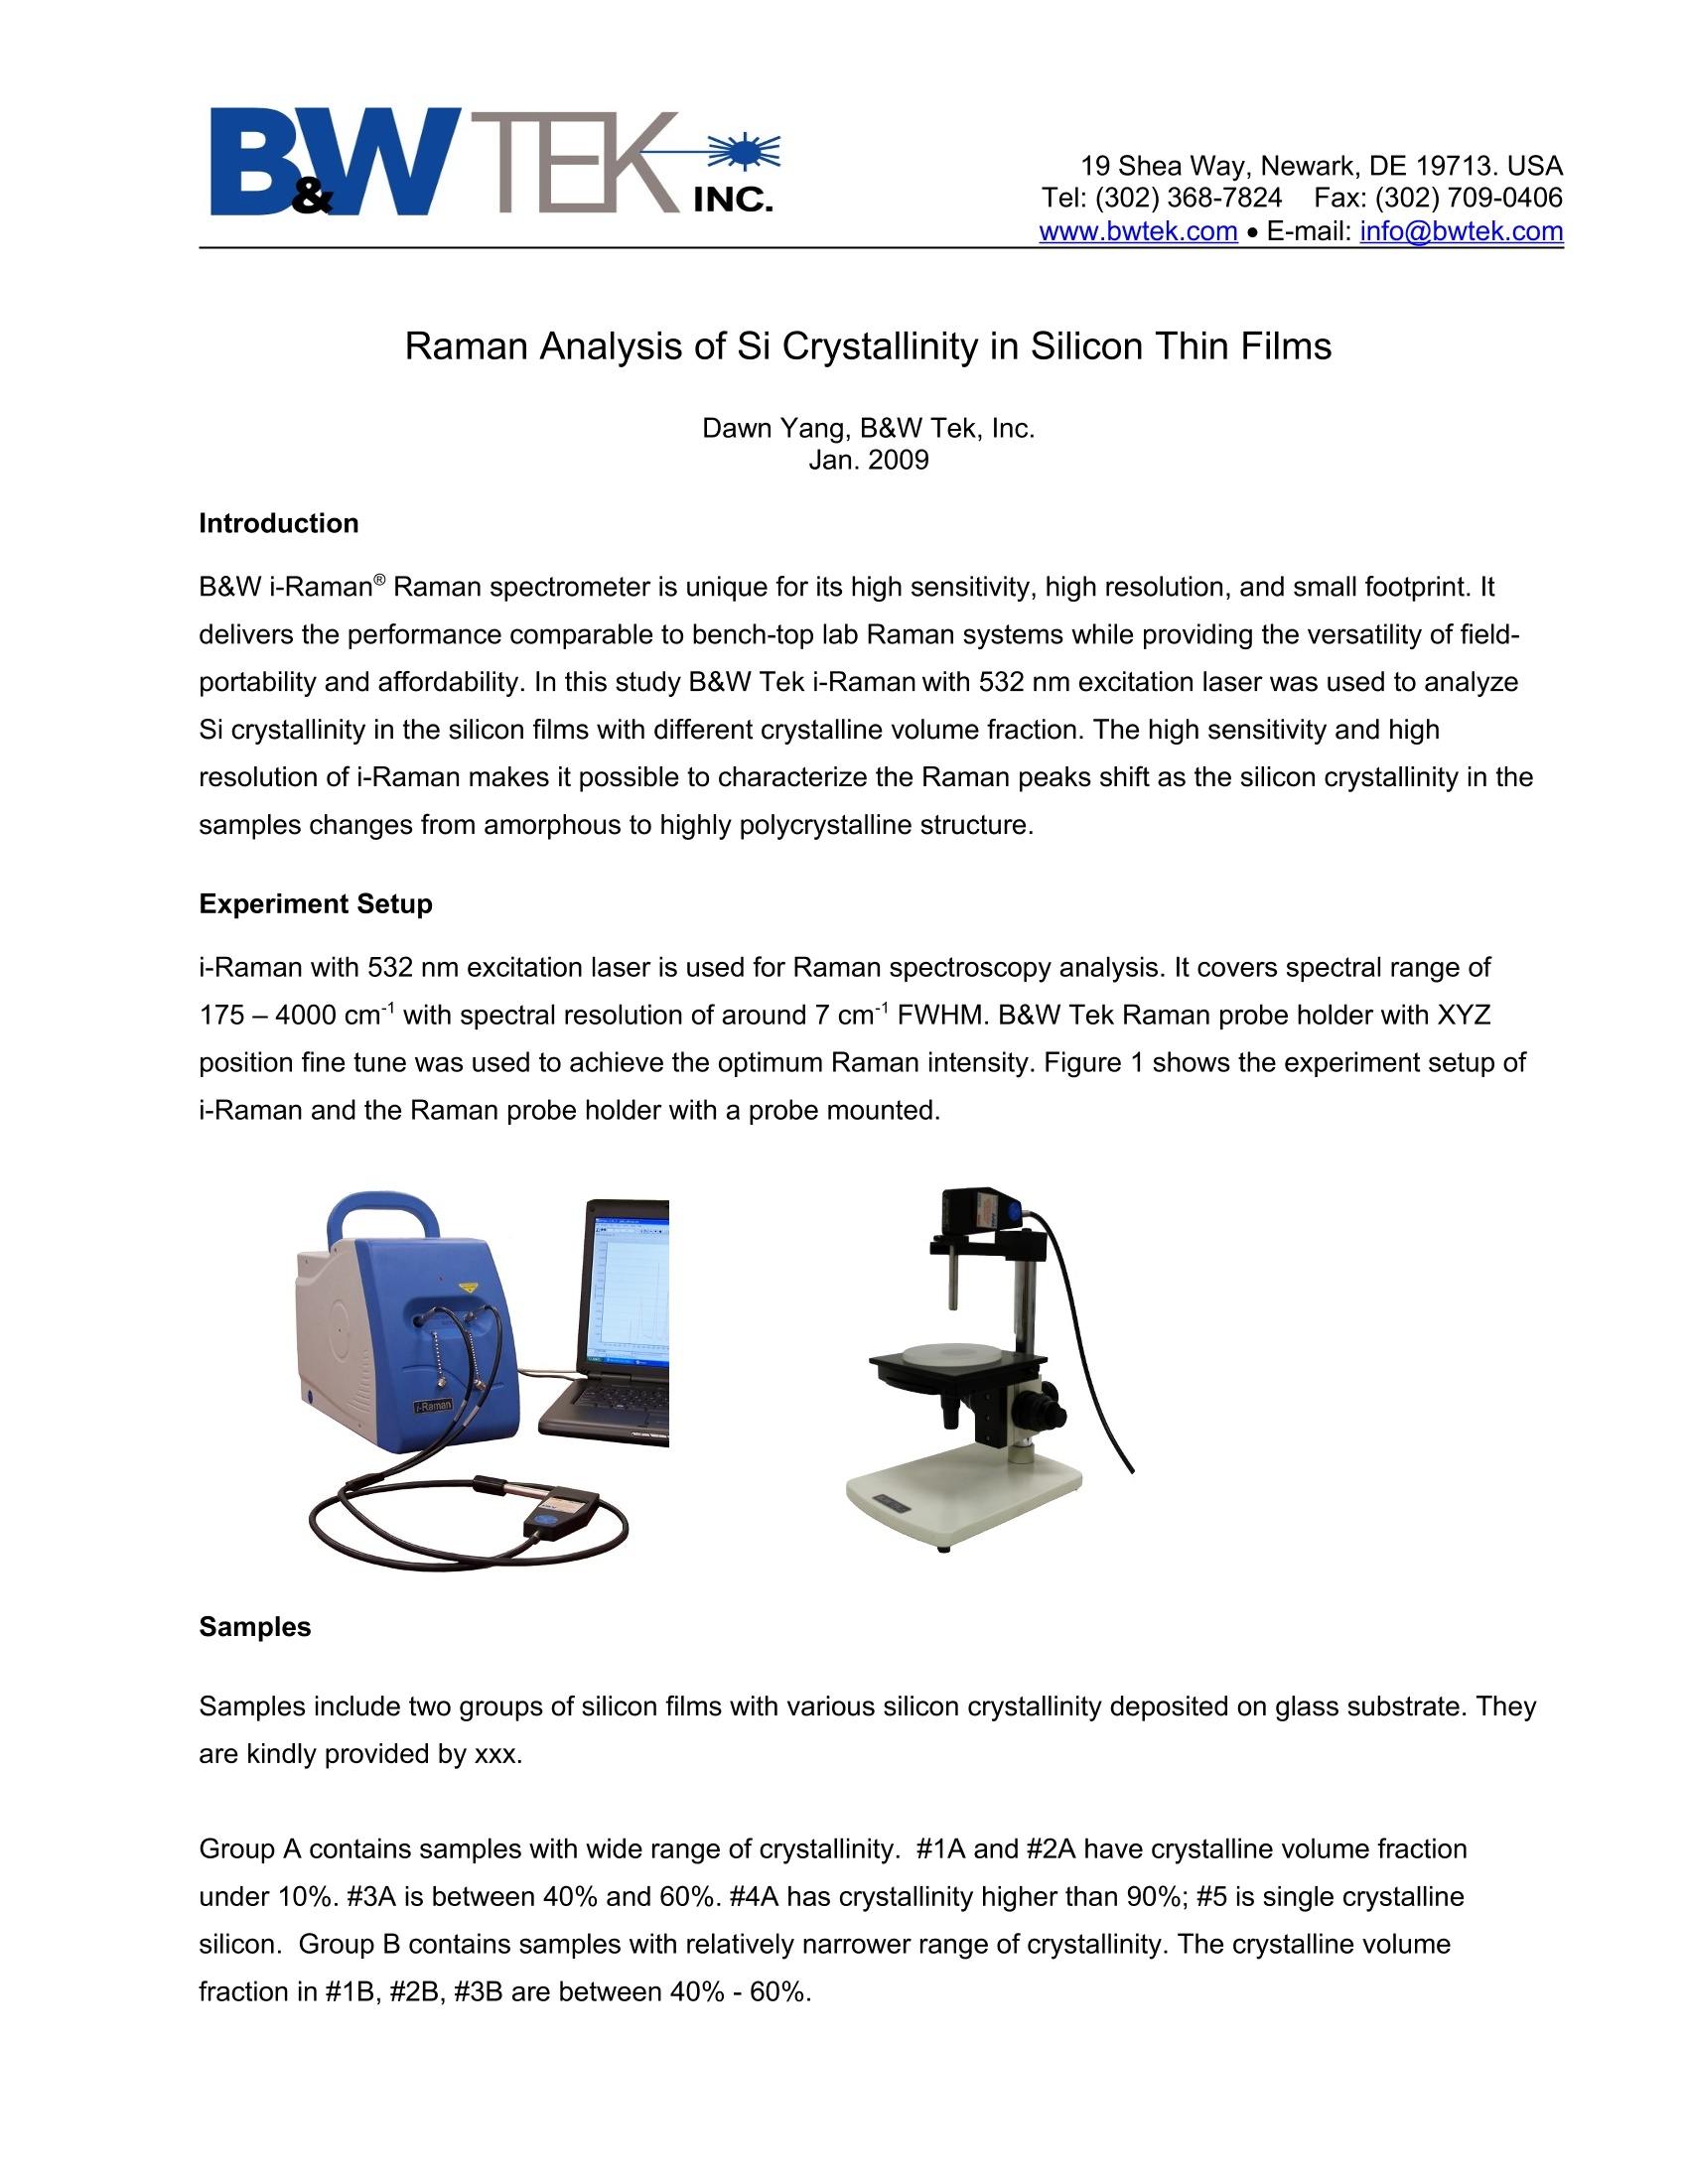
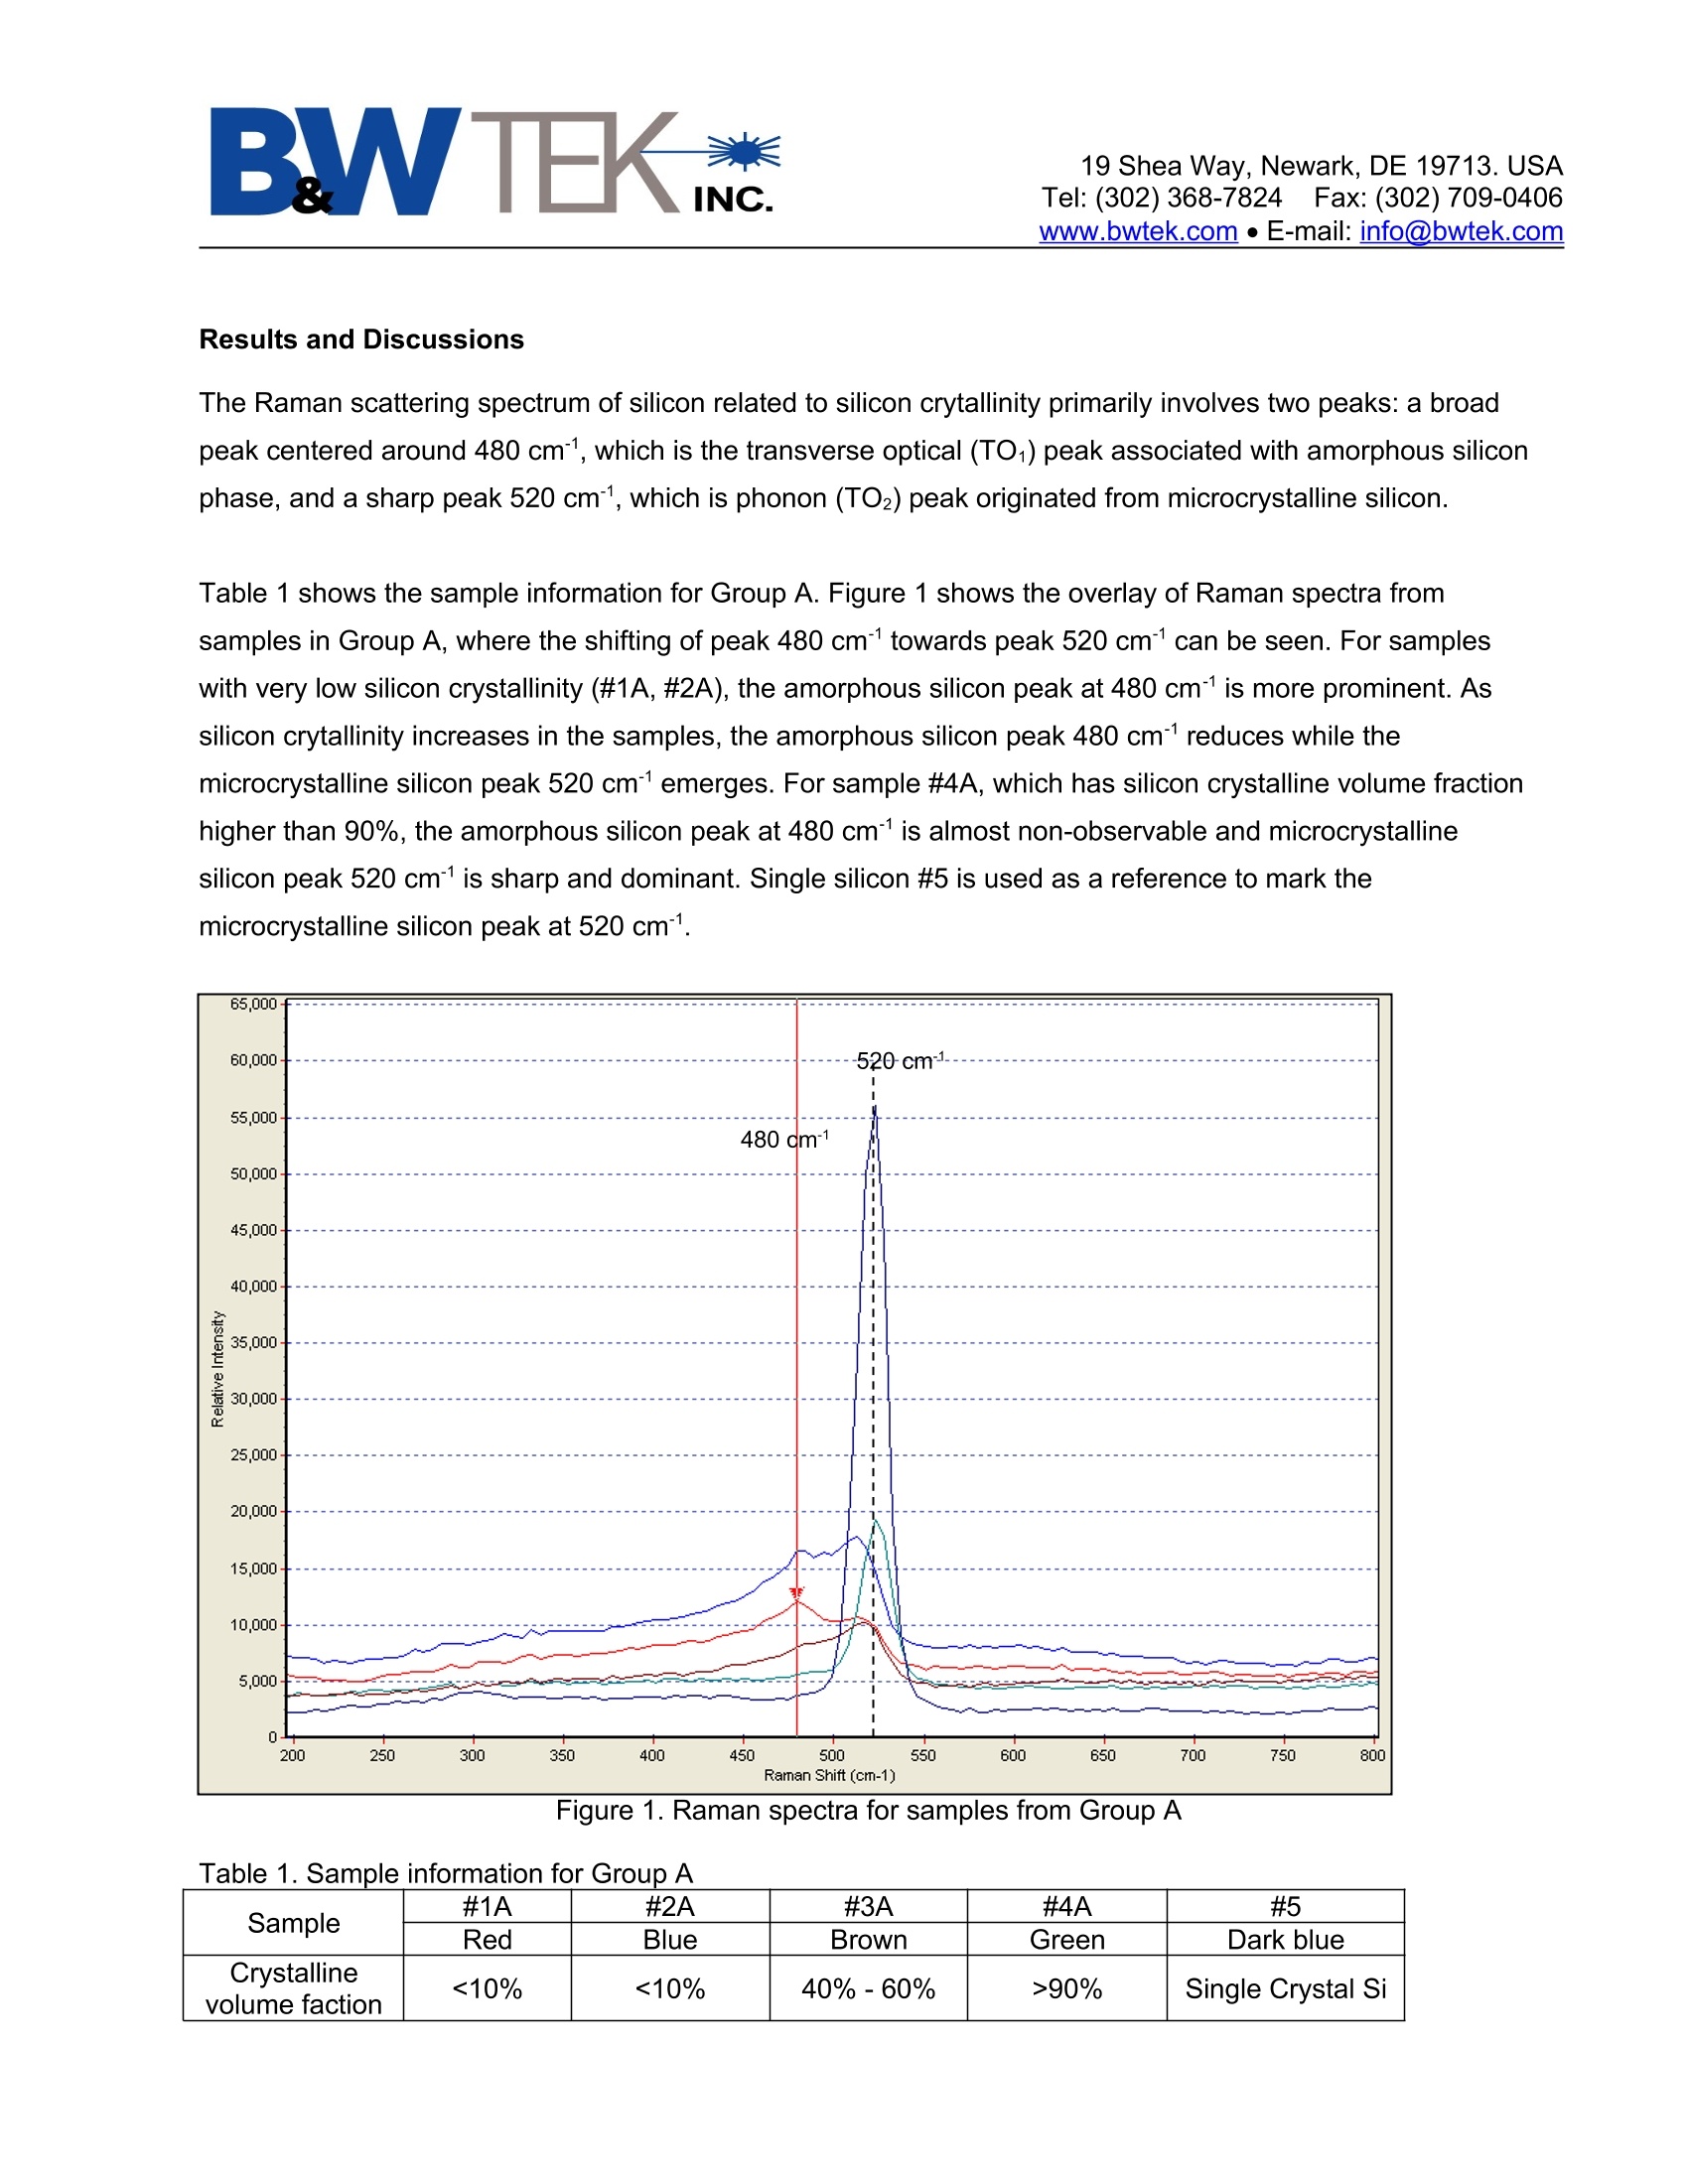
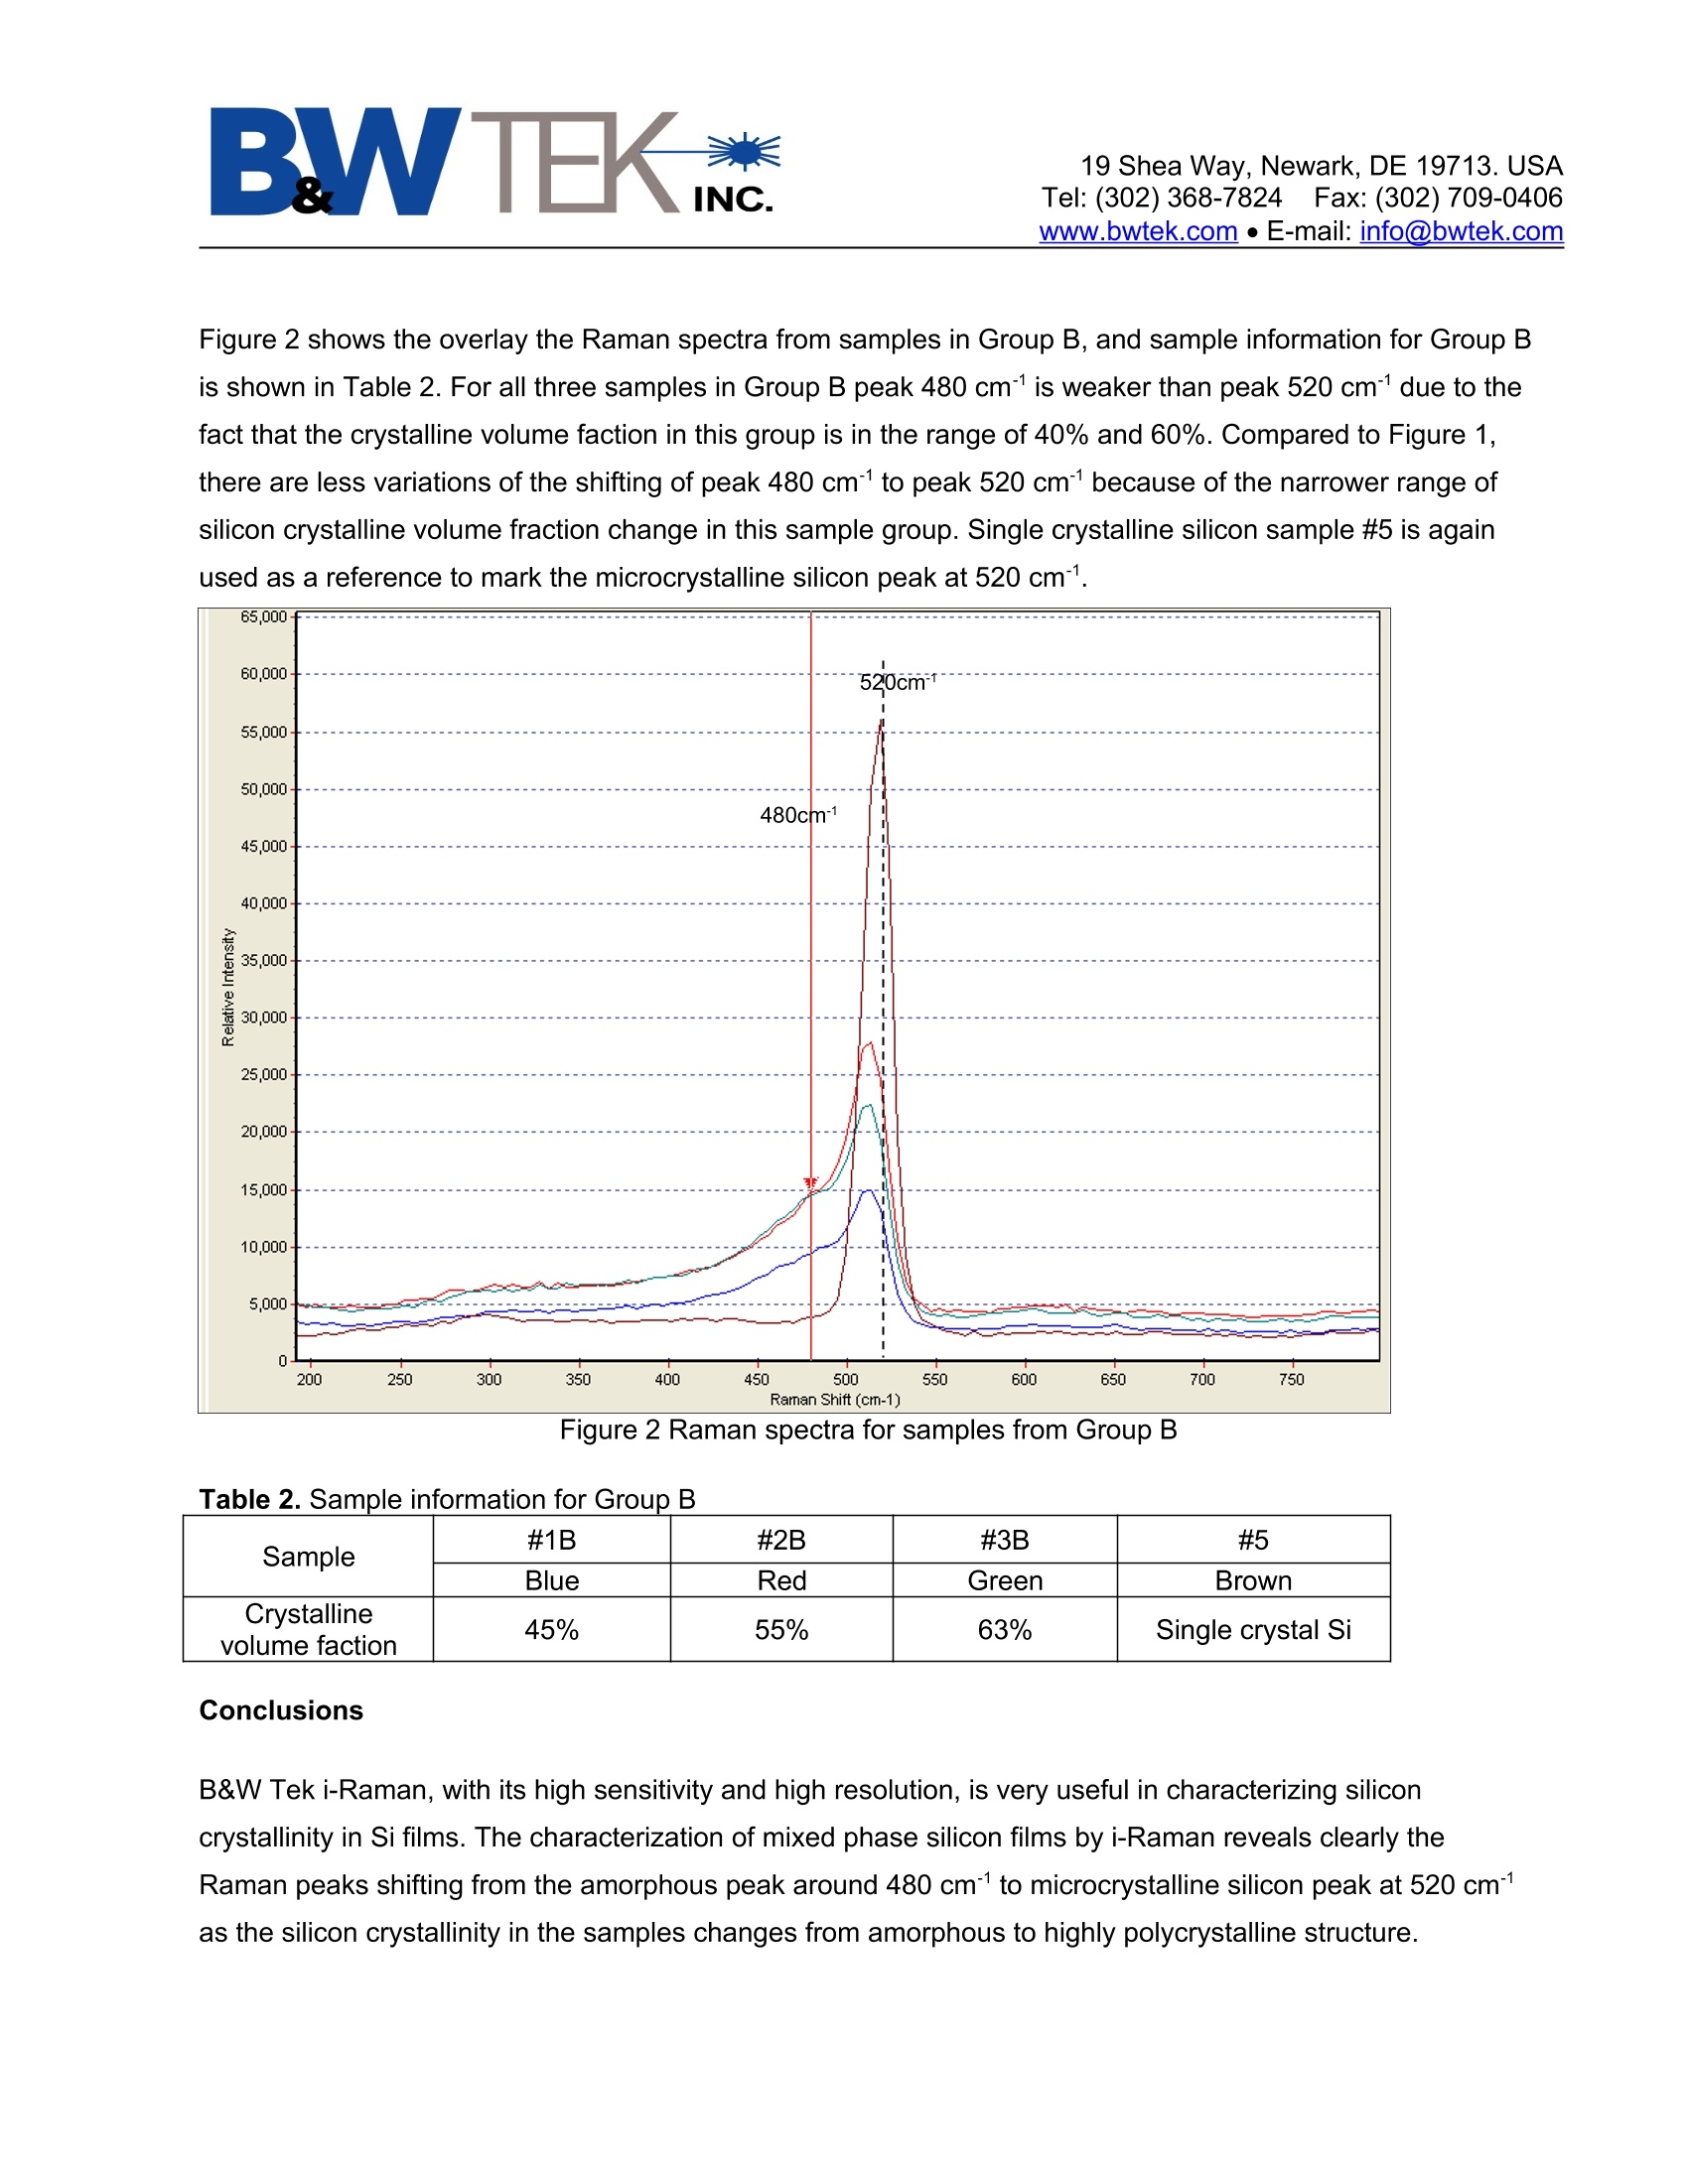
PAGE Raman Analysis of Si Crystallinity in Silicon Thin Films Dawn Yang, B&W Tek, Inc. Jan. 2009 Introduction B&W i-Raman® Raman spectrometer is unique for its high sensitivity, high resolution, and small footprint. It delivers the performance comparable to bench-top lab Raman systems while providing the versatility of field-portability and affordability. In this study B&W Tek i-Raman with 532 nm excitation laser was used to analyze Si crystallinity in the silicon films with different crystalline volume fraction. The high sensitivity and high resolution of i-Raman makes it possible to characterize the Raman peaks shift as the silicon crystallinity in the samples changes from amorphous to highly polycrystalline structure. Experiment Setup i-Raman with 532 nm excitation laser is used for Raman spectroscopy analysis. It covers spectral range of 175 – 4000 cm-1 with spectral resolution of around 7 cm-1 FWHM. B&W Tek Raman probe holder with XYZ position fine tune was used to achieve the optimum Raman intensity. Figure 1 shows the experiment setup of i-Raman and the Raman probe holder with a probe mounted. Samples Samples include two groups of silicon films with various silicon crystallinity deposited on glass substrate. They are kindly provided by xxx. Group A contains samples with wide range of crystallinity. #1A and #2A have crystalline volume fraction under 10%. #3A is between 40% and 60%. #4A has crystallinity higher than 90%; #5 is single crystalline silicon. Group B contains samples with relatively narrower range of crystallinity. The crystalline volume fraction in #1B, #2B, #3B are between 40% - 60%. Results and Discussions The Raman scattering spectrum of silicon related to silicon crytallinity primarily involves two peaks: a broad peak centered around 480 cm-1, which is the transverse optical (TO1) peak associated with amorphous silicon phase, and a sharp peak 520 cm-1, which is phonon (TO2) peak originated from microcrystalline silicon. Table 1 shows the sample information for Group A. Figure 1 shows the overlay of Raman spectra from samples in Group A, where the shifting of peak 480 cm-1 towards peak 520 cm-1 can be seen. For samples with very low silicon crystallinity (#1A, #2A), the amorphous silicon peak at 480 cm-1 is more prominent. As silicon crytallinity increases in the samples, the amorphous silicon peak 480 cm-1 reduces while the microcrystalline silicon peak 520 cm-1 emerges. For sample #4A, which has silicon crystalline volume fraction higher than 90%, the amorphous silicon peak at 480 cm-1 is almost non-observable and microcrystalline silicon peak 520 cm-1 is sharp and dominant. Single silicon #5 is used as a reference to mark the microcrystalline silicon peak at 520 cm-1. Figure 1. Raman spectra for samples from Group A Table 1. Sample information for Group A Sample #1A #2A #3A #4A #5 Red Blue Brown Green Dark blue Crystalline volume faction <10% <10% 40% - 60% >90% Single Crystal Si Figure 2 shows the overlay the Raman spectra from samples in Group B, and sample information for Group B is shown in Table 2. For all three samples in Group B peak 480 cm-1 is weaker than peak 520 cm-1 due to the fact that the crystalline volume faction in this group is in the range of 40% and 60%. Compared to Figure 1, there are less variations of the shifting of peak 480 cm-1 to peak 520 cm-1 because of the narrower range of silicon crystalline volume fraction change in this sample group. Single crystalline silicon sample #5 is again used as a reference to mark the microcrystalline silicon peak at 520 cm-1. Figure 2 Raman spectra for samples from Group B Table 2. Sample information for Group B Sample #1B #2B #3B #5 Blue Red Green Brown Crystalline volume faction 45% 55% 63% Single crystal Si Conclusions B&W Tek i-Raman, with its high sensitivity and high resolution, is very useful in characterizing silicon crystallinity in Si films. The characterization of mixed phase silicon films by i-Raman reveals clearly the Raman peaks shifting from the amorphous peak around 480 cm-1 to microcrystalline silicon peak at 520 cm-1 as the silicon crystallinity in the samples changes from amorphous to highly polycrystalline structure. 480 cm-1 520 cm-1 480cm-1 520cm-1
确定
还剩1页未读,是否继续阅读?

产品配置单
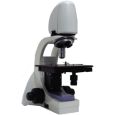
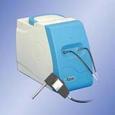
必达泰克光电设备(上海)有限公司为您提供《硅薄膜中晶化率的拉曼检测方案(激光拉曼光谱)》,该方案主要用于其他中晶化率的拉曼检测,参考标准--,《硅薄膜中晶化率的拉曼检测方案(激光拉曼光谱)》用到的仪器有可视化显微拉曼检测平台、iRaman小型拉曼光谱仪
推荐专场


相关方案
更多