


方案详情
文
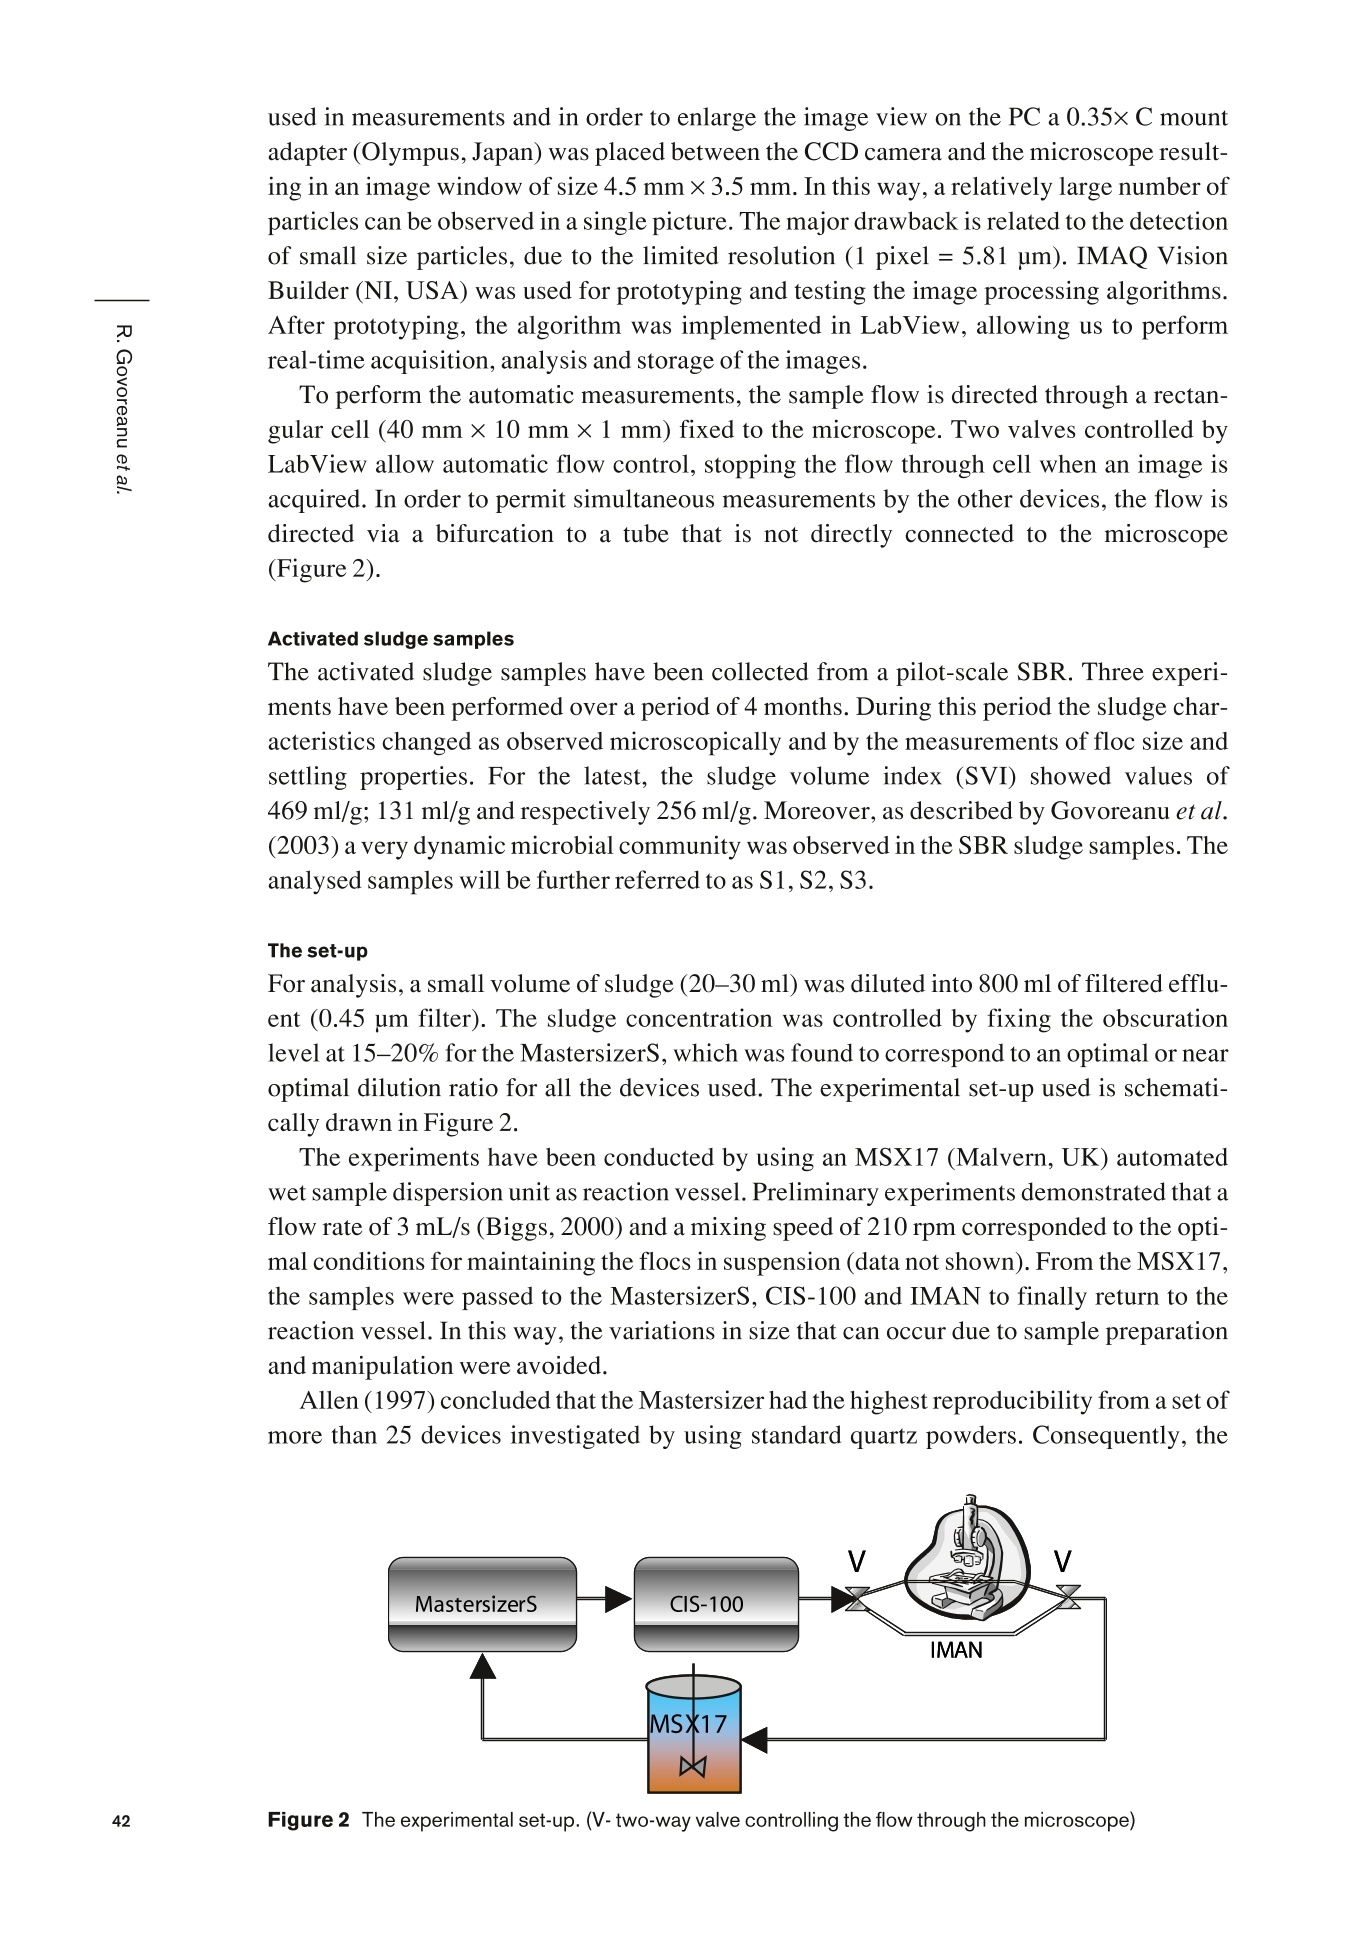
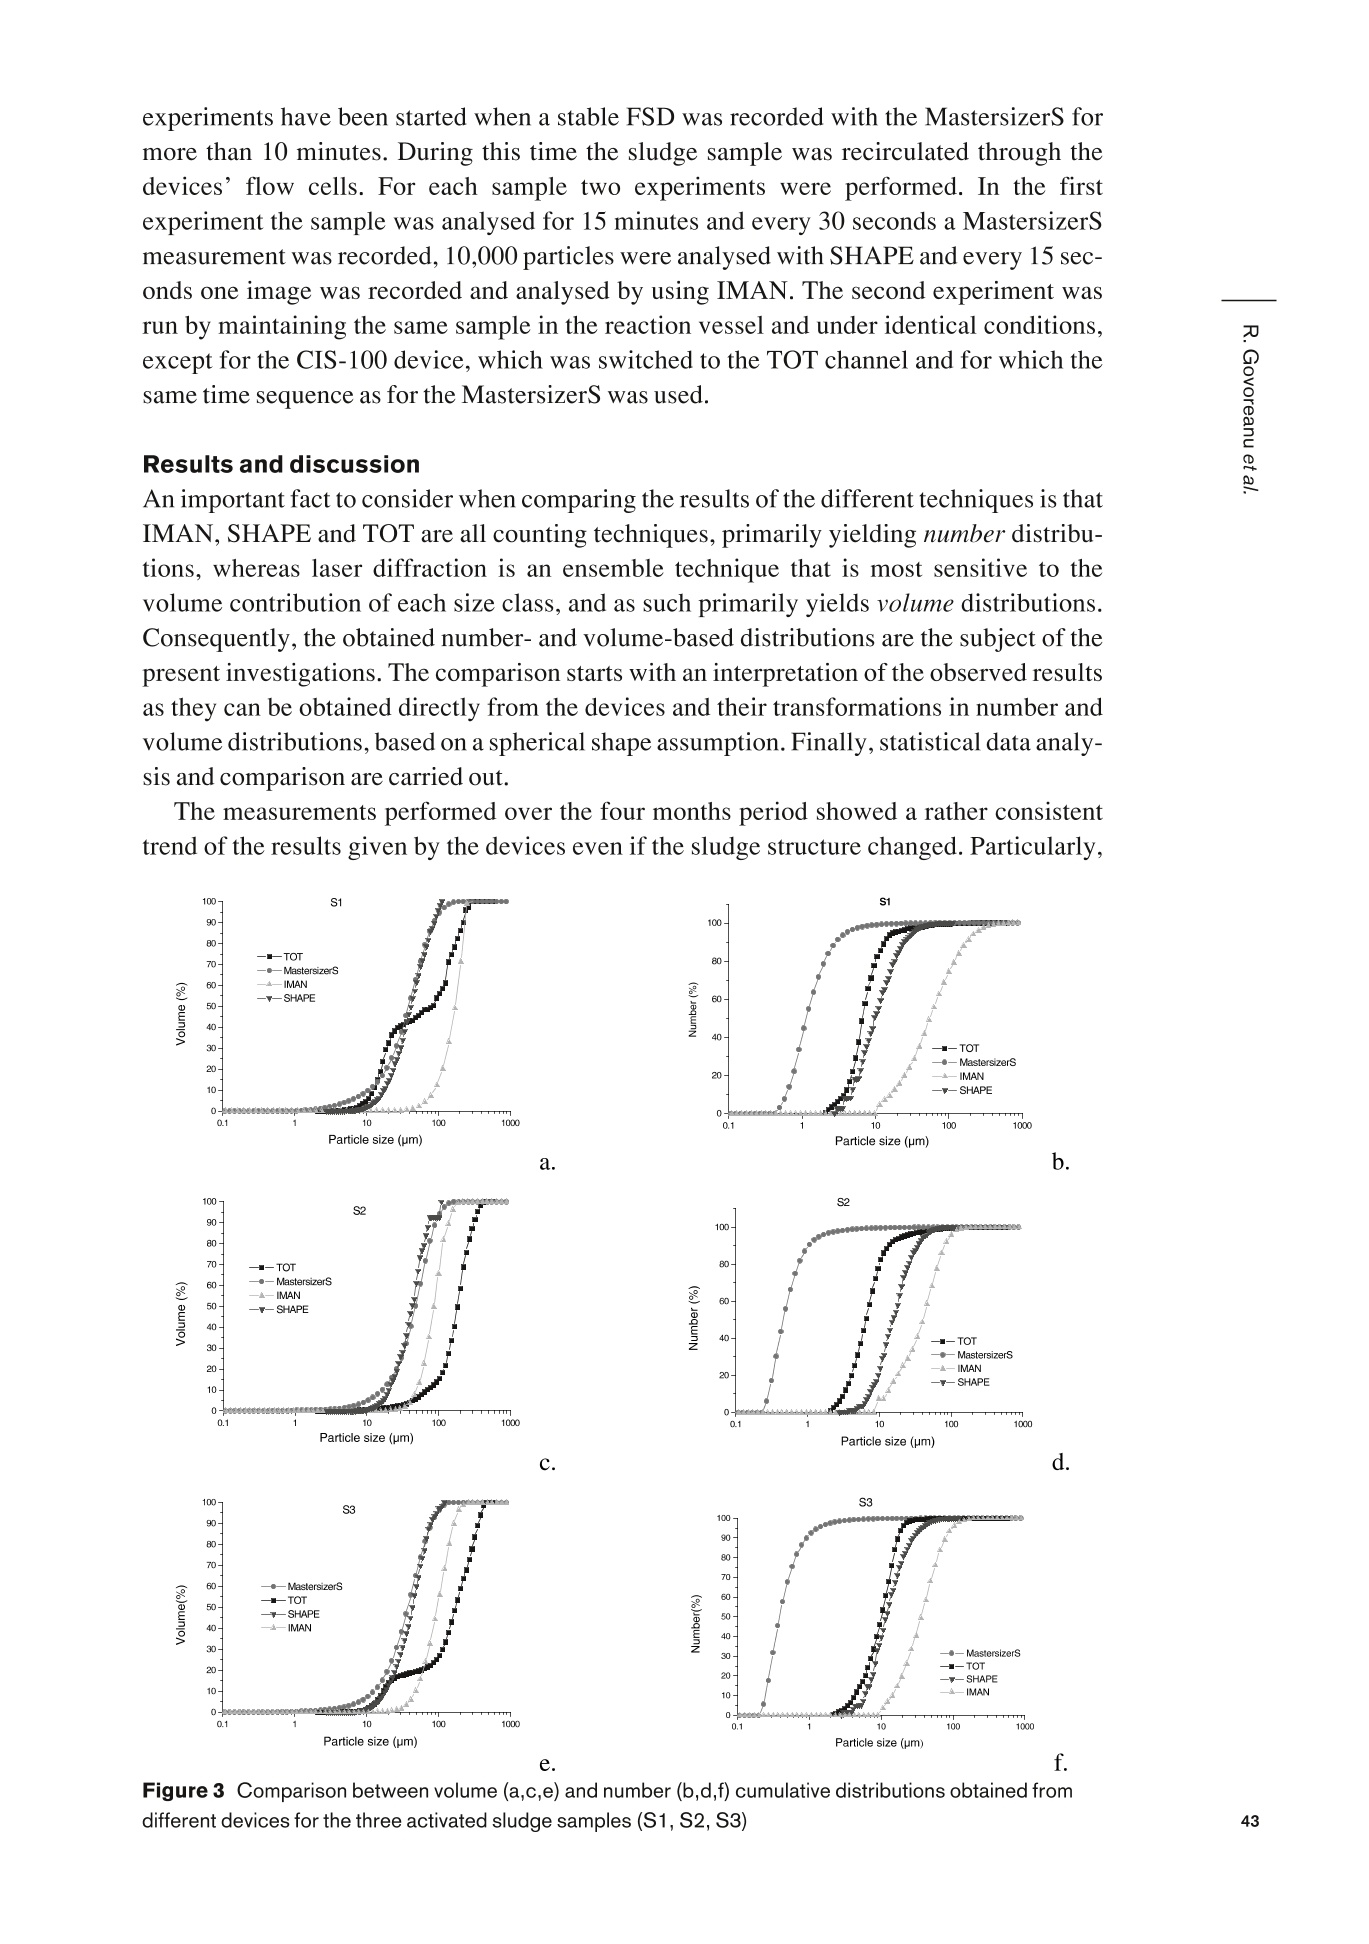
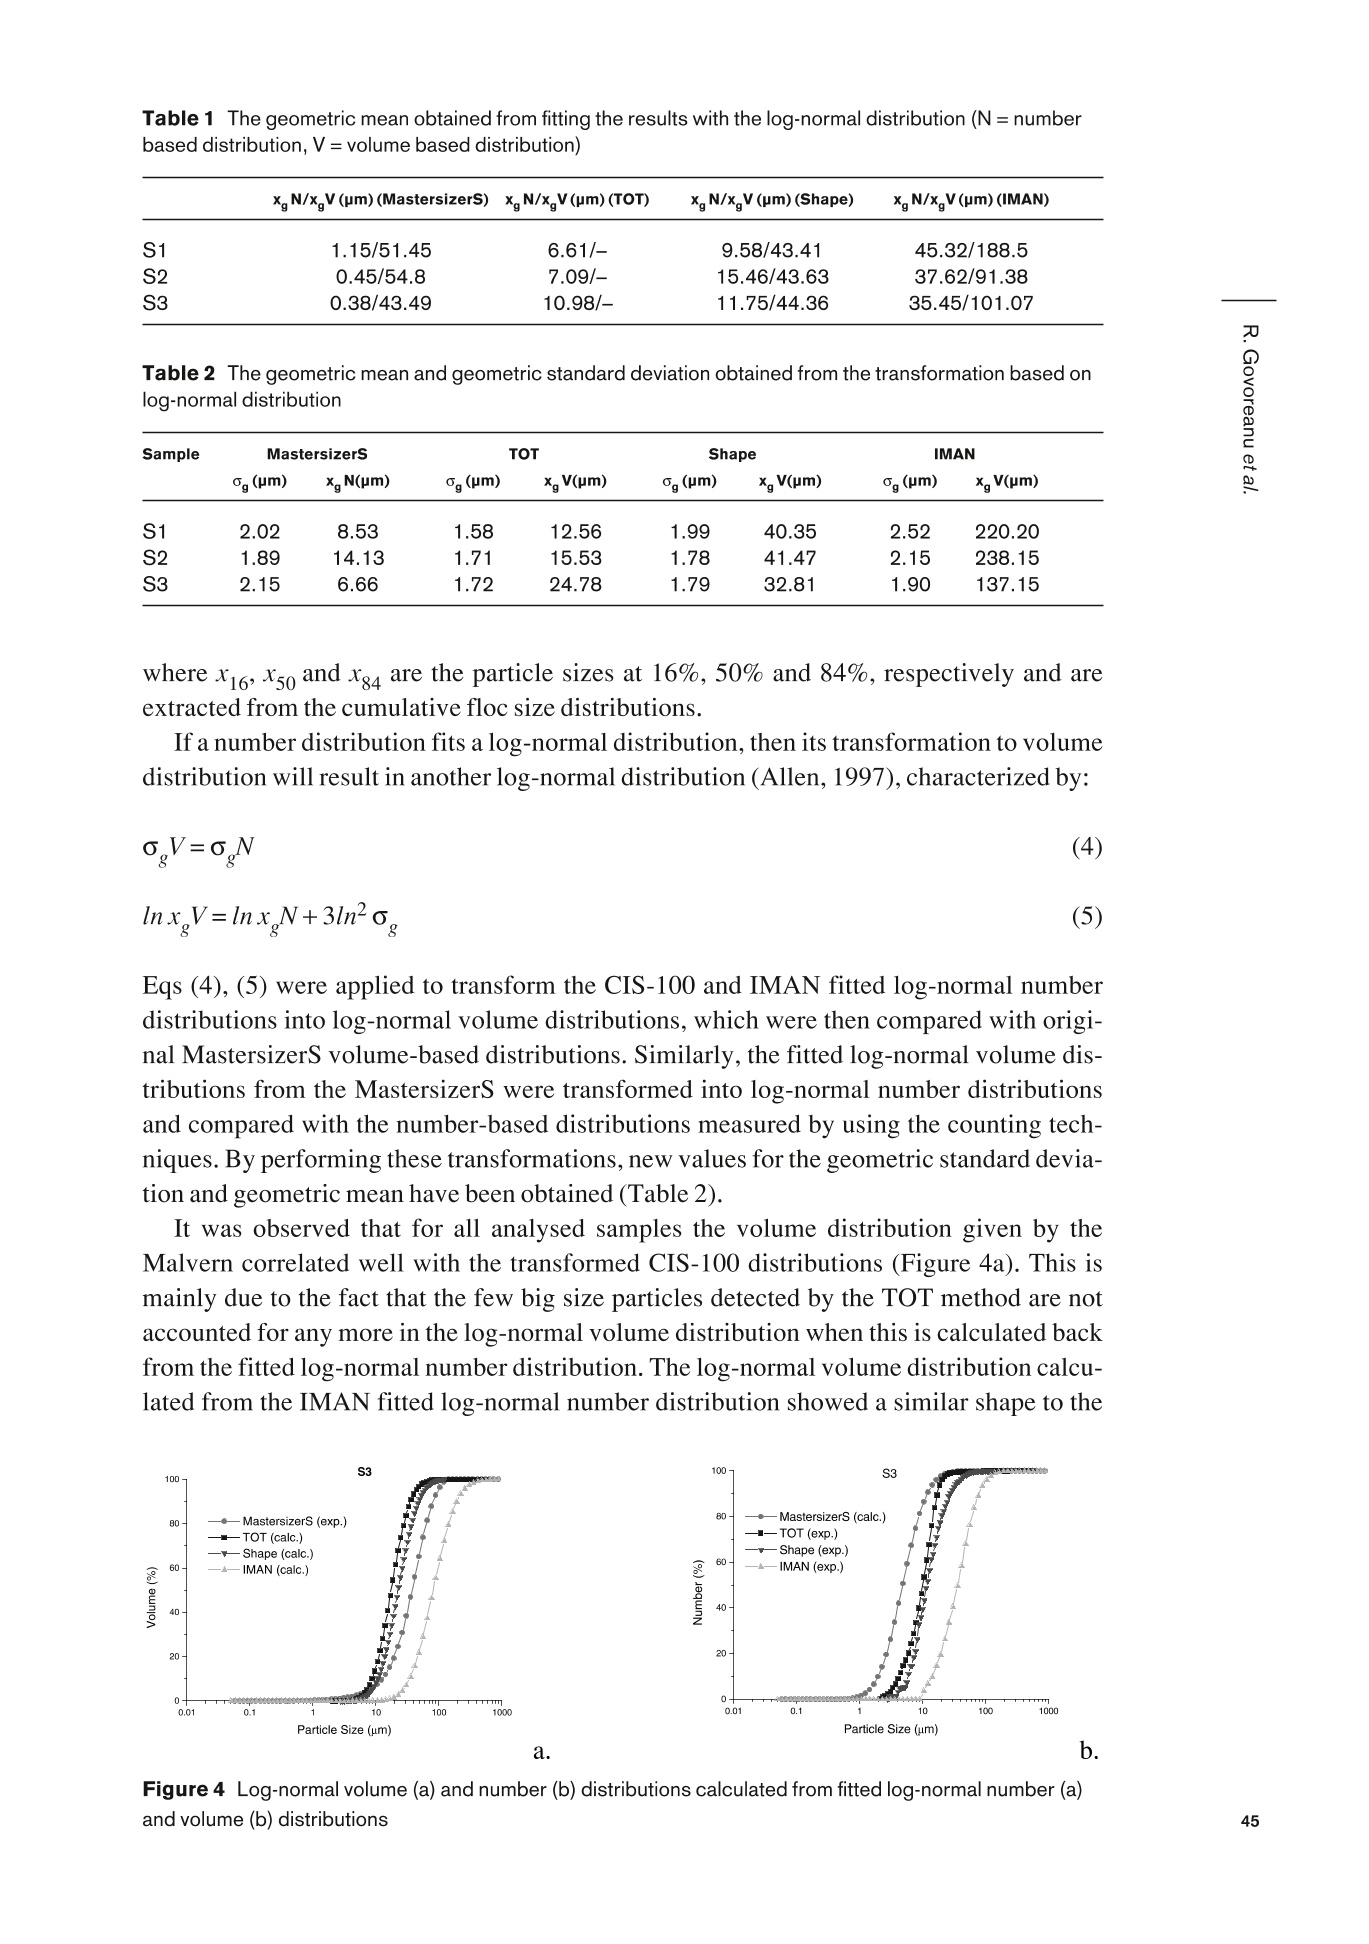
用不同技术同时测量活性污泥絮凝的粒径分布
Simultaneous determination of activated sludge floc size distribution by different techniques.
方案详情

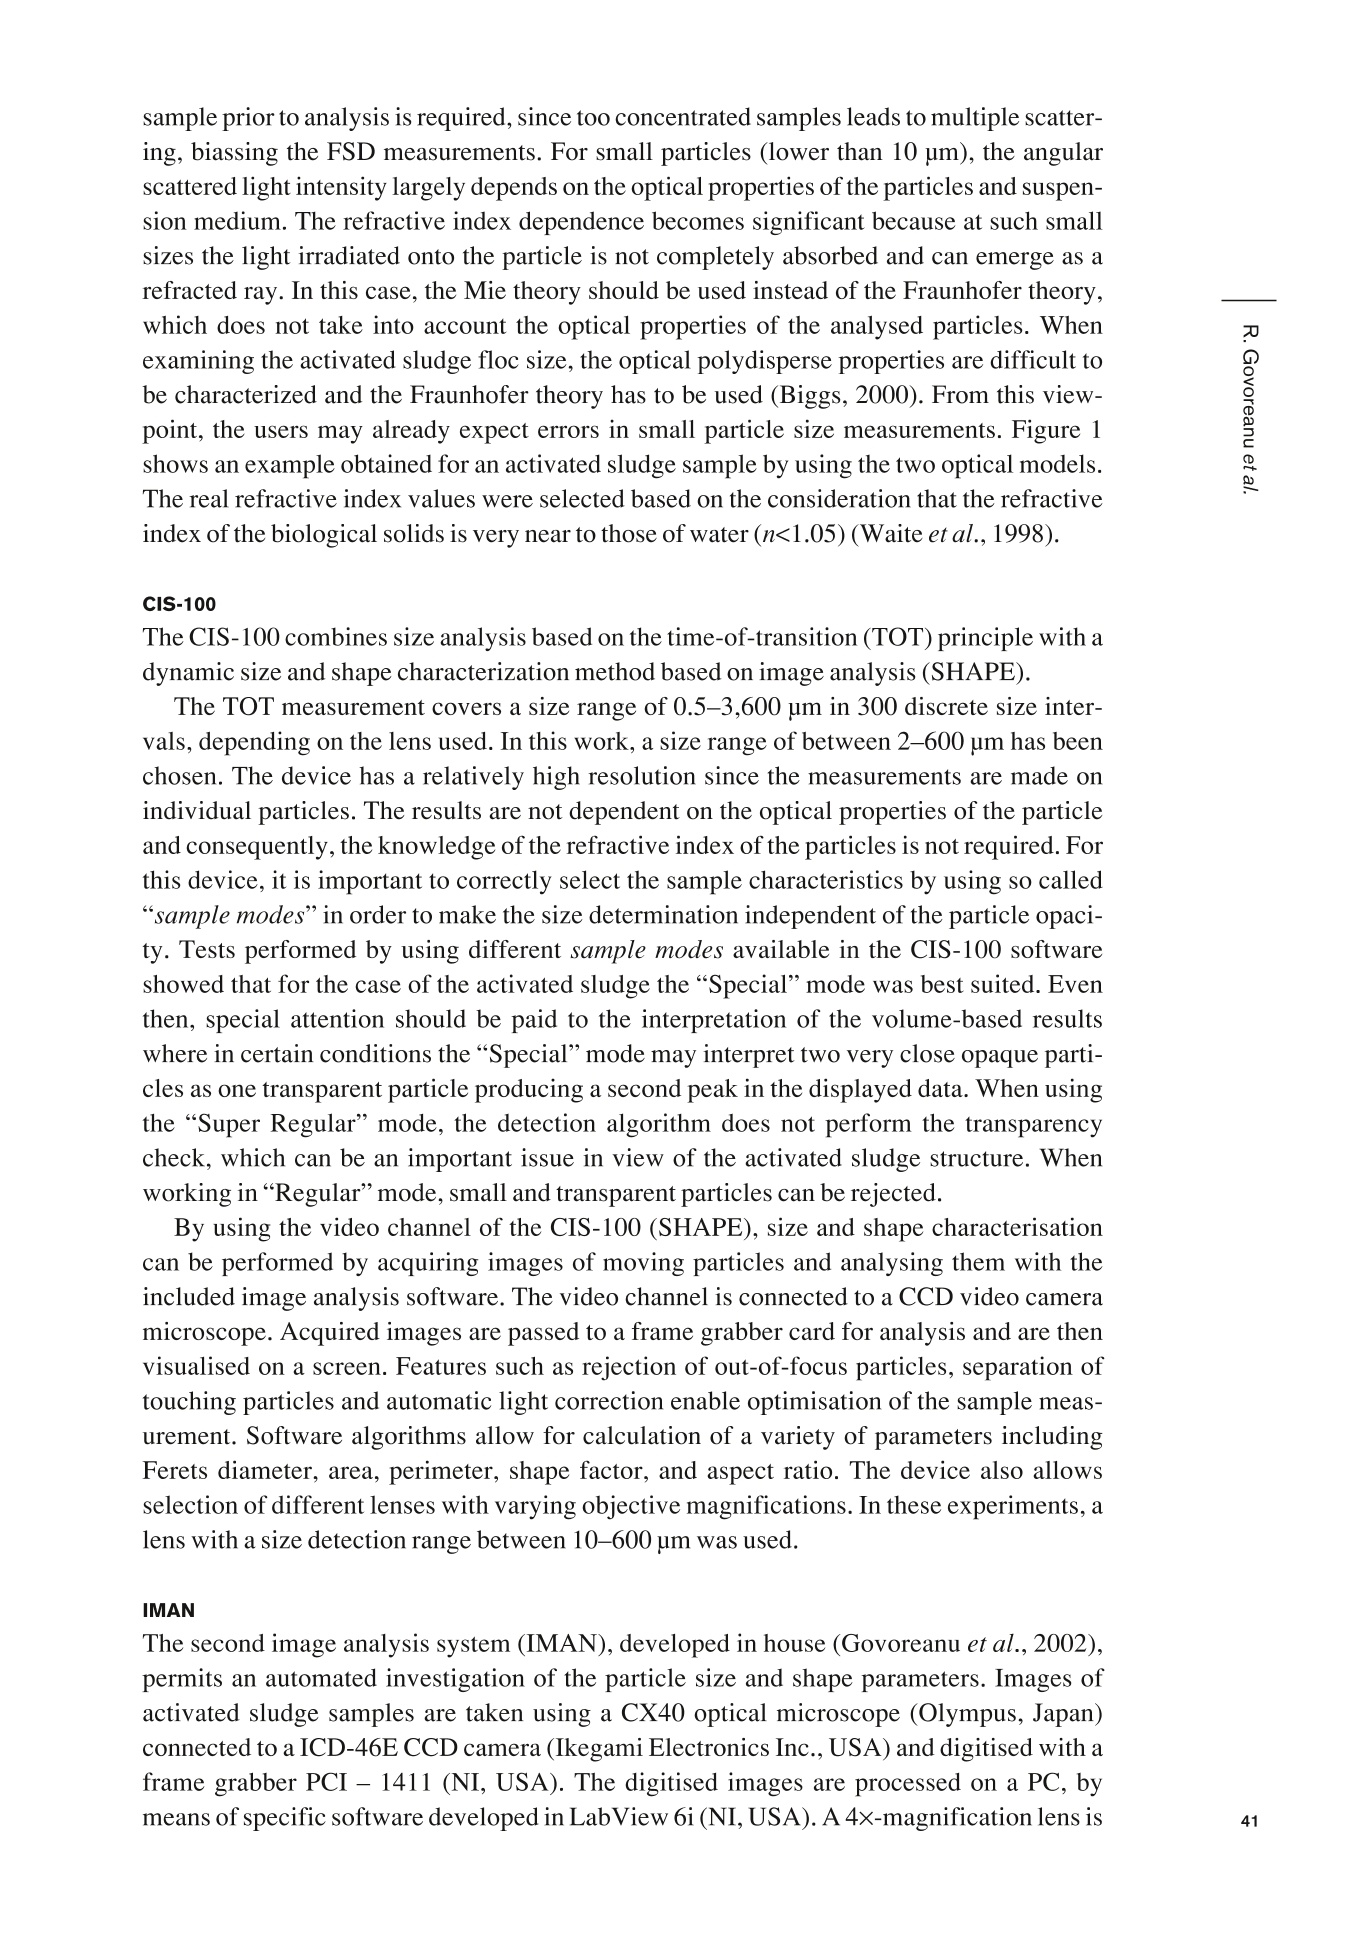
Simultaneous determination of activated sludge floc sizedistribution by different techniques R. Govoreanu*, H. Saveyn**,P. Van der Meeren** and P.A. Vanrolleghem* *BIOMATH,Dept. Applied Mathematics, Biometrics and Process Control, Ghent University, Coupure Links653, B-9000 Ghent, Belgium (E-mail: ruxandra@biomath.UGent.be)** PAINT, Particle and Interfacial Technology Group, Ghent University, Coupure Links 653, B-9000 Ghent,Belgium Abstract The activated sludge floc size distribution (FSD) is investigated by using different techniques andthe results are compared against each other in order to gain insight into the FSD characteristics, as well as todetect the limitations of each measurement technique. The experimental set-up consisted of three devicescoupled in series: a MastersizerS, an automated image analysis system (IMAN) and a CIS-100. The latterinstrument has two measurement channels,based on time of transition (TOT), and image analysis (SHAPE)principles. In order to minimise the variability between successive measurements, the activated sludgesamples collected from a pilot-scale SBR were flocculated until steady state was achieved. The results showthat the MastersizerS and SHAPE devices yield similar volume weighted FSD. In contrast, the IMANoverestimated the floc size and TOT frequently showed a bimodal distribution. The number distributions fromTOT and SHAPE were in agreement, while those generated by the MastersizerS were mainly located in thesubmicron range and those of IMAN corresponded to larger sizes. The experimental distributions show agood fit to the log-normal model. It is shown that the measurement principle is of utmost importance andresults transformation may lead to data misinterpretation. Keywords Activated sludge; floc size distribution; measurement techniques; particle sizing Introduction In the activated sludge process, the separation of the bioflocs from the purified effluent isinfluenced by the activated sludge structural properties. Detailed knowledge of floc sizeand size distribution is required for more effective control of process performance.Activated sludge flocs represent a heterogeneous mixture of different micro-organisms,dead cells, particulate organic and inorganic material, and extracellular polymeric sub-stances (EPS) with a variety of different sizes, pore spaces and water channels. The mor-phology of the floc cross section and floc structure profiles are often described to beself-similar, suggesting that the floc can be characterized by fractal concepts (Li andGanczarczyk,1990). Various methods have been established to measure the size of activated sludge flocs.The most commonly used approach is microscopy (Barbusinski and Koscielniak, 1995). Itrepresents an excellent technique for directly examining the flocs. However, for manualmicroscopy, elaborate sample preparation is necessary and only a few particles can beexamined. More recently, by connecting the microscope to automated image analysis soft-ware, a faster evaluation of activated sludge floc properties became possible (Grijspeerdtand Verstraete, 1997). Another technique used for characterising the activated sludge flocsize and size distribution is the Coulter Counter (Andreadakis, 1993). This techniquerequires sample suspension in an electrolyte, which can create structural disturbance onbiological flocs or might cause clogging of the aperture during the measurement of thelarge size particles. Due to these limitations, the Coulter technique is preferred only forsmall particles size and in stable environments (Li and Ganczarczyk, 1991).Hiligardt andHoffmann (1997) used a CIS I device for floc size characterisation. A CCD TV microscope incorporated into the basic unit allowed them to observe the settling properties and flocshape, which together with size measurements helped to optimise the solid flux in a second-ary clarifier. A laser light diffraction technique was used for on-line determination of the changes infloc structure such as fractal dimension (Waite et al., 1998) or direct size distribution(Biggs, 2000). This method represents a fast and reliable technique for determining the sizeof flocs, which cover a relatively wide floc size range. It was demonstrated that the laserdiffraction technique is able to follow the flocculation dynamics and the data can be usedfor modelling the activated sludge flocculation/deflocculation process by using a popula-tion balance approach (Biggs, 2000; Nopens et al., 2002). Furthermore, a focus beamreflectance method (FBRM) was successfully used to measure in-situ the floc size distribu-tion in a secondary clarifier of a wastewater treatment plant (De Clercq et al., 2002). Theauthors demonstrated the devices’applicability for a wide range of solids concentrations,which actually represents the major drawback of all other alternative sizing devices. The floc size and size distribution have been often reported in literature as outcomes of aparticular measurement technique and less importance has been given to the influence ofthe measurement technique on the results. Since operation of various devices is based on abroad range of measurement principles, it is expected that different results are obtained.Moreover, for the case of activated sludge, due to the biological fragile and irregular struc-ture of the flocs, the results may often lead to a misinterpretation of the data. Therefore, inthis paper, a systematic investigation of the activated sludge FSD obtained from severalinstruments with different working principles is performed. The results are compared andthe performance of each technique is critically assessed. Methods and practical considerations of sizing devices Three devices were coupled inseries: aMastersizerS (Malvern,UK), a CIS-100(Ankersmid, Belgium) and an automated image analysis system (IMAN) based onLabView software (NI, USA). These devices have been selected based on their differentmeasurement principles, flow-through capabilities and because of the highly similar sam-ple dilution requirements in sample preparation. MastersizerS The MastersizerS is a particle size analyser based on low-angle laser light scattering(LALLS). A 300RF lens was used in experiments corresponding to a particle size range of0.05-900 um. The MastersizerS software generates a volume-weighted FSD. Dilution of the Figure 1 Comparison of the Fraunhofer and Mie theories for different real and imaginary refractive index(n+in’-where n is real refractive index and n'the imaginary refractive index) sample prior to analysis is required, since too concentrated samples leads to multiple scatter-ing, biassing the FSD measurements. For small particles (lower than 10 um), the angularscattered light intensity largely depends on the optical properties of the particles and suspen-sion medium. The refractive index dependence becomes significant because at such smallsizes the light irradiated onto the particle is not completely absorbed and can emerge as arefracted ray. In this case, the Mie theory should be used instead of the Fraunhofer theory,which does not take into account the optical properties of the analysed particles. Whenexamining the activated sludge floc size, the optical polydisperse properties are difficult tobe characterized and the Fraunhofer theory has to be used (Biggs,2000). From this view-point, the users may already expect errors in small particle size measurements. Figure 1shows an example obtained for an activated sludge sample by using the two optical models.The real refractive index values were selected based on the consideration that the refractiveindex of the biological solids is very near to those of water (n<1.05) (Waiteet al.,1998). CIS-100 The CIS-100 combines size analysis based on the time-of-transition (TOT) principle with adynamic size and shape characterization method based on image analysis (SHAPE). The TOT measurement covers a size range of 0.5-3,600 um in 300 discrete size inter-vals, depending on the lens used. In this work, a size range of between 2-600 um has beenchosen. The device has a relatively high resolution since the measurements are made onindividual particles. The results are not dependent on the optical properties of the particleand consequently, the knowledge of the refractive index of the particles is not required. Forthis device, it is important to correctly select the sample characteristics by using so called“sample modes”in order to make the size determination independent of the particle opaci-ty. Tests performed by using different sample modes available in the CIS-100 softwareshowed that for the case of the activated sludge the “Special"mode was best suited. Eventhen, special attention should be paid to the interpretation of the volume-based resultswhere in certain conditions the “Special"mode may interpret two very close opaque parti-cles as one transparent particle producing a second peak in the displayed data. When usingthe “Super Regular”mode, the detection algorithm does not perform the transparencycheck, which can be an important issue in view of the activated sludge structure. Whenworking in“Regular”mode, small and transparent particles can be rejected. By using the video channel of the CIS-100 (SHAPE), size and shape characterisationcan be performed by acquiring images of moving particles and analysing them with theincluded image analysis software. The video channel is connected to a CCD video cameramicroscope. Acquired images are passed to a frame grabber card for analysis and are thenvisualised on a screen. Features such as rejection of out-of-focus particles, separation oftouching particles and automatic light correction enable optimisation of the sample meas-urement. Software algorithms allow for calculation of a variety of parameters includingFerets diameter, area, perimeter, shape factor, and aspect ratio. The device also allowsselection of different lenses with varying objective magnifications. In these experiments, alens with a size detection range between 10-600 um was used. IMAN The second image analysis system (IMAN), developed in house (Govoreanu et al., 2002),permits an automated investigation of the particle size and shape parameters. Images ofactivated sludge samples are taken using a CX40 optical microscope (Olympus, Japan)connected to a ICD-46E CCD camera (Ikegami Electronics Inc., USA) and digitised with aframe grabber PCI - 1411 (NI, USA). The digitised images are processed on a PC, bymeans of specific software developed in LabView 6i (NI,USA). A 4x-magnification lens is used in measurements and in order to enlarge the image view on the PC a 0.35×C mountadapter (Olympus,Japan) was placed between the CCD camera and the microscope result-ing in an image window of size 4.5 mm×3.5 mm. In this way, a relatively large number ofparticles can be observed in a single picture. The major drawback is related to the detectionof small size particles, due to the limited resolution (1 pixel=5.81 um). IMAQ VisionBuilder (NI, USA) was used for prototyping and testing the image processing algorithms.After prototyping, the algorithm was implemented in LabView, allowing us to performreal-time acquisition, analysis and storage of the images. To perform the automatic measurements, the sample flow is directed through a rectan-gular cell (40 mm×10 mm ×1 mm) fixed to the microscope. Two valves controlled byLabView allow automatic flow control, stopping the flow through cell when an image isacquired. In order to permit simultaneous measurements by the other devices, the flow isdirected via a bifurcation to a tube that is not directly connected to the microscope(Figure2). Activated sludge samples The activated sludge samples have been collected from a pilot-scale SBR. Three experi-ments have been performed over a period of 4 months. During this period the sludge char-acteristics changed as observed microscopically and by the measurements of floc size andsettling properties. For the latest, the sludge volume index (SVI) showed values of469 ml/g; 131 ml/g and respectively 256 ml/g. Moreover, as described by Govoreanu et al.(2003) a very dynamic microbial community was observed in the SBR sludge samples. Theanalysed samples will be further referred to as S1, S2, S3. The set-up For analysis, a small volume of sludge (20-30 ml) was diluted into 800 ml of filtered efflu-ent (0.45 um filter). The sludge concentration was controlled by fixing the obscurationlevel at 15-20% for the MastersizerS, which was found to correspond to an optimal or nearoptimal dilution ratio for all the devices used. The experimental set-up used is schemati-cally drawn in Figure 2. The experiments have been conducted by using an MSX17 (Malvern, UK) automatedwet sample dispersion unit as reaction vessel. Preliminary experiments demonstrated that aflow rate of 3 mL/s (Biggs,2000) and a mixing speed of 210 rpm corresponded to the opti-mal conditions for maintaining the flocs in suspension (data not shown). From the MSX17,the samples were passed to the MastersizerS, CIS-100 and IMAN to finally return to thereaction vessel. In this way, the variations in size that can occur due to sample preparationand manipulation were avoided. Allen (1997) concluded that the Mastersizer had the highest reproducibility from a set ofmore than 25 devices investigated by using standard quartz powders. Consequently, the Figure 2 The experimental set-up.(V-two-way valve controlling the flow through the microscope) experiments have been started when a stable FSD was recorded with the MastersizerS formore than 10 minutes. During this time the sludge sample was recirculated through thedevices’flow cells. For each sample two experiments were performed. In the firstexperiment the sample was analysed for 15 minutes and every 30 seconds a MastersizerSmeasurement was recorded, 10,000 particles were analysed with SHAPE and every 15 sec-onds one image was recorded and analysed by using IMAN. The second experiment wasrun by maintaining the same sample in the reaction vessel and under identical conditions,except for the CIS-100 device, which was switched to the TOT channel and for which thesame time sequence as for the MastersizerS was used Results and discussion An important fact to consider when comparing the results of the different techniques is thatIMAN, SHAPE and TOT are all counting techniques, primarily yielding number distribu-tions, whereas laser diffraction is an ensemble technique that is most sensitive to thevolume contribution of each size class, and as such primarily yields volume distributions.Consequently, the obtained number- and volume-based distributions are the subject of thepresent investigations. The comparison starts with an interpretation of the observed resultsas they can be obtained directly from the devices and their transformations in number andvolume distributions,based on a spherical shape assumption. Finally, statistical data analy-.sis and comparison are carried out. The measurements performed over the four months period showed a rather consistenttrend of the results given by the devices even if the sludge structure changed. Particularly, b d. e. f. Figure 3 Comparison between volume (a,c,e) and number (b,d,f) cumulative distributions obtained fromdifferent devices for the three activated sludge samples (S1, S2,S3) the MastersizerS and SHAPE devices yielded similar volume FSD (Figure 3.a,c,e). IMANhad the tendency to overestimate the floc size, whereas TOT showed a bimodal distribu-tion. The latter may be due to the used measurement method, which, as discussed before,may consider two very close opaque particles as a bigger transparent one. By looking at thenumber distributions obtained from TOT measurements it was observed that only a fewparticles have been detected in that higher range (Figure 3.b,d,f) and the results were inagreement with those obtained from SHAPE measurements. The number distributions gen-erated by the MastersizerS were mainly located in the submicrometre region. These resultsare believed to be unrealistic and caused by the non-linear conversion from the excessivelybroadened volume-weighted distribution. This is a well known feature of all ensembletechniques. On the other hand, the distributions generated by IMAN were shifted towardslarger sizes, which can be explained by the limited size detection range of this method. Forthis reason, the IMAN technique is more suitable for analysing particles larger than 15-20um. In order to decrease the detection range a higher magnification lens should be used.However, this introduces a limitation in the measurement time, since the smaller imagewindow means that fewer particles are counted at a time and a longer time is needed toobtain a reliable statistical estimate of the distributionS. The activated sludge FSD is reported to be described well by a log-normal distribution (Liand Ganczarczyk, 1990). Accordingly, this model was selected in the present work to fit thedata. To allow for an easy comparison, the measured frequency distributions were first normal-ized. The log-normal distribution used for fitting the experimental distributions is given by: where:x is the particle size,f(x) is the probability density function,x, is the geometric meanof the distribution and ois the geometric standard deviation. Most of the experimental distributions fitted well to this log-normal distribution curve.However, aknown problem when fitting the log-normal distribution to the whole size rangeis that it is difficult to choose the minimum and maximum size limits (Allen, 1997).Consequently, fitting with a log-normal distribution will give good agreement with the realdata in the middle of the distribution, whilst it may fail at each of the tails. In addition, dueto the already existing differences between the size detection range of each device, fittingof the middle of the distribution is a good compromise for comparing the data. In mostcases, the distributions were monomodal, which allowed fitting them to log-normal curves.However, the relatively broadened distributions observed especially for the MastersizerSare an indication of a possible bimodal distribution originating from monomodal distribu-tions with largely overlapping tails. This fact also can be observed from the standard devia-tions obtained after fitting a log-normal distribution to the data. The geometric standarddeviations from fitting the IMAN, SHAPE and TOT data were mainly between 0.35 um and0.60 um, whereas those of the MastersizerS device were between 0.87 um and 1.29 um.Comparable geometric means have been obtained when fitting SHAPE and TOT numberdistributions and SHAPE, TOT and MastersizerS volume distributions (Table 1). Since the geometric mean and the median of a log-normal distribution coincide, the distribu-tion can be completely characterized by calculating its parameters according to Allen (1997): Table 1 The geometric mean obtained from fitting the results with the log-normal distribution (N = numberbased distribution,V=volume based distribution) XgN/x,V(um)(MastersizerS) xgN/xgV(pm)(TOT) XgN/xgV(pm)(Shape) xgN/xgV(um)(IMAN) S1 1.15/51.45 6.61/- 9.58/43.41 45.32/188.5 S2 0.45/54.8 7.09/- 15.46/43.63 37.62/91.38 S3 0.38/43.49 10.98/- 11.75/44.36 35.45/101.07 Table 2 The geometric mean and geometric standard deviation obtained from the transformation based onlog-normal distribution Sample MastersizerS TOT Shape IMAN og(um) xgN(pm) °g(um) xgV(pm) g(pm) xgV(pm) Cg(pm) xgV(pm) S1 2.02 8.53 1.58 12.56 1.99 40.35 2.52 220.20 S2 1.89 14.13 1.71 15.53 1.78 41.47 2.15 238.15 S3 2.15 6.66 1.72 24.78 1.79 32.81 1.90 137.15 where x16 ’so and Xg4 are the particle sizes at 16%, 50%and 84%, respectively and areextracted from the cumulative floc size distributions. If a number distribution fits a log-normal distribution, then its transformation to volumedistribution will result in another log-normal distribution (Allen, 1997), characterized by: Eqs (4), (5) were applied to transform the CIS-100 and IMAN fitted log-normal numberdistributions into log-normal volume distributions, which were then compared with origi-nal MastersizerS volume-based distributions. Similarly, the fitted log-normal volume dis-tributions from the MastersizerS were transformed into log-normal number distributionsand compared with the number-based distributions measured by using the counting tech-niques. By performing these transformations, new values for the geometric standard devia-tion and geometric mean have been obtained (Table 2). It was observed that for all analysed samples the volume distribution given by theMalvern correlated well with the transformed CIS-100 distributions (Figure 4a). This ismainly due to the fact that the few big size particles detected by the TOT method are notaccounted for any more in the log-normal volume distribution when this is calculated backfrom the fitted log-normal number distribution. The log-normal volume distribution calcu-lated from the IMAN fitted log-normal number distribution showed a similar shape to the Figure 4 Log-normal volume (a) and number (b) distributions calculated from fitted log-normal number (a)and volume (b) distributions IMAN volume distribution calculated from the experimental data based on a sphericalshape assumption. For the case in which the experimental number distributions of CIS-100 and IMAN arecompared with the calculated log-normal number distributions of the MastersizerS, thelatter does not show the very large number in small particles any more and tends to agreebetter with the results obtained with the CIS-100 device (Figure 4b). Conclusions By coupling three sizing devices it was possible to comparatively measure the activatedsludge floc size distributions, while eliminating variations in time due to sample prepara-tion and manipulation. All techniques used turned out to be fast and reliable methods toquantify the floc size distribution under steady state conditions. The measurement resultswere often in agreement, and the methods complemented each other in terms of size range.However, when the focus is on monitoring flocculation dynamics, the techniques based onlaser light scattering are more suited to follow the fast changes that may occur in floc sizeduring the process. The counting devices suffer from the longer acquisition times needed.Since devices like the MastersizerS do not usually offer visual information, coupling themto an image analysis system allows a direct visual inspection of the process evolution. Thecounting techniques are more accurate when the number distributions are of interest. Fromthis viewpoint, it is concluded that the measurement principle (number or volume based) isof high importance for correct interpretation of the data. Conversion of the results may bemisleading and should be used with precaution, especially for ensemble techniques. Acknowledgements The Fund for Scientific Research - Flanders, Belgium (Fonds voor WetenschappelijkOnderzoek) and the Ghent University Special Research Fund (Bijzonder Onderzoeksfonds,UGent) are gratefully acknowledged for their financial support for this project. References Allen, T. (1997). Particle size measurements. Fifth edition. Chapman and Hall Ltd.,London. Andreadakis, A.D. (1993). Physical and chemical properties of activated sludge floc. Wat.Res.,27(12),1707-1714.Barbusinski, K. and Koscielniak, H. (1995). Influence of substrate loading intensity on floc size in the activated sludgeprocess. Wat.Res.,29(7),1703-1710. Biggs,C.A. (2000). Activated sludge flocculation: investigating the effect of shear rate and cation concentration onflocculation dynamics. Ph.D. Thesis, University of Queensland, Australia. De Clercq, B., Lant, P.A. and Vanrolleghem,P.A. (2002). On-line particle size measurements in secondary clarifiers.In: Proceedings International IWA Conference on Automation in Water Quality Monitoring (AutMoNet2002).Vienna, Austria, May 21-22, 2002. Govoreanu, R., Vandegehuchte,K., Saveyn, H.,Nopens, I., De Clercq, B., Van der Meeren, P. and Vanrolleghem,P.A.(2002). An automated image analysis system for on-line structural characterization of the activated sludge flocs.Med. Fac.Landbouww. Univ. Gent,67/4, 175-178. ( Govoreanu,R., Se g hers,D., Nopens, I., De C lercq, B.,Saveyn,H., Capalozza, C., Van de r Meeren, P., Verstra e te, W., Top,E. and Vanrolleghem,P.A.(2003). Linki n g floc structure and settling properties to activated sludge population dynamics in an SBR. W at. Sci. T ech., 47(12),9-18. ) ( Grijspeerdt, K. and V erstraete, W.(1997). Image analysis to estimate the settleability and concentration of a c tivated sludge. Wat.Res.,31(6),1126-1134. ) ( Hiligardt, D. and Hoffmann,E. (1997). Pa r ticle size analysis and sedimentation properties of activated sludge flocs.Wat. Sci. Tech., 36(4), 1 67- 1 75. ) ( Li,D.-H. and Ganczarczyk,J.J.(1990). Structure of act i vated sludge flocs. Biotechnology and Bioengineering, 35, 57-65. ) ( Li, D.-H. and Ganczarczyk, J.J. (1991). Size distribution of activated sludge flocs.Research Journal WPCF,63(5), 806-814. ) ( Nopens, I.,Biggs, C .A., De Clercq,B., Govoreanu,R., Wi l en, B.-M., Lant, P. and Vanrolleghem,P.A. (200 2 ). Modelling the activated sludge f l occulation process combining laser diffraction particle sizing and population balance modelling (PBM). Wat. Sci.Tech., 45(6),41-49. ) ( Waite,T.D.,Guan, J. and Amal,R. ( 1 998 ) . Rapid determination of bacterial assemblage structure: implications toprocess optimisation in wastewater treatment. Chemical Water and Wastewater Treatment V , E. H o ffmann and H.Odegaard (eds), Springer-Verlag,Berlin, 269-283. )
确定
还剩6页未读,是否继续阅读?

产品配置单
儒亚科技有限公司为您提供《活性污泥中粒径分布检测方案(激光粒度仪)》,该方案主要用于土壤中物理指标检测,参考标准--,《活性污泥中粒径分布检测方案(激光粒度仪)》用到的仪器有EyeTech 激光粒度粒形分析仪
推荐专场


相关方案
更多