


方案详情
文
共聚焦型激光扫描显微镜广泛应用于生物化学,细胞生物学以及其它生命科学研究领域。时间分辨技术进一步
加强了显微镜的功能,如:
荧光共振能量转移(FRET)效率的荧光寿命量化测量
利用时间分辨成像测量环境参数(pH,离子浓度)
基于荧光团浓度的寿命测量
基于寿命辨别分子间距的研究
提高对荧光信号的甄别能力
减少探测器的数量
利用寿命衰减时间提高实验分析的精确度
方案详情

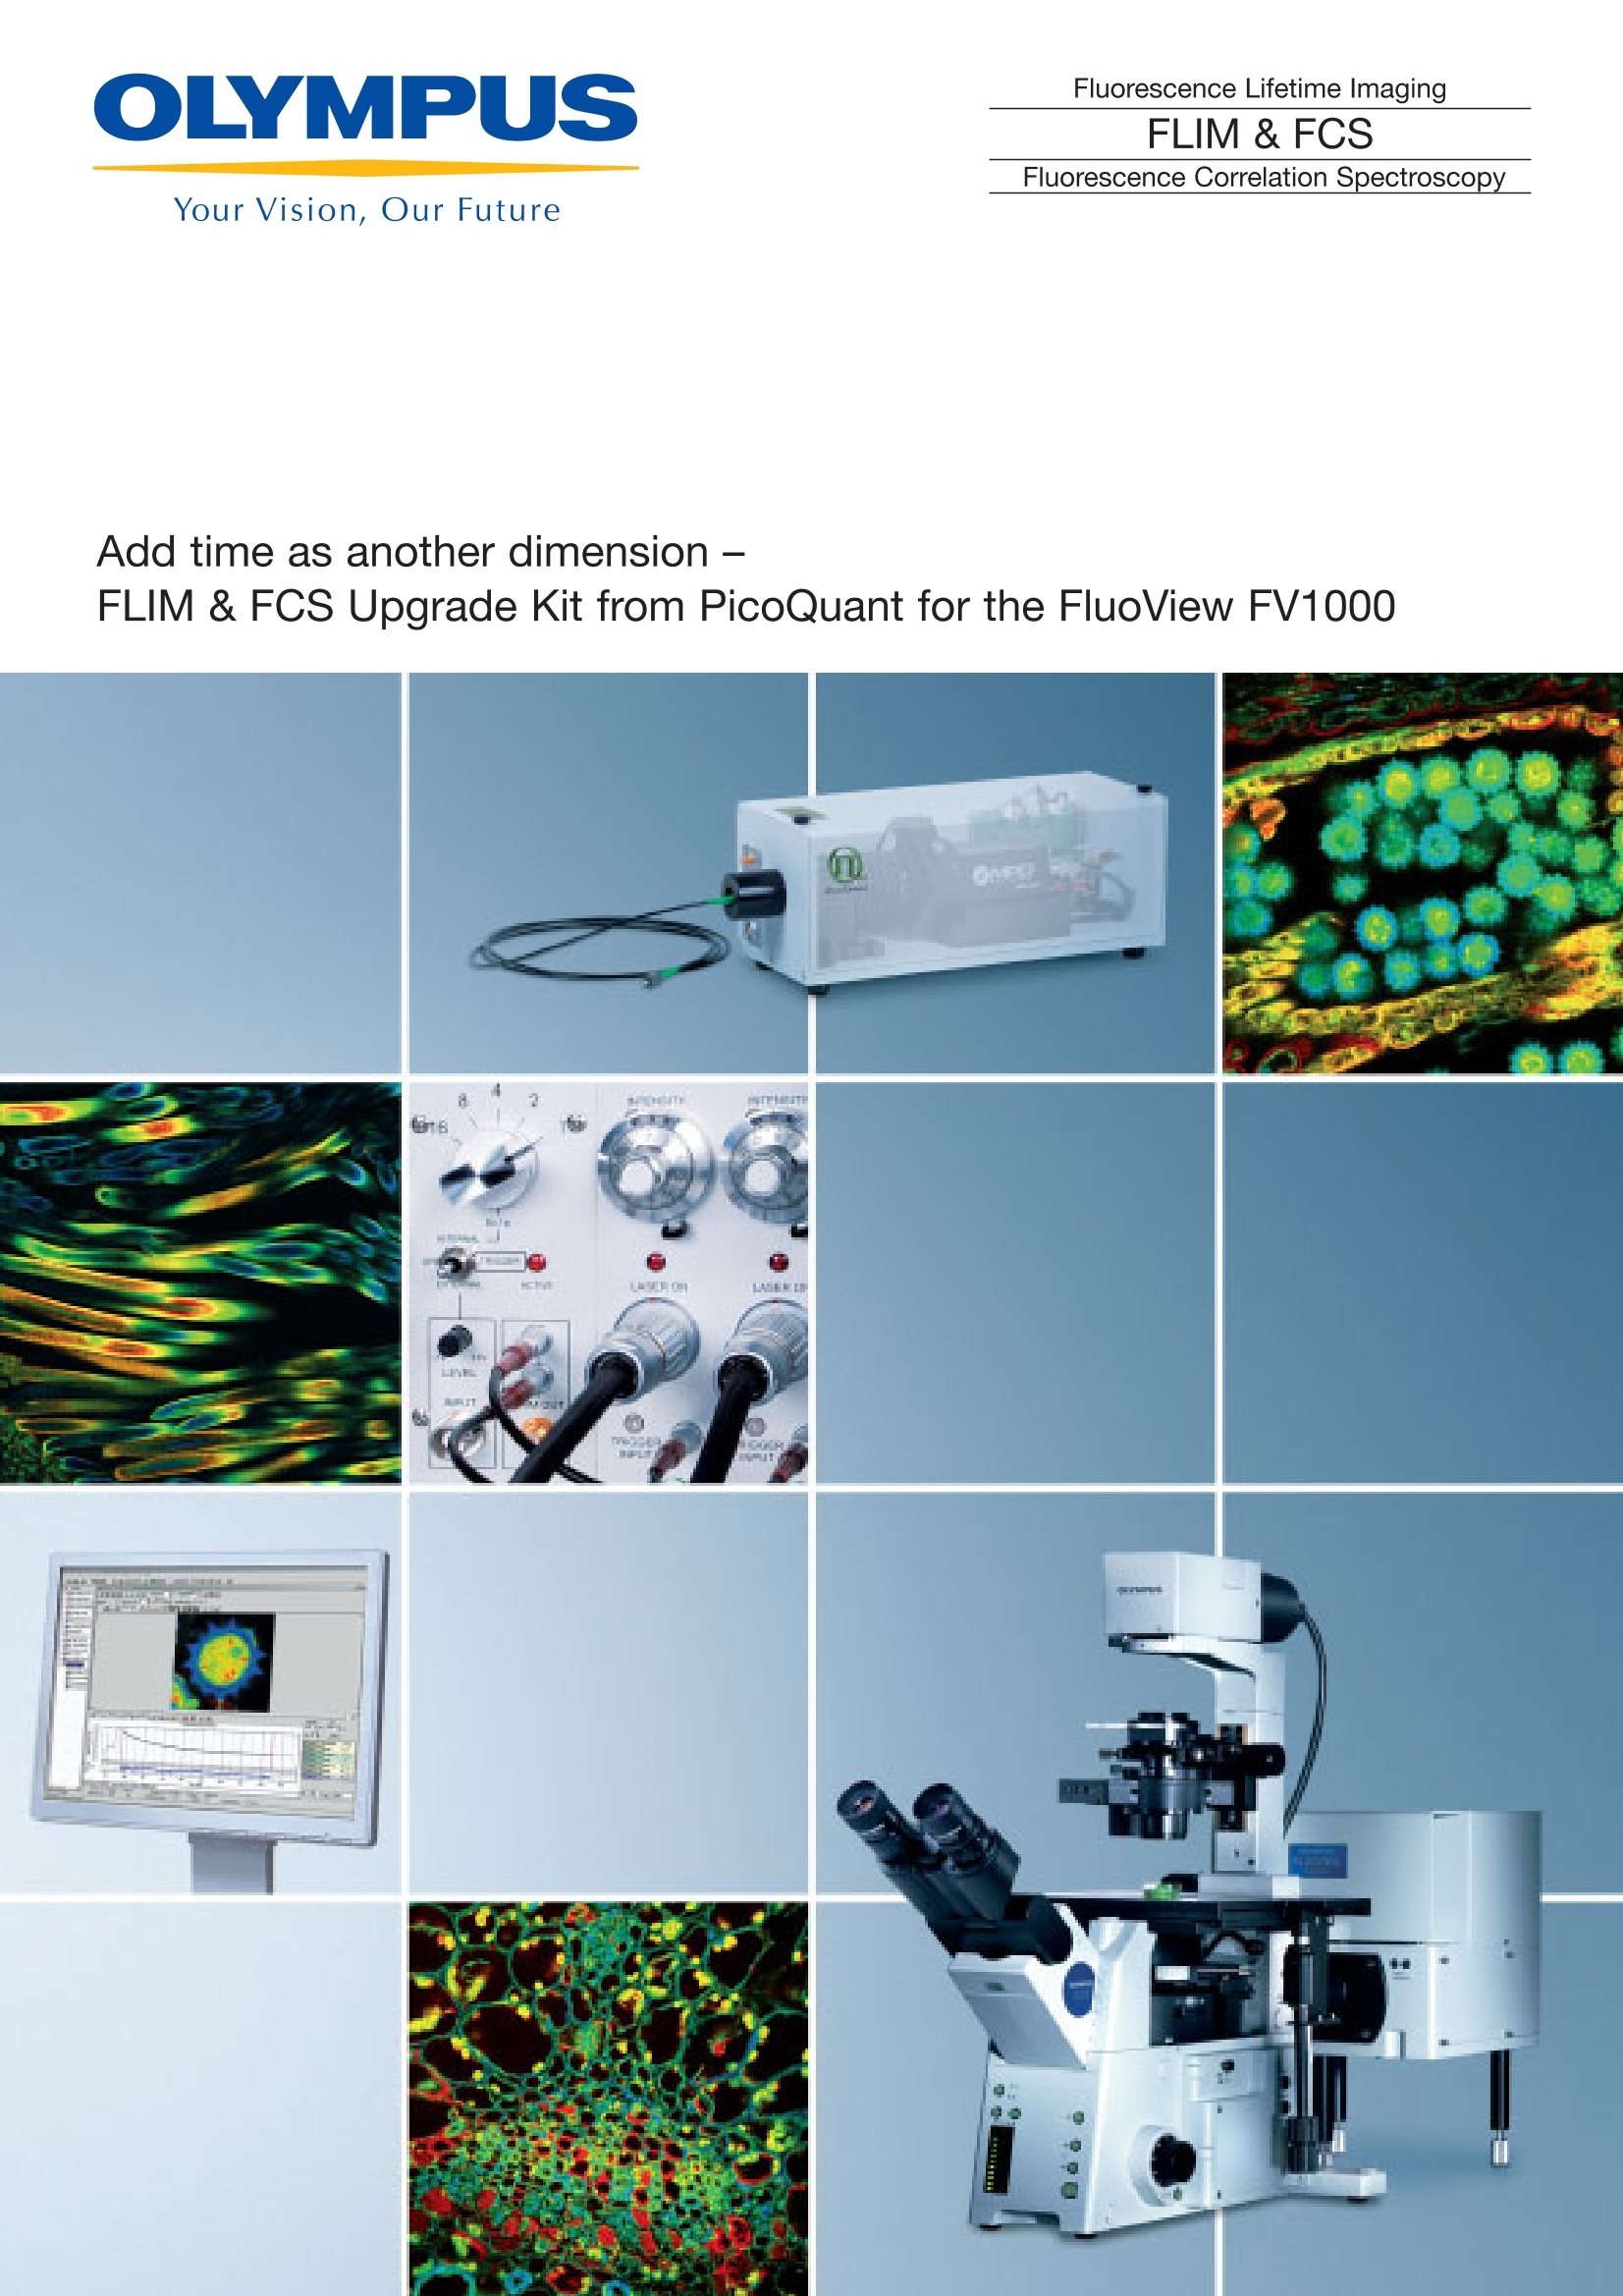
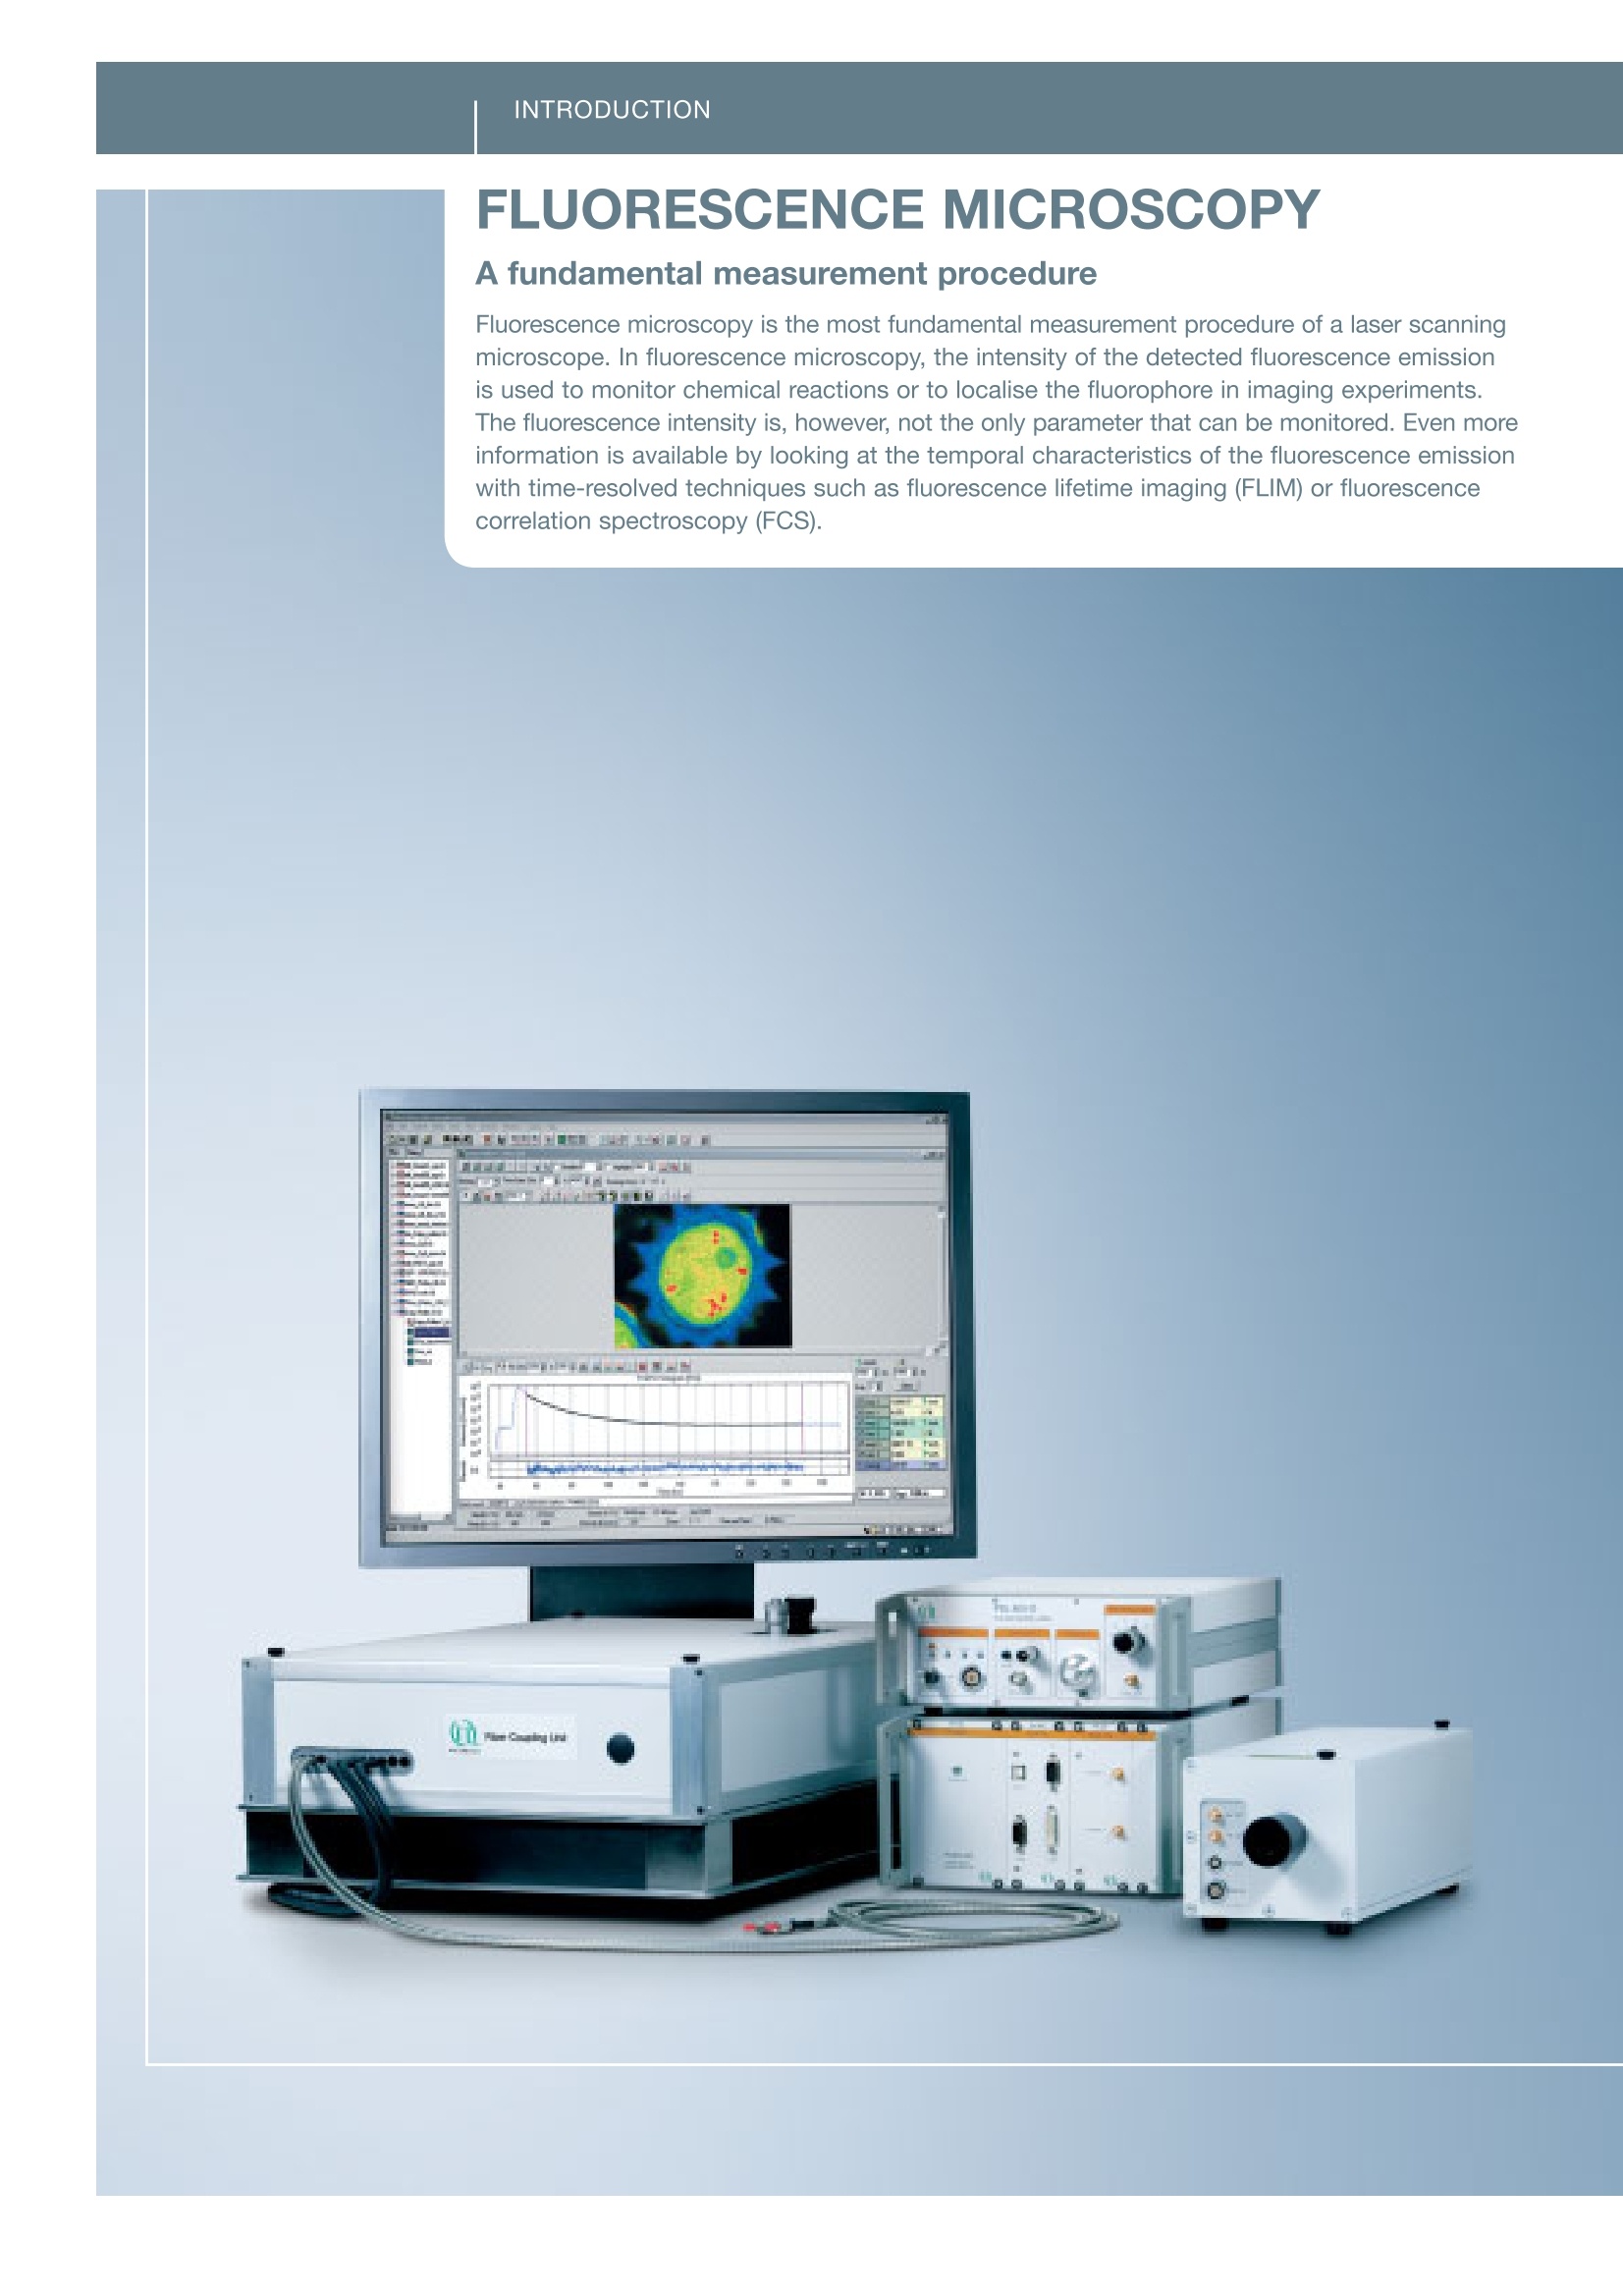
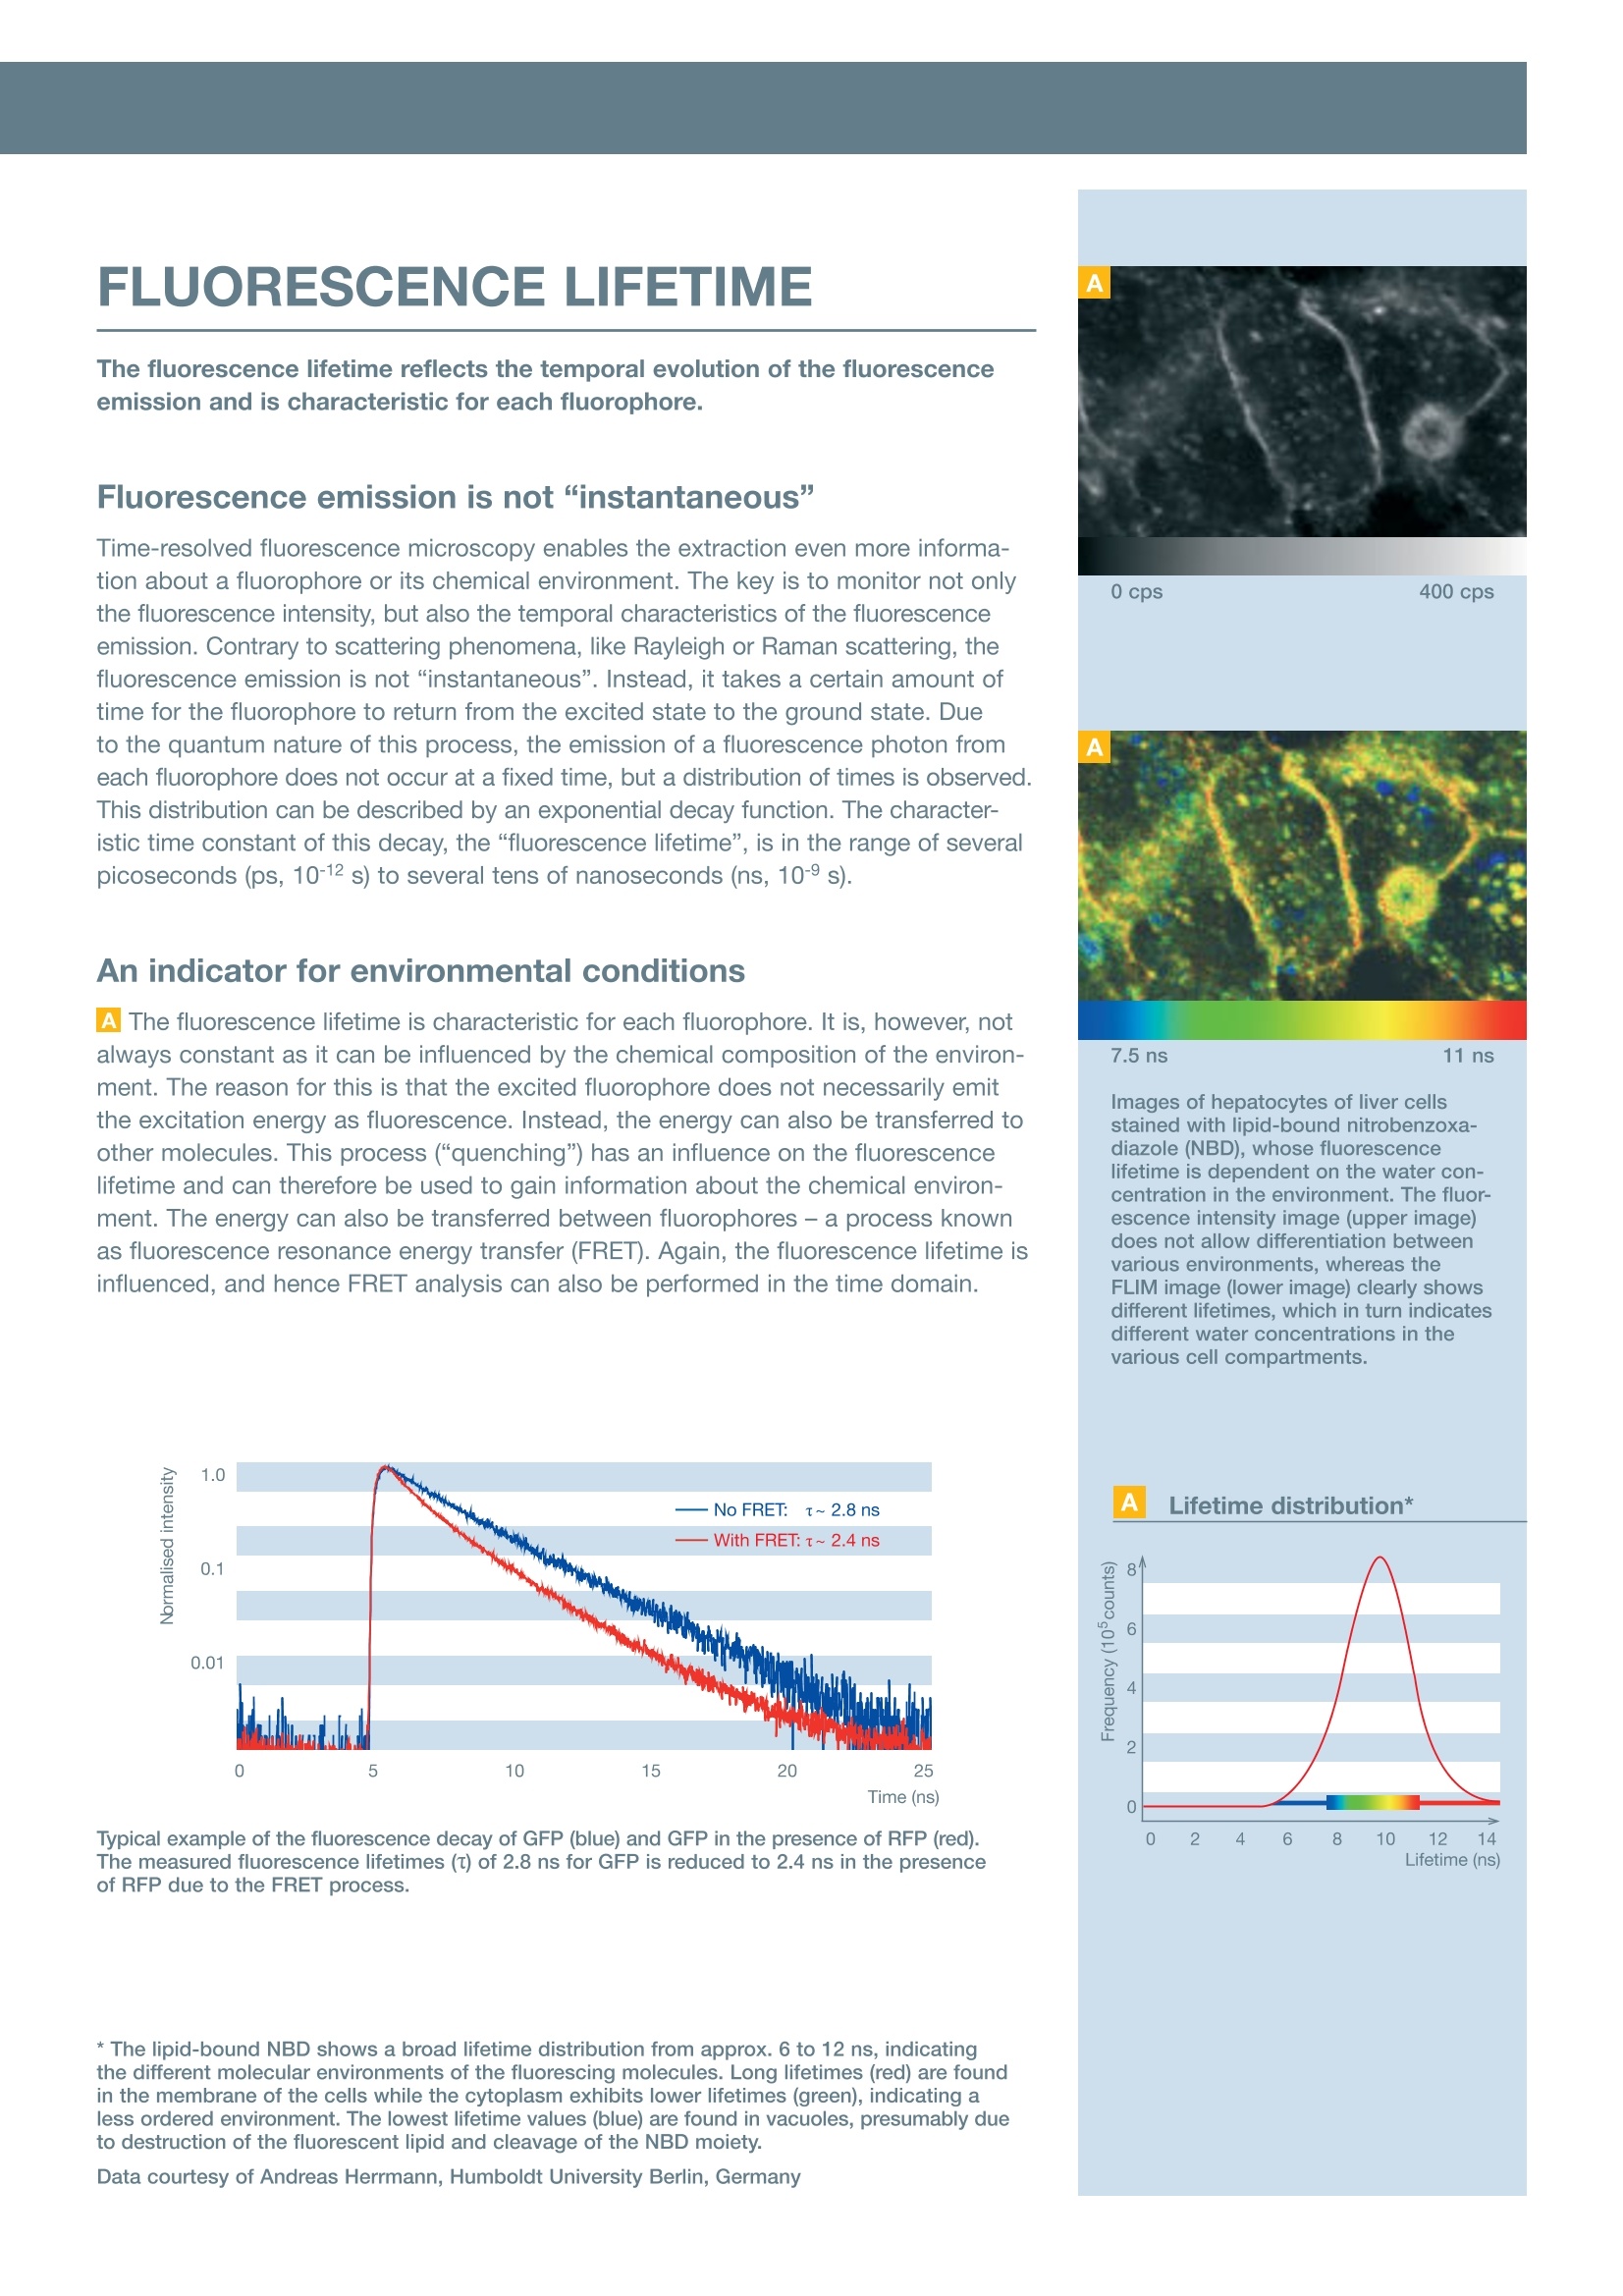
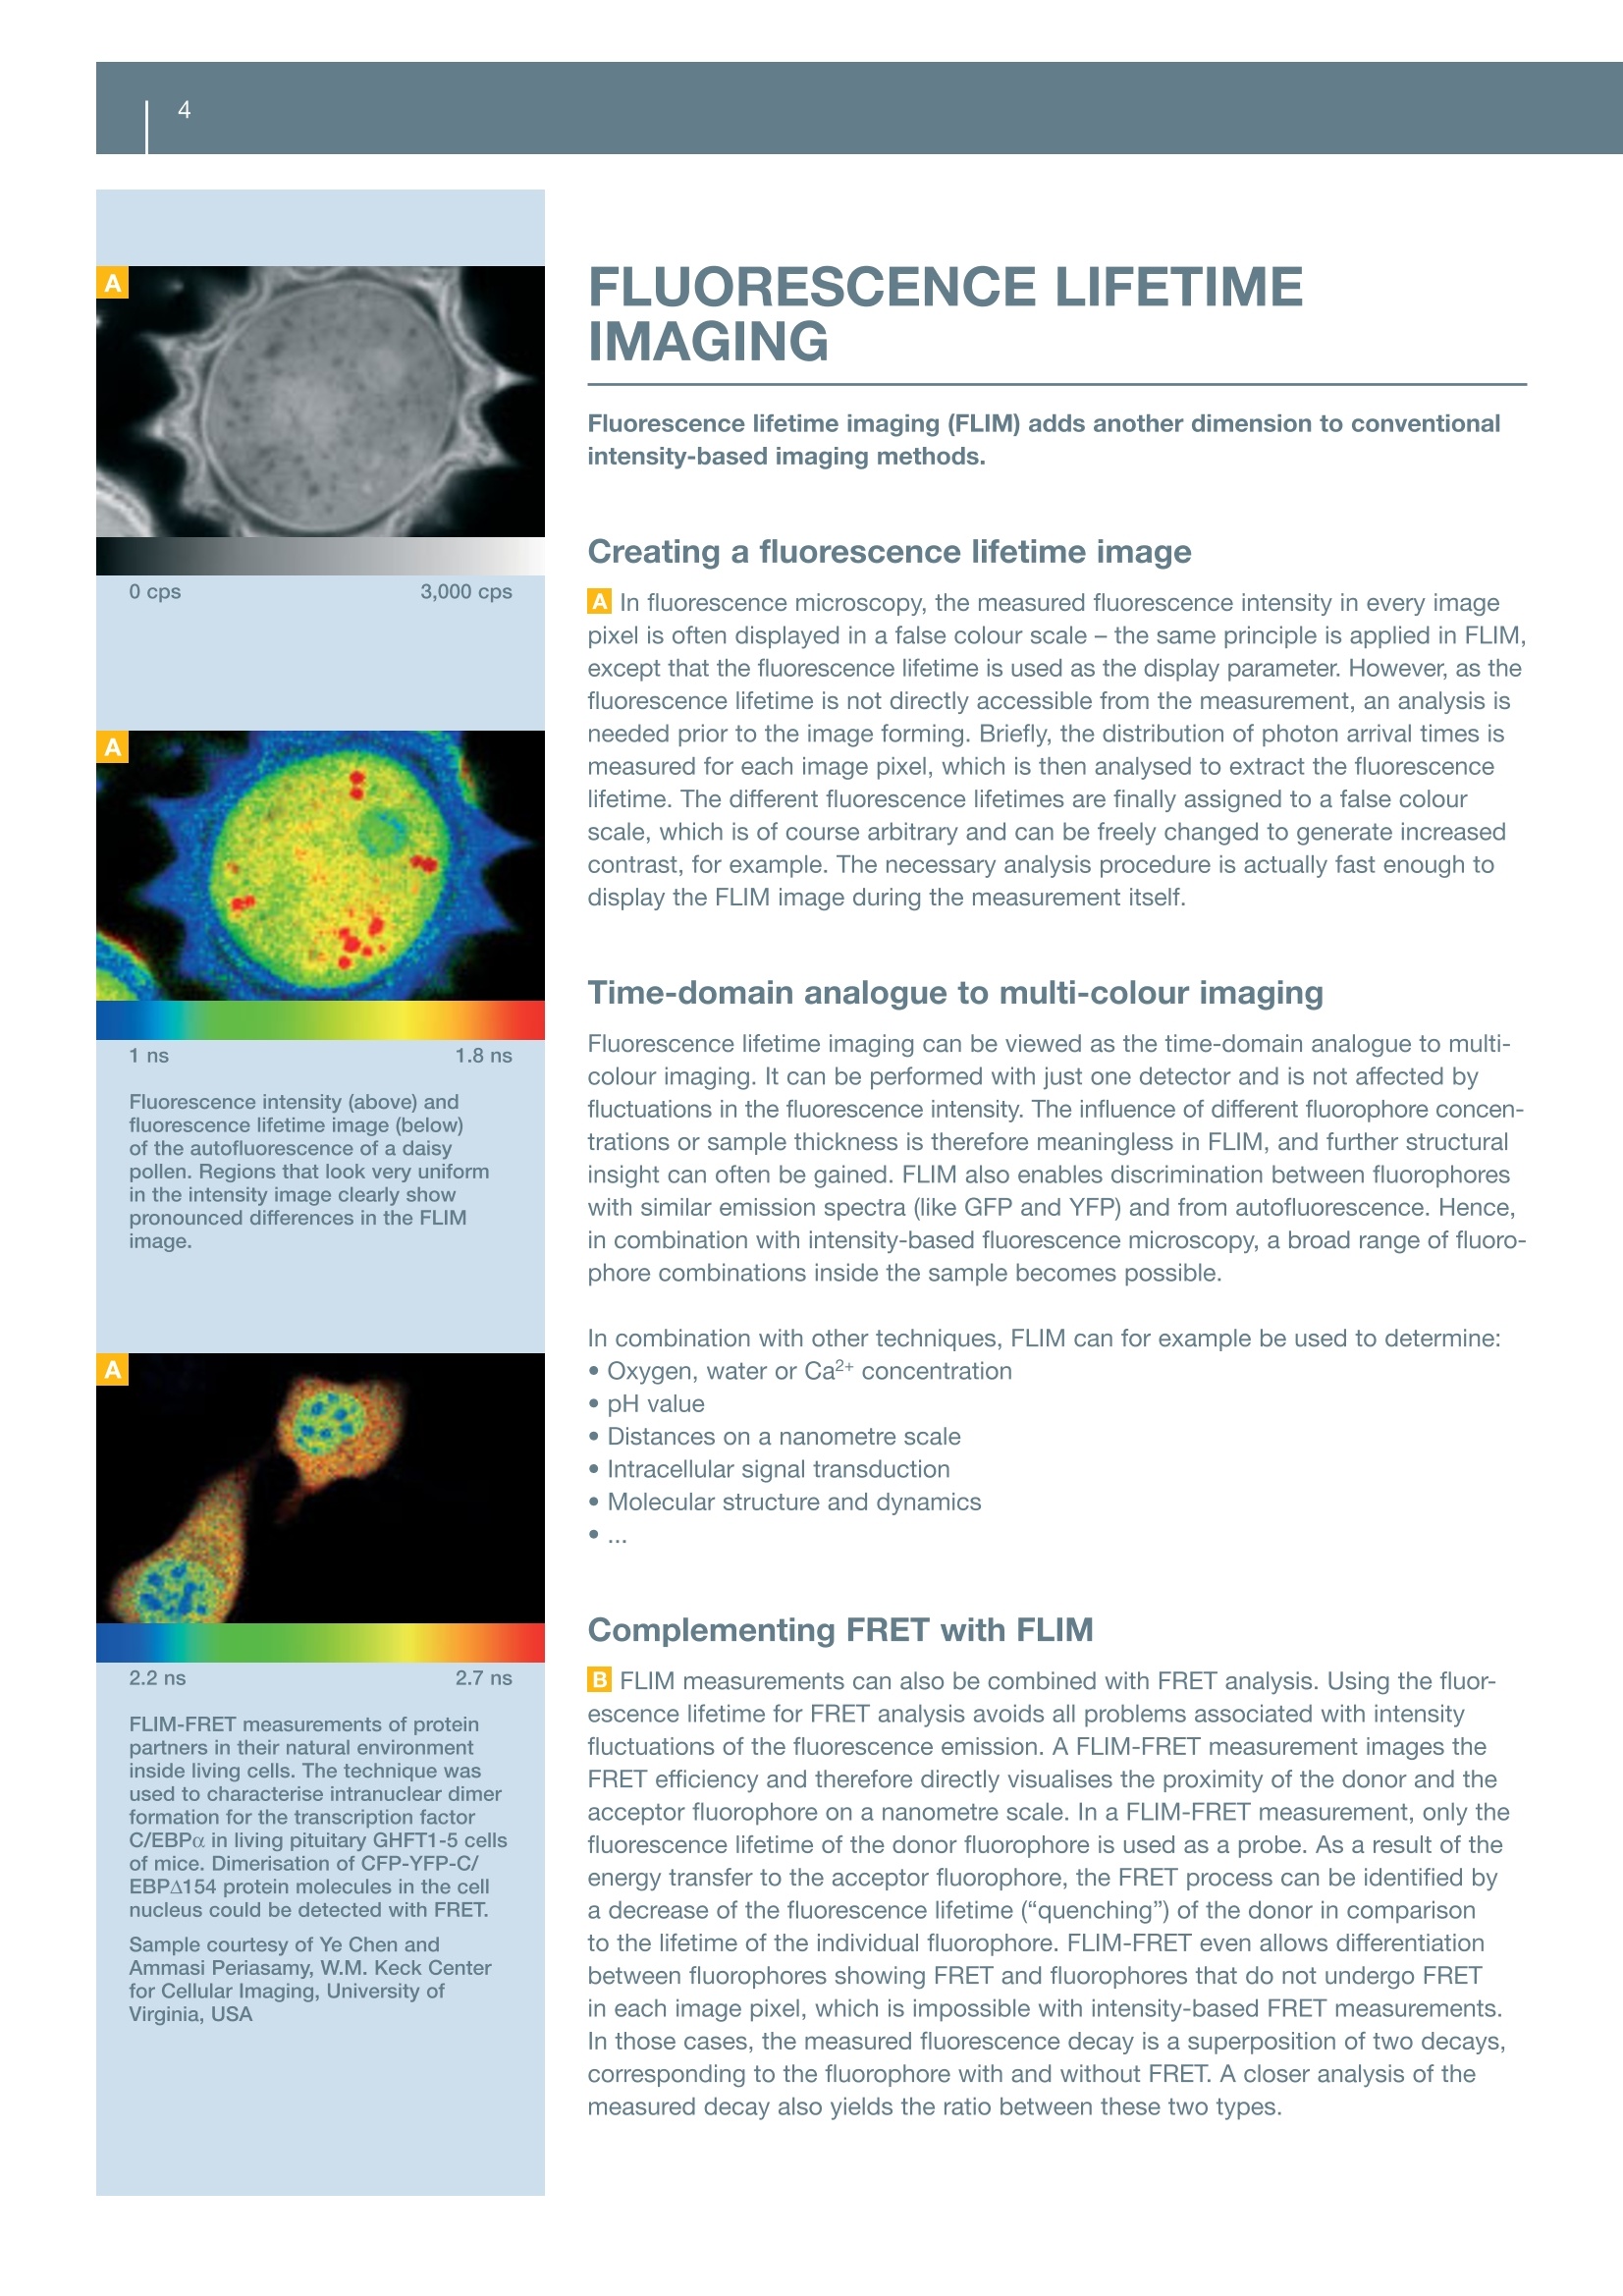
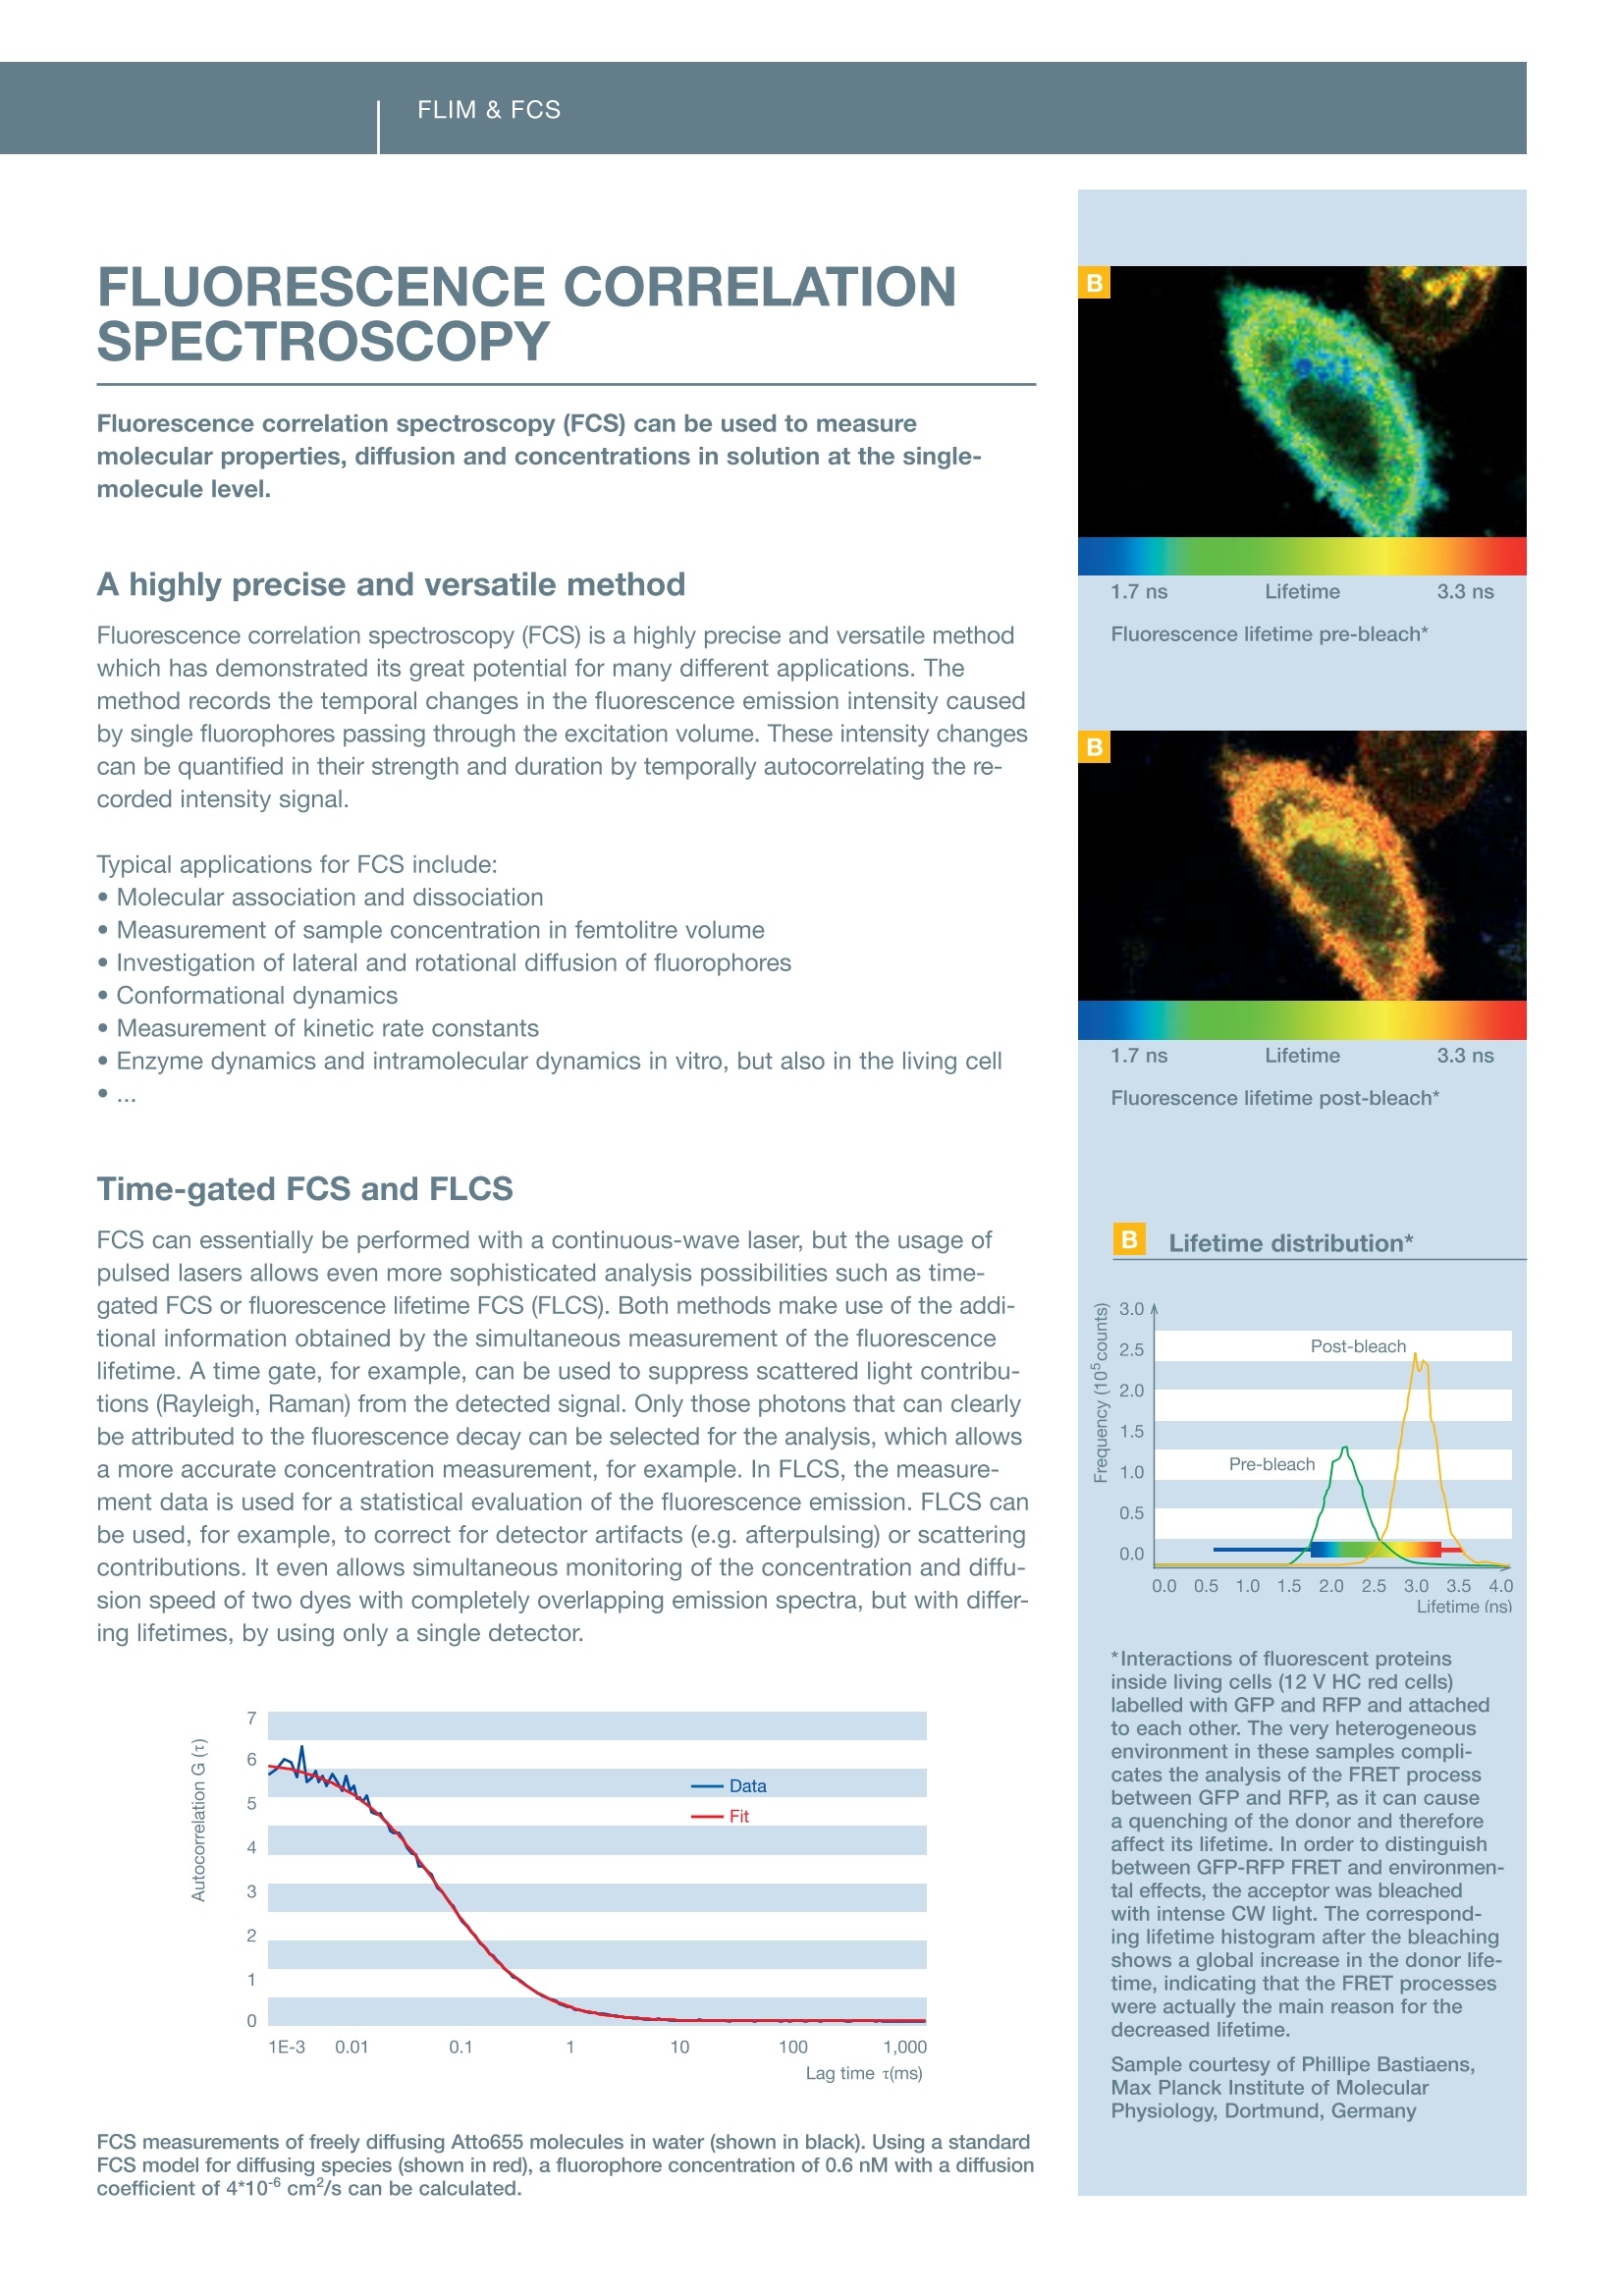
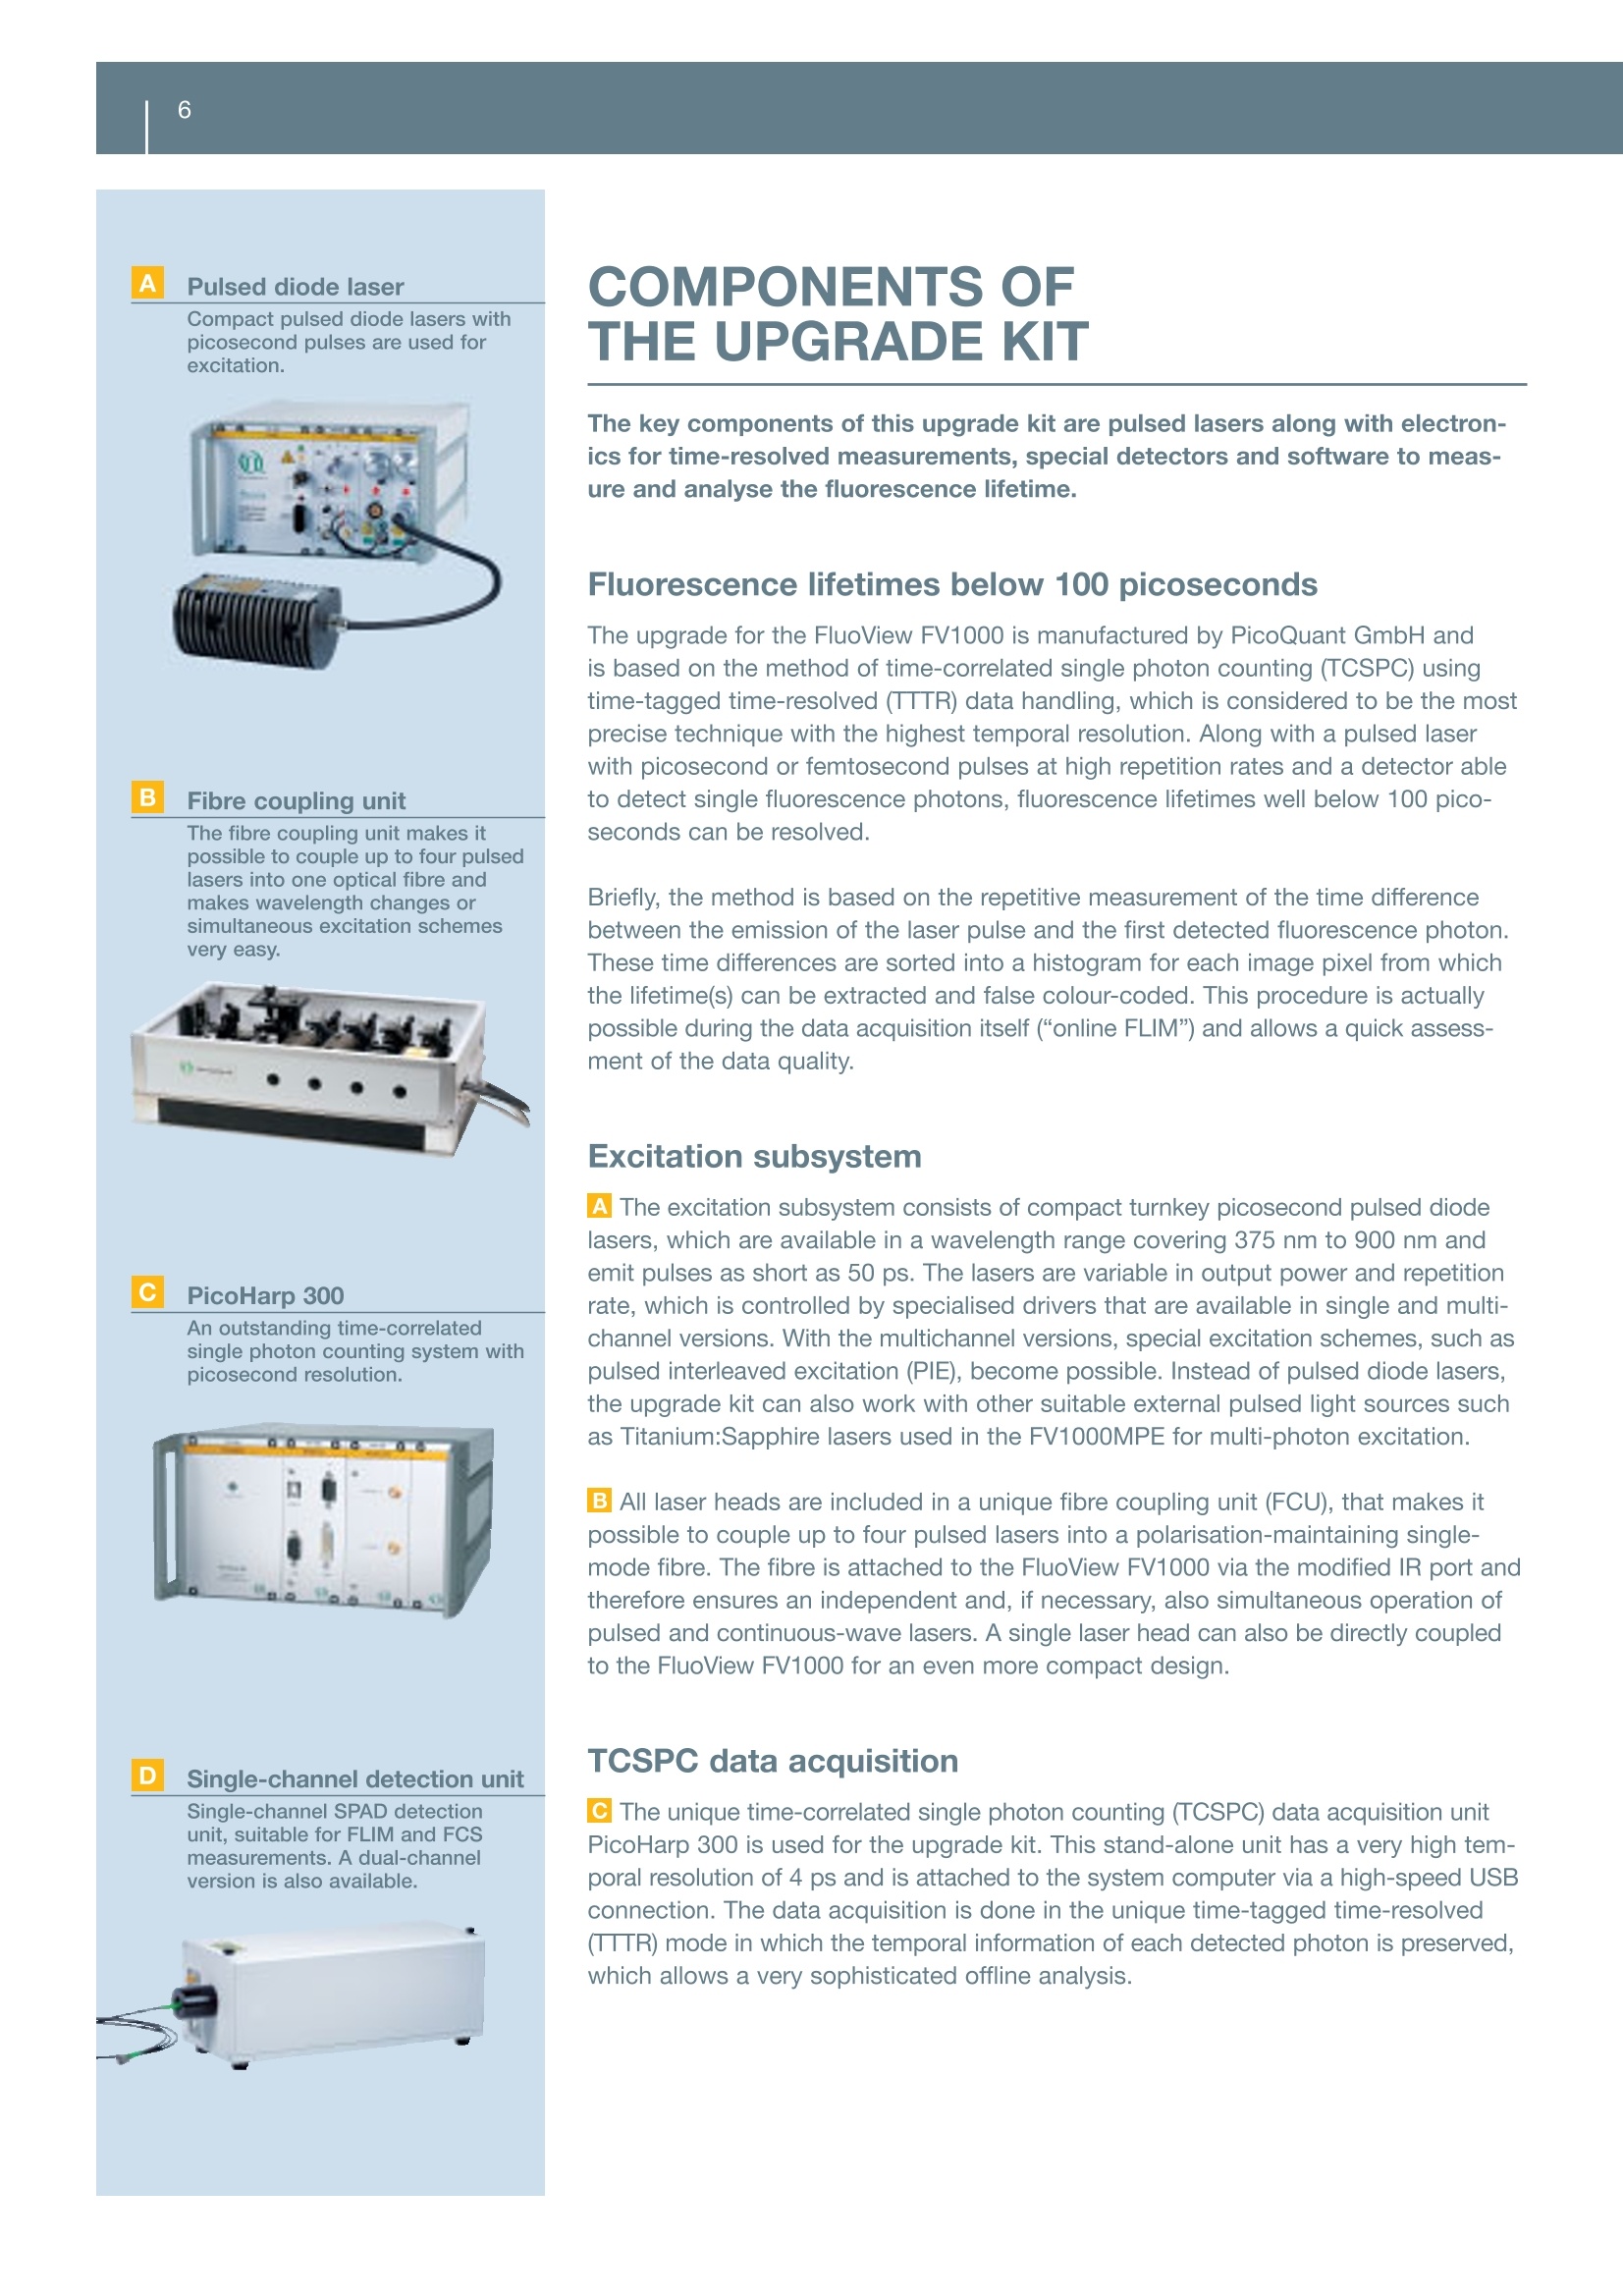
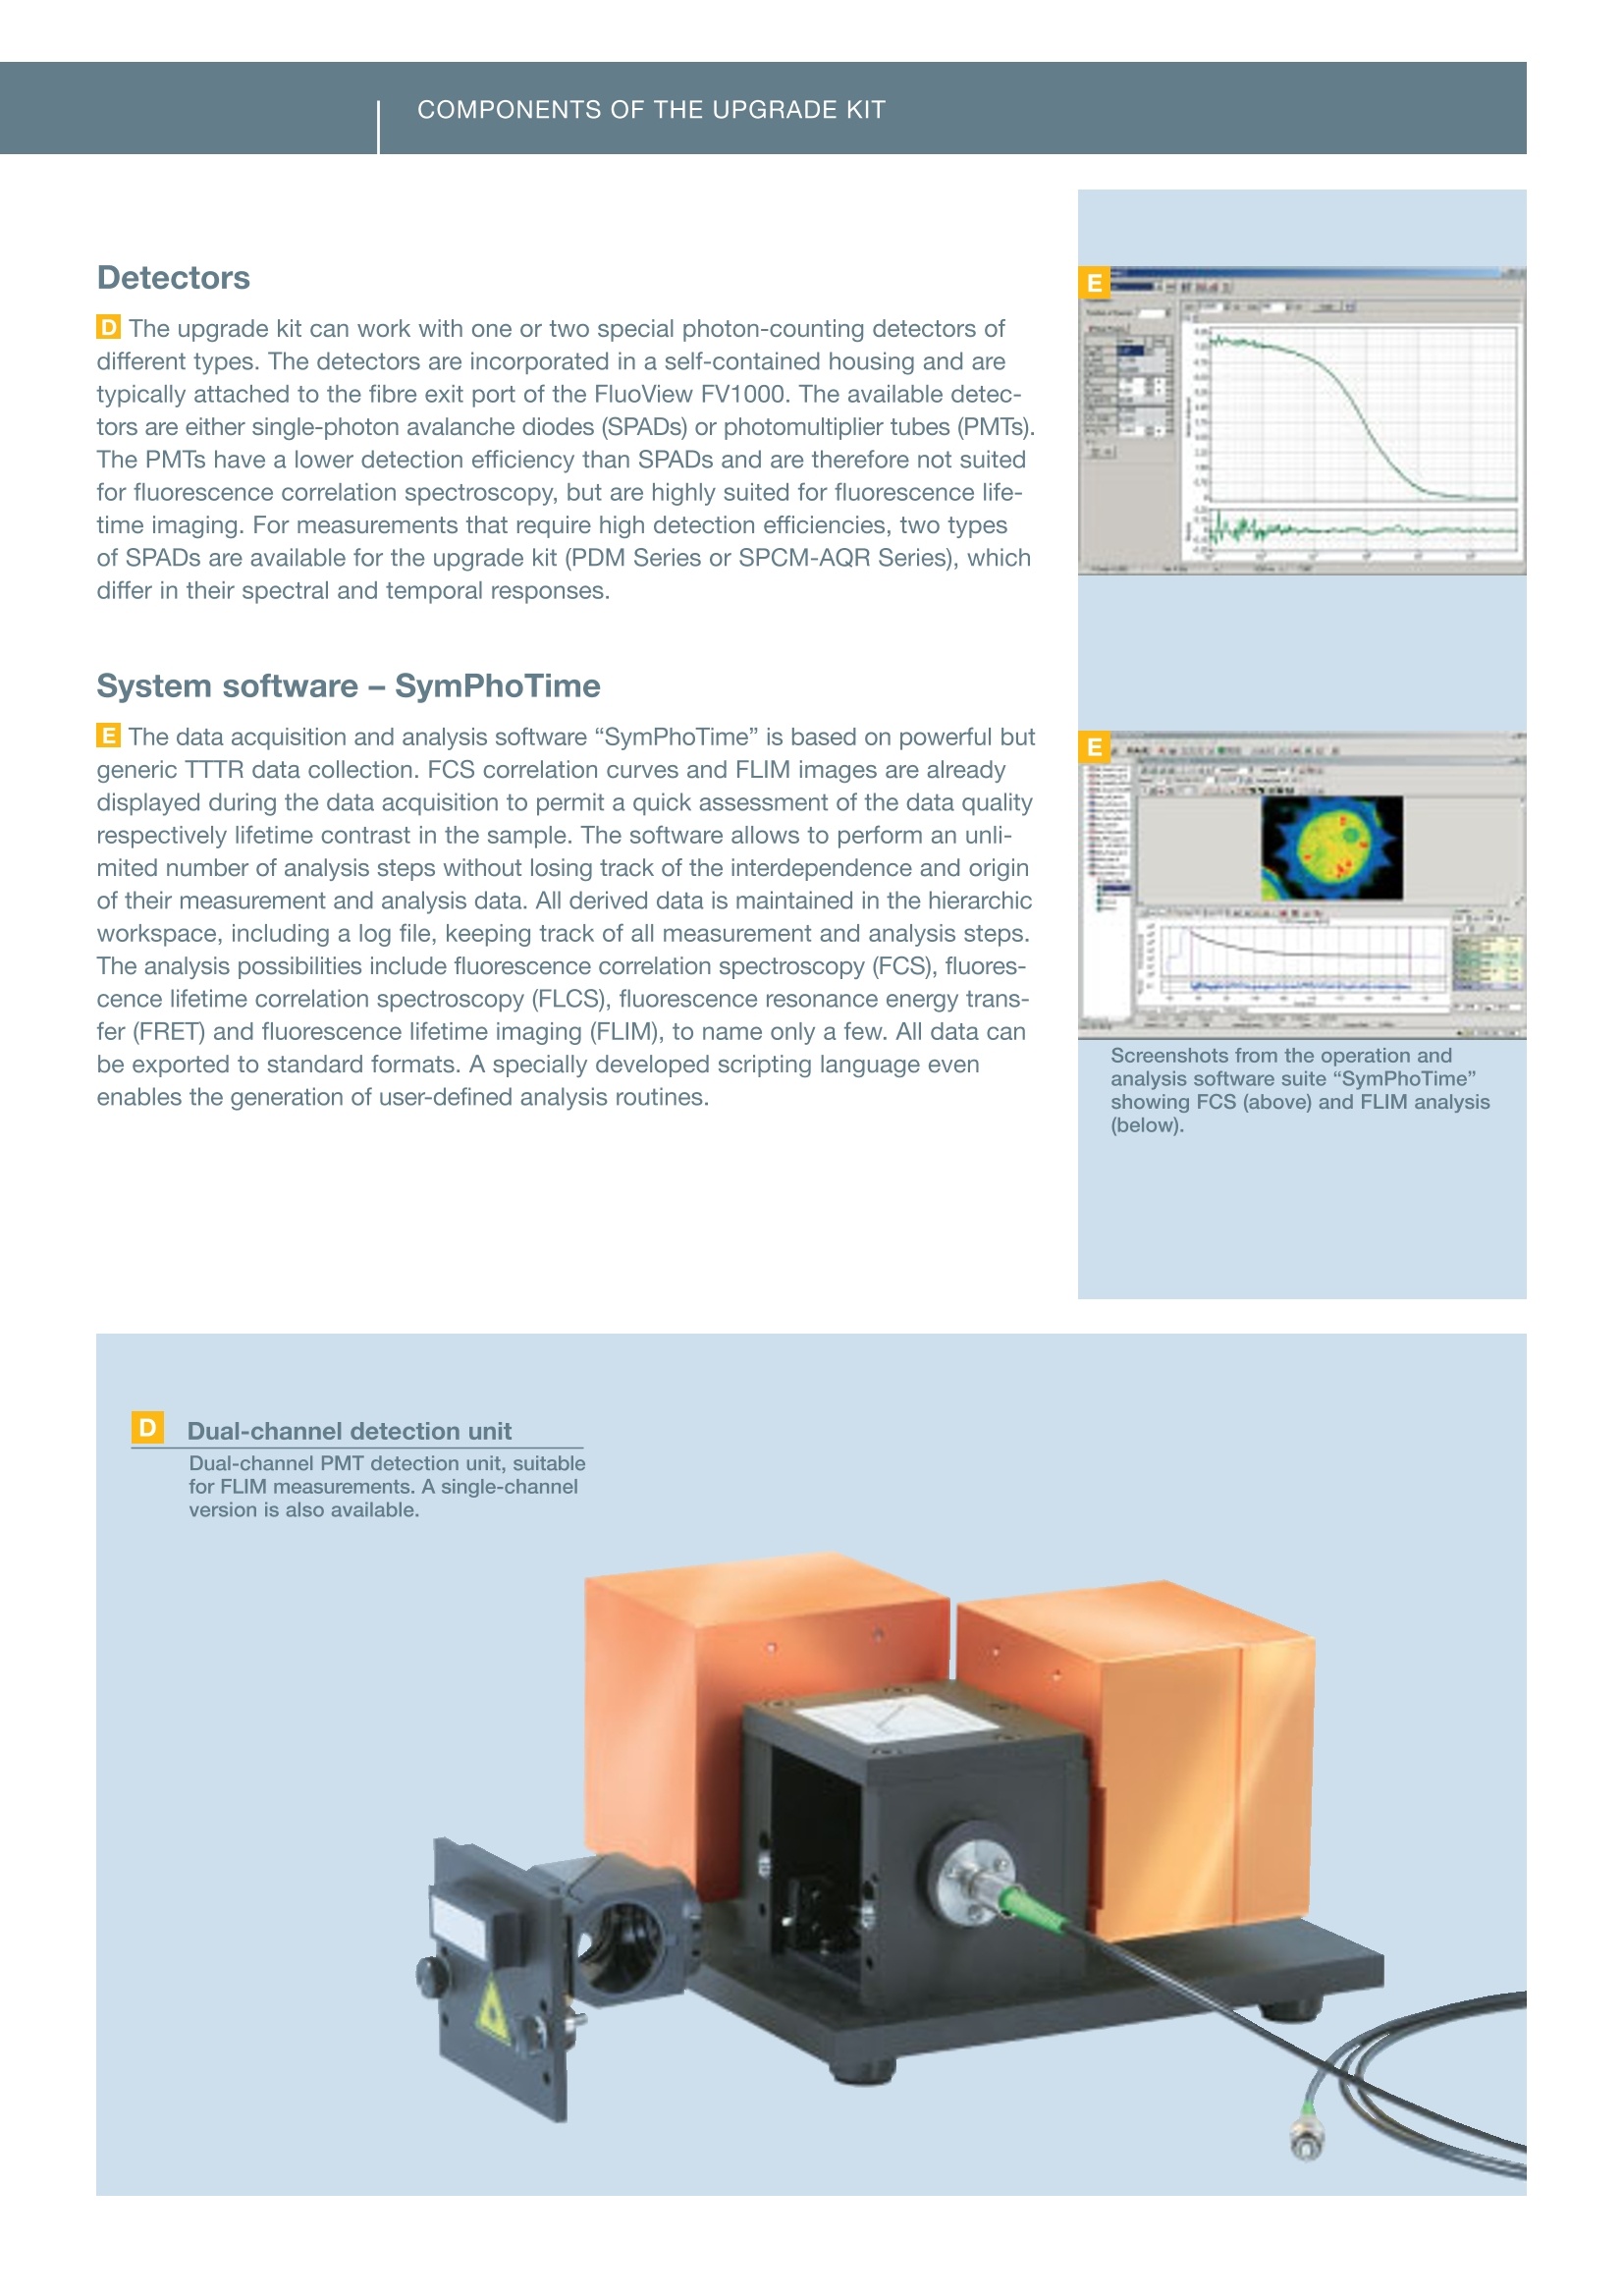
Fluorescence Lifetime ImagingFLIM & FCSFluorescence Correlation Spectroscopy INTRODUCTION Your Vision, Our Future Add time as another dimension- FLIM & FCS Upgrade Kit from PicoQuant for the FluoView FV1000 FLUORESCENCE MICROSCOPY FLUORESCENCE LIFETIME The fluorescence lifetime reflects the temporal evolution of the fluorescenceemission and is characteristic for each fluorophore. Fluorescence emission is not“instantaneous” Time-resolved fluorescence microscopy enables the extraction even more informa-tion about a fluorophore or its chemical environment. The key is to monitor not onlythe fluorescence intensity, but also the temporal characteristics of the fluorescenceemission. Contrary to scattering phenomena, like Rayleigh or Raman scattering, thefluorescence emission is not“instantaneous”. Instead, it takes a certain amount oftime for the fluorophore to return from the excited state to the ground state. Dueto the quantum nature of this process, the emission of a fluorescence photon fromeach fluorophore does not occur at a fixed time, but a distribution of times is observed.This distribution can be described by an exponential decay function. The character-istic time constant of this decay, the“fluorescence lifetime”, is in the range of severalpicoseconds (ps, 10-12 s) to several tens of nanoseconds (ns, 10-s). An indicator for environmental conditions AThe fluorescence lifetime is characteristic for each fluorophore. It is, however, notalways constant as it can be influenced by the chemical composition of the environ-ment. The reason for this is that the excited fluorophore does not necessarily emitthe excitation energy as fluorescence. Instead, the energy can also be transferred toother molecules. This process (“quenching”) has an influence on the fluorescencelifetime and can therefore be used to gain information about the chemical environ-ment. The energy can also be transferred between fluorophores- a process knownas fluorescence resonance energy transfer (FRET). Again, the fluorescence lifetime isinfluenced, and hence FRET analysis can also be performed in the time domain. Typical example of the fluorescence decay of GFP (blue) and GFP in the presence of RFP(red).The measured fluorescence lifetimes (T) of 2.8 ns for GFP is reduced to 2.4 ns in the presenceof RFP due to the FRET process. ( * Th e l ipid-bound N B D sh o ws a broad life t i me distribution fro m app r ox. 6 to 12 ns, indicating t he d ifferent molecular environments of the fluorescing mo le cules. Long lifeti me s (re d ) are found i n the membrane of t h e cells whi l e the cytoplasm exhib i ts lower lifetimes (green), indicating aless ordered environment. The lowest li f etime v a lues (blue) are found in vacuoles, presumably du e to destruction o f the fluorescent lipid and c leavage of the NB D m oi e ty. ) 0 cps 400 cps 7.5 ns 11 ns Images of hepatocytes of liver cellsstained with lipid-bound nitrobenzoxa-diazole (NBD), whose fluorescencelifetime is dependent on the water con-centration in the environment.The fluor-escence intensity image (upper image)does not allow differentiation betweenvarious environments, whereas theFLIM image (lower image) clearly showsdifferent lifetimes, which in turn indicatesdifferent water concentrations in thevarious cell compartments. Lifetime (ns) 0 cps 1ns 1.8 ns Fluorescence intensity (above) andfluorescence lifetime image (below)of the autofluorescence of a daisypollen. Regions that look very uniformin the intensity image clearly showpronounced differences in the FLIMimage. 2.2 ns 2.7 ns FLIM-FRET measurements of proteinpartners in their natural environmentinside living cells. The technique wasused to characterise intranuclear dimerformation for the transcription factorC/EBPa in living pituitary GHFT1-5 cellsof mice. Dimerisation of CFP-YFP-C/EBPA154 protein molecules in the cellnucleus could be detected with FRET. Sample courtesy of Ye Chen andAmmasi Periasamy, W.M. Keck Centerfor Cellular Imaging, University ofVirginia, USA FLUORESCENCE LIFETIMEIMAGING Fluorescence lifetime imaging (FLIM) adds another dimension to conventionalintensity-based imaging methods. Creating a fluorescence lifetime image Al In fluorescence microscopy, the measured fluorescence intensity in every imagepixel is often displayed in a false colour scale- the same principle is applied in FLIM,except that the fluorescence lifetime is used as the display parameter. However, as thefluorescence lifetime is not directly accessible from the measurement, an analysis isneeded prior to the image forming. Briefly, the distribution of photon arrival times ismeasured for each image pixel, which is then analysed to extract the fluorescencelifetime. The different fluorescence lifetimes are finally assigned to a false colourscale, which is of course arbitrary and can be freely changed to generate increasedcontrast, for example. The necessary analysis procedure is actually fast enough todisplay the FLIM image during the measurement itself. Time-domain analogue to multi-colour imaging Fluorescence lifetime imaging can be viewed as the time-domain analogue to multi-colour imaging. It can be performed with just one detector and is not affected byfluctuations in the fluorescence intensity. The influence of different fluorophore concen-trations or sample thickness is therefore meaningless in FLIM, and further structuralinsight can often be gained. FLIM also enables discrimination between fluorophoreswith similar emission spectra (like GFP and YFP) and from autofluorescence. Hence,in combination with intensity-based fluorescence microscopy, a broad range of fluoro-phore combinations inside the sample becomes possible. In combination with other techniques, FLIM can for example be used to determine:·Oxygen, water or Ca²+concentration · pH value · Distances on a nanometre scale ·Intracellular signal transduction ·Molecular structure and dynamics MM Complementing FRET with FLIM B| FLIM measurements can also be combined with FRET analysis. Using the fluor-escence lifetime for FRET analysis avoids all problems associated with intensityfluctuations of the fluorescence emission. A FLIM-FRET measurement images theFRET efficiency and therefore directly visualises the proximity of the donor and theacceptor fluorophore on a nanometre scale. In a FLIM-FRET measurement, only thefluorescence lifetime of the donor fluorophore is used as a probe. As a result of theenergy transfer to the acceptor fluorophore, the FRET process can be identified bya decrease of the fluorescence lifetime (“quenching”) of the donor in comparisonto the lifetime of the individual fluorophore. FLIM-FRET even allows differentiationbetween fluorophores showing FRET and fluorophores that do not undergo FRETin each image pixel, which is impossible with intensity-based FRET measurements.In those cases, the measured fluorescence decay is a superposition of two decays,corresponding to the fluorophore with and without FRET. A closer analysis of themeasured decay also yields the ratio between these two types. FLUORESCENCE CORRELATIONSPECTROSCOPY Fluorescence correlation spectroscopy (FCS) can be used to measuremolecular properties, diffusion and concentrations in solution at the single-molecule level. A highly precise and versatile method Fluorescence correlation spectroscopy (FCS) is a highly precise and versatile methodwhich has demonstrated its great potential for many different applications. Themethod records the temporal changes in the fluorescence emission intensity causedby single fluorophores passing through the excitation volume. These intensity changescan be quantified in their strength and duration by temporally autocorrelating the re-corded intensity signal. Typical applications for FCS include: · Molecular association and dissociation ·Measurement of sample concentration in femtolitre volume ·Investigation of lateral and rotational diffusion of fluorophores ·Conformational dynamics ·Measurement of kinetic rate constants ·Enzyme dynamics and intramolecular dynamics in vitro, but also in the living cell●... Time-gated FCS and FLCS FCS can essentially be performed with a continuous-wave laser, but the usage ofpulsed lasers allows even more sophisticated analysis possibilities such as time-gated FCS or fluorescence lifetime FCS (FLCS). Both methods make use of the addi-tional information obtained by the simultaneous measurement of the fluorescencelifetime. A time gate, for example, can be used to suppress scattered light contribu-tions (Rayleigh, Raman) from the detected signal. Only those photons that can clearlybe attributed to the fluorescence decay can be selected for the analysis, which allowsa more accurate concentration measurement, for example. In FLCS, the measure-ment data is used for a statistical evaluation of the fluorescence emission. FLCS canbe used, for example, to correct for detector artifacts (e.g. afterpulsing) or scatteringcontributions. It even allows simultaneous monitoring of the concentration and diffu-sion speed of two dyes with completely overlapping emission spectra, but with differ-ing lifetimes, by using only a single detector. FCS measurements of freely diffusing Atto655 molecules in water (shown in black). Using a standardFCS model for diffusing species (shown in red), a fluorophore concentration of 0.6 nM with a diffusioncoefficient of 4*10-6cm²/s can be calculated. 1.7ns Lifetime 3.3 ns Fluorescence lifetime pre-bleach* inside living cells (12V HC red cells)labelled with GFP and RFP and attachedto each other. The very heterogeneousenvironment in these samples compli-cates the analysis of the FRET processbetween GFP and RFP, as it can causea quenching of the donor and thereforeaffect its lifetime. In order to distinguishbetween GFP-RFP FRET and environmen-tal effects, the acceptor was bleachedwith intense CW light.The correspond-ing lifetime histogram after the bleachingshows a global increase in the donor life-time, indicating that the FRET processeswere actually the main reason for thedecreased lifetime. Sample courtesy of Phillipe Bastiaens,Max Planck Institute of MolecularPhysiology, Dortmund, Germany Pulsed diode laser Compact pulsed diode lasers withpicosecond pulses are used forexcitation. COMPONENTS OFTHE UPGRADE KIT The key components of this upgrade kit are pulsed lasers along with electron-ics for time-resolved measurements, special detectors and software to meas-ure and analyse the fluorescence lifetime. Fluorescence lifetimes below 100 picoseconds The upgrade for the FluoView FV1000 is manufactured by PicoQuant GmbH andis based on the method of time-correlated single photon counting (TCSPC) usingtime-tagged time-resolved (TTTR) data handling,which is considered to be the mostprecise technique with the highest temporal resolution. Along with a pulsed laserwith picosecond or femtosecond pulses at high repetition rates and a detector ableto detect single fluorescence photons, fluorescence lifetimes well below 100 pico-seconds can be resolved. Briefly, the method is based on the repetitive measurement of the time differencebetween the emission of the laser pulse and the first detected fluorescence photon.These time differences are sorted into a histogram for each image pixel from whichthe lifetime(s) can be extracted and false colour-coded. This procedure is actuallypossible during the data acquisition itself (“online FLIM") and allows a quick assess-ment of the data quality. Excitation subsystem A| The excitation subsystem consists of compact turnkey picosecond pulsed diodelasers, which are available in a wavelength range covering 375 nm to 900 nm andemit pulses as short as 50 ps. The lasers are variable in output power and repetitionrate, which is controlled by specialised drivers that are available in single and multi-channel versions. With the multichannel versions, special excitation schemes, such aspulsed interleaved excitation (PIE), become possible. Instead of pulsed diode lasers,the upgrade kit can also work with other suitable external pulsed light sources suchas Titanium:Sapphire lasers used in the FV1000MPE for multi-photon excitation. BAll laser heads are included in a unique fibre coupling unit (FCU), that makes itpossible to couple up to four pulsed lasers into a polarisation-maintaining single-mode fibre. The fibre is attached to the FluoView FV1000 via the modified IR port andtherefore ensures an independent and, if necessary, also simultaneous operation ofpulsed and continuous-wave lasers. A single laser head can also be directly coupledto the FluoView FV1000 for an even more compact design. TCSPC data acquisition CThe unique time-correlated single photon counting (TCSPC) data acquisition unitPicoHarp 300 is used for the upgrade kit. This stand-alone unit has a very high tem-poral resolution of 4 ps and is attached to the system computer via a high-speed USBconnection. The data acquisition is done in the unique time-tagged time-resolved(TTTR) mode in which the temporal information of each detected photon is preserved,which allows a very sophisticated offline analysis. Detectors D The upgrade kit can work with one or two special photon-counting detectors ofdifferent types. The detectors are incorporated in a self-contained housing and aretypically attached to the fibre exit port of the FluoView FV1000. The available detec-tors are either single-photon avalanche diodes (SPADs) or photomultiplier tubes (PMTs).The PMTs have a lower detection efficiency than SPADs and are therefore not suitedfor fluorescence correlation spectroscopy, but are highly suited for fluorescence life-time imaging. For measurements that require high detection efficiencies, two typesof SPADs are available for the upgrade kit (PDM Series or SPCM-AQR Series), whichdiffer in their spectral and temporal responses. System software -SymPhoTime EThe data acquisition and analysis software“SymPhoTime”is based on powerful butgeneric TTTR data collection. FCS correlation curves and FLIM images are alreadydisplayed during the data acquisition to permit a quick assessment of the data qualityrespectively lifetime contrast in the sample. The software allows to perform an unli-mited number of analysis steps without losing track of the interdependence and originof their measurement and analysis data. All derived data is maintained in the hierarchicworkspace, including a log file, keeping track of all measurement and analysis steps.The analysis possibilities include fluorescence correlation spectroscopy (FCS), fluores-cence lifetime correlation spectroscopy (FLCS), fluorescence resonance energy trans-fer (FRET) and fluorescence lifetime imaging (FLIM), to name only a few. All data canbe exported to standard formats. A specially developed scripting language evenenables the generation of user-defined analysis routines. Screenshots from the operation andanalysis software suite“SymPhoTime”showing FCS (above) and FLIM analysis(below). Specifications Excitation system - Picosecond pulsed diode lasers with adjustable output power and repetition rates up to 80 MHz inside a fibre coupling unit for up to four laser heads 一-Wavelengths between 375 and 900 nm, pulsed and optional continuous-wave operation -Single or multi-channel laser driver ·Optional: external laser (e.g. Titanium:Sapphire laser) for 2-photon excitation -Easy-to-use and comprehensive Windows system and analysis software - 1-and 2-dimensional data acquisition based on the versatile TTTR file format -Data archiving in workspace, time-gating for all methods, separation of up to four detector signals, data export features - Point measurement analysis: MCS trace, FCS, FCCS, FLCS calculation and fitting, TCSPC histogram and fitting, on/off-state histogram, burst size analysis, FRET histogram incl. pulsed interleaved excitation, photon-counting histogram, lifetime histogram - Imaging measurement analysis: fluorescence intensity images, fluorescence lifetime images, time-gated analysis, TCSPC histogram for region of interest -Scripting language for user-defined data analysis routines The manufacturer reserves the right to make technical changes without prior notice. OLYMPUS Data courtesy of Andreas Herrmann, Humboldt University Berlin, Germany www.olympus-europa.comOLYMPUS LIFE SCIENCEEUROPA GMBHPostfach Hamburg, GermanyWendenstraBe Hamburg, GermanyPhone: + Fax: +-mail: microscopy@olympus-europa.com Fluorescence microscopy is the most fundamental measurement procedure of a laser scanning microscope. In fluorescence microscopy, the intensity of the detected fluorescence emission is used to monitor chemical reactions or to localise the fluorophore in imaging experiments.The fluorescence intensity is, however, not the only parameter that can be monitored. Even more information is available by looking at the temporal characteristics of the fluorescence emission with time-resolved techniques such as fluorescence lifetime imaging (FLIM) or fluorescence correlation spectroscopy (FCS).
确定
还剩6页未读,是否继续阅读?

产品配置单
武汉东隆科技有限公司为您提供《细胞组织、材料、溶液中荧光寿命成像(FLIM),荧光相关光谱(FCS),时间分辨光致发光研究(TRPL)检测方案(共聚焦显微镜)》,该方案主要用于其他中荧光寿命成像(FLIM),荧光相关光谱(FCS),时间分辨光致发光研究(TRPL)检测,参考标准--,《细胞组织、材料、溶液中荧光寿命成像(FLIM),荧光相关光谱(FCS),时间分辨光致发光研究(TRPL)检测方案(共聚焦显微镜)》用到的仪器有荧光寿命共聚焦显微系统升级套件
推荐专场
相关方案
更多