


方案详情
文
Birch, et al., have shown that fluorescence anisotropy-decay in sols with two rotational correlation times can be explained by the existence of silica particles. This interpretation allows monitoring sol-gels in situ with sub-nanometer resolution. Because a fluorophore immobilized in a gel does not de- polarize fluorescence, one can study particle size well after the sol-to-gel transition time, a major advantage over scattering techniques (e.g., with neutrons or X-rays) where gel-scattering distorts the scattering function.
Moreover, the rapid data-acquisition needed to acquire anisotropy-decay data within time-spans as short as a few minutes is aided greatly by the high-repetition rate of the NanoLED excitation sources from HORIBA Jobin Yvon.
方案详情

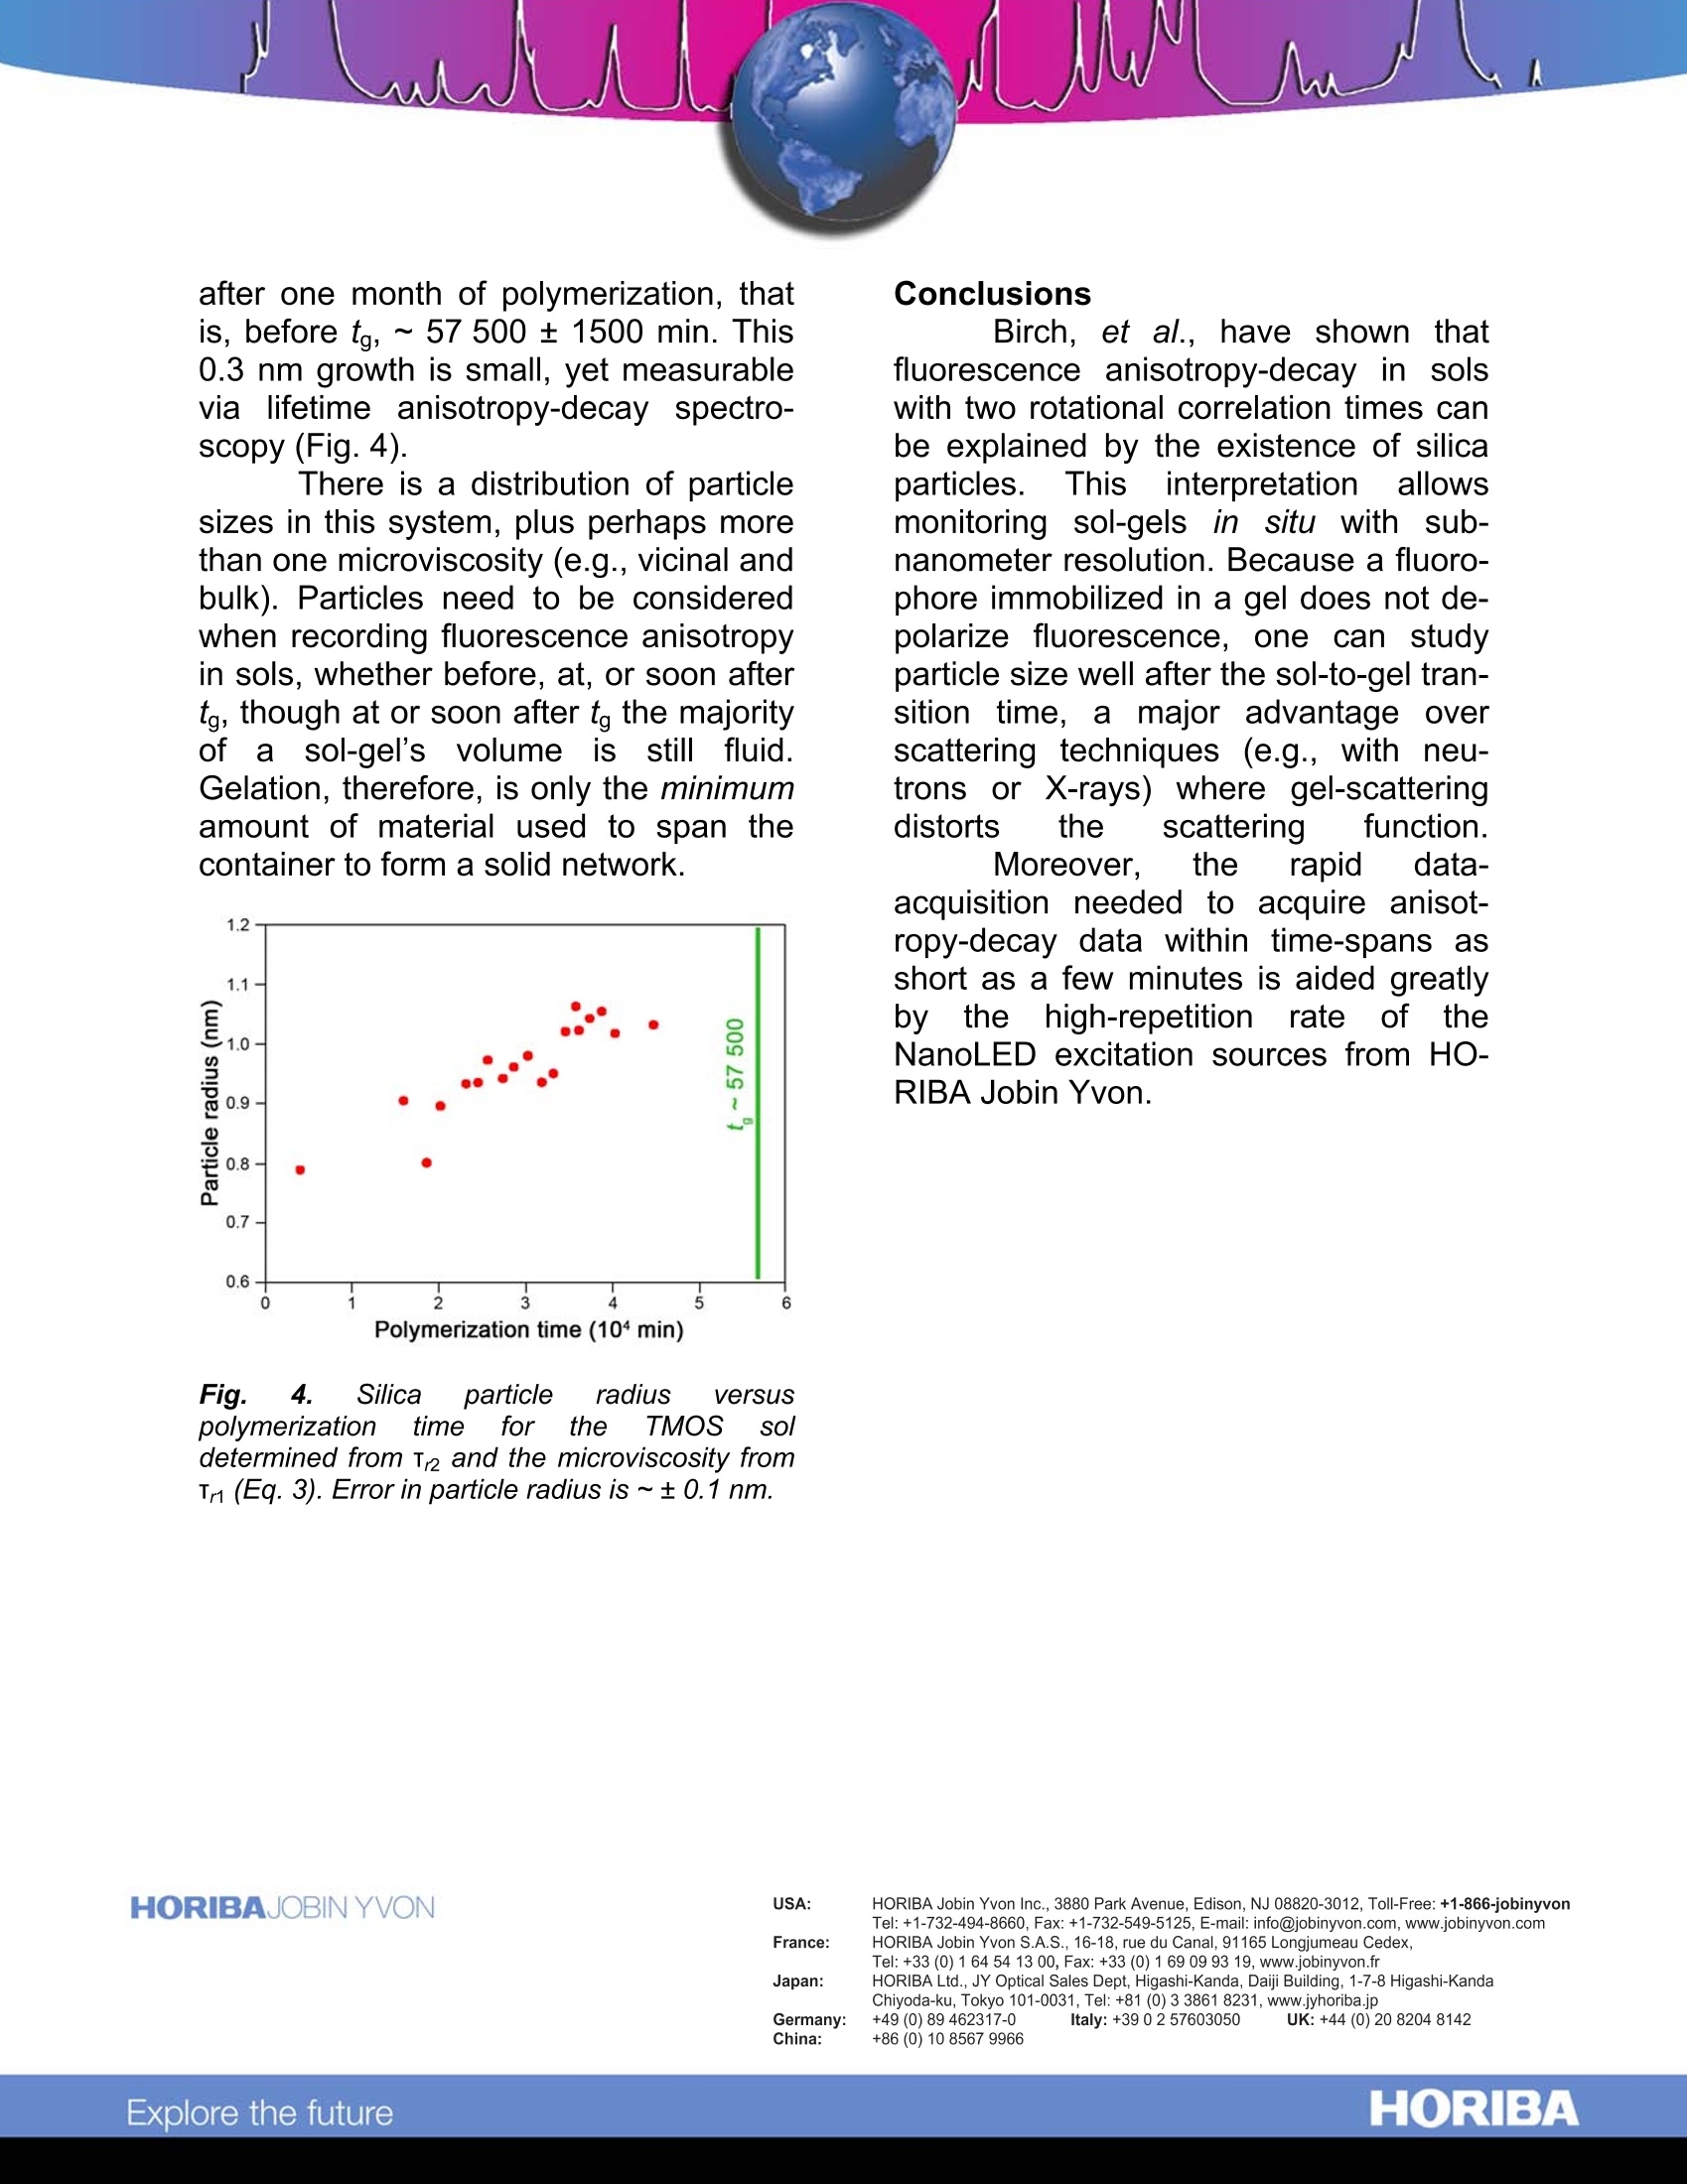
Measuring Silica Nanoparticles via Fluorescence Anisotropy Introduction Silica is currently one of the mostimportant industrial materials,whosenanoparticles are formed via a sol-gelprocess. Theyare non-toxic andcommercially valuable, for they are usedwidely in sensors, scintillation detectors,and household products. Future usesmay involve metabolic sensors anddrug-delivery vehicles. Measuring thesize of silica nanoparticles and pores isstill difficult and unreliable, despite themultibillion-dollarproduction1 of :silicaworldwide. In a sol-gel process, the sol, aliquidlike solution, is converted viaaananoparticle colloid stage into a gel, ahighly porous structure filled with sol-vent. Drying the gel can produce solidglass for photonics and sensors and,whenground finely, ascleansers.polishers.,adhesives. and printingagents. The molecular details of struc-ture and dynamics for sol-gel formationare still poorly understood. In this Technical Note, Dr. DavidBirch1 and colleagues at StrathclydeUniversity in Scotland examined the for-s1mation of silica gels. ( D . B i rch a n d C.D. Geddes, “Sol-gel particlegrowth s tudied u sing fluorescence anisotropy:An alternative to scattering techniques”, P hys.Rev. E 62(2), 2000, 2977-2980; C.D. Geddes, D. Birch, “ Nanometre re s olution of silica hy- drogel formation using t ime-resolved f luores- cence anisotropy" , J . N on-Cryst. Sol. 270(2000), 191-204; C .D. Geddes, e t a l ., “ 1- and 2 -Photon Fluorescence Anisotropy Decayin Silicon Alkoxide Sol-Gels: Interpretation i n Terms o f Self-assembled Nanoparticles", J. Phys. Chem. B 2002 (106)3835-3841; J . j . Karolin, e t a l., “Nanoparticle metrology in so l - ) Theory Fluorescence spectroscopycanuncoverr molecular structure anddynamics of sol-gels. A fluorophore'sRrr IISASBrownian rotation causes fluorescencedepolarization, and provides informationon local mobility of the fluorophore. Thechangesinsteady-state ortime-resolved anisotropy observed duringsol-gel polymerization from initial mixingto beyond the sol-to-gel transition, tg, arerelated to viscosity. Anisotropy,(r), is defined as where G, the“G factor,” is /Hv,/HH, lvv,and lvh are intensities for therelative polarizer orientations Horizontaland Vertical. Four measurements of in-tensity, permutations of the polarizers’orientations,are needed to determine(r). Fig. 1 shows the method. Anisotropy provides informationon molecular size and shape, local vis-cosities of a fluorophore's environment,and changes in sizes of polymers andother macromolecules. Thus anisotropymeasurements are ideal for examiningthe sol-gel process. ( gels using m ultiphoton e xcited f luorescence", Meas. Sci. Technol. 1 3 (2002) 21-27. ) ( 2 "J Joseph R . Lackowicz, P r inciples o f F luores- cence i Spectroscopy , 3d ed... New York. Springer, 2006, pp.353-354,361-364. ) Polarizer rotated between horizontal and vertical Fig. 1. Experimental set-up. Vertical (V) andhorizontal (H) orientations of the polarizer areshown. The NanoLED's output is itself polarized,thus it may be rotated to give H and V orienta-tions. The anisotropy with respect totime, r(t), for silica hydrogels is best de-scribed with two rotational correlationtimes, Tr and Tr2, written as where ro is the initial anisotropy, and f isthe fraction of fluorescence caused byfluorophores bound to silica. Therefore1 - f is the fraction of free fluorophore inthe sol. From the Stokes-Einstein equa-tion, Tr gives the sol’s microviscosity n= 3Tr1kT/4mrr, where r is the hydrody-namic radius of the dye. Using n1 and Tr2gives the silica particle's mean hydrody-namic radius. If the fluorescence lifetime, Tr, ismuch faster than Tr2, the anisotropy de-cay is analogous to the hindered rota-tion of a fluorophore in a membrane orprotein. This gives a residual anisotropy, Experimental method Fluorescence anisotropy-decaycurves were collected using our time- correlated single-photon counting(TCSPC) FluoroCube lifetime spectro-fluorometer (Fig.2). Overall instrumentalresponse was3~100 ps FWHM. Two-photon-excited rhodamine 6G (R6G)fluorescence was chosen via a 800-nmcutoff filter, removing the laser’s fun-damental. Laser power-dependence ofthe fluorescence confirmeditstwo-photon nature. Fig..2. The FluoroCube TCSPC/lifetimespectrofluorometer. For the time-resolved one-photon-excitedftluorescence experi-ments, a Ti:sapphire crystal generatedwhite light. A 500 ± 10 nm interferencefilter selected the excitation. Fluores-cence emission was observed through a550-nm long-pass ffilter.. The temper-ature was held to 20 ± 1C. Typicalmeasurement times for the anisotropydecay were ~30 min, in order to accu-mulate a maximum count per channel of10 000-20000 in the difference functionlvv-G*lvH. Impulse reconvolution analysis offluorescence anisotropy-decaysvwasperformed using our IBHsoftware.Magic-angle polarization,54.7°, was chosen for all R6G fluorescence lifetimemeasurements. Results Table 1.. Two-photon anisotropy-decayanalysis. Polymerization Tr1/ps TTr2/ns ro time (min) 3986 347 0.971 0.501 1.12 15941 340 1.42 0.488 1.21 18611 345 1.01 0.512 1.23 20176 280 1.14 0.506 1.14 23156 319 1.48 0.490 1.44 24546 298 1.39 0.546 1.20 25656 319 1.67 0.534 1.26 27376 364 1.73 0.530 1.15 28626 289 1.46 0.481 30231 296 1.59 0.540 1.27 31836 330 1.54 0.514 0.97 33156 381 1.86 0.540 1.19 34566 293 1.77 0.502 1.32 35766 319 2.18 0.498 1.15 36131 258 1.57 0.495 37371 298 1.92 0.501 1.35 38751 313 2.09 0.453 1.42 40266 318 1.91 0.489 1.17 44706 297 1.85 0.488 1.24 Data for R6G, with two rotational times, for a~22% SiO2, pH= 2.3 TMOS sol-gel. Aexc = 800nm. Two-photon excited anisotropy-decay gives enhanced dynamic range ofro. Analysis using two rotational cor-relation times (Eq. 3) is shown in Table1. Note the excellentxvalues. Fig.2A recanypresents a typical impulse reconvolutionfit of Eq. 3 for one data set during thetetramethyl orthosilicate (TMOS) alcogelpolymerization. The two-correlation-timemodel was more appropriate than onecorrelation time. Adding an additional gterm for dye fixed in a gel gave nosignificant improvement inX. One-photon excited anisotropy-decay curves are shown in Fig.3, thistime for a hydrogel prepared fromsodium silicate. For all these curves, fitting to Eq. 3 gave a better fit (smaller). Eq. 3 provided ro values closest tothe theoreticalI maximuumm (0.4) andconstant as fincreased with time. Fig. 2. Impulse reconvolution fit of two rotationaltimes to the data for the R6G-doped TMOS solafter a polymerization time of 40 266 min, usingtwo-photon excitation at 800 nm. The prompt(<100 ps FWHM) and weighted residuals arealso shown. Channel width=8.7 ps. Fig. 3. Fluorescence anisotropy-decay curvesversus polymerization time fora 15.3% SiO and0.27 N sodium silicate hydrogel. Discussion The TMOS sol’s particle radiusincreased from 0.8 nm to nearly 1.1 nm after one month of polymerization, thatis, before tg, ~57 500 ±1500 min. This0.3 nm growth is small, yet measurablevia lifetime anisotropy-decay spectro-scopy (Fig.4). There is a distribution of particlesizes in this system, plus perhaps morethan one microviscosity (e.g., vicinal andbulk). Particles need to be consideredwhen recording fluorescence anisotropyin sols, whether before, at, or soon aftertg, though at or soon after tg the majorityof a sol-gel’s volumeiss sstill‘fluid.Gelation, therefore, is only the minimumamount of material used to span thecontainer to form a solid network. Fig. 4. Silica particle radius versuspolymerization time forrthe TMOSso/determined from Tr and the microviscosity fromTn (Eq. 3). Error in particle radius is ~±0.1 nm. Birch, et al., have shown thatfluorescence anisotropy-decay in solswith two rotational correlation times canbe explained by the existence of silicaparticles.Thisinterpretaattiioonn allowsmonitoring sol-gels in situ with sub-nanometer resolution. Because a fluoro-phore immobilized in a gel does not de-polarize fluorescence, one can studyparticle size well after the sol-to-gel tran-sition time, a major advantage overscattering techniques (e.g., withneu-trons or X-rays) where gel-scatteringdistorts the scatterina function. Moreover. the rapid Qdata- acquisition needed to acquire anisot- ropy-decay data within time-spans as short as a few minutes is aided greatly by the high-repetition rate: ofthe NanoLED excitation sources from HO- RIBA Jobin Yvon. HORIBAExplore the future Birch, et al., have shown that fluorescence anisotropy-decay in sols with two rotational correlation times can be explained by the existence of silica particles. This interpretation allows monitoring sol-gels in situ with sub-nanometer resolution. Because a fluorophore immobilized in a gel does not de- polarize fluorescence, one can study particle size well after the sol-to-gel transition time, a major advantage over scattering techniques (e.g., with neutrons or X-rays) where gel-scattering distorts the scattering function.Moreover, the rapid data-acquisition needed to acquire anisotropy-decay data within time-spans as short as a few minutes is aided greatly by the high-repetition rate of the NanoLED excitation sources from HORIBA Jobin Yvon.
确定


还剩2页未读,是否继续阅读?

产品配置单

HORIBA(中国)为您提供《硅纳米颗粒中荧光各向异性研究检测方案(分子荧光光谱)》,该方案主要用于其他中荧光各向异性研究检测,参考标准--,《硅纳米颗粒中荧光各向异性研究检测方案(分子荧光光谱)》用到的仪器有HORIBA荧光寿命测试系统
推荐专场
相关方案
更多
该厂商其他方案
更多