


方案详情
文
Particle size and composition can control quantum confinement. QDs may assist deep-tissue molecular imaging in living systems, because of their near-IR and far-red fluorescence away from aqueous absorption. QDs also provide absorption coefficients much larger than typical organic dyes. The ultrasensitive FluoroMax spectrofluorometer is useful for research related to nanostructures and materials science.
方案详情

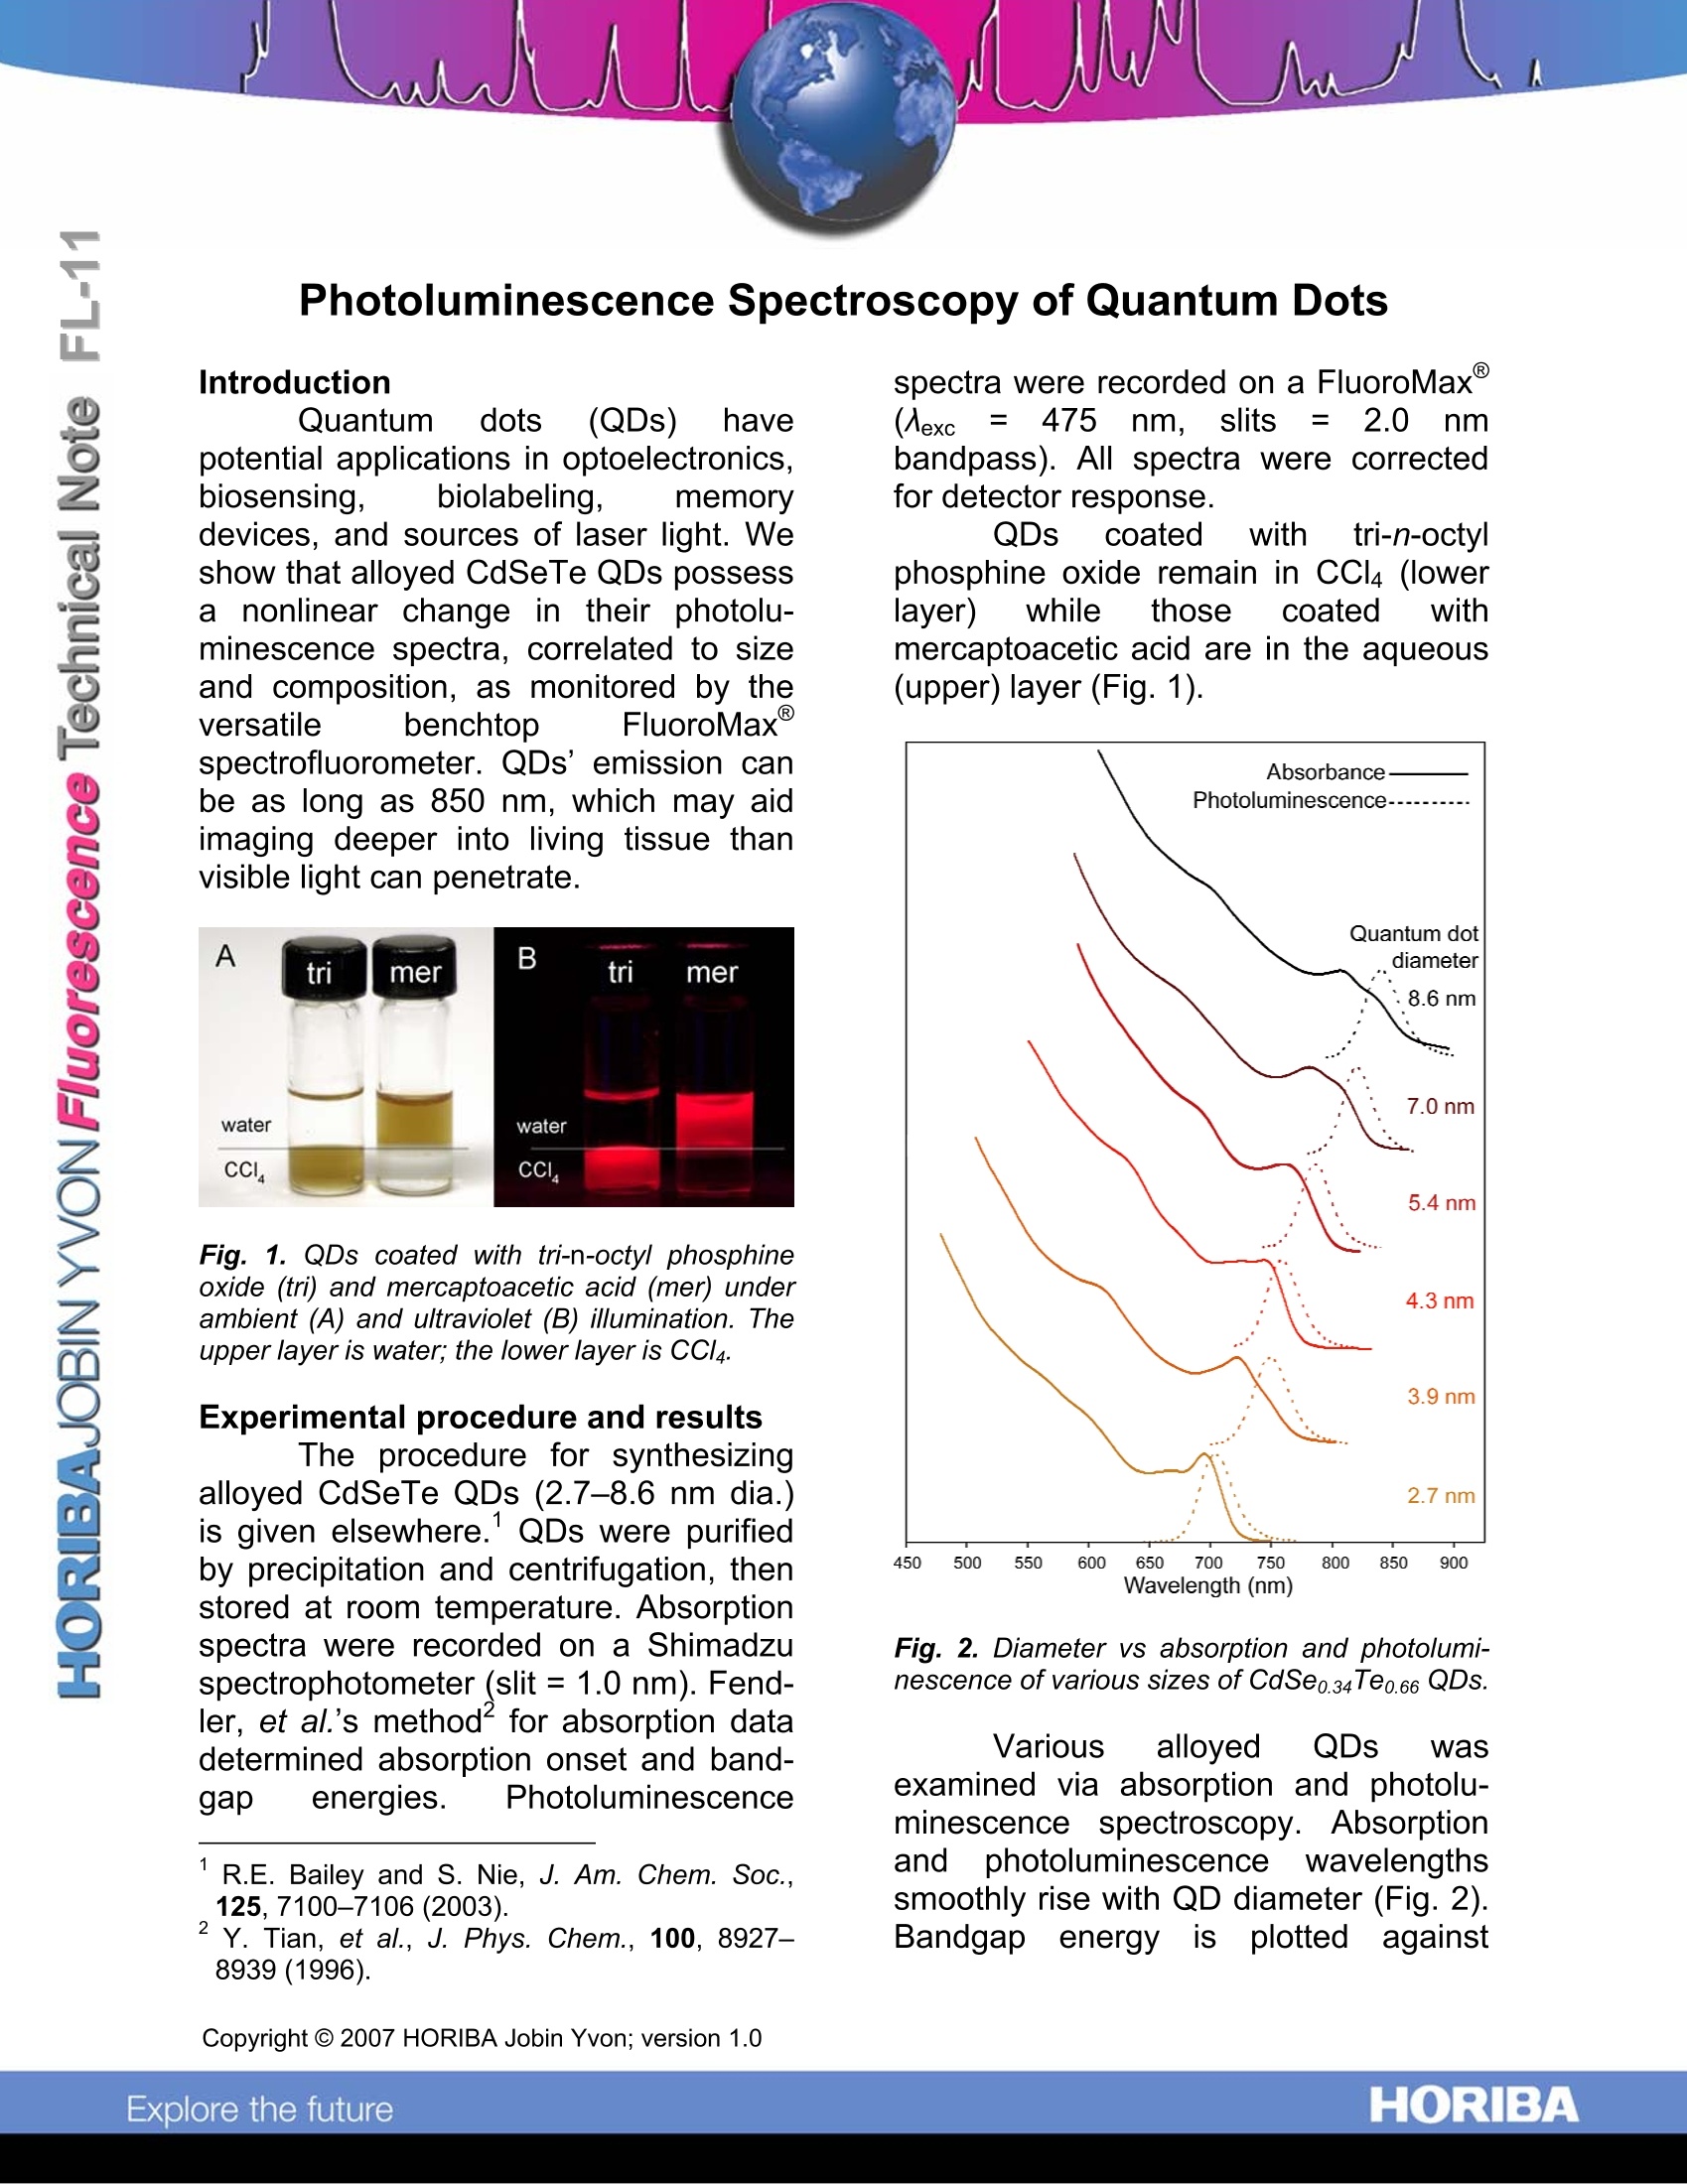
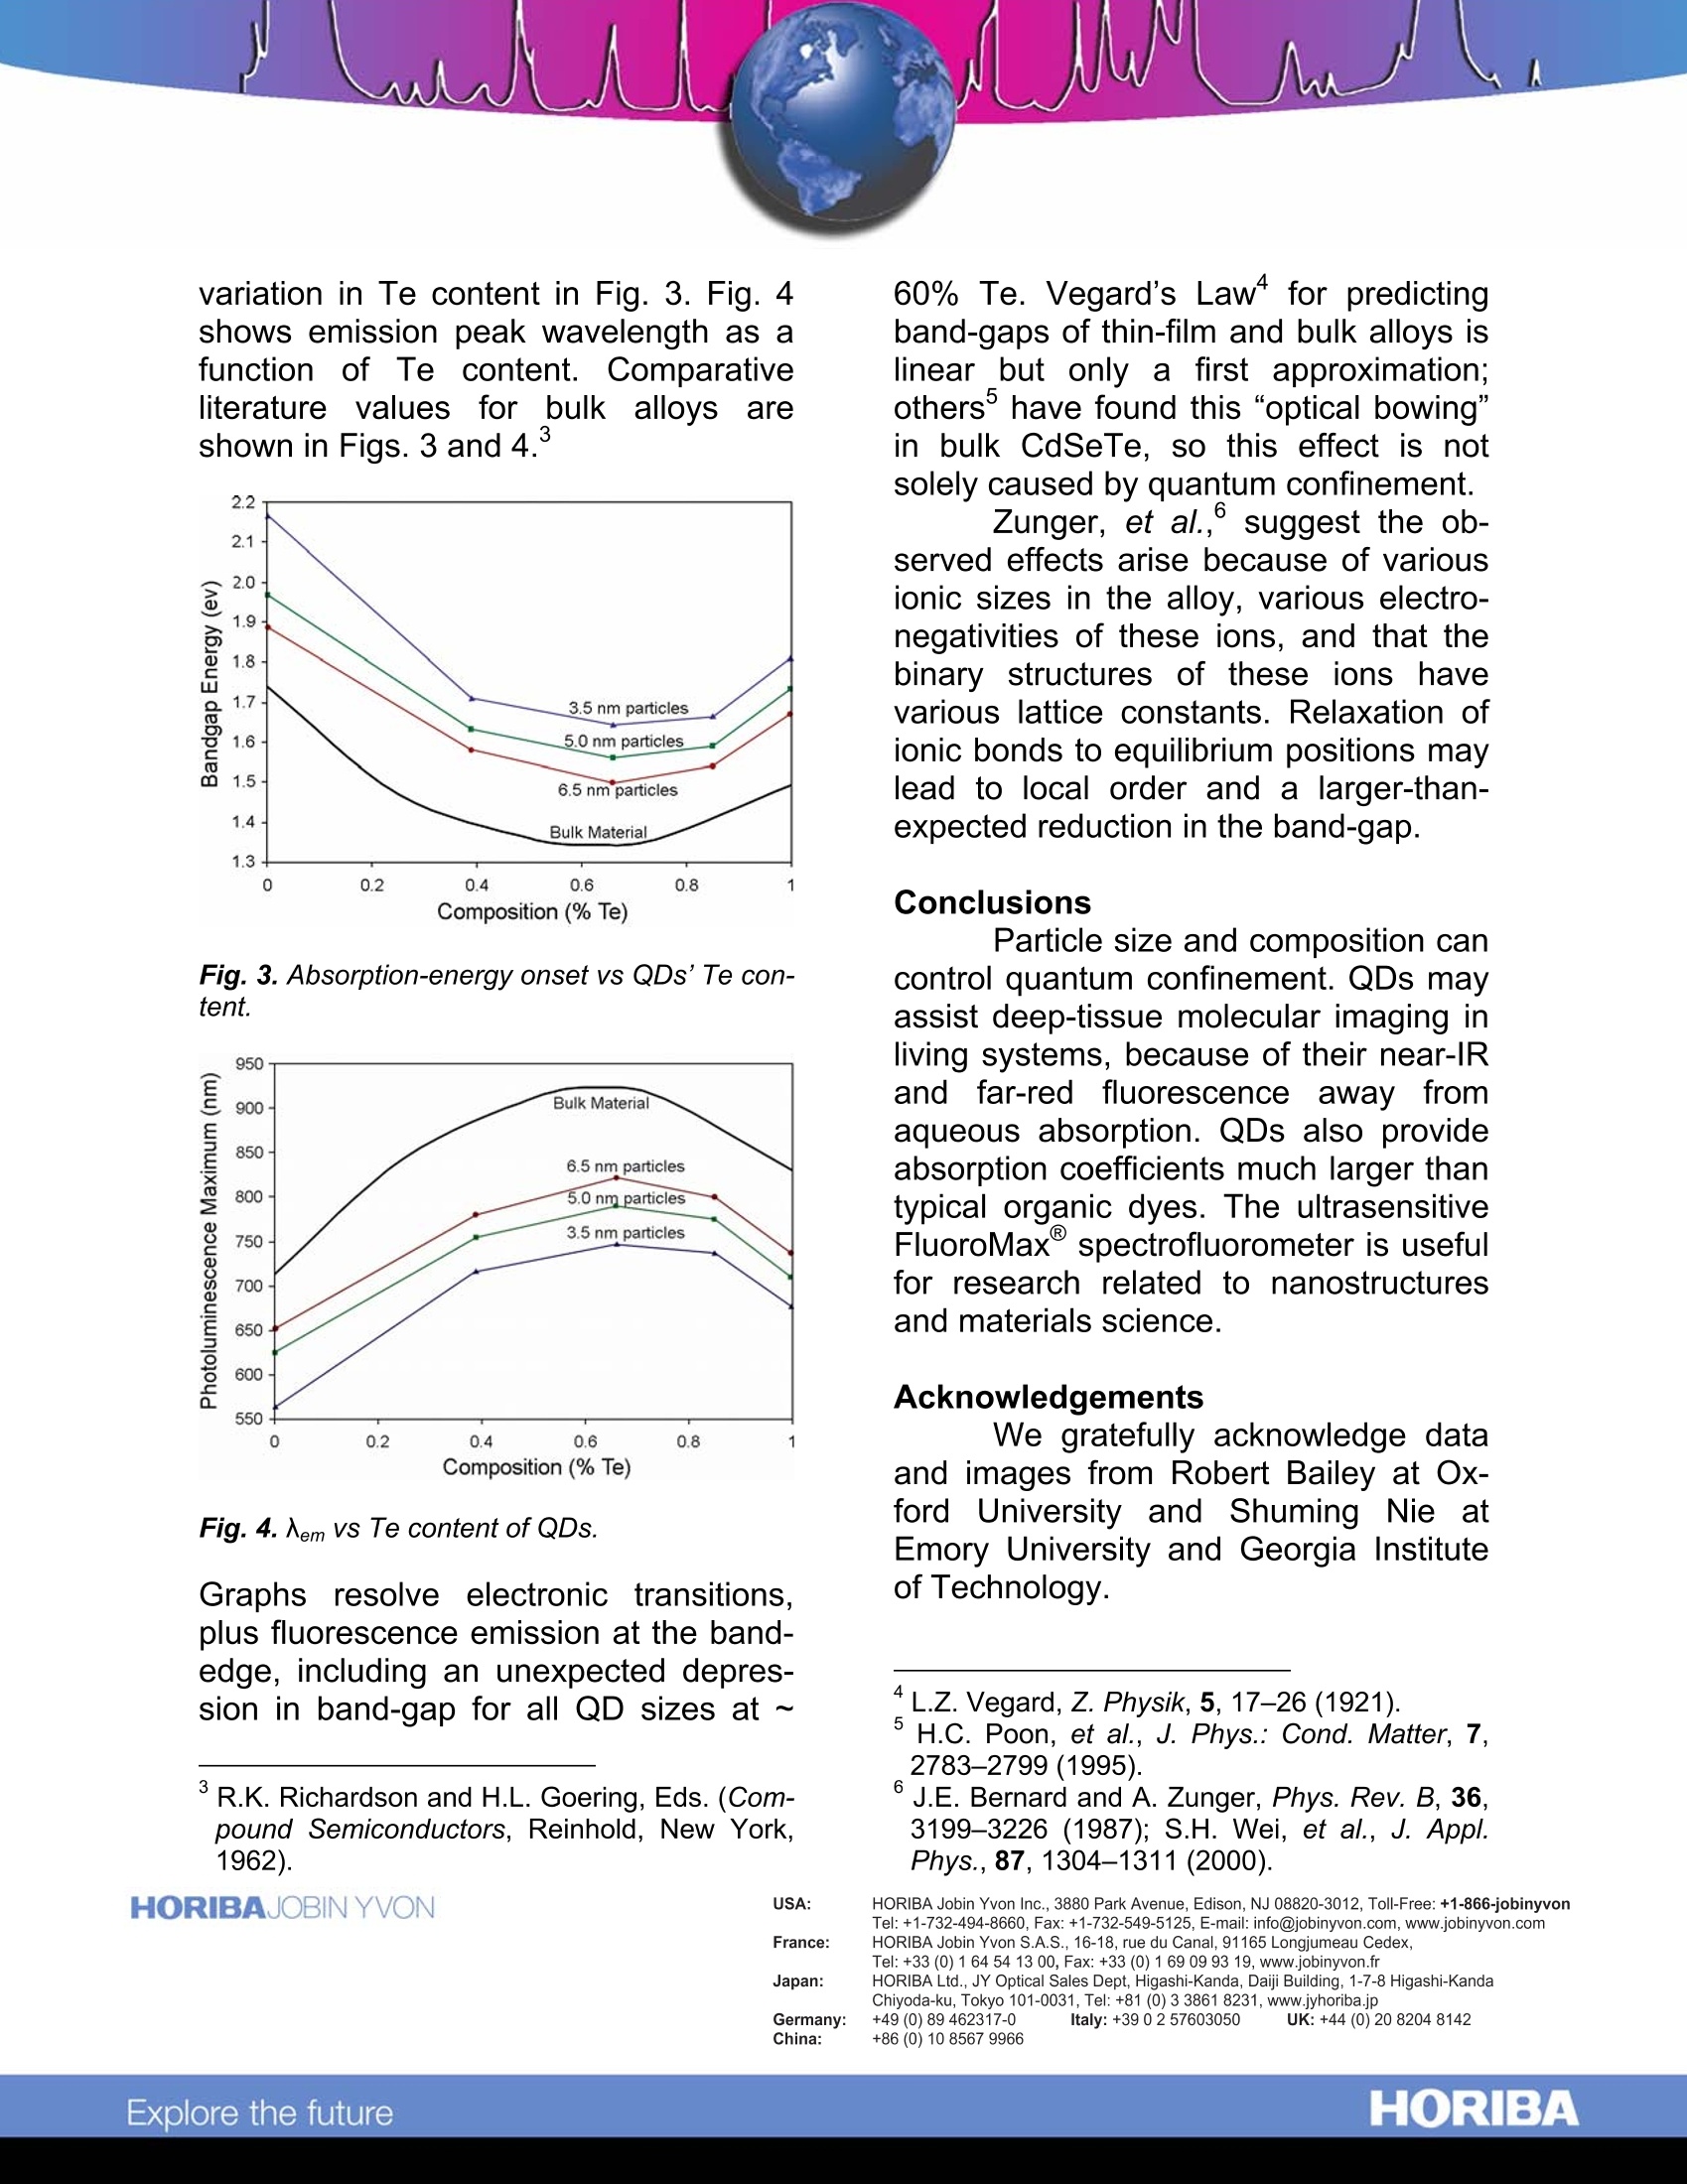
Photoluminescence Spectroscopy of Quantum Dots Introduction Quantum dots(QDs) havepotential applications in optoelectronics,biosensing, biolabeling, memorydevices, and sources of laser light. Weshow that alloyed CdSeTe QDs possessa nonlinear change in their photolu-minescence spectra, correlated to sizeand composition, as monitored by theversatile benchtop FluoroMaxspectrofluorometer. QDs’emission canbe as long as 850 nm, which may aidimaging deeper into living tissue thanvisible light can penetrate. Fig. 1. QDs coated with tri-n-octyl phosphineoxide (tri) and mercaptoacetic acid (mer) underambient (A) and ultraviolet (B) illumination. Theupper layer is water; the lower layer is CCl4. Experimental procedure and results The procedure for synthesizingalloyed CdSeTe QDs (2.7-8.6 nm dia.)is given elsewhere.QDs were purifiedby precipitation and centrifugation, thenstored at room temperature. Absorptionspectra were recorded on a Shimadzuspectrophotometer (slit =1.0 nm). Fend-ler, et al.’s methodfor absorption datadetermined absorption onset and band-gap energies. Photoluminescence ( R.E. Bailey and S. Nie, J . Am. C hem. S o c., 125,7100-7106(2003). ) ( Y . T i an, e t al., J. Phys. Chem., 1 00, 8927- 8939(1996). ) spectra were recorded on a FluoroMax(Aexc二 4755 nm, slits = 2.0 nmbandpass). All spectra were correctedfor detector response. QDs coated with tri-n-octylphosphine oxide remain in CCl4 (lowerlayer) while those(coated withmercaptoacetic acid are in the aqueous(upper) layer (Fig. 1). Fig. 2. Diameter vs absorption and photolumi-nescence of various sizes of CdSe0.34Te0.66 QDs. Various alloyed QDs wasexamined via absorption and photolu-minescence spectroscopy. Absorptionand photoluminescence wavelengthssmoothly rise with QD diameter (Fig. 2).Bandgapp energyi:isSIplottedagainst variation in Te content in Fig. 3. Fig. 4shows emission peak wavelength as afunction of Te content. Comparativeliterature values for bulk alloys areshown in Figs. 3 and 4. Fig.3. Absorption-energy onset vs QDs’Te con-tent. Fig. 4. em vs Te content of QDs. Graphs resolve electronic transitions,plus fluorescence emission at the band-edge, including an unexpected depres-sion in band-gap for all QD sizes at ~ ( R.K. Richardson a n d H . L. Goering, E ds. (Com-pound S emiconductors, R einhold, N ew Y o rk,1962). ) 60% Te. Vegard’s Law" for predictingband-gaps of thin-film and bulk alloys islinear but only a first approximation;others’ have found this “optical bowing”in bulk CdSeTe, so this effect is notsolely caused by quantum confinement. Zunger, et al., suggest the ob-served effects arise because of variousionic sizes in the alloy, various electro-negativities of these ions, and that thebinary structures of these ions havevarious lattice constants. Relaxation ofionic bonds to equilibrium positions maylead to local order and a larger-than-expected reduction in the band-gap. Conclusions Particle size and composition cancontrol quantum confinement. QDs mayassist deep-tissue molecular imaging inliving systems, because of their near-IRand far-red fluorescence away tfromaqueous absorption. QDs also provideabsorption coefficients much larger thantypical organic dyes. The ultrasensitiveFluoroMax spectrofluorometer is usefulfor research related to nanostructuresand materials science. Acknowledgements We gratefully acknowledge dataand images from Robert Bailey at Ox-ford University and Shuming Nie atEmory University and Georgia Instituteof Technology. ( *L.Z. Vegard, Z . Physik, 5, 17-26(1921). ) ( 5 ' H .C. P oon, e t a l ., J . P hys.: C ond. M a tter, 7 , 2783-2799(1995). ) 'J.E. Bernard and A. Zunger, Phys. Rev. B, 36,3199-3226 (1987); S.H. Wei, et al., J. Appl.Phys.,87, 1304-1311 (2000). ( USA: H ORIBA Jobin Yvon In c ., 3 8 80 Park Avenue, Edison, NJ 08 8 20-3012, Toll-Free:+1 - 866-jobinyvon Tel: +1-732-494-8660, F ax: + 1 - 732-549-5125, E - mail: info@jobinyvon.com,www.jobinyvon.com ) ( France: H ORIBA Jobin Yvon S . A . S., 1 6-18, rue du Canal , 9116 5 Longjumeau Cedex, T el: +33 ( 0) 1 64 54 1 3 0 0, Fax: +33 (0) 1 69 09 9 3 1 9, w ww.jobinyvon.fr Japan: H ORIBA Ltd., J Y Optical Sales Dept, Hig a s h i-Kanda, Daij i Building, 1-7-8 Higashi-Kanda ) HORIBAExplore the future HORIBAJOBIN YVONChina:HORIBAExplore the future Particle size and composition can control quantum confinement. QDs may assist deep-tissue molecular imaging in living systems, because of their near-IR and far-red fluorescence away from aqueous absorption. QDs also provide absorption coefficients much larger than typical organic dyes. The ultrasensitive FluoroMax spectrofluorometer is useful for research related to nanostructures and materials science.
确定
还剩1页未读,是否继续阅读?

产品配置单

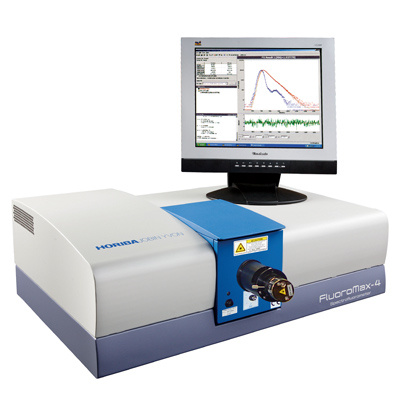
HORIBA(中国)为您提供《量子点中光致发光谱检测方案(分子荧光光谱)》,该方案主要用于其他中光致发光谱检测,参考标准--,《量子点中光致发光谱检测方案(分子荧光光谱)》用到的仪器有HORIBA高灵敏一体式FluoroMax-4荧光光谱仪
推荐专场
相关方案
更多
该厂商其他方案
更多