


方案详情
文
Fluorescence spectroscopy is an analytical technique with high sensitivity and selectivity. By characterizing the components in the EV-coat solution with fluorescence, a detailed analytical profile can be formed for each component. This can help trace the source of errors in the EV-coat solution, and contribute to selection of the best formulation. Quality-control tests can be performed periodically to check for consistent bath composition.
方案详情

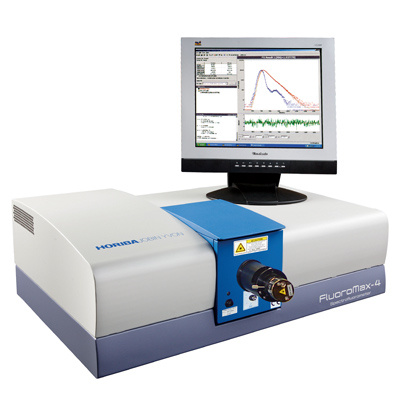
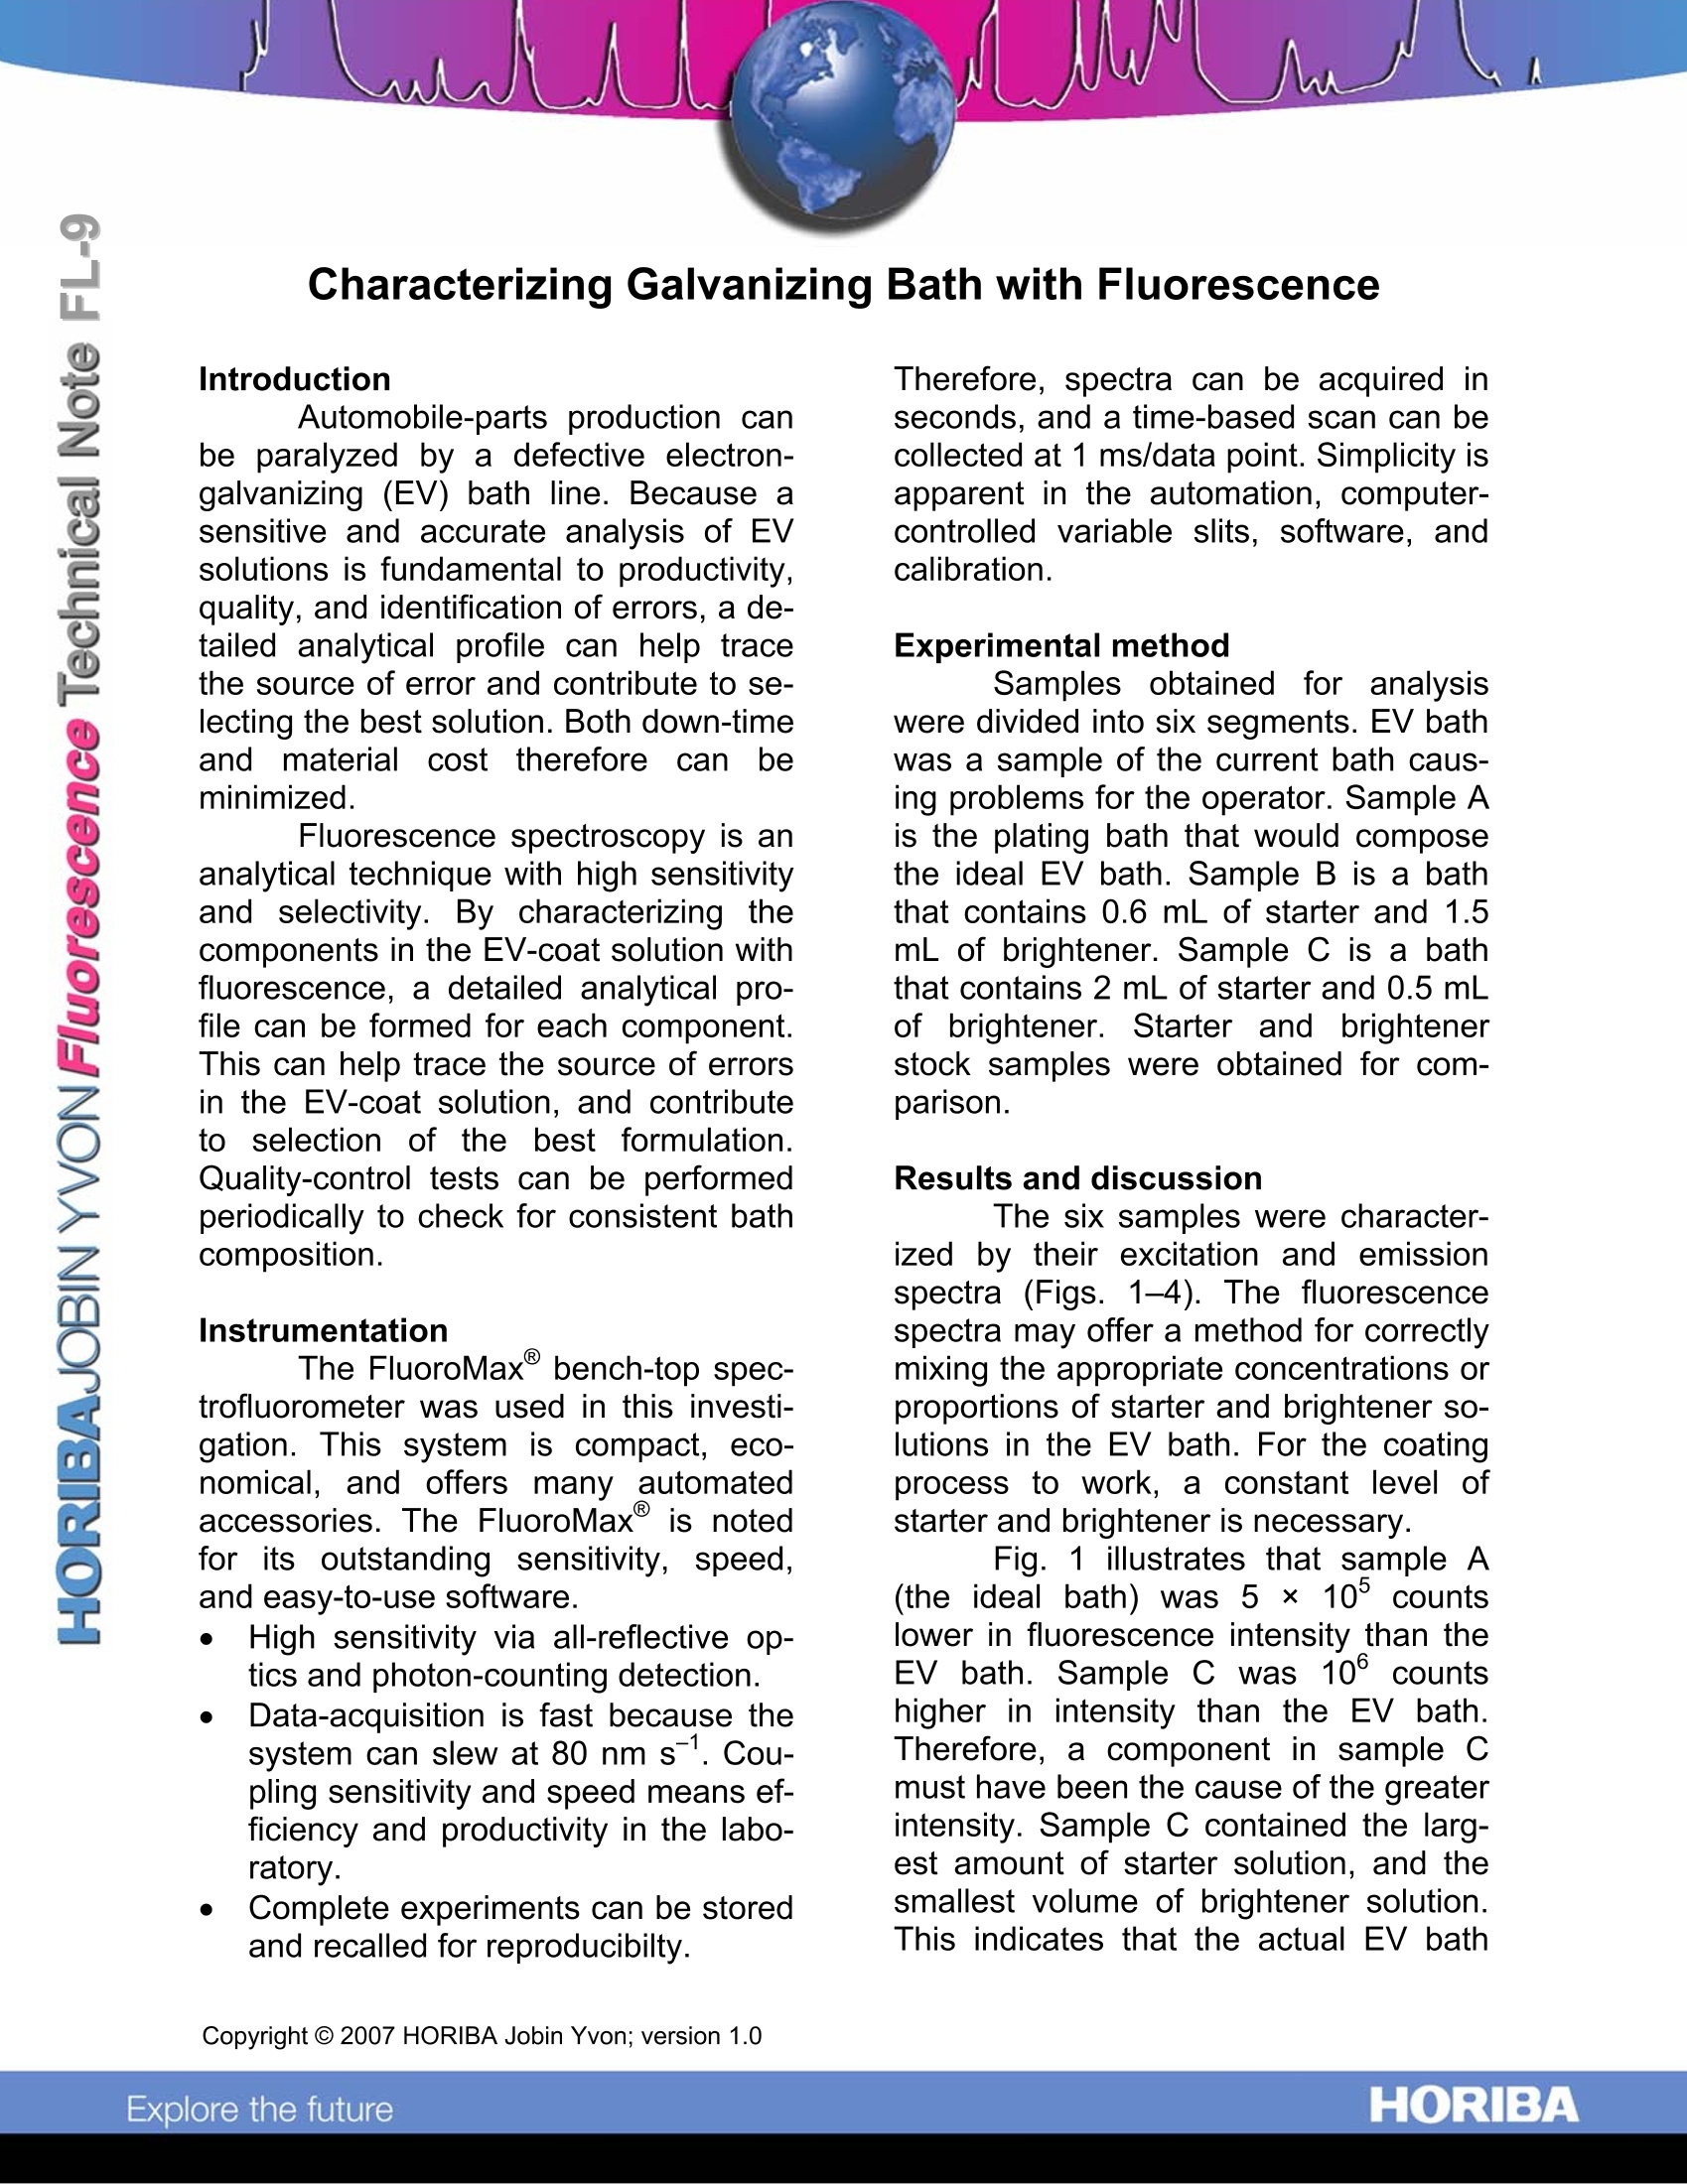
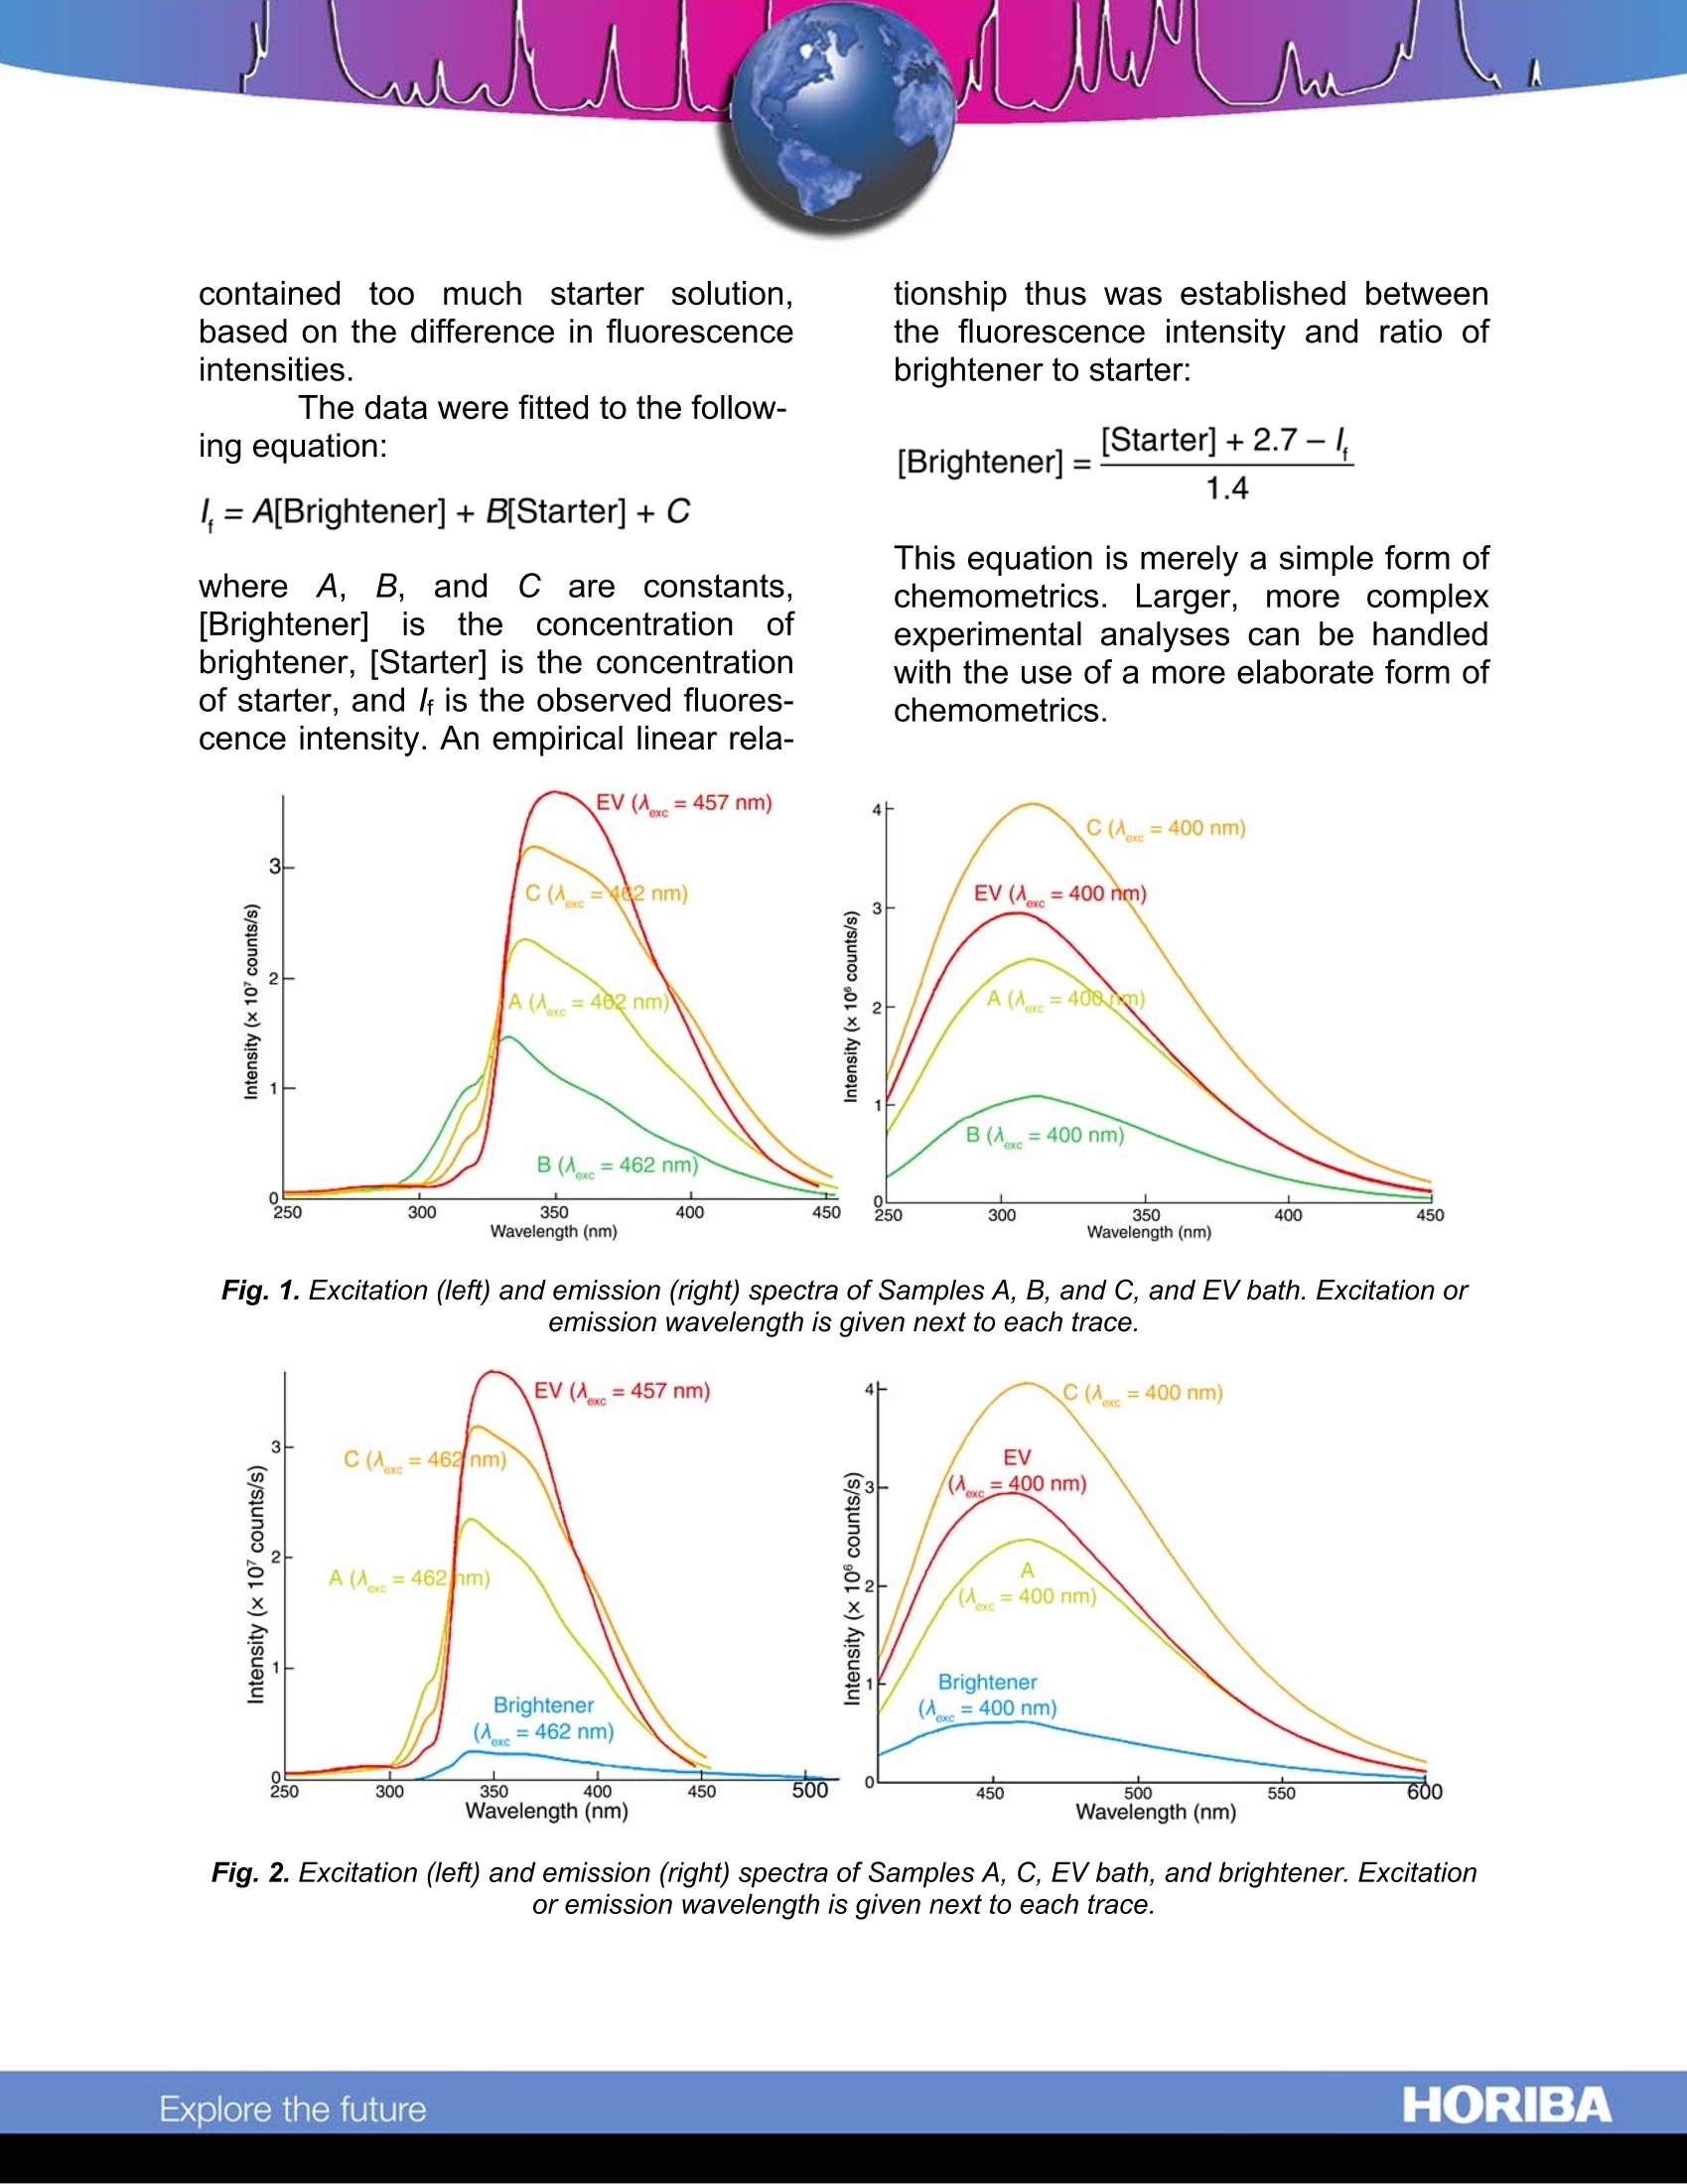
Characterizing Galvanizing Bath with Fluorescence Introduction Automobile-parts production canbe paralyzed by a defective electron-galvanizing (EV) bath line. Because asensitive and accurate analysis of EVsolutions is fundamental to productivity,quality, and identification of errors, a de-tailed analytical profile can help tracethe source of error and contribute to se-lecting the best solution. Both down-timeand material costtherefore canbeminimized. Fluorescence spectroscopy is ananalytical technique with high sensitivityand selectivity. By characterizing thecomponents in the EV-coat solution withfluorescence, a detailed analytical pro-file can be formed for each component.This can help trace the source of errorsin the EV-coat solution, and contributeto selection of the best formulation.Quality-control tests can be performedperiodically to check for consistent bathcomposition. Instrumentation The FluoroMax bench-top spec-trofluorometer was used in this investi-gation. This system is compact, eco-nomical, and offers many automatedaccessories. The FluoroMax is notedfor its outstanding sensitivity, speed,and easy-to-use software. High sensitivity via all-reflective op-tics and photon-counting detection. ●Data-acquisition is fast because thesystem can slew at 80 nm s. Cou-pling sensitivity and speed means ef-ficiency and productivity in the labo-ratory. ●Complete experiments can be storedand recalled for reproducibilty. Therefore, spectra can be acquired inseconds, and a time-based scan can becollected at 1 ms/data point. Simplicity isapparent in the automation, computer-controlled variable slits, software, andcalibration. Experimental method Samples obtained ifor analysiswere divided into six segments. EV bathwas a sample of the current bath caus-ing problems for the operator. Sample Ais the plating bath that would composethe ideal EV bath. Sample B is a baththat contains 0.6 mL of starter and 1.5mL of brightener. Sample C is a baththat contains 2 mL of starter and 0.5 mLof brightener.Starter and brightenerstock samples were obtained for com-parison. Results and discussion The six samples were character-ized by their excitation and emissionspectra (Figs. 1-4). The fluoresc cespectra may offer a method for correctlymixing the appropriate concentrations orproportions of starter and brightener so-lutions in the EV bath. For the coatingprocess to work, a constant level ofstarter and brightener is necessary. Fig. 1 illustrates that sample A(the ideal bath) was 5 × 10⁵ countslower in fluorescence intensity than theEV bath. Sample C was10° countshigher in intensity than the EV bath.Therefore, a component in sample Cmust have been the cause of the greaterintensity. Sample C contained the larg-est amount of starter solution, and thesmallest volume of brightener solution.This indicates that the actual EV bath contained too much starter solution.based on the difference in fluorescenceintensities. tionship thus was established betweenthe fluorescence intensity and ratio ofbrightener to starter: The data were fitted to the follow-ing equation: where A, B, and C are constants,[Brightener] is the concentration1ofbrightener, [Starter] is the concentrationof starter, and If is the observed fluores-cence intensity. An empirical linear rela- This equation is merely a simple form ofchemometrics. Larger, more complexexperimental analyses can be handled. with the use of a more elaborate form ofchemometrics. Fig. 1. Excitation (left) and emission (right) spectra of Samples A, B, and C, and EV bath. Excitation oremission wavelength is given next to each trace. Fig. 2. Excitation (left) and emission (right) spectra of Samples A, C, EV bath, and brightener. Excitationor emission wavelength is given next to each trace JUU Fig. 3. Excitation (left) and emission (right) of Samples A, C,and a 100-fold dilution of starter solution.Excitation or emission wavelength is given next to each trace. Fig. 4. Excitation (left) and emission (right) spectra of of stock solution of brightener and 100-fold dilutionof starter. Excitation or emission wavelength is given next to each trace. ( USA: H ORIBA Jobin Yvon In c ., 3 8 80 Park Avenue, Edison, NJ 08 8 20-3012, Toll-Free:+1 - 866-jobinyvon Tel: +1-732-494-8660, F ax: + 1 - 732-549-5125, E - mail: info@jobinyvon.com,www.jobinyvon.com France: H ORIBA Jobin Yvon S . A . S., 1 6-18, rue du Canal , 9116 5 Longjumeau Cedex, ) ( T el: +33 ( 0) 1 6 4 54 1 3 0 0 , Fax: + 33 (0) 1 69 09 9 3 1 9 , w w w.jobinyvon.fr Japan: H ORIBA Ltd., J Y Optical Sales Dept, Hig a s h i-Kanda, Daij i Building, 1-7-8 Higashi-Kanda ) ( Chiyoda-ku, T okyo 1 0 1-0031, T e l: +81 (0) 3 3861 8231, www.jyhoriba.jp Germany: +49(0)89462317-0 I taly:+39 0 2 57603050 U K:+44 (0) 20 8204 8142 China: ) Copyright C HORIBA Jobin Yvon; version .HORIBAExplore the future HORIBAExplore the future Fluorescence spectroscopy is an analytical technique with high sensitivity and selectivity. By characterizing the components in the EV-coat solution with fluorescence, a detailed analytical profile can be formed for each component. This can help trace the source of errors in the EV-coat solution, and contribute to selection of the best formulation. Quality-control tests can be performed periodically to check for consistent bath composition.
确定

还剩2页未读,是否继续阅读?

产品配置单

HORIBA(中国)为您提供《镀锌浴中荧光强度检测方案(分子荧光光谱)》,该方案主要用于其他中荧光强度检测,参考标准--,《镀锌浴中荧光强度检测方案(分子荧光光谱)》用到的仪器有HORIBA高灵敏一体式FluoroMax-4荧光光谱仪
推荐专场
相关方案
更多
该厂商其他方案
更多