


This opens the door to a rapid and non-destructive characterization technique, an alternative to wet chemical methods which may be costly, time consuming, and require sample preparation. This would also allow more systematic control of foodstuffs on a wide range of analysis, giving rapid indications about food quality, origin and potential adulteration of products. The use of a single instrument provides information on bulk scale (including the transmission option) as well as on microscale.
方案详情

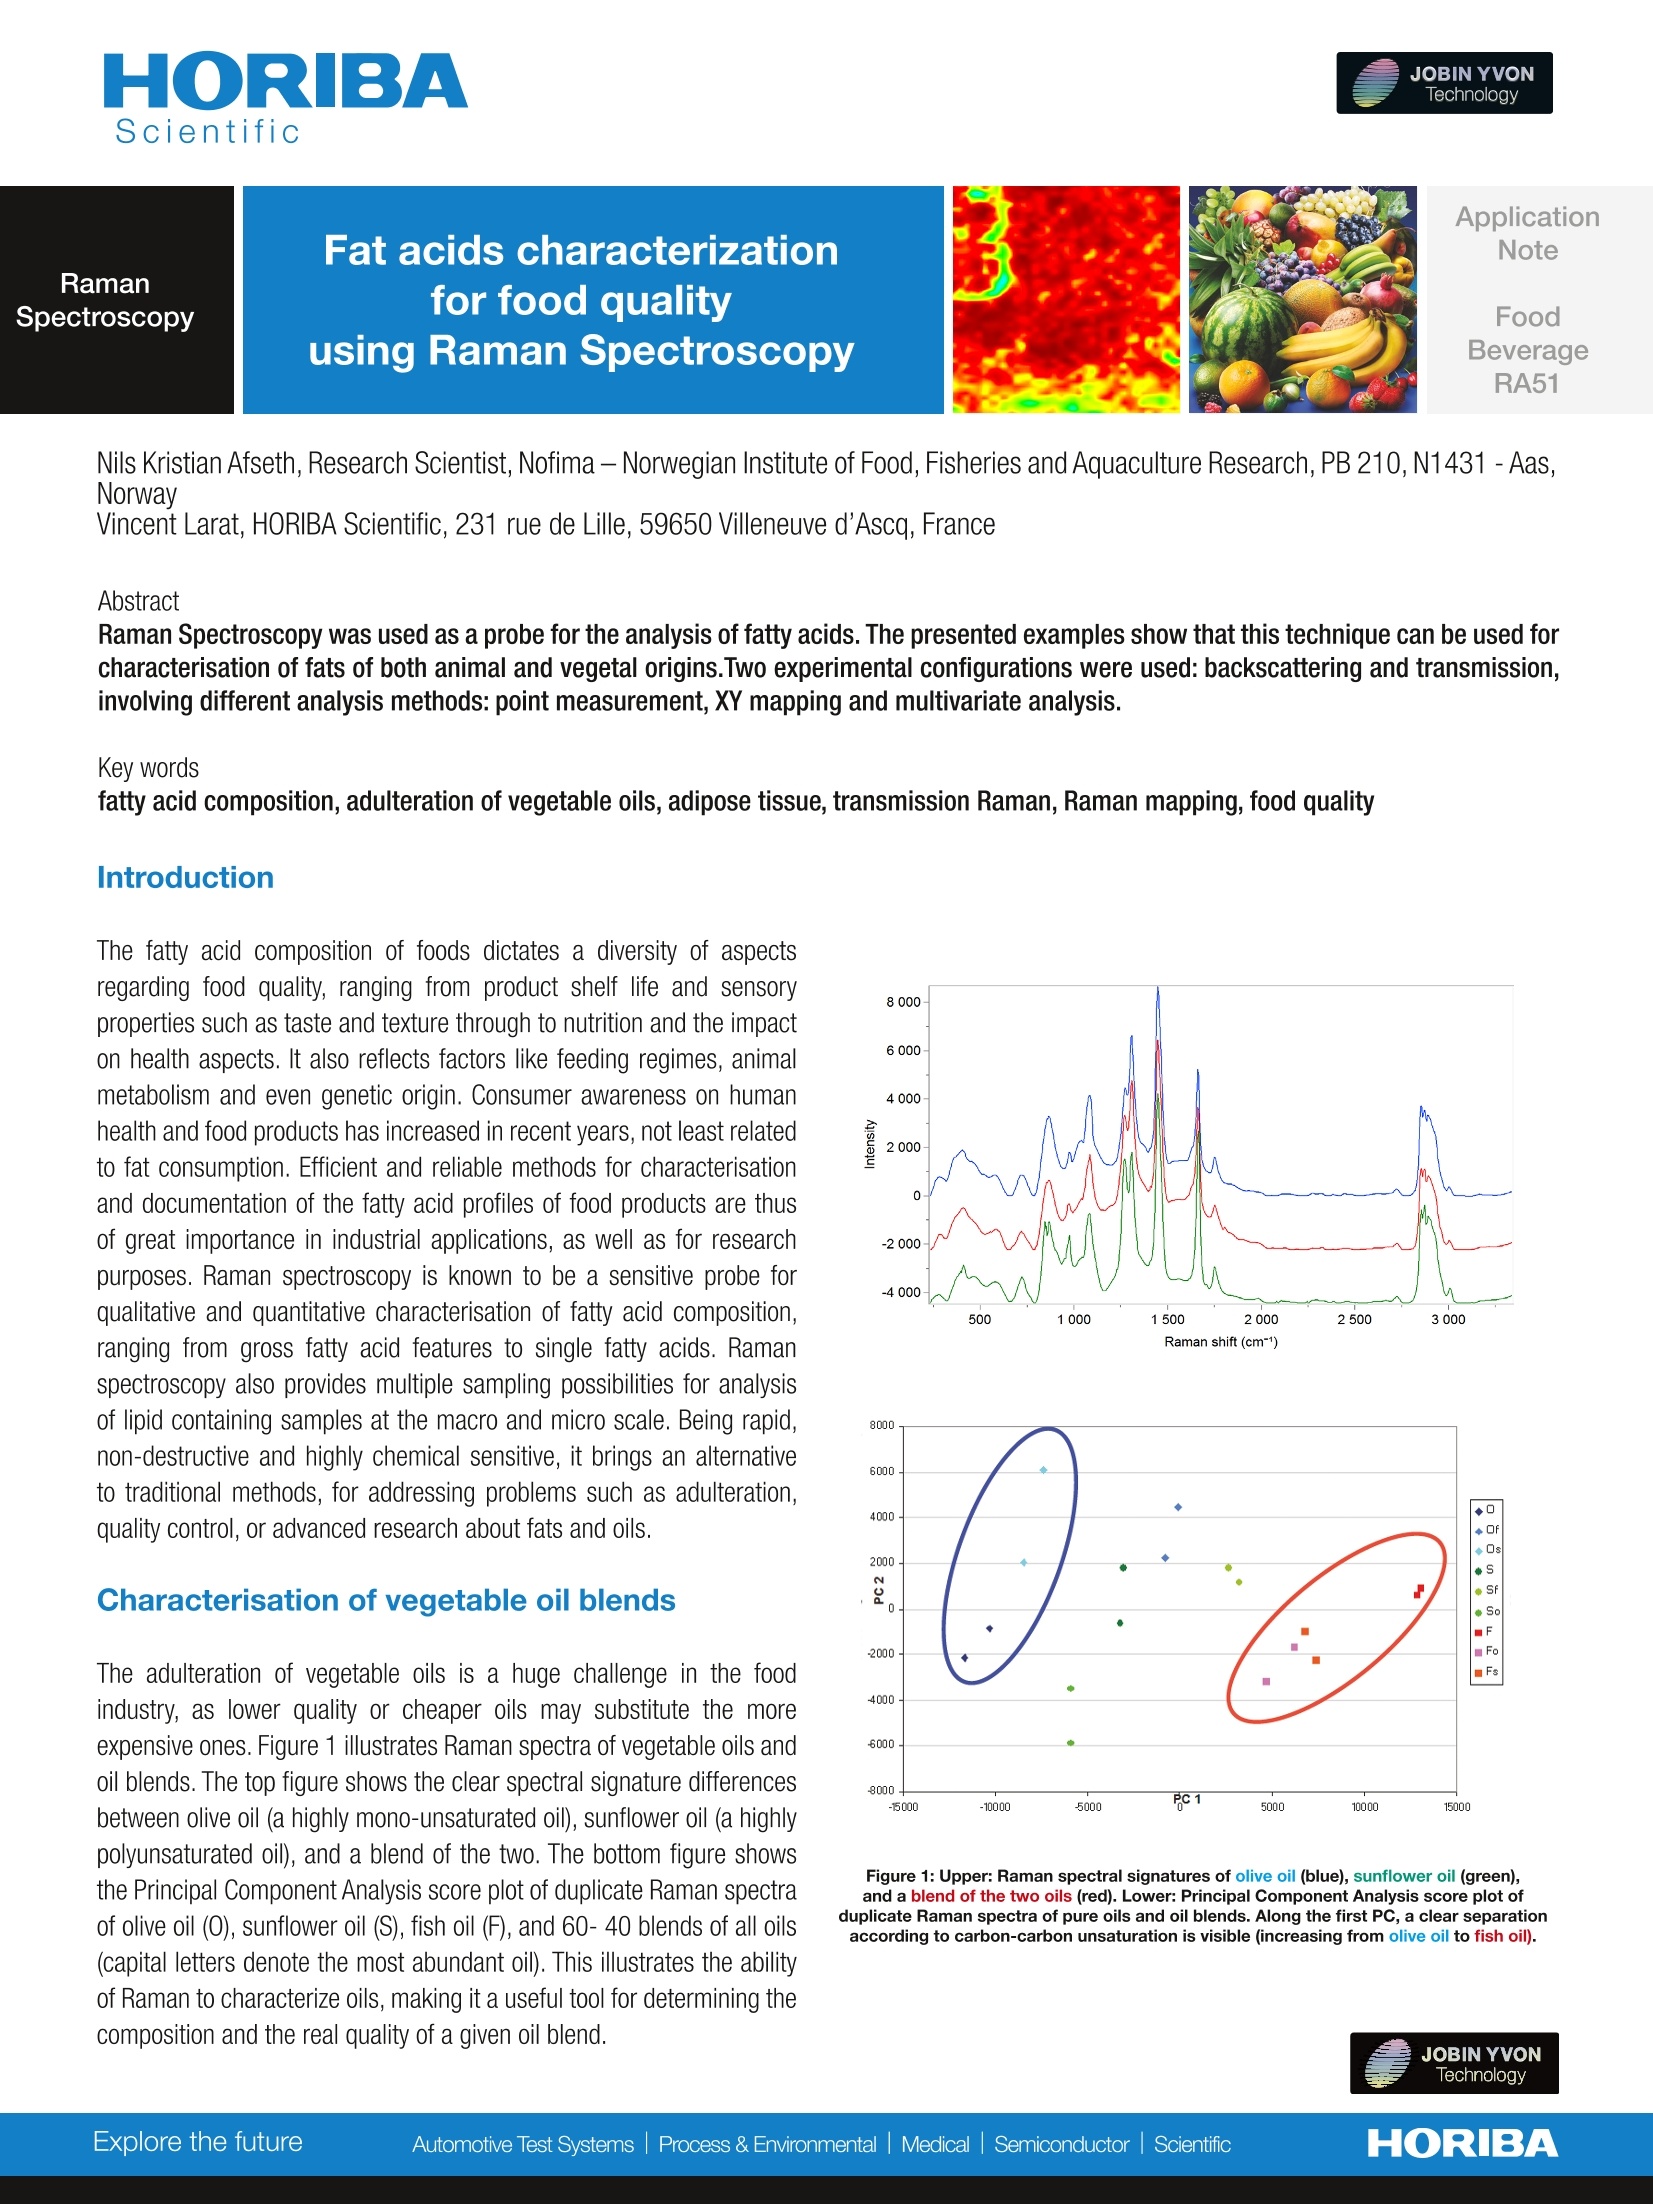
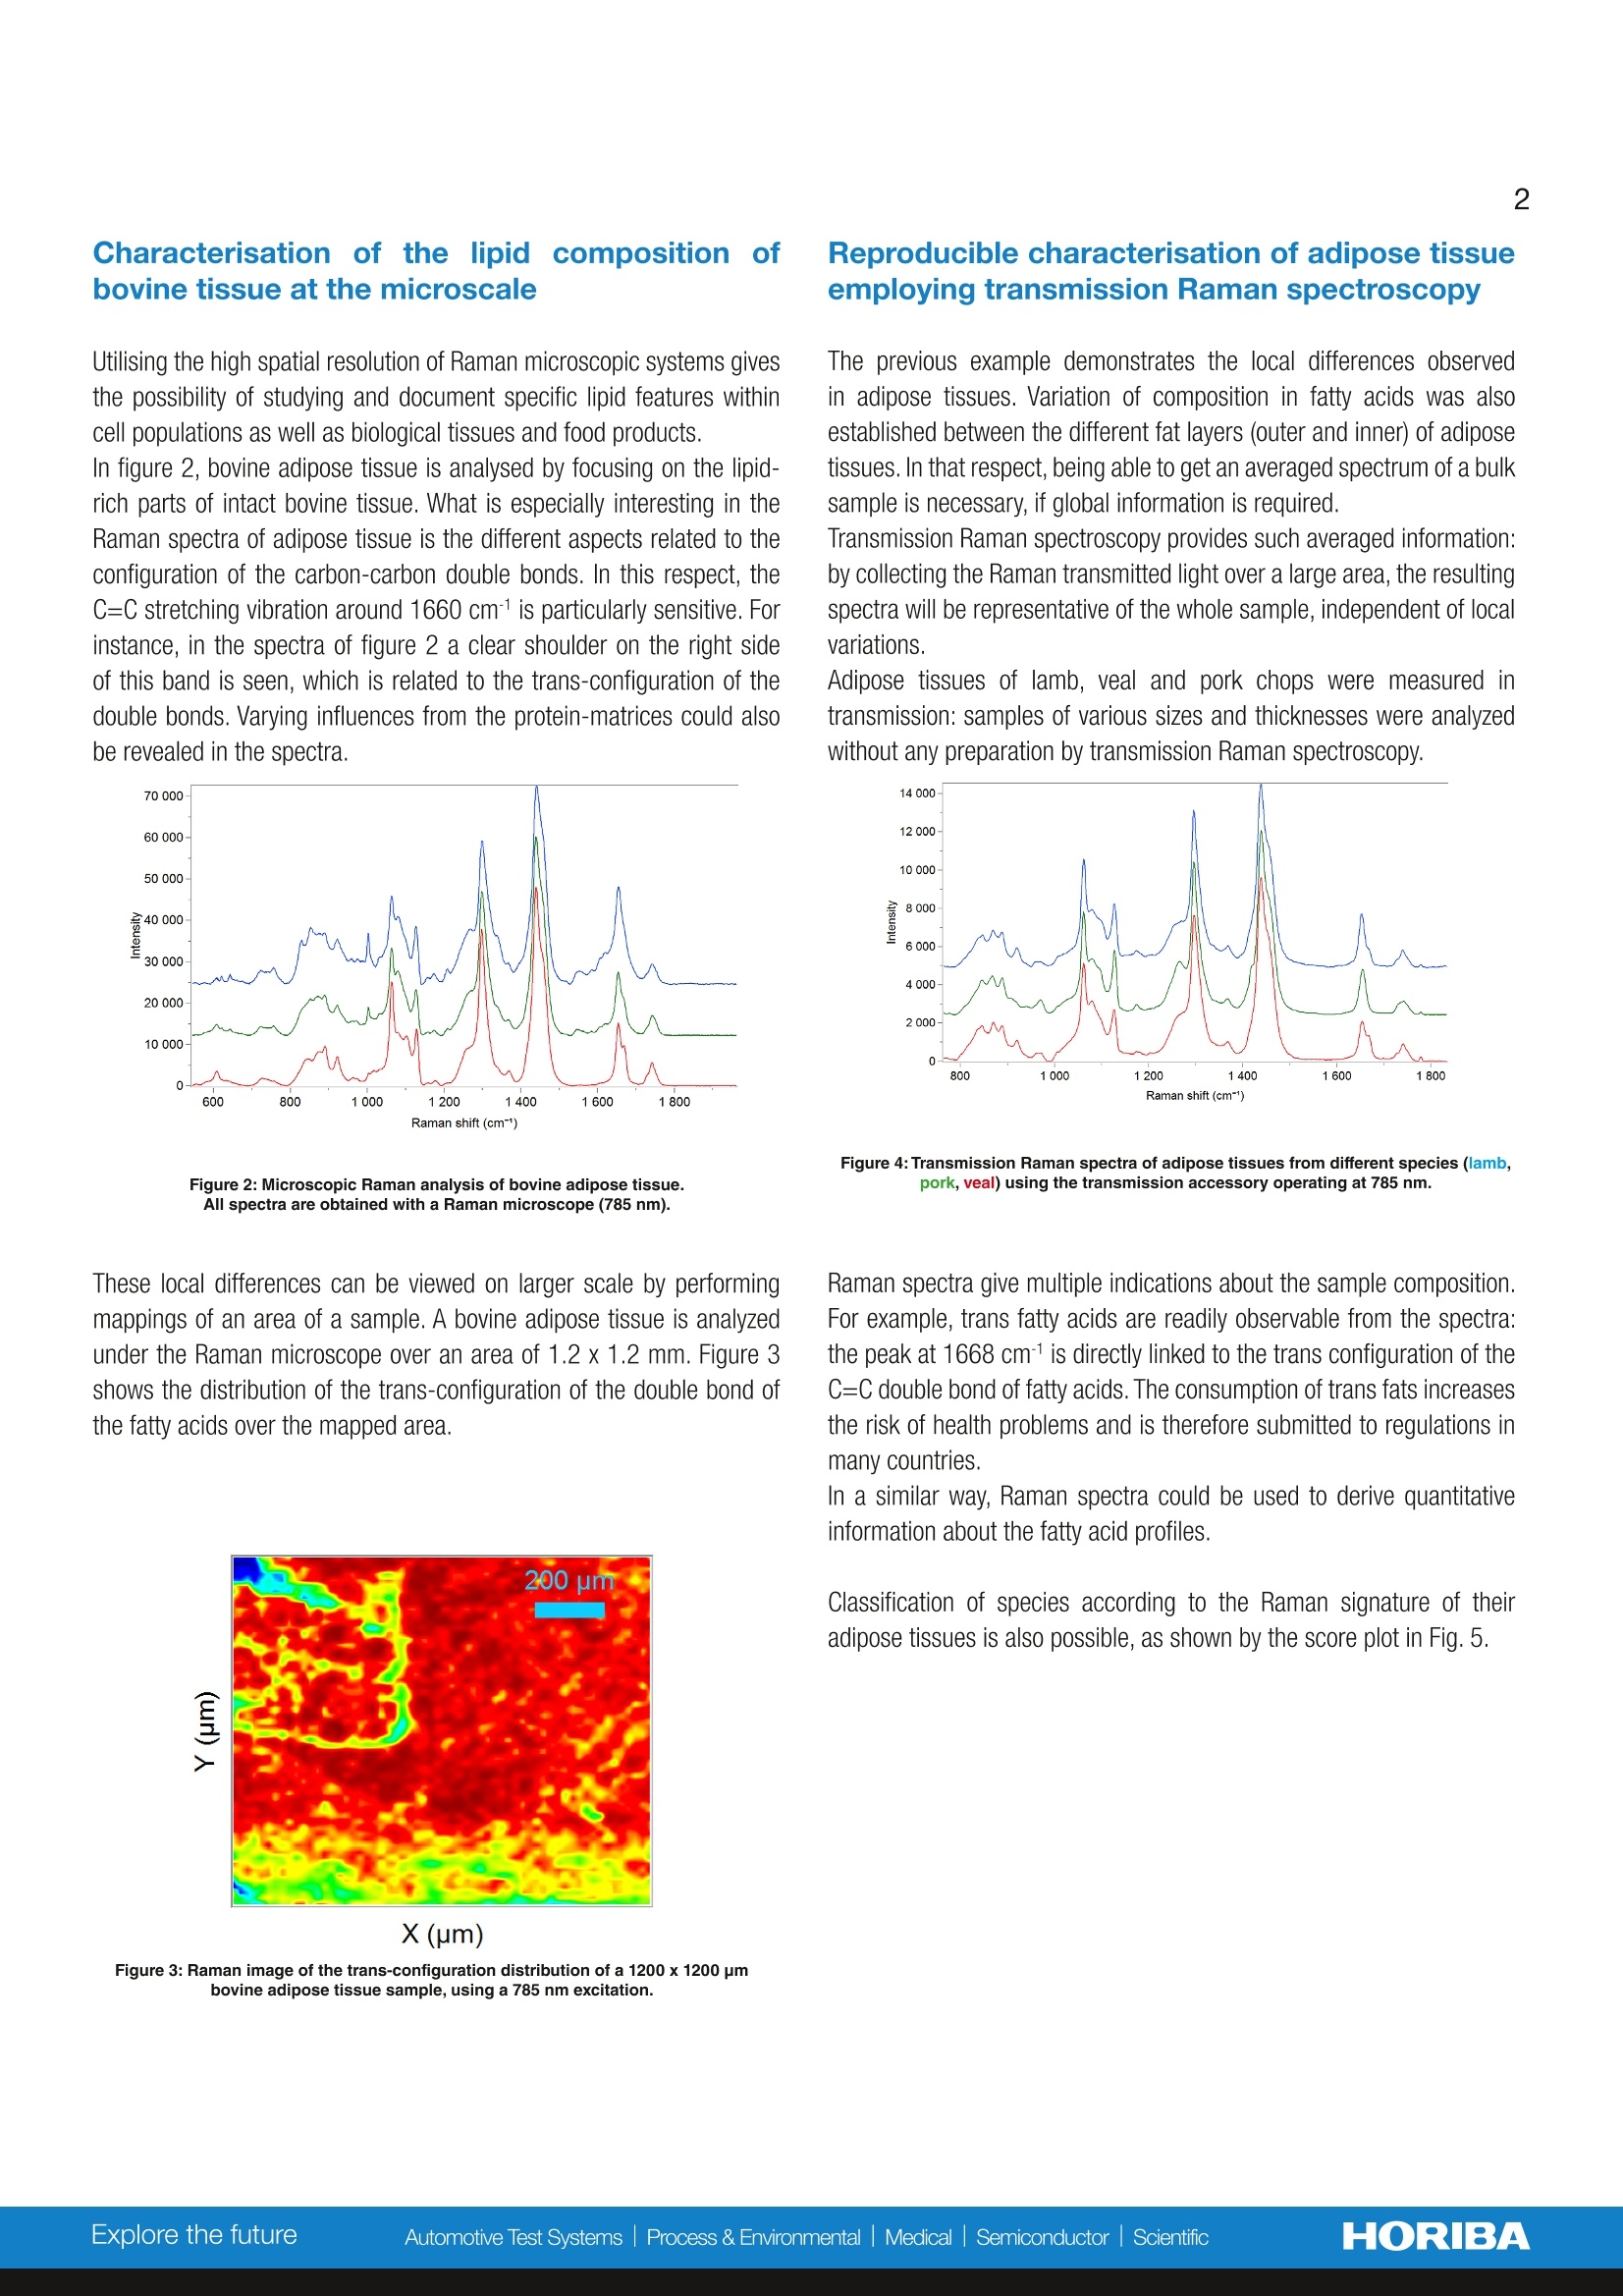
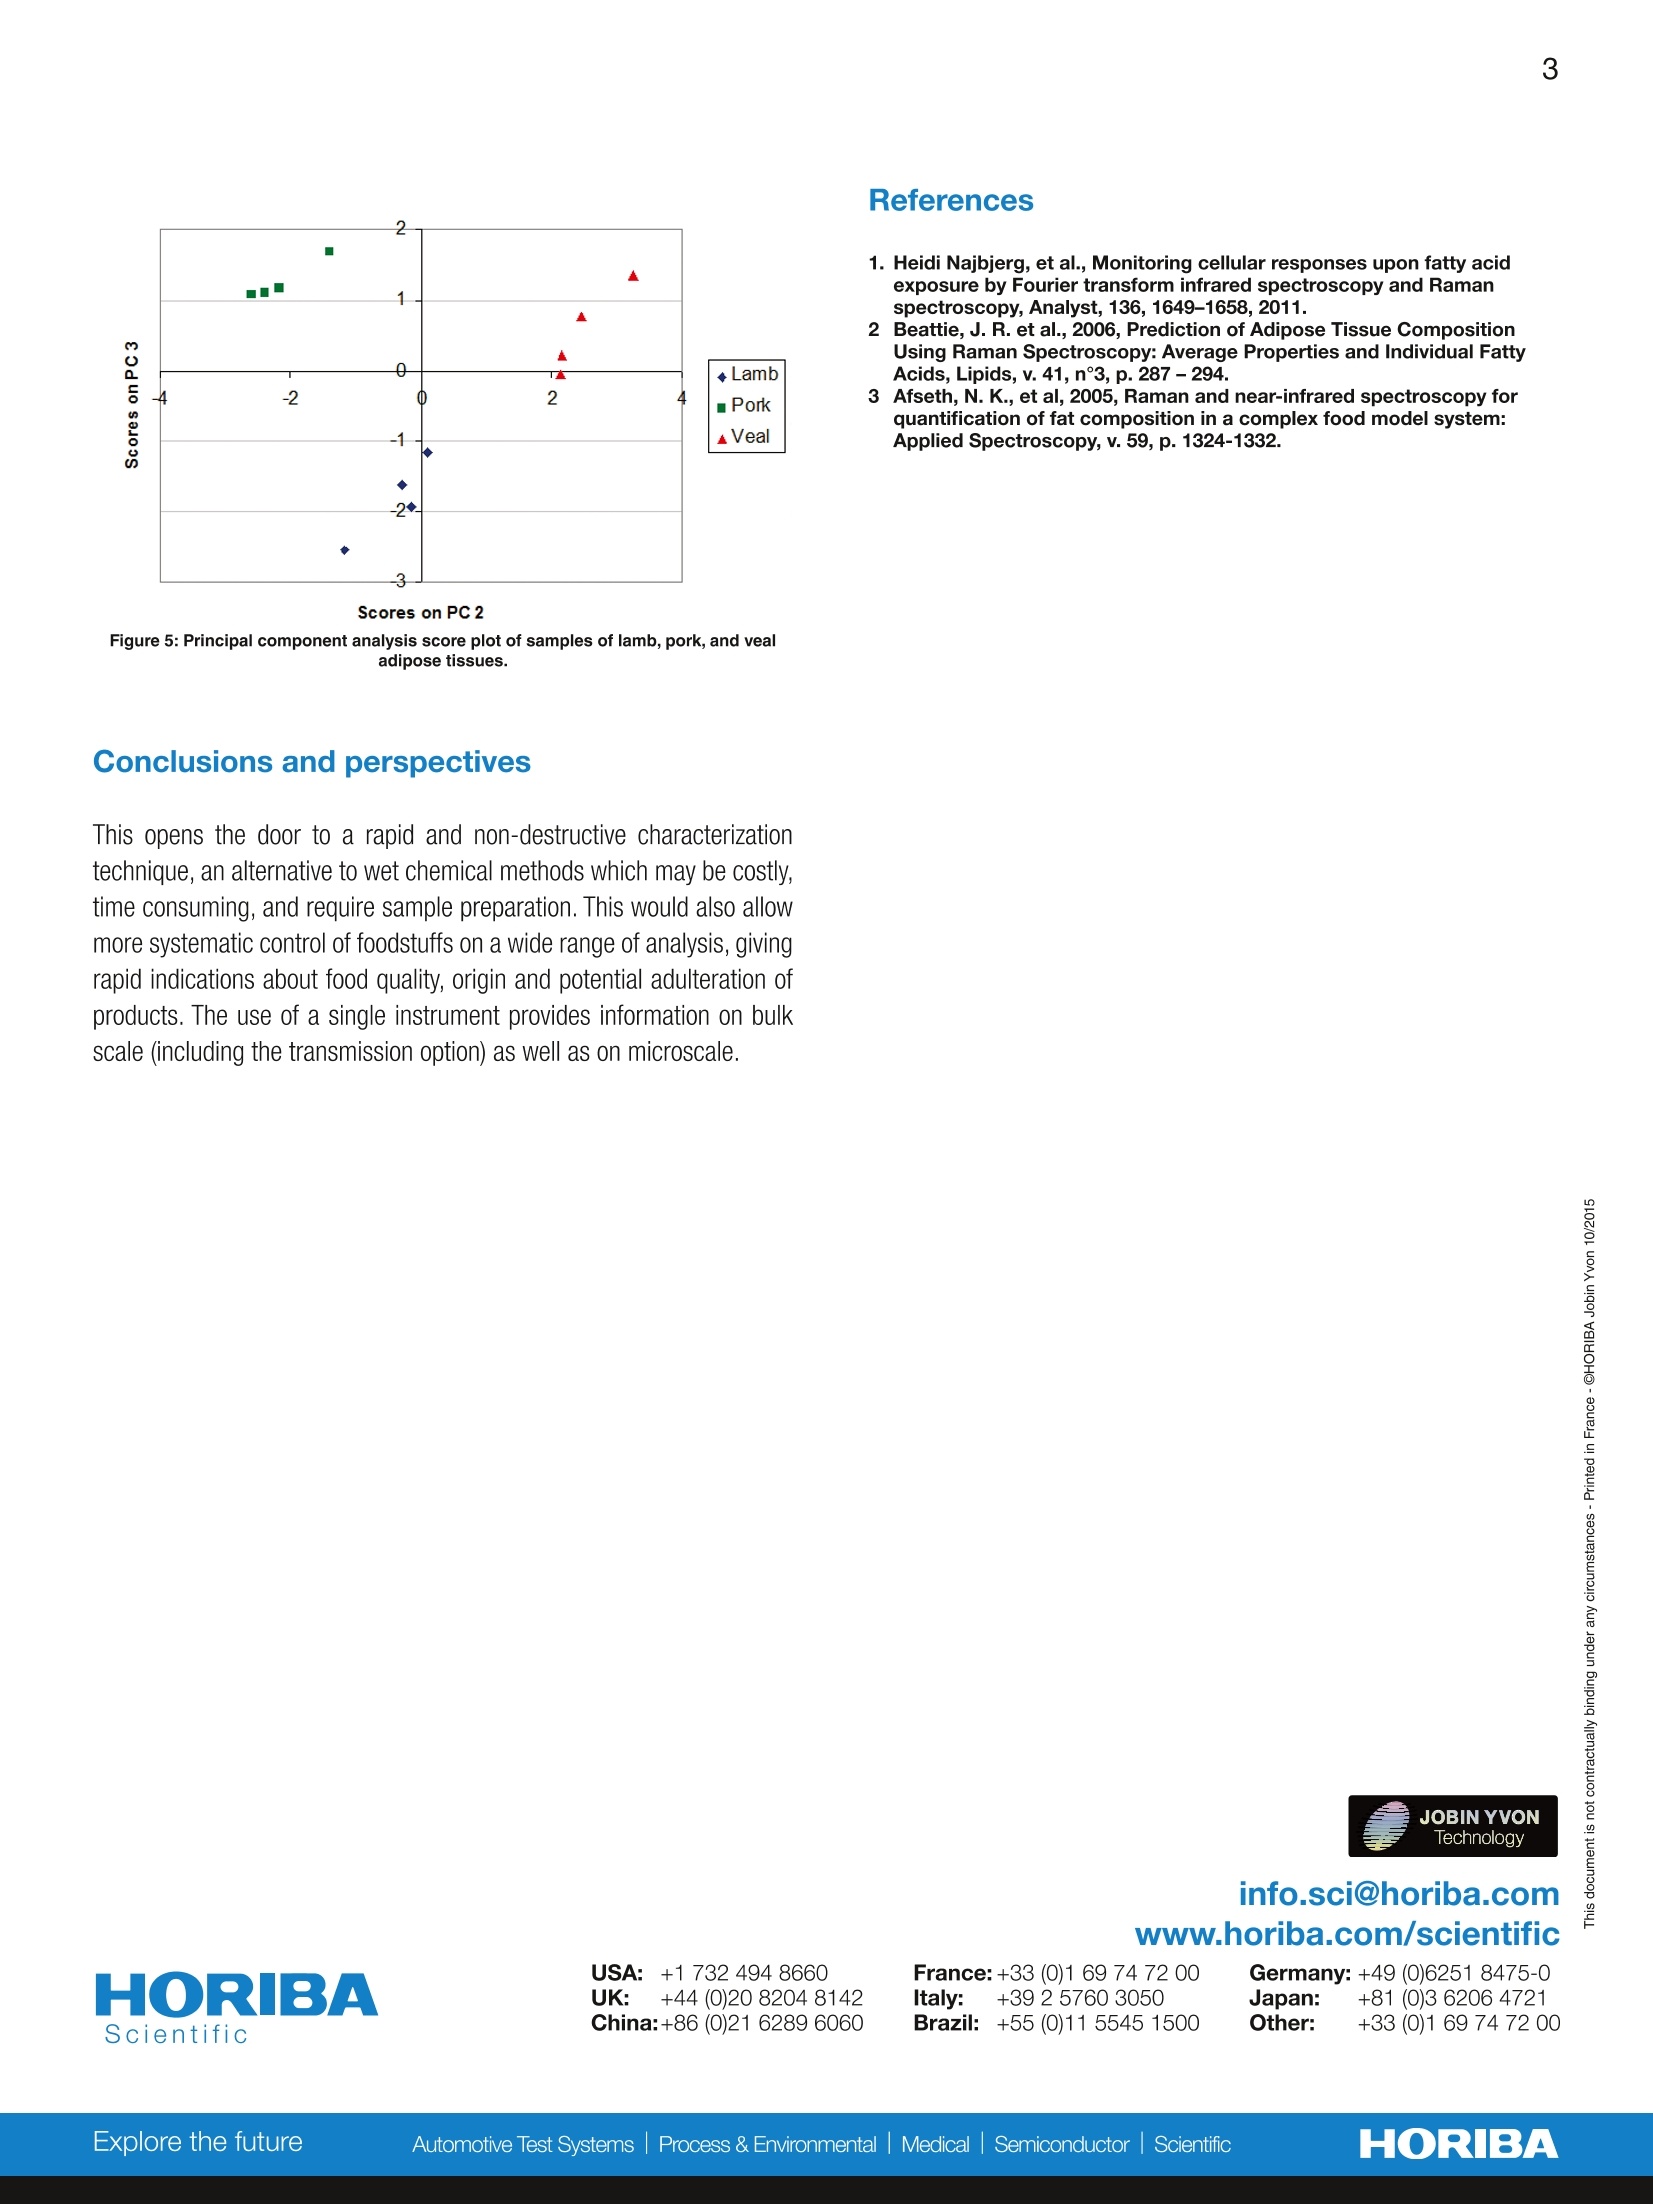
HORIBAScientific 2 RamanSpectroscopy Fat acids characterizationfor food qualityusing Raman Spectroscopy ApplicationNoteFoodBeverageRA51 Nils Kristian Afseth,Research Scientist, Nofima - Norwegian Institute of Food, Fisheries and Aquaculture Research, PB 210,N1431 -Aas,Norway Vincent Larat, HORIBA Scientific, 231 rue de Lille, 59650 Villeneuve d'Ascq, France Abstract Raman Spectroscopy was used as a probe for the analysis of fatty acids. The presented examples show that this technique can be used forcharacterisation of fats of both animal and vegetal origins.Two experimental configurations were used: backscattering and transmission,involving different analysis methods: point measurement, XY mapping and multivariate analysis. Key words fatty acid composition, adulteration of vegetable oils, adipose tissue, transmission Raman, Raman mapping, food quality The fatty acid composition of foods dictates a diversity of aspectsregarding food quality, ranging from product shelf life and sensoryproperties such as taste and texture through to nutrition and the impacton health aspects. It also reflects factors like feeding regimes, animalmetabolism and even genetic origin. Consumer awareness on humanhealth and food products has increased in recent years, not least relatedto fat consumption. Efficient and reliable methods for characterisationand documentation of the fatty acid profiles of food products are thusof great importance in industrial applications, as well as for researchpurposes. Raman spectroscopy is known to be a sensitive probe forqualitative and quantitative characterisation of fatty acid composition,ranging from gross fatty acid features to single fatty acids. Ramanspectroscopy also provides multiple sampling possibilities for analysisof lipid containing samples at the macro and micro scale. Being rapid,non-destructive and highly chemical sensitive, it brings an alternativeto traditional methods, for addressing problems such as adulteration,quality control, or advanced research about fats and oils. Characterisation of vegetable oil blends The adulteration of vegetable oils is a huge challenge in the foodindustry, as lower quality or cheaper oils may substitute the moreexpensive ones. Figure 1 illustrates Raman spectra of vegetable oils andoil blends. The top figure shows the clear spectral signature differencesbetween olive oil (a highly mono-unsaturated oil), sunflower oil (a highlypolyunsaturated oil), and a blend of the two. The bottom figure showsthe Principal Component Analysis score plot of duplicate Raman spectraof olive oil (0), sunflower oil (S), fish oil (F),and 60- 40 blends of all oils(capital letters denote the most abundant oil). This illustrates the abilityof Raman to characterize oils, making it a useful tool for determining thecomposition and the real quality of a given oil blend. Figure 1: Upper: Raman spectral signatures of olive oil (blue), sunflower oil (green),and a blend of the two oils (red).Lower: Principal Component Analysis score plot ofduplicate Raman spectra of pure oils and oil blends. Along the first PC, a clear separationaccording to carbon-carbon unsaturation is visible (increasing from olive oil to fish oil). Characterisation of the lipid composition ofbovine tissue at the microscale Utilising the high spatial resolution of Raman microscopic systems givesthe possibility of studying and document specific lipid features withincell populations as well as biological tissues and food products. In figure 2, bovine adipose tissue is analysed by focusing on the lipid-rich parts of intact bovine tissue. What is especially interesting in theRaman spectra of adipose tissue is the different aspects related to theconfiguration of the carbon-carbon double bonds. In this respect, theC=C stretching vibration around 1660 cm1 is particularly sensitive. Forinstance, in the spectra of figure 2 a clear shoulder on the right sideof this band is seen, which is related to the trans-configuration of thedouble bonds. Varying influences from the protein-matrices could alsobe revealed in the spectra. Figure 2: Microscopic Raman analysis of bovine adipose tissue.All spectra are obtained with a Raman microscope (785 nm). These local differences can be viewed on larger scale by performingmappings of an area of a sample. A bovine adipose tissue is analyzedunder the Raman microscope over an area of 1.2 x 1.2 mm. Figure 3shows the distribution of the trans-configuration of the double bond ofthe fatty acids over the mapped area. X(um) Figure 3: Raman image of the trans-configuration distribution of a 1200 x 1200 pmbovine adipose tissue sample, using a 785 nm excitation. Reproducible characterisation of adipose tissueemploying transmission Raman spectroscopy The previous example demonstrates the local differences observedin adipose tissues. Variation of composition in fatty acids was alsoestablished between the different fat layers (outer and inner) of adiposetissues. In that respect, being able to get an averaged spectrum of a bulksample is necessary, if global information is required. Transmission Raman spectroscopy provides such averaged information:by collecting the Raman transmitted light over a large area, the resultingspectra will be representative of the whole sample, independent of localvariations. Adipose tissues of lamb, veal and pork chops were measured intransmission: samples of various sizes and thicknesses were analyzedwithout any preparation by transmission Raman spectroscopy. Figure 4: Transmission Raman spectra of adipose tissues from different species (lamb,pork,veal) using the transmission accessory operating at 785 nm. Raman spectra give multiple indications about the sample composition.For example, trans fatty acids are readily observable from the spectra:the peak at 1668 cmis directly linked to the trans configuration of theC=C double bond of fatty acids. The consumption of trans fats increasesthe risk of health problems and is therefore submitted to regulations inmany countries. In a similar way, Raman spectra could be used to derive quantitativeinformation about the fatty acid profiles. Classification of species according to the Raman signature of theiradipose tissues is also possible, as shown by the score plot in Fig. 5. References 1. Heidi Najbjerg, et al., Monitoring cellular responses upon fatty acidexposure by Fourier transform infrared spectroscopy and Ramanspectroscopy, Analyst, 136, 1649-1658,2011. 2 Beattie, J. R. et al., 2006, Prediction of Adipose Tissue CompositionUsing Raman Spectroscopy:Average Properties and Individual FattyAcids, Lipids, v. 41,n°3, p. 287-294. 3 Afseth, N. K., et al, 2005, Raman and near-infrared spectroscopy forquantification of fat composition in a complex food model system:Applied Spectroscopy, v. 59, p. 1324-1332. Figure 5: Principal component analysis score plot of samples of lamb, pork, and vealatAa +dipose tissues. Conclusions and perspectives This opens the door to a rapid and non-destructive characterizationtechnique, an alternative to wet chemical methods which may be costly,time consuming, and require sample preparation. This would also allowmore systematic control of foodstuffs on a wide range of analysis, givingrapid indications about food quality, origin and potential adulteration ofproducts. The use of a single instrument provides information on bulkscale (including the transmission option) as well as on microscale. France:+33 (0)1 69 74 7200 Germany: +49 (0)6251 8475-0Italy: +39 2 5760 3050 Japan: +81 (0)3 6206 4721Brazil:: +55 (0)11 5545 1500 Other: +33 (0)16974 7200 HORIBAExplore the futureAutomotive Test SystemssliProcess & EnvironmentalMedicalSemiconductorScientific This opens the door to a rapid and non-destructive characterization technique, an alternative to wet chemical methods which may be costly, time consuming, and require sample preparation. This would also allow more systematic control of foodstuffs on a wide range of analysis, giving rapid indications about food quality, origin and potential adulteration of products. The use of a single instrument provides information on bulk scale (including the transmission option) as well as on microscale.
确定
还剩1页未读,是否继续阅读?

HORIBA(中国)为您提供《脂肪中结构检测方案(激光拉曼光谱)》,该方案主要用于其他中结构检测,参考标准--,《脂肪中结构检测方案(激光拉曼光谱)》用到的仪器有
相关方案
更多
该厂商其他方案
更多