


方案详情
文
Liquid Crystal Modulation Spectroscopic Ellipsometry is an excellent technique for the highly accurate characterization of the compound semiconductor heterostructure AlGaN / GaN. Using the MM-16 spectroscopic ellipsometer it is a straightforward procedure to determine the film thickness and optical dispersions of the complete structure even where the film is several microns thick.
The detailed knowledge of the optical parameters of AlGaN alloys is crucial for example for the design of opto-electronic devices.
Furthermore, from the optical parameters a calibration curve could be constructed to provide a rapid and efficient determination of the Al content in the AlGaN layers. Thus Spectroscopic Ellipsometry also proves a non-destructive technique for AlGaN alloy composition determination.
This method can be equally applied to other compound semiconductors such as SiGe, II-VI semiconductors or classical III-V semiconductors.
方案详情

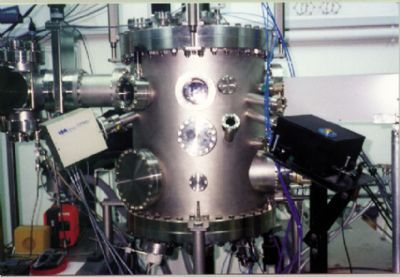
Application NoteSemiconductorMM-16Spectroscopic Ellipsometry Spectroscopic Ellipsometry SE01 Spectroscopic Ellipsometry of Compound Semiconductors:Al Ga1-xN/ GaN Hetero-Structures Roland Seitz - Application Scientist - Thin Film Division Introduction Group III-Nitrides and their alloys are the most promising mate-rials for short-wavelength optoelectronic devices such as LEDs,injection lasers, photodetectors, full colour displays and elec-tronic devices like HFETs, HEMTs, etc. For their design and optimization a detailed knowledge of boththe layer thickness and the optical properties are essential. Spec-troscopic Ellipsometry is a non-destructive optical characteriza-tion method that allows determination of these required materialparameters. Materials A typical AlGaN / GaN heterostructure as used for LEDs andtransistors is shown in figure 1. Figure 1: Typical AlGaN / GaNheterostructure The GaN and AlGaN films were deposited by MOCVD (metal-organic chemical vapour deposition) on sapphire substrates. The following samples were analyzed: Sample Structure Al Content in AlGaN% 1 GaN/Sapphire - 2 GaN/ Sapphire - 3 AlGaN /GaN/Sapphire 7 4 AlGaN /GaN/ Sapphire 16 5 AlGaN/GaN/Sapphire 25 6 AlGaN/GaN/ Sapphire 5 7 AlGaN / GaN / Sapphire 9 Results The work was performed using the HORIBA Jobin Yvon MM-16spectroscopic ellipsometer which provides significant advantag-es in terms of speed, high resolution measurement and experi- mental versatility. Ellipsometric measurements were performedat an angle of incidence of 70° in the spectral range 500nm-800nm. Both the thicknesses and optical properties were ex-tracted simultaneously from the SE data analysis.When compared to conventional ellipsometer platforms, theLiquid Crystal Modulation Ellipsometer delivers exceptionallyhigh accuracy for the ellipsometric angles (y,A) across their fullrange in one measurement, without any dead spots. Figure 2 shows the W and Aspectra of sample 1. Figure 2: W and A spectra of sample 1 The thickness and the dispersion of the GaN layer were deter-mined by appropriate modelling. For this sample the result is thefollowing: Figure 3 shows the Y and A spectra of sample 6. Figure 3: Y and A spectra of sample 6 The thickness and the dispersion of both the AlGaN and theGaN layer were determined by appropriate modelling. For sam-ple 6 the result is the following: For the modelling of the optical dispersions a classical Lorentzoscillator dispersion formula was used: where E=hω is the photon energy. The relation of e and 82 with n and k is: 81=n2-k2 and 82=2nk The following table summarizes the results found for the samplesin the wavelength range 500-800nm: Sample thicknessGaN/nm thicknessAlGaN/nm n at633nm s To 1 2402 0 2.361 5.19 6.76 0.1 2 2466 0 2.353 5.16 6.78 0.1 3 1283 332 2.331 5.07 6.85 0.2 4 1180 254 2.299 5.00 7.56 0.3 5 1128 401 2.292 4.93 7.11 0.5 6 1111 462 2.340 5.09 6.68 0.2 7 1124 602 2.336 5.08 6.75 0.2 The refractive index as a function of wavelength is shown in fig-ure 4 for different Al concentrations. Figure 4: Refractive index for various Al concentrations in A/GaN HORIBAJOBINYVON From these data a calibration curve can be set-up that allowsthe determination of the Al content in the AlGaN layer by eval-uating the optical dispersion of the material (figure 5): Figure 5: Calibration curve for Al concentration in AlGaN The Al concentration can be calculated by the following formu-la: Conclusion Liquid Crystal Modulation Spectroscopic Ellipsometry is an ex-cellent technique for the highly accurate characterization of thecompound semiconductor heterostructure AlGaN / GaN. Using the MM-16 spectroscopic ellipsometer it is a straightfor-ward procedure to determine the film thickness and optical dis-persions ot the complete structure even where the tilm is severalmicrons thick. The detailed knowledge of the optical parameters of AlGaN al-loys is crucial for example for the design of opto-electronic de-vices. Furthermore, from the optical parameters a calibration curvecould be constructed to provide a rapid and efficient determina-tion of the Al content in the AlGaN layers. Thus SpectroscopicEllipsometry also proves a non-destructive technique for AlGaNalloy composition determination. This method can be equally applied to other compound semi-conductors such as SiGe, II-VI semiconductors or classical Ⅲ-Vsemiconductors. USA:+1-732 494 8660France:+33 (0)164541300Japan: +81 (0)3 3861 8231 HORIBAExplore the future Find us at www.jobinyvon.com or telephone:(All HORIBA Jobin Yvon companies were formerly known as Jobin Yvon)HORIBAExplore the future Liquid Crystal Modulation Spectroscopic Ellipsometry is an excellent technique for the highly accurate characterization of the compound semiconductor heterostructure AlGaN / GaN. Using the MM-16 spectroscopic ellipsometer it is a straightforward procedure to determine the film thickness and optical dispersions of the complete structure even where the film is several microns thick. The detailed knowledge of the optical parameters of AlGaN alloys is crucial for example for the design of opto-electronic devices.Furthermore, from the optical parameters a calibration curve could be constructed to provide a rapid and efficient determination of the Al content in the AlGaN layers. Thus Spectroscopic Ellipsometry also proves a non-destructive technique for AlGaN alloy composition determination.This method can be equally applied to other compound semiconductors such as SiGe, II-VI semiconductors or classical III-V semiconductors.
确定
还剩1页未读,是否继续阅读?

产品配置单

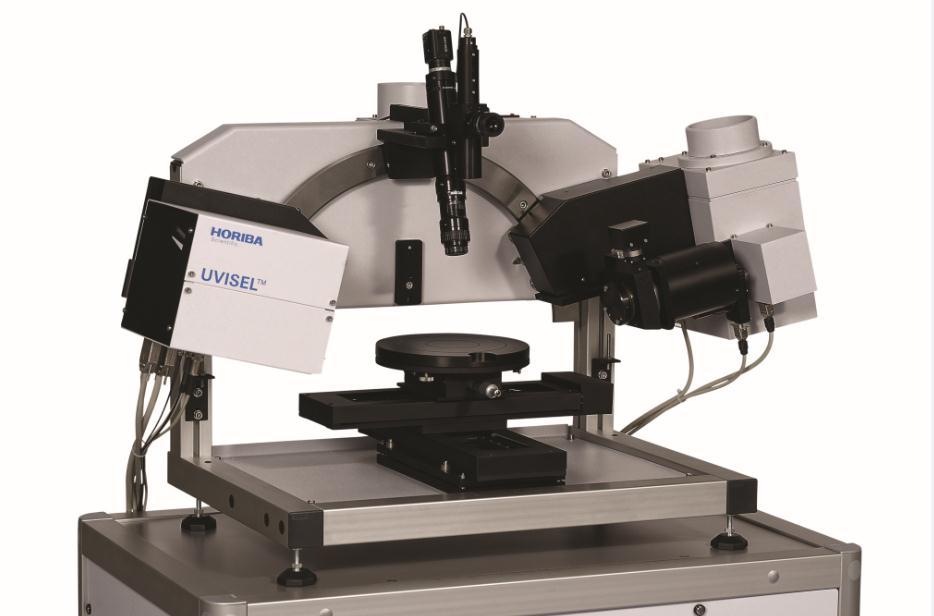
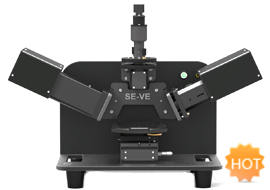
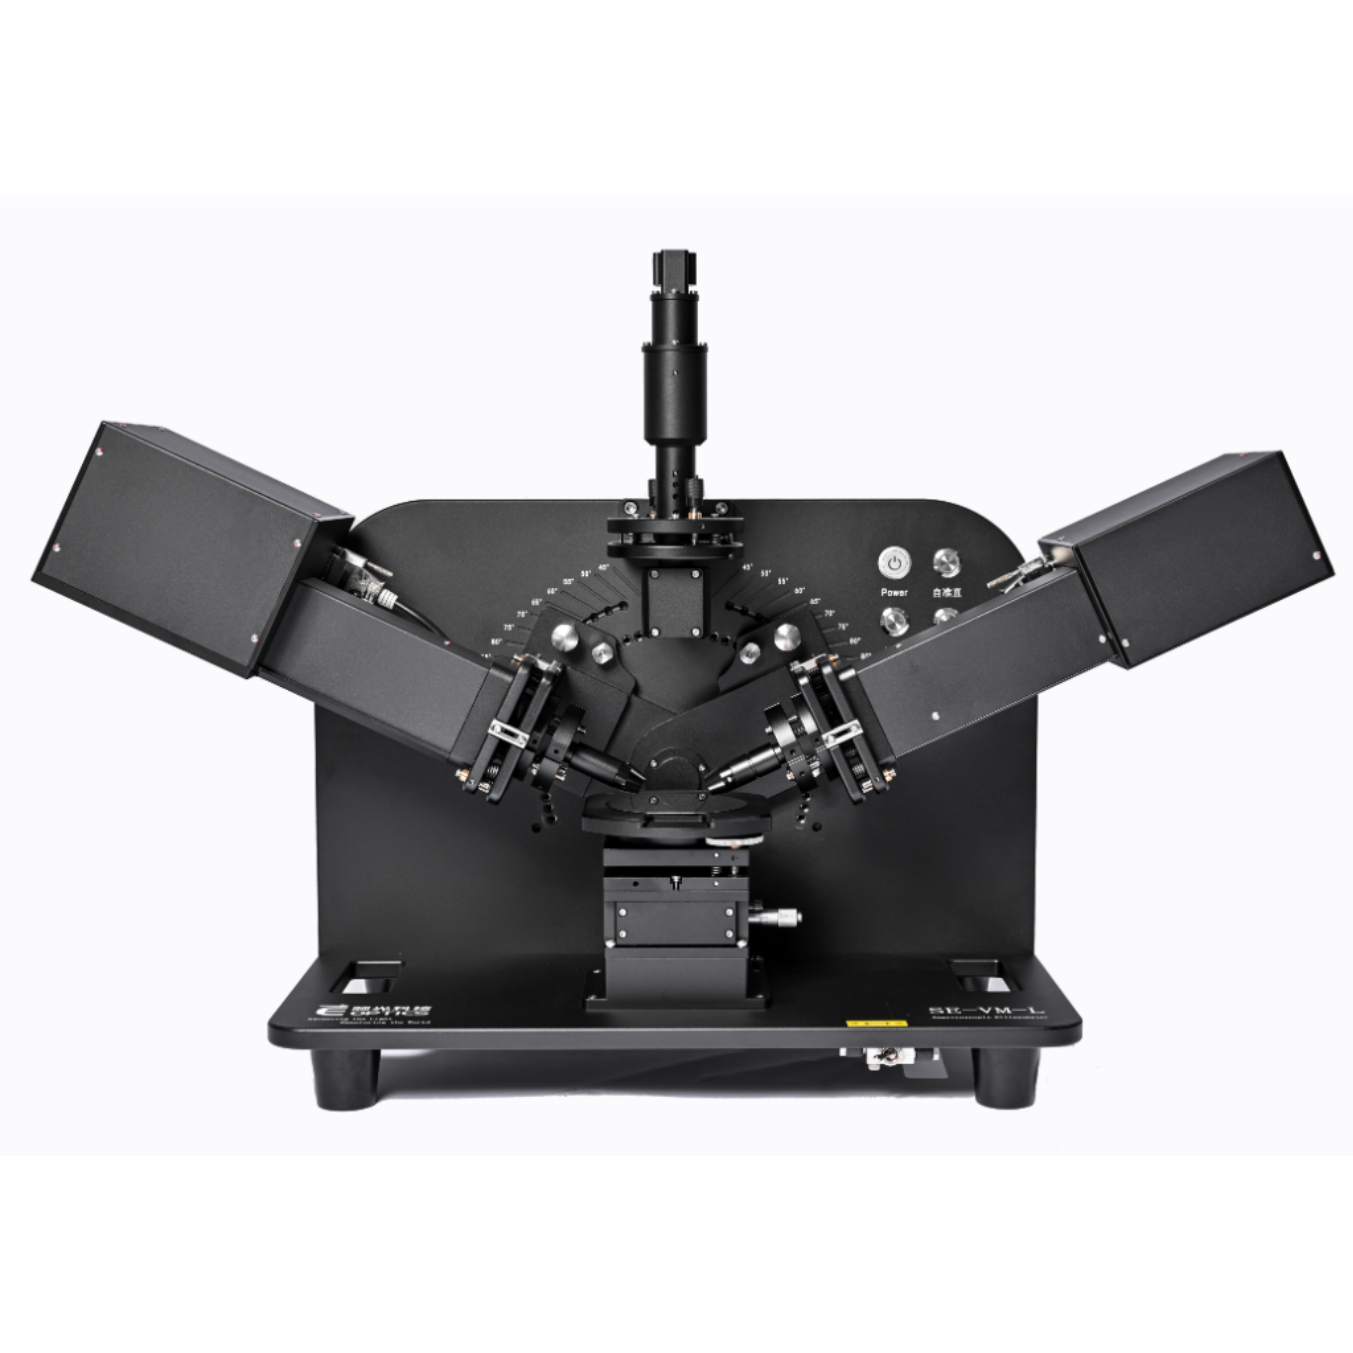
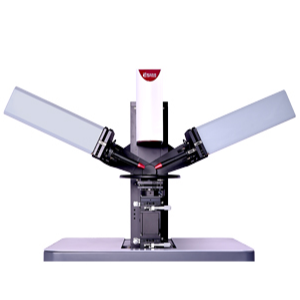
HORIBA(中国)为您提供《AlxGa1-xNGaN中厚度,光色散检测方案(椭偏仪)》,该方案主要用于其他中厚度,光色散检测,参考标准--,《AlxGa1-xNGaN中厚度,光色散检测方案(椭偏仪)》用到的仪器有HORIBA UVISEL Plus研究级经典型椭偏仪
推荐专场
相关方案
更多
该厂商其他方案
更多