


方案详情
文
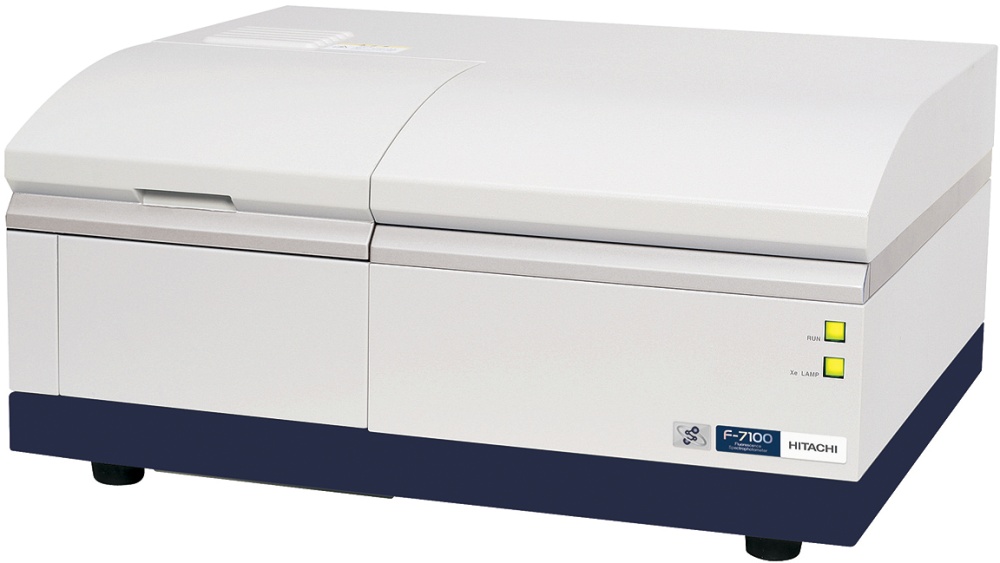
紫外光激发下,黄曲霉毒素B1/B2会被激发出蓝色荧光,黄曲霉毒素G1/G2则会发出绿色荧光。利用这种荧光特性,可以准确定量分析食品中的黄曲霉毒素含量。日立荧光具有的高灵敏度和超高扫描速度,微小含量的黄曲霉毒素也可以快速准确分析。
方案详情

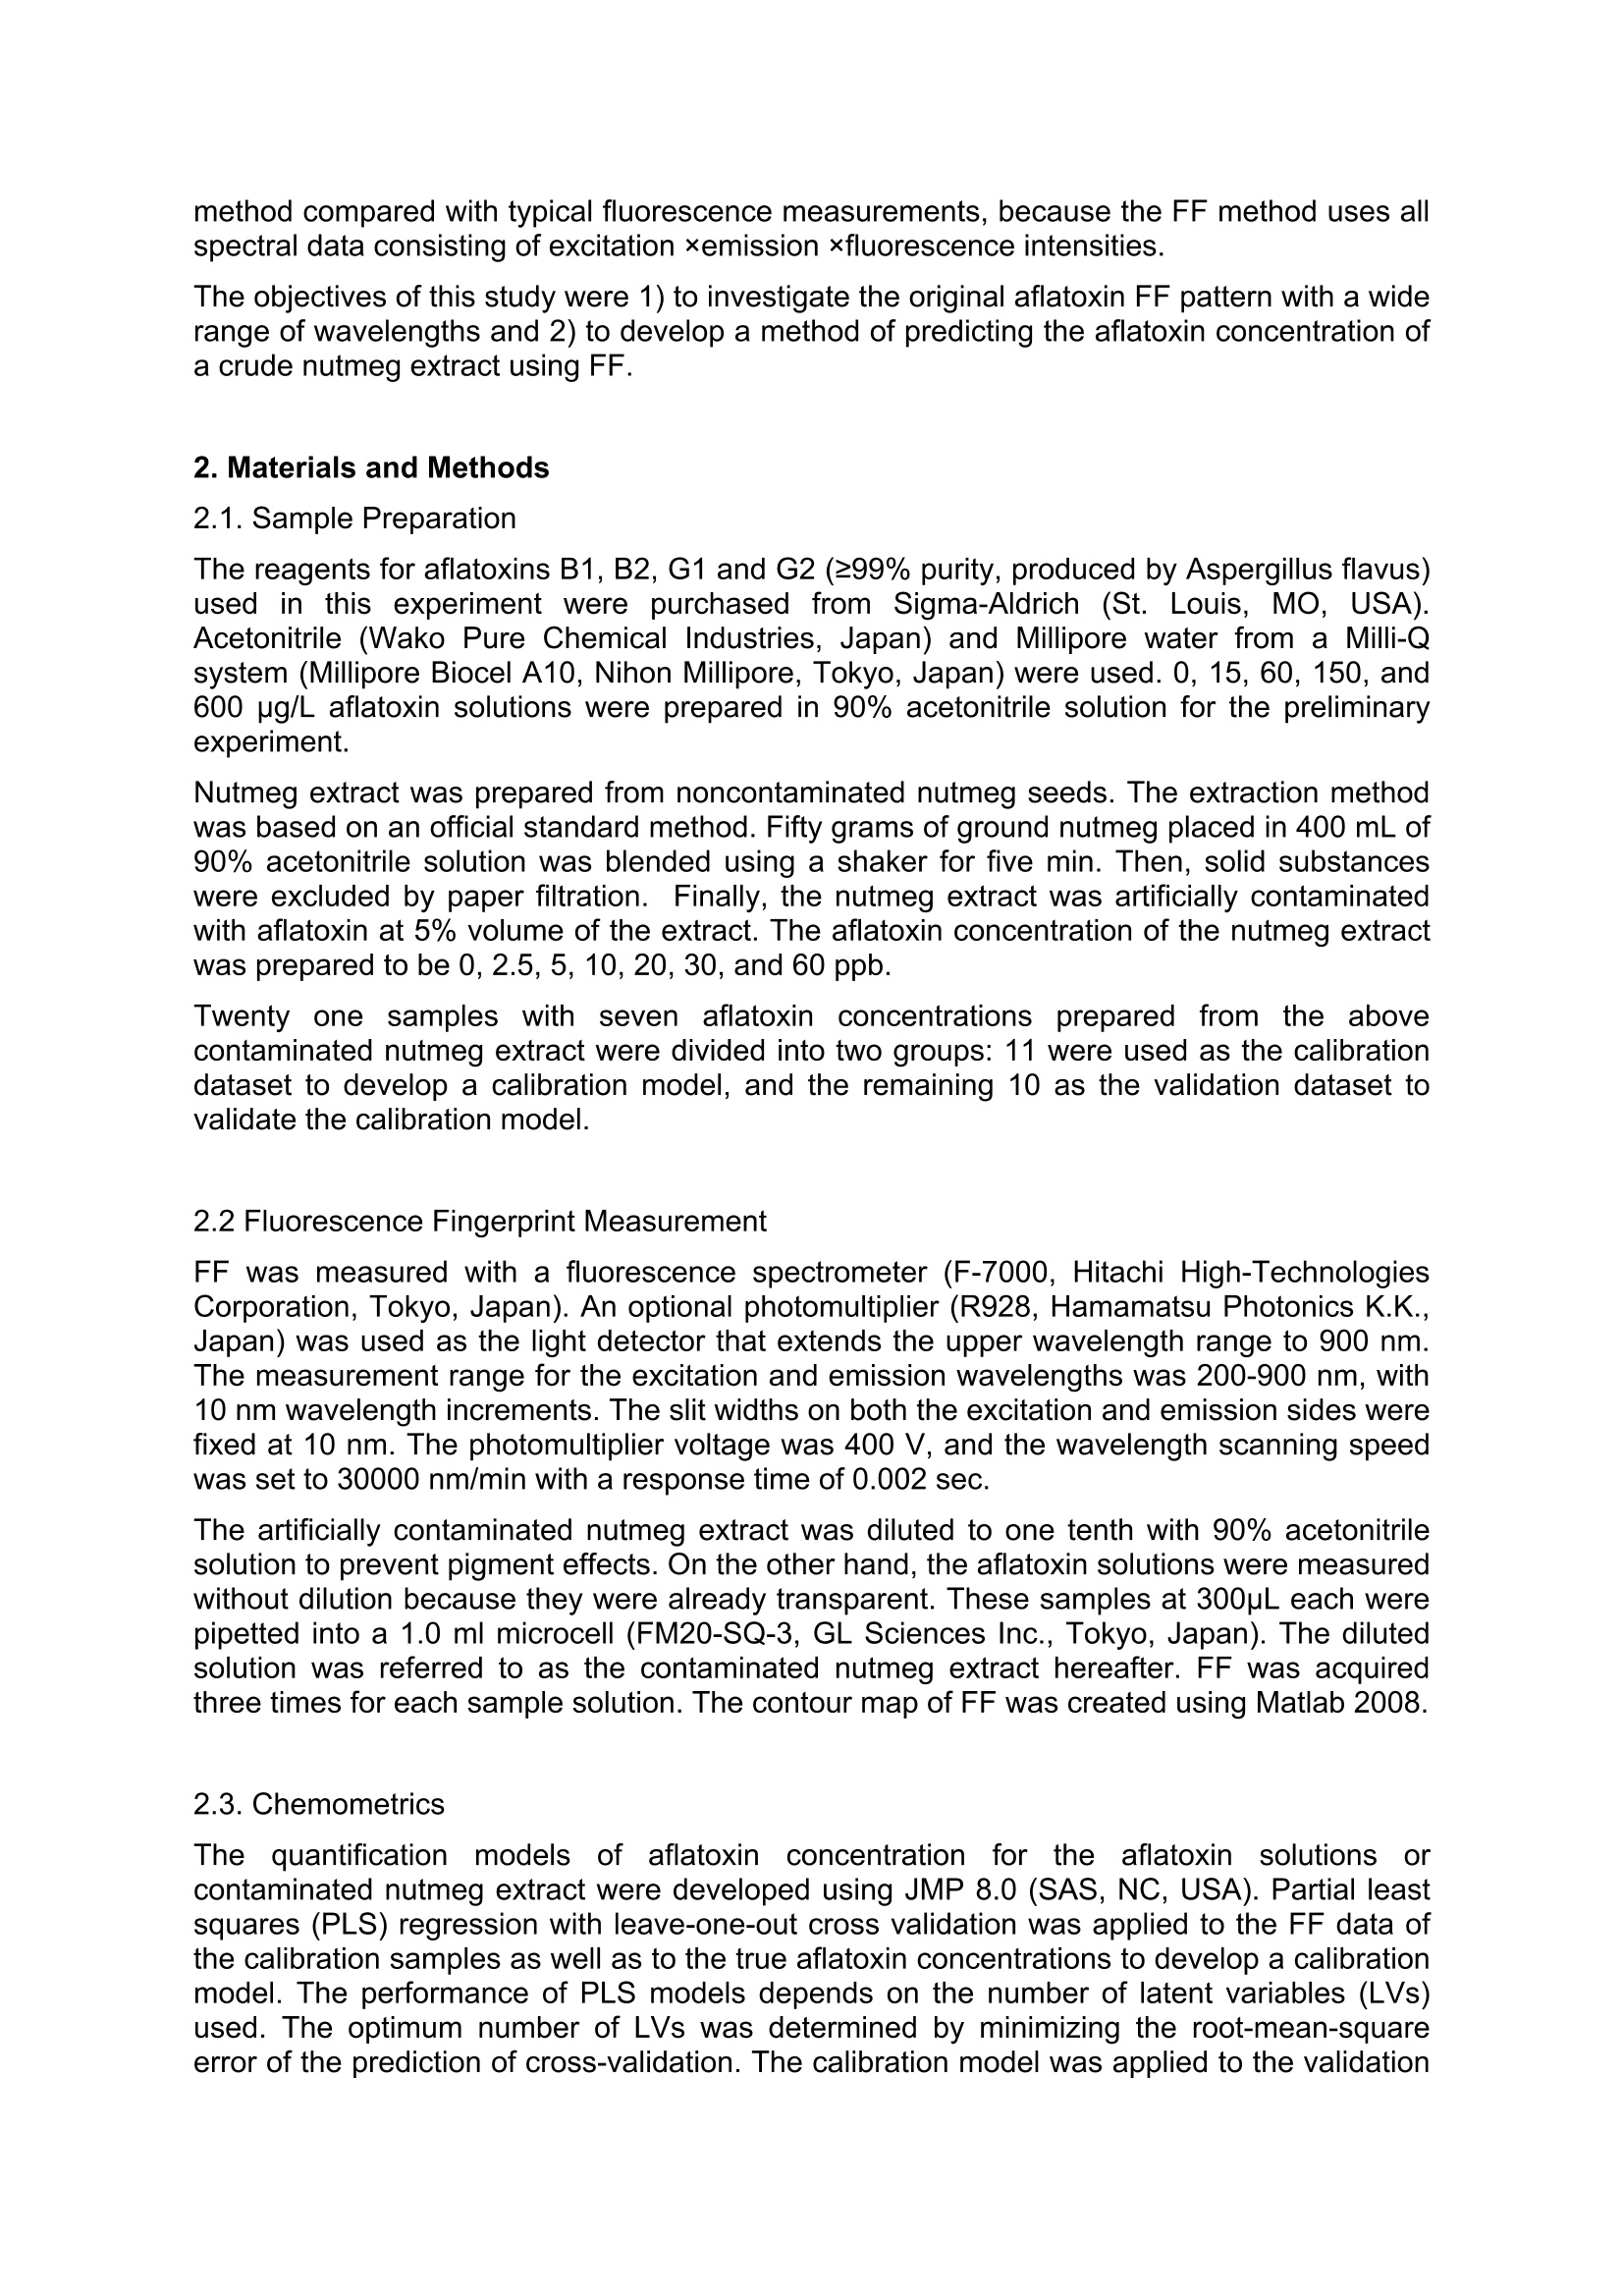
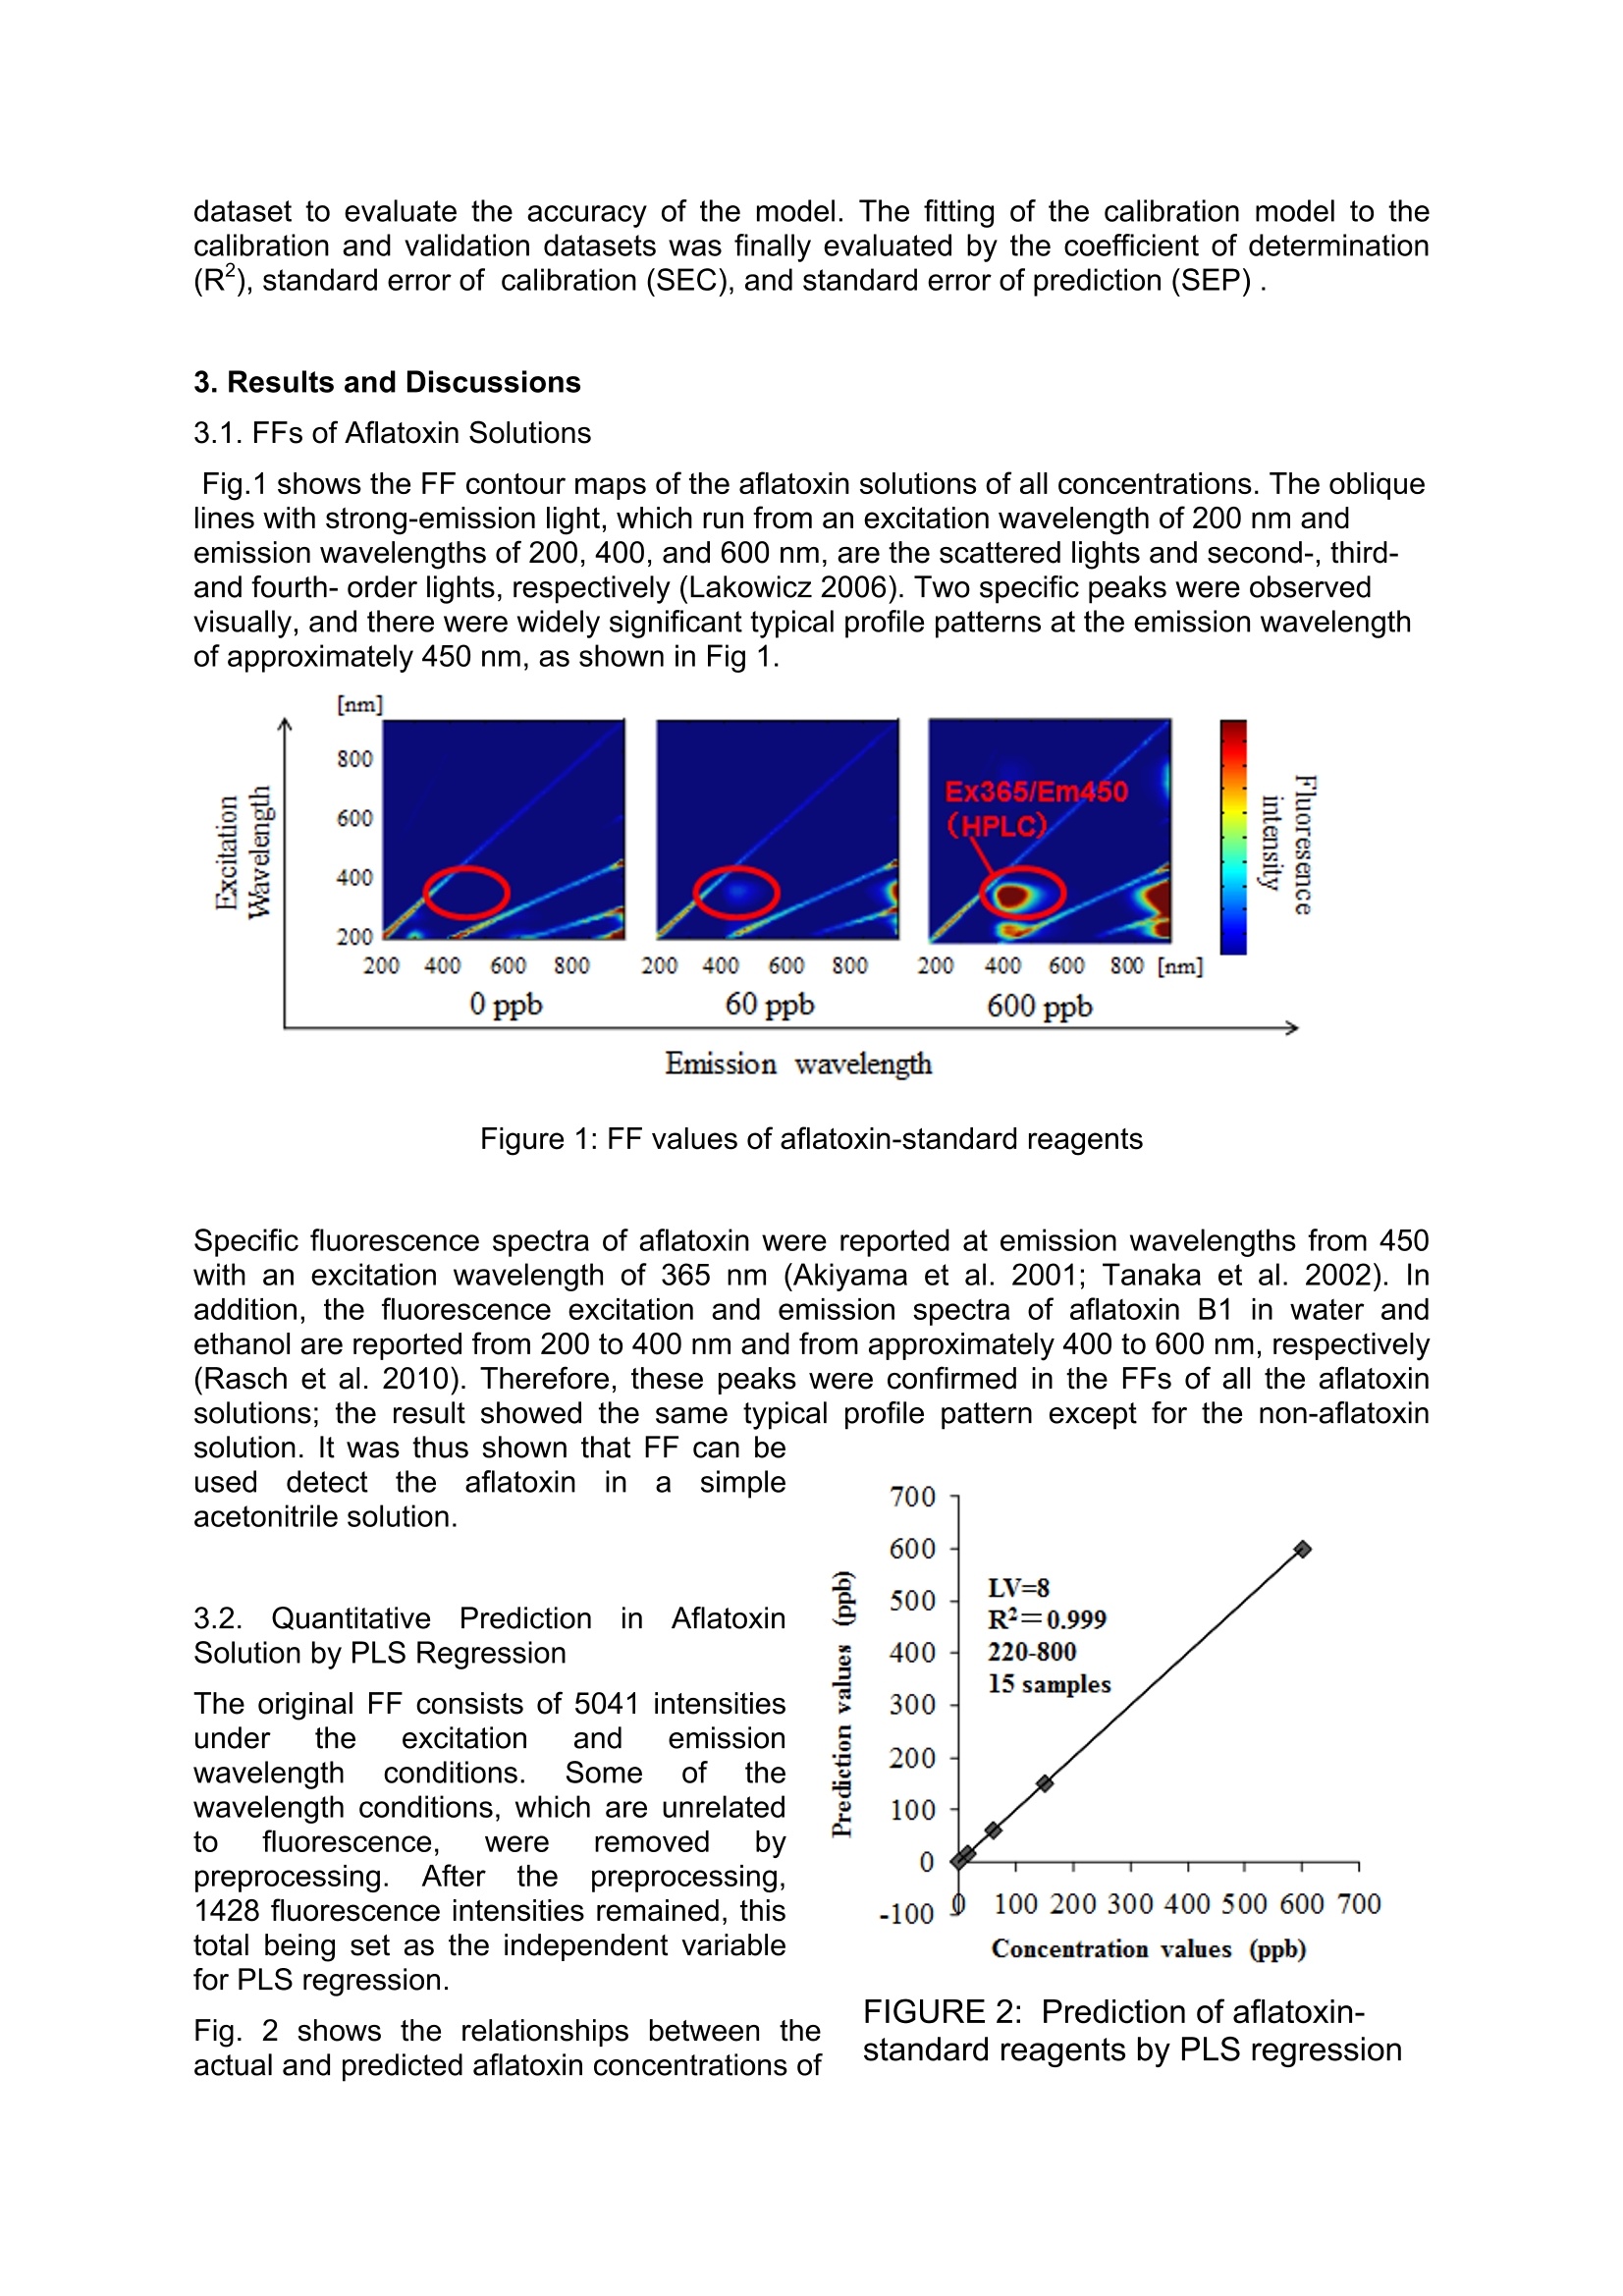
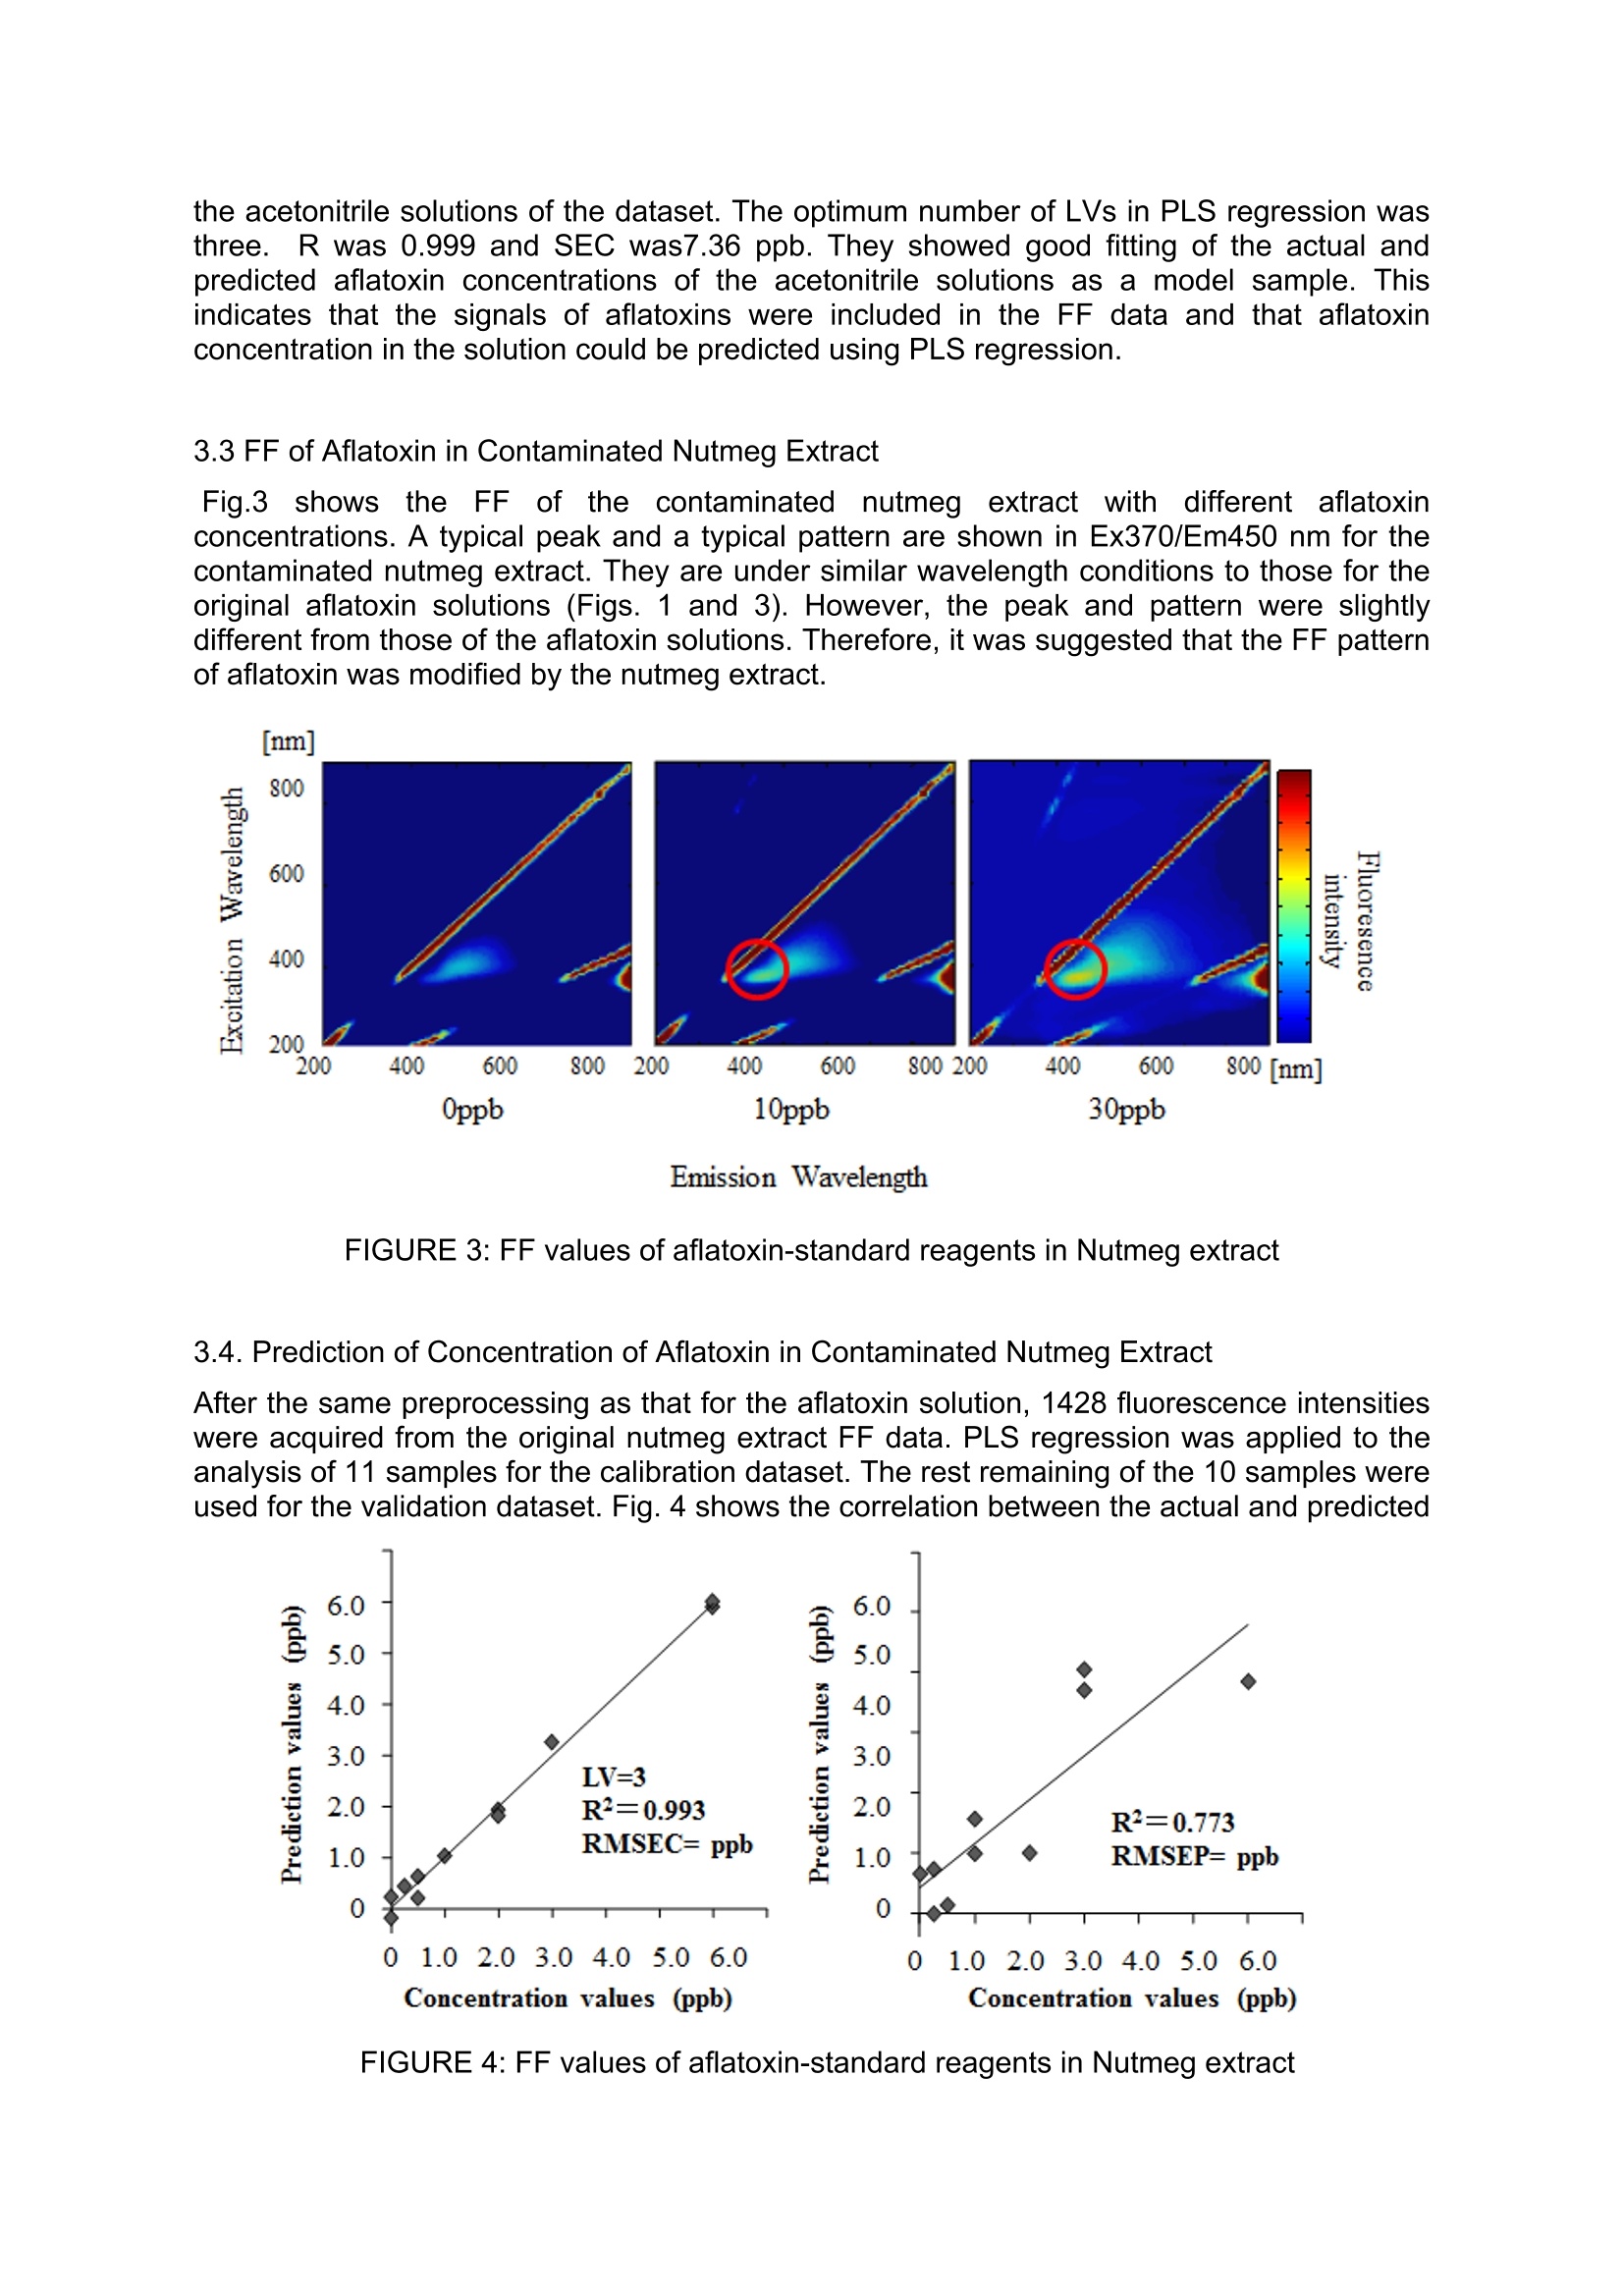
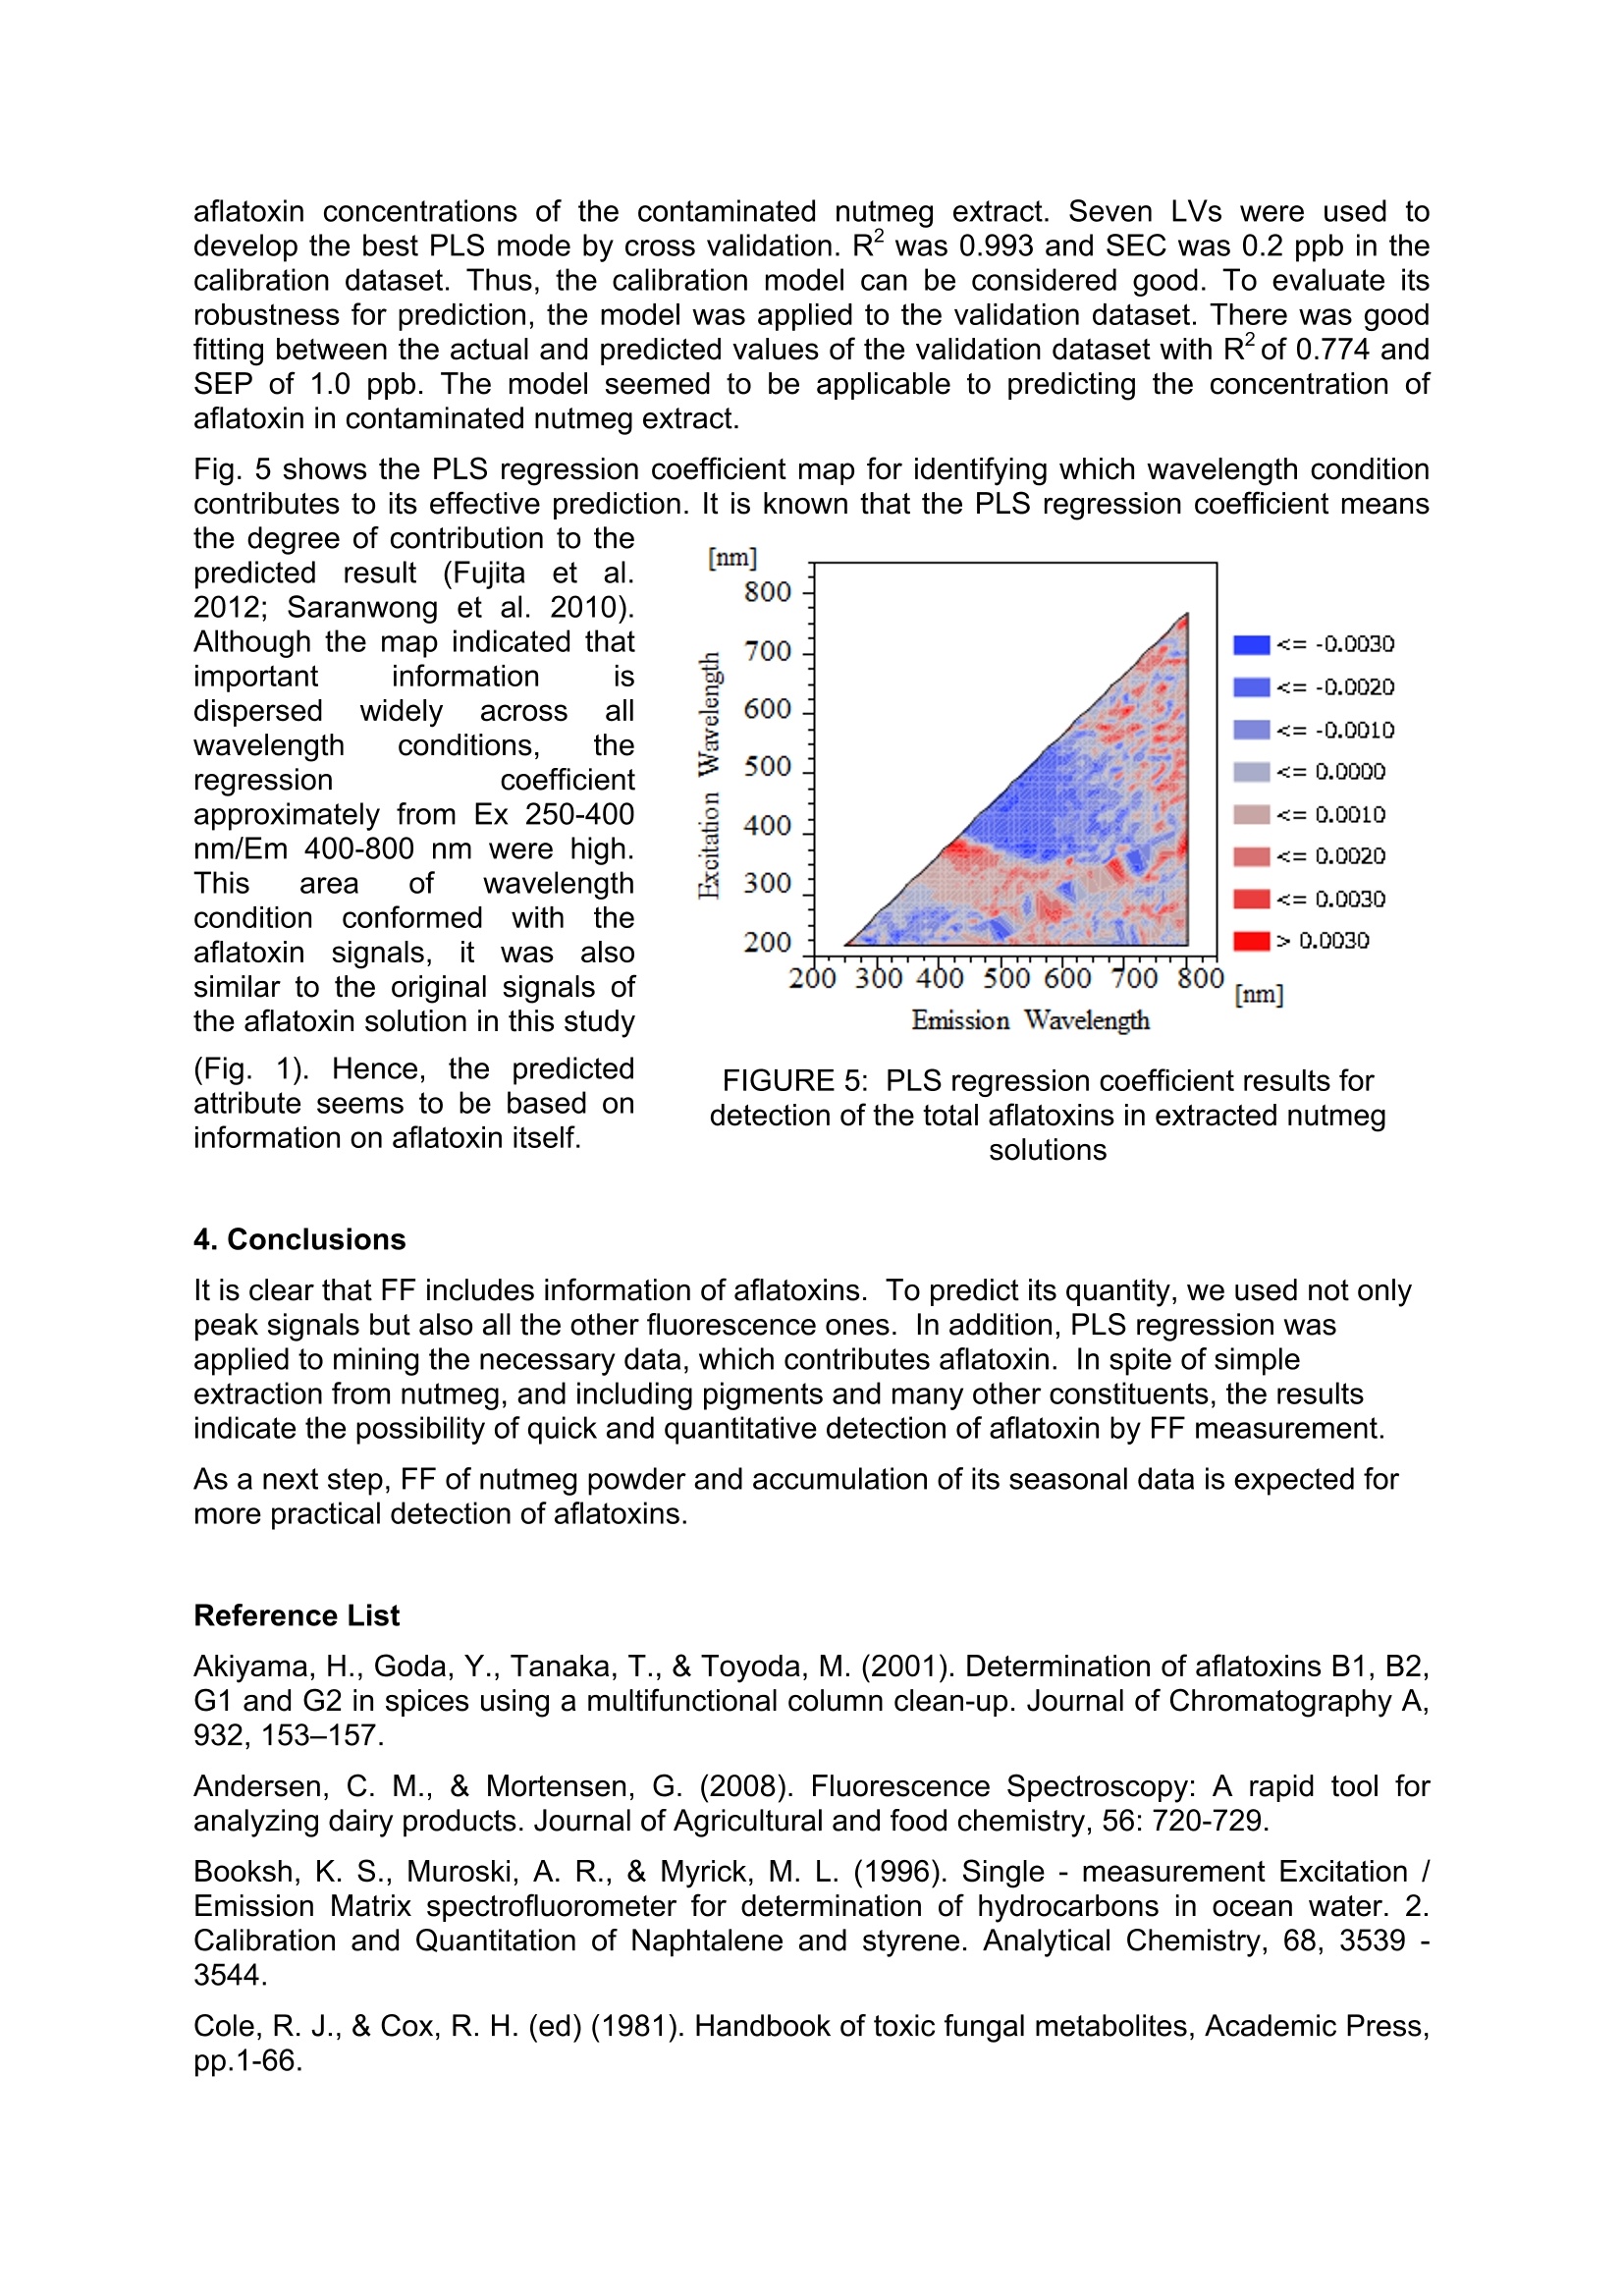
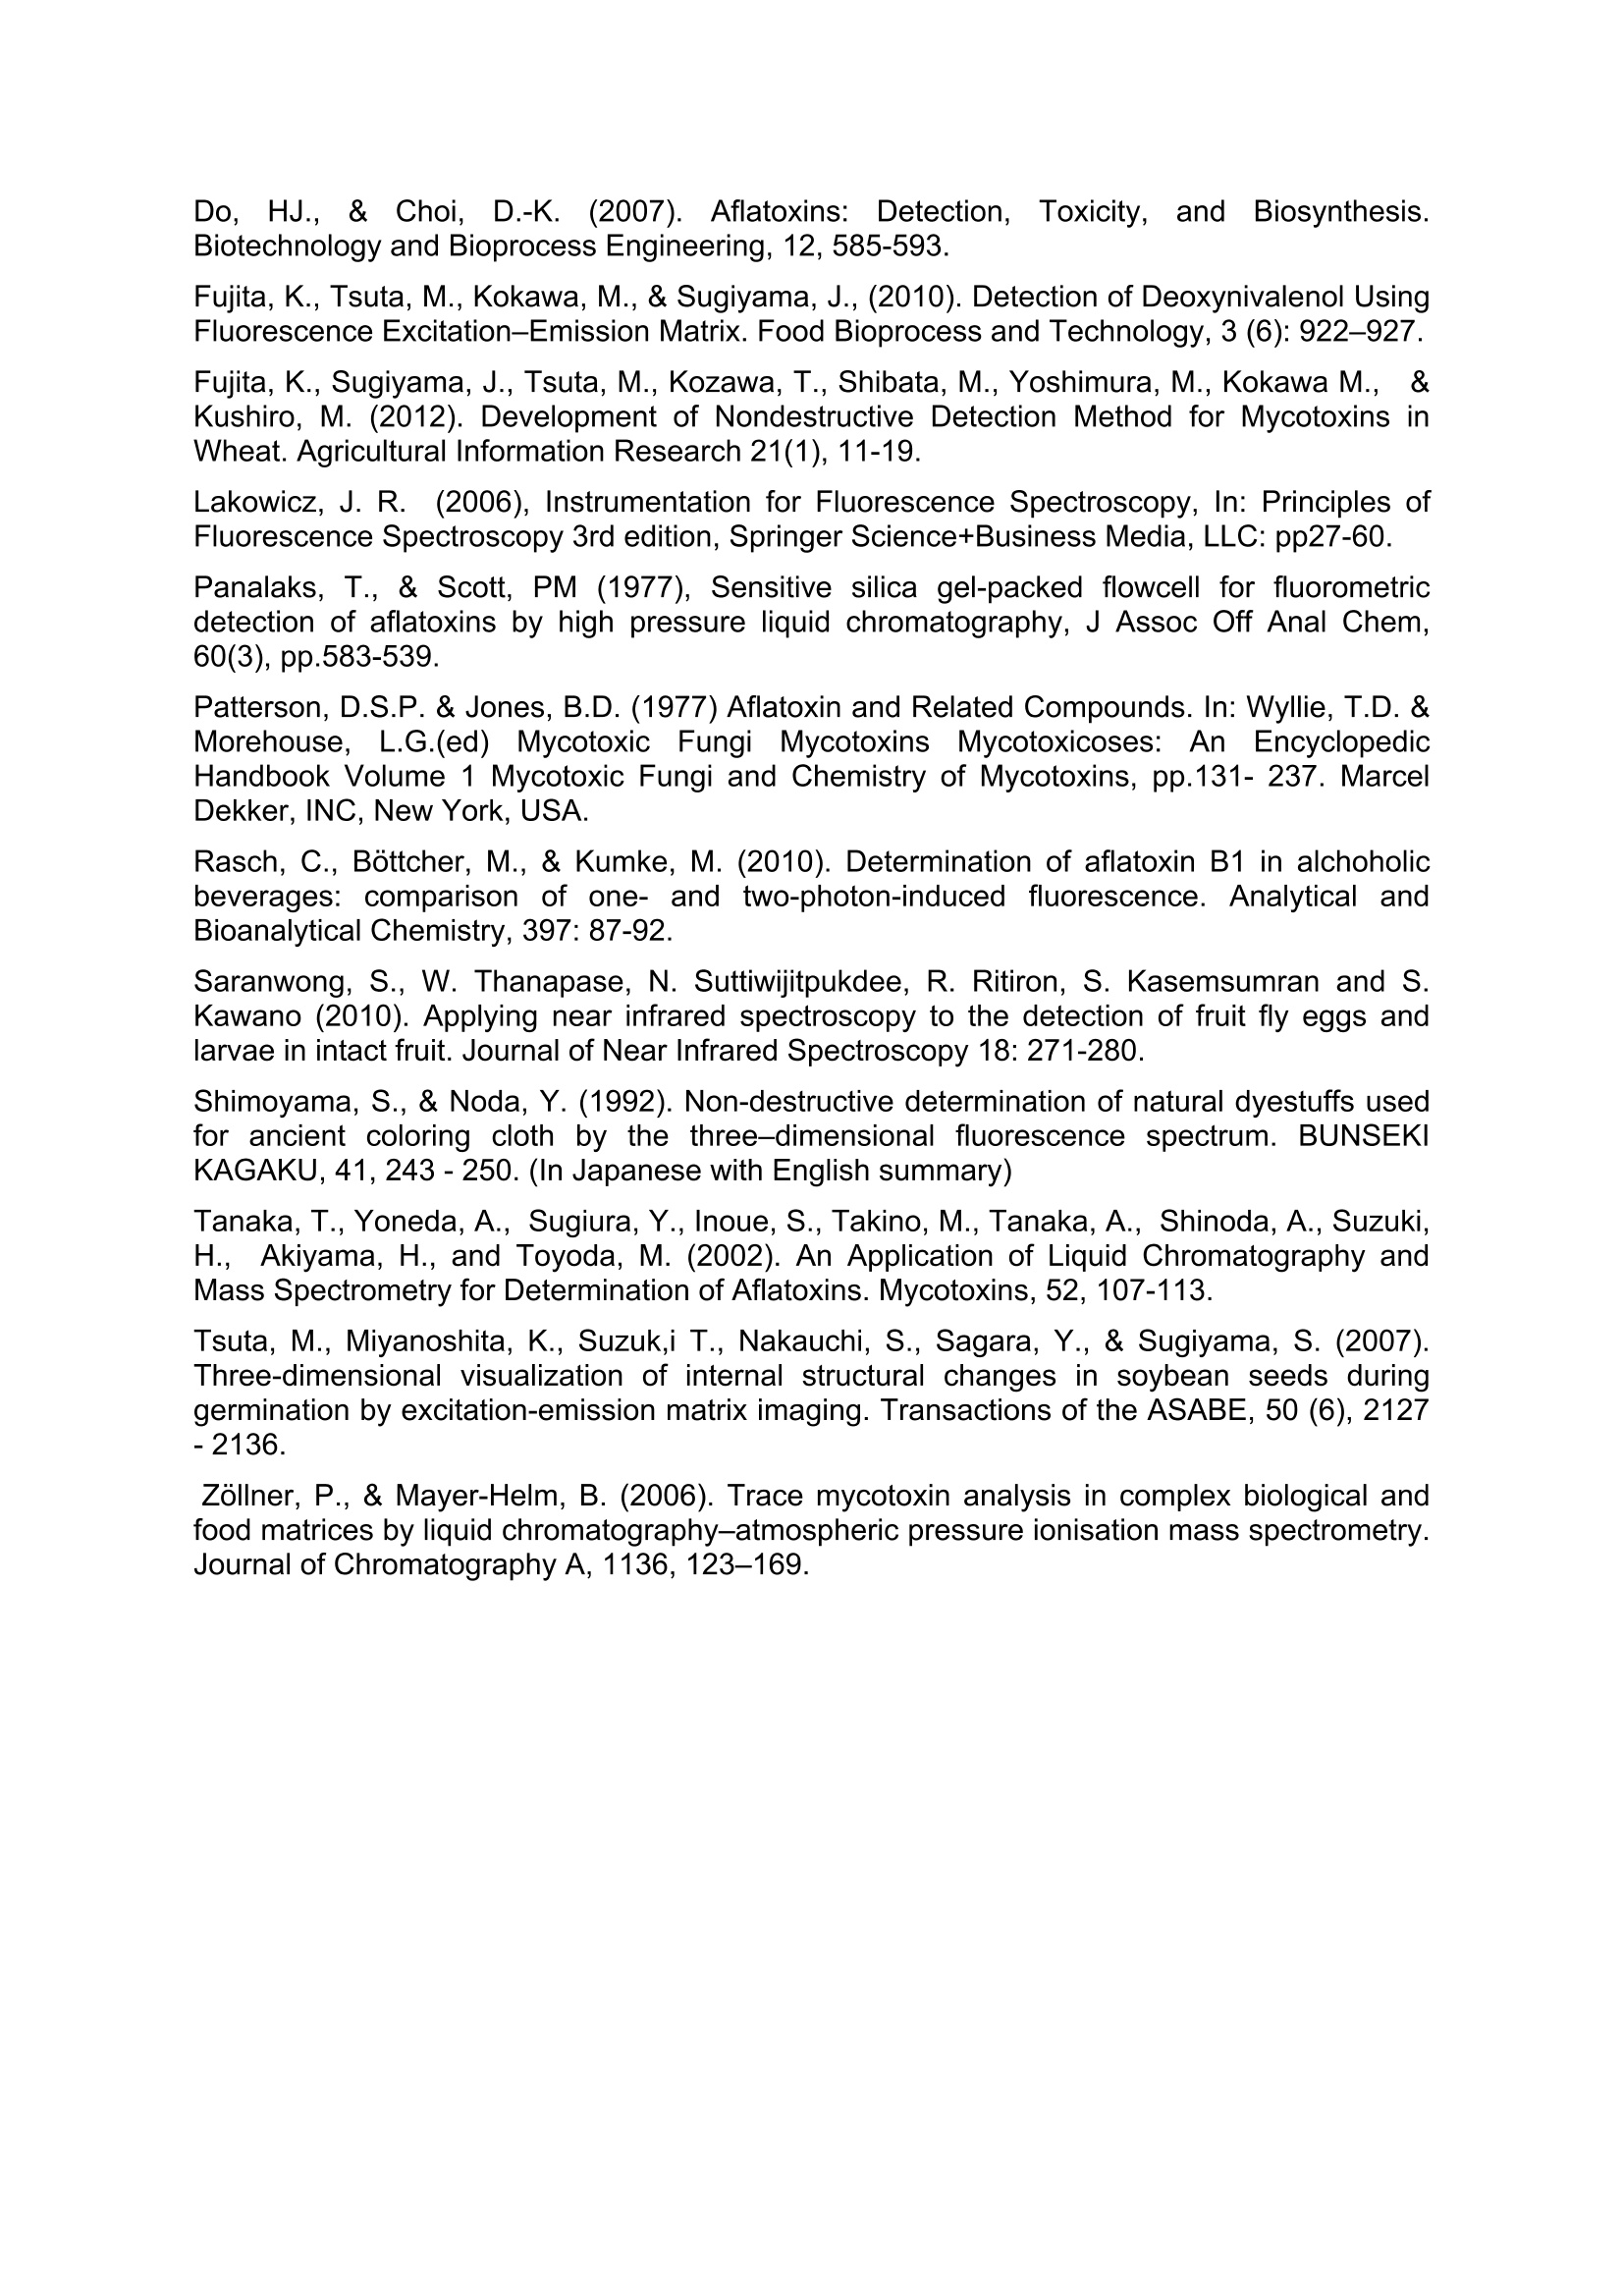
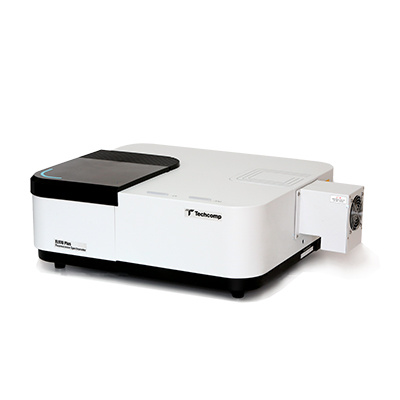
Detection of Aflatoxins B1, B2, G1, G2 in Nutmeg Extract UsingFluorescence Fingerprint Junichi Sugiyamal*, Kaori Fujita, Mizuki Tsuta Mario Shibata, Mito Kokawa², Hiroyuki Onda’, Takehito Sagawa’ National Food Research Institute, National Agriculture and Food Research Organization 2-1-12 Kan-nondai, Tsukuba, Ibaraki 305-8642, JAPAN Graduate School of Agricultural and Life Sciences, The University of Tokyo, 1-1-1 Yayoi, Bunkyo, Tokyo 113-8657, JAPAN S&B Food Inc., 38-8 Miyamoto, Itabashi, Tokyo 174-8651, JAPAN *Corresponding author. E-mail: sugiyama@affrc.go.jp Abstrat Aflatoxins are toxic metabolites produced by certain fungi in/on foods and feeds. They areprobably the best known and most intensively studied mycotoxins in the world. However,conventional chemical analysis of aflatoxins requires complex procedures, time consuming,and skillful work. Especially, nutmeg is one of spices to be checked for existence of aflatoxinin food industries. Rapid and practical method for aflatoxins has been expected. Nutmegextract was artificially contaminated with an aflatoxin reagent. The FF of contaminatednutmeg extract was measured with a fluorescence spectrometer. The FF data preprocessedto remove signals not related to FF. After the preprocessing, 1428 of 5041 fluorescenceintensities remained. They were set as explanatory variables for PLS regression. Then, theconcentration of total aflatoxin was set as the response variable. Eleven of the 21 sampleswere used for the calibration dataset, and the rest were used for the validation dataset.Seven latent variables were used to develop the best PLS model by cross validation. R2 was0.993 and SEC was 0.2 ppb for the calibration dataset. There were significant correlationsbetween the actual and predicted values of the validation dataset with R2of 0.774 and SEPof 1.0 ppb. The PLS correlation coefficient, which shows the degree of contribution to themodel under each wavelength condition, indicated that the prediction was mainly based onthe fluorescence of aflatoxin itself. Key words: Excitation-emission matrix, Fluorescence, Mycotoxin, PLS 1. Introduction Aflatoxins are toxic metabolites produced by Aspergillus spp. in foodstuffs and feeds.Aspergillus spp. are widely distributed in nature and frequently contaminate human foodstuffssuch as crops, beans, fruits, nuts, and spices. Since these toxins are strongly carcinogenic inhumans and domestic animals, it is important to analyze foodstuffs for their presence reliably(Patterson and Jones 1977; Zollner and Mayer-Helm 2006; Do and Choi,2007). Aflatoxins have generally been detected by their fluorescence propertyThe aflatoxin B grouptoxins are named for their blue fluorescence (425 nm), and the aflatoxin G group toxins fortheir green fluorescence (450 nm) under UV irradiation (Cole and Cox 1981). It is also knownthat aflatoxins exhibit strong fluorescence characteristic with under UV conditions (Cole andCox 1981; Panalaks and Scott 1977). This conventional fluorescence analysis is very useful;however, it still requires complicated preprocessing for sample preparation, a large amountof time, and excellent skills. On the other hands, a fluorescence fingerprint (FF), also knownas an excitation-emission matrix (EEM), is a series of fluorescence emission spectraacquired at consecutive excitation wavelengths (Tsuta et al. 2007; Fujita et al. 2010). Thepattern of an FF diagram is unique for each constituent, like a fingerprint, making it possibleto identify a particular substance in a mixture (Andersen and Mortensen 2008; Booksh et al.1996; Shimoyama and Noda 1992; Tsuta et al. 2007). The use of FF is a highly sensitivve method compared with typical fluorescence measurements, because the FF method uses allspectral data consisting of excitation xemission xfluorescence intensities. The objectives of this study were 1) to investigate the original aflatoxin FF pattern with a widerange of wavelengths and 2) to develop a method of predicting the aflatoxin concentration ofa crude nutmeg extract using FF. 2. Materials and Methods 2.1. Sample Preparation The reagents for aflatoxins B1, B2, G1 and G2 (≥99% purity, produced by Aspergillus flavus)used in this experiment were purchased from Sigma-Aldrich (St.. Louis, MO, USA).Acetonitrile (Wako Pure Chemical Industries, Japan) and Millipore water from a Milli-Qsystem (Millipore Biocel A10, Nihon Millipore, Tokyo, Japan) were used. 0, 15, 60, 150, and600 pg/L aflatoxin solutions were prepared in 90% acetonitrile solution for the preliminaryexperiment. Nutmeg extract was prepared from noncontaminated nutmeg seeds. The extraction methodwas based on an official standard method. Fifty grams of ground nutmeg placed in 400 mL of90% acetonitrile solution was blended using a shaker for five min. Then, solid substanceswere excluded by paper filtration. Finally, the nutmeg extract was artificially contaminatedwith aflatoxin at 5% volume of the extract. The aflatoxin concentration of the nutmeg extractwas prepared to be 0, 2.5, 5,10,20,30, and 60 ppb. Twenty one sampleswithseven aflatoxin concentrationsSprepared fromn the abovecontaminated nutmeg extract were divided into two groups: 11 were used as the calibrationdataset to develop a calibration model, and the remaining 10 as the validation dataset tovalidate the calibration model. 2.2 Fluorescence Fingerprint Measurement FF was measured with a fluorescence spectrometer (F-7000, Hitachi High-TechnologiesCorporation, Tokyo, Japan). An optional photomultiplier (R928, Hamamatsu Photonics K.K.,Japan) was used as the light detector that extends the upper wavelength range to 900 nm.The measurement range for the excitation and emission wavelengths was 200-900 nm, with10 nm wavelength increments. The slit widths on both the excitation and emission sides werefixed at 10 nm. The photomultiplier voltage was 400 V, and the wavelength scanning speedwas set to 30000 nm/min with a response time of 0.002 sec. The artificially contaminated nutmeg extract was diluted to one tenth with 90% acetonitrilesolution to prevent pigment effects. On the other hand, the aflatoxin solutions were measuredwithout dilution because they were already transparent. These samples at 300pL each werepipetted into a 1.0 ml microcell (FM20-SQ-3, GL Sciences Inc., Tokyo, Japan). The dilutedsolution was referred to as the contaminated nutmeg extract hereafter. FF was acquiredthree times for each sample solution. The contour map of FF was created using Matlab 2008. 2.3. Chemometrics The quantification models; of aflatoxin concentration for theaflatoxinsolutionsi oncontaminated nutmeg extract were developed using JMP 8.0 (SAS, NC, USA). Partial leastsquares (PLS) regression with leave-one-out cross validation was applied to the FF data ofthe calibration samples as well as to the true aflatoxin concentrations to develop a calibrationmodel. The performance of PLS models depends on the number of latent variables (LVs)used. The optimum number of LVs was determined by minimizing the root-mean-squareerror of the prediction of cross-validation. The calibration model was applied to the validation dataset to evaluate the accuracy of the model. The fitting of the calibration model to thecalibration and validation datasets was finally evaluated by the coefficient of determination(R), standard error of calibration (SEC), and standard error of prediction (SEP). 3.Results and Discussions 3.1. FFs of Aflatoxin Solutions Fig.1 shows the FF contour maps of the aflatoxin solutions of all concentrations. The obliquelines with strong-emission light, which run from an excitation wavelength of 200 nm andemission wavelengths of 200, 400, and 600 nm, are the scattered lights and second-, third-and fourth- order lights, respectively (Lakowicz 2006). Two specific peaks were observedvisually, and there were widely significant typical profile patterns at the emission wavelengthof approximately 450 nm, as shown in Fig 1. Emission wavelength Figure 1: FF values of aflatoxin-standard reagents Specific fluorescence spectra of aflatoxin were reported at emission wavelengths from 450with an excitation wavelength of 365 nm (Akiyama et al. 2001; Tanaka et al. 2002). Inaddition, the fluorescence excitation and emission spectra of aflatoxin B1 in water andethanol are reported from 200 to 400 nm and from approximately 400 to 600 nm, respectively(Rasch et al. 2010). Therefore, these peaks were confirmed in the FFs of all the aflatoxinsolutions; the result showed the same typical profile pattern except for the non-aflatoxin solution. It was thus shown that FF can be useddetectthee aflatoxin ina simpleacetonitrile solution. 3.2. Quantitative Predictioni inAflatoxinSolution by PLS Regression The original FF consists of 5041 intensitiesunder the excitation and emissionwavelength conditions. Some ofthewavelength conditions, which are unrelatedto ffPluorescence. Were removed bypreprocessing.After the preprocessing,1428 fluorescence intensities remained, thistotal being set as the independent variablefor PLS regression. Fig. 2 shows the relationships between theactual and predicted aflatoxin concentrations of FIGURE 2: Prediction of aflatoxin-standard reagents by PLS regression the acetonitrile solutions of the dataset. The optimum number of LVs in PLS regression wasthree. R was 0.999 and SEC was7.36 ppb. They showed good fitting of the actual andpredicted aflatoxin concentrations of the acetonitrile solutions as a model sample. Thisindicates that the signals of aflatoxins were included in the FF data and that aflatoxinconcentration in the solution could be predicted using PLS regression. 3.3 FF of Aflatoxin in Contaminated Nutmeg Extract :Fig.3l shows the FF of the contaminated nutmeg extract with different aflatoxinconcentrations. A typical peak and a typical pattern are shown in Ex370/Em450 nm for thecontaminated nutmeg extract. They are under similar wavelength conditions to those for theoriginal aflatoxin solutions (Figs. 1 and 3). However, the peak and pattern were slightlydifferent from those of the aflatoxin solutions. Therefore, it was suggested that the FF patternof aflatoxin was modified by the nutmeg extract. FIGURE 3: FF values of aflatoxin-standard reagents in Nutmeg extract 3.4. Prediction of Concentration of Aflatoxin in Contaminated Nutmeg Extract After the same preprocessing as that for the aflatoxin solution, 1428 fluorescence intensitieswere acquired from the original nutmeg extract FF data. PLS regression was applied to theanalysis of 11 samples for the calibration dataset. The rest remaining of the 10 samples wereused for the validation dataset. Fig. 4 shows the correlation between the actual and predicted FIGURE 4: FF values of aflatoxin-standard reagents in Nutmeg extract the degree of contribution to thepredicted result (Fujita et al.2012; Saranwong et al.2010).Although the map indicated thatimportant informationdispersed widelyacrosswavelength conditions. theregression coefficientapproximately from Ex 250-400nm/Em 400-800 nm were high.This area of wavelengthcondition conformed withhtheaflatoxin signals, itwas alsosimilar to the original signals ofthe aflatoxin solution in this study(Fig. 1). Hence, the predicted attribute seems to be based on information on aflatoxin itself. FIGURE 5: PLS regression coefficient results fordetection of the total aflatoxins in extracted nutmegsolutions 4. Conclusions It is clear that FF includes information of aflatoxins. To predict its quantity, we used not onlypeak signals but also all the other fluorescence ones. In addition, PLS regression wasapplied to mining the necessary data, which contributes aflatoxin. In spite of simpleextraction from nutmeg, and including pigments and many other constituents, the resultsindicate the possibility of quick and quantitative detection of aflatoxin by FF measurement. As a next step, FF of nutmeg powder and accumulation of its seasonal data is expected formore practical detection of aflatoxins. Reference List ( Akiyama, H . , Goda, Y., T a naka, T., & Toyoda, M. ( 2001). Determination of aflatoxins B1, B2,G1 a nd G2 in s p ices u s ing a m u ltifunctional column clean-up. Journal of C hromatography A, 932,153-157. ) ( Andersen, C . M., & M o rtensen, G. (2008). Fluorescence Spectroscopy: A rapid tool foranalyzing dairy products. Journal of Agricultural and food chemistry, 56 : 72 0 -729. ) Booksh, K. S., Muroski, A. R., & Myrick, M. L. (1996). Single- measurement Excitation /Emission Matrix spectrofluorometer for determination of hydrocarbons in ocean water. 2.Calibration and Quantitation of Naphtalene and styrene. Analytical Chemistry, 68, 3539 -3544. ( Cole, R. J., & Cox, R. H. (ed) (1981) . Handbook of toxic fungal metabolites, Academic Press, pp.1-66. ) Do, HJ., & Choi, D.-.K. (2007). Aflatoxins: Detection,1, Toxicity,,andBiosynthesis.Biotechnology and Bioprocess Engineering, 12, 585-593. Fujita, K., Tsuta, M., Kokawa, M., & Sugiyama,J., (2010). Detection of Deoxynivalenol UsingFluorescence Excitation-Emission Matrix. Food Bioprocess and Technology, 3 (6): 922-927. Fujita, K., Sugiyama, J., Tsuta, M., Kozawa, T., Shibata, M., Yoshimura, M., Kokawa M.,&Kushiro, M. (2012). Development of Nondestructive Detection Method for Mycotoxins inWheat. Agricultural Information Research 21(1), 11-19. Lakowicz, J. R. (2006), Instrumentation for Fluorescence Spectroscopy, In: Principles ofFluorescence Spectroscopy 3rd edition, Springer Science+Business Media,LLC: pp27-60. Panalaks, T., & Scott, PM (1977), Sensitive silica gel-packed flowcell for fluorometricdetection of aflatoxins by high pressure liquid chromatography, J Assoc Off Anal Chem,60(3),pp.583-539. Patterson, D.S.P. & Jones, B.D. (1977) Aflatoxin and Related Compounds. In: Wyllie, T.D. &Morehouse, L.G.(ed) Mycotoxic Fungi MycotoxinsMycotoxicoses: An EncyclopedicHandbook Volume 1 Mycotoxic Fungi and Chemistry of Mycotoxins, pp.131-237. MarcelDekker, INC, New York, USA. Rasch, C., Bottcher, M., & Kumke, M. (2010). Determination of aflatoxin B1 in alchoholicbeverages: comparison of one- and two-photon-induced fluorescence. Analytical andBioanalytical Chemistry, 397:87-92. Saranwong, S., W. Thanapase, N. Suttiwijitpukdee, R. Ritiron, S. Kasemsumran and S.Kawano (2010). Applying near infrared spectroscopy to the detection of fruit fly eggs andlarvae in intact fruit. Journal of Near Infrared Spectroscopy 18: 271-280. Shimoyama, S., & Noda, Y. (1992). Non-destructive determination of natural dyestuffs usedfor ancient coloring cloth by the three-dimensional fluorescence spectrum. BUNSEKIKAGAKU, 41, 243-250. (In Japanese with English summary) Tanaka, T., Yoneda, A., Sugiura, Y., Inoue, S., Takino, M., Tanaka, A., Shinoda, A., Suzuki,H., Akiyama, H., and Toyoda, M. (2002). An Application of Liquid Chromatography andMass Spectrometry for Determination of Aflatoxins. Mycotoxins,52, 107-113. Tsuta, M., Miyanoshita, K., Suzuk,i T., Nakauchi, S., Sagara, Y., & Sugiyama, S. (2007).Three-dimensional visualization of internal structural changes in soybean seeds duringgermination by excitation-emission matrix imaging. Transactions of the ASABE, 50 (6), 2127-2136. Zollner, P., & Mayer-Helm, B.(2006). Trace mycotoxin analysis in complex biological andfood matrices by liquid chromatography-atmospheric pressure ionisation mass spectrometry.Journal of Chromatography A, 1136, 123-169.
确定
还剩4页未读,是否继续阅读?

产品配置单
日立科学仪器(北京)有限公司为您提供《肉豆蔻中黄曲霉毒素检测方案(分子荧光光谱)》,该方案主要用于小麦粉中真菌毒素检测,参考标准--,《肉豆蔻中黄曲霉毒素检测方案(分子荧光光谱)》用到的仪器有日立F-7000荧光分光光度计
推荐专场
相关方案
更多
该厂商其他方案
更多