


方案详情
文
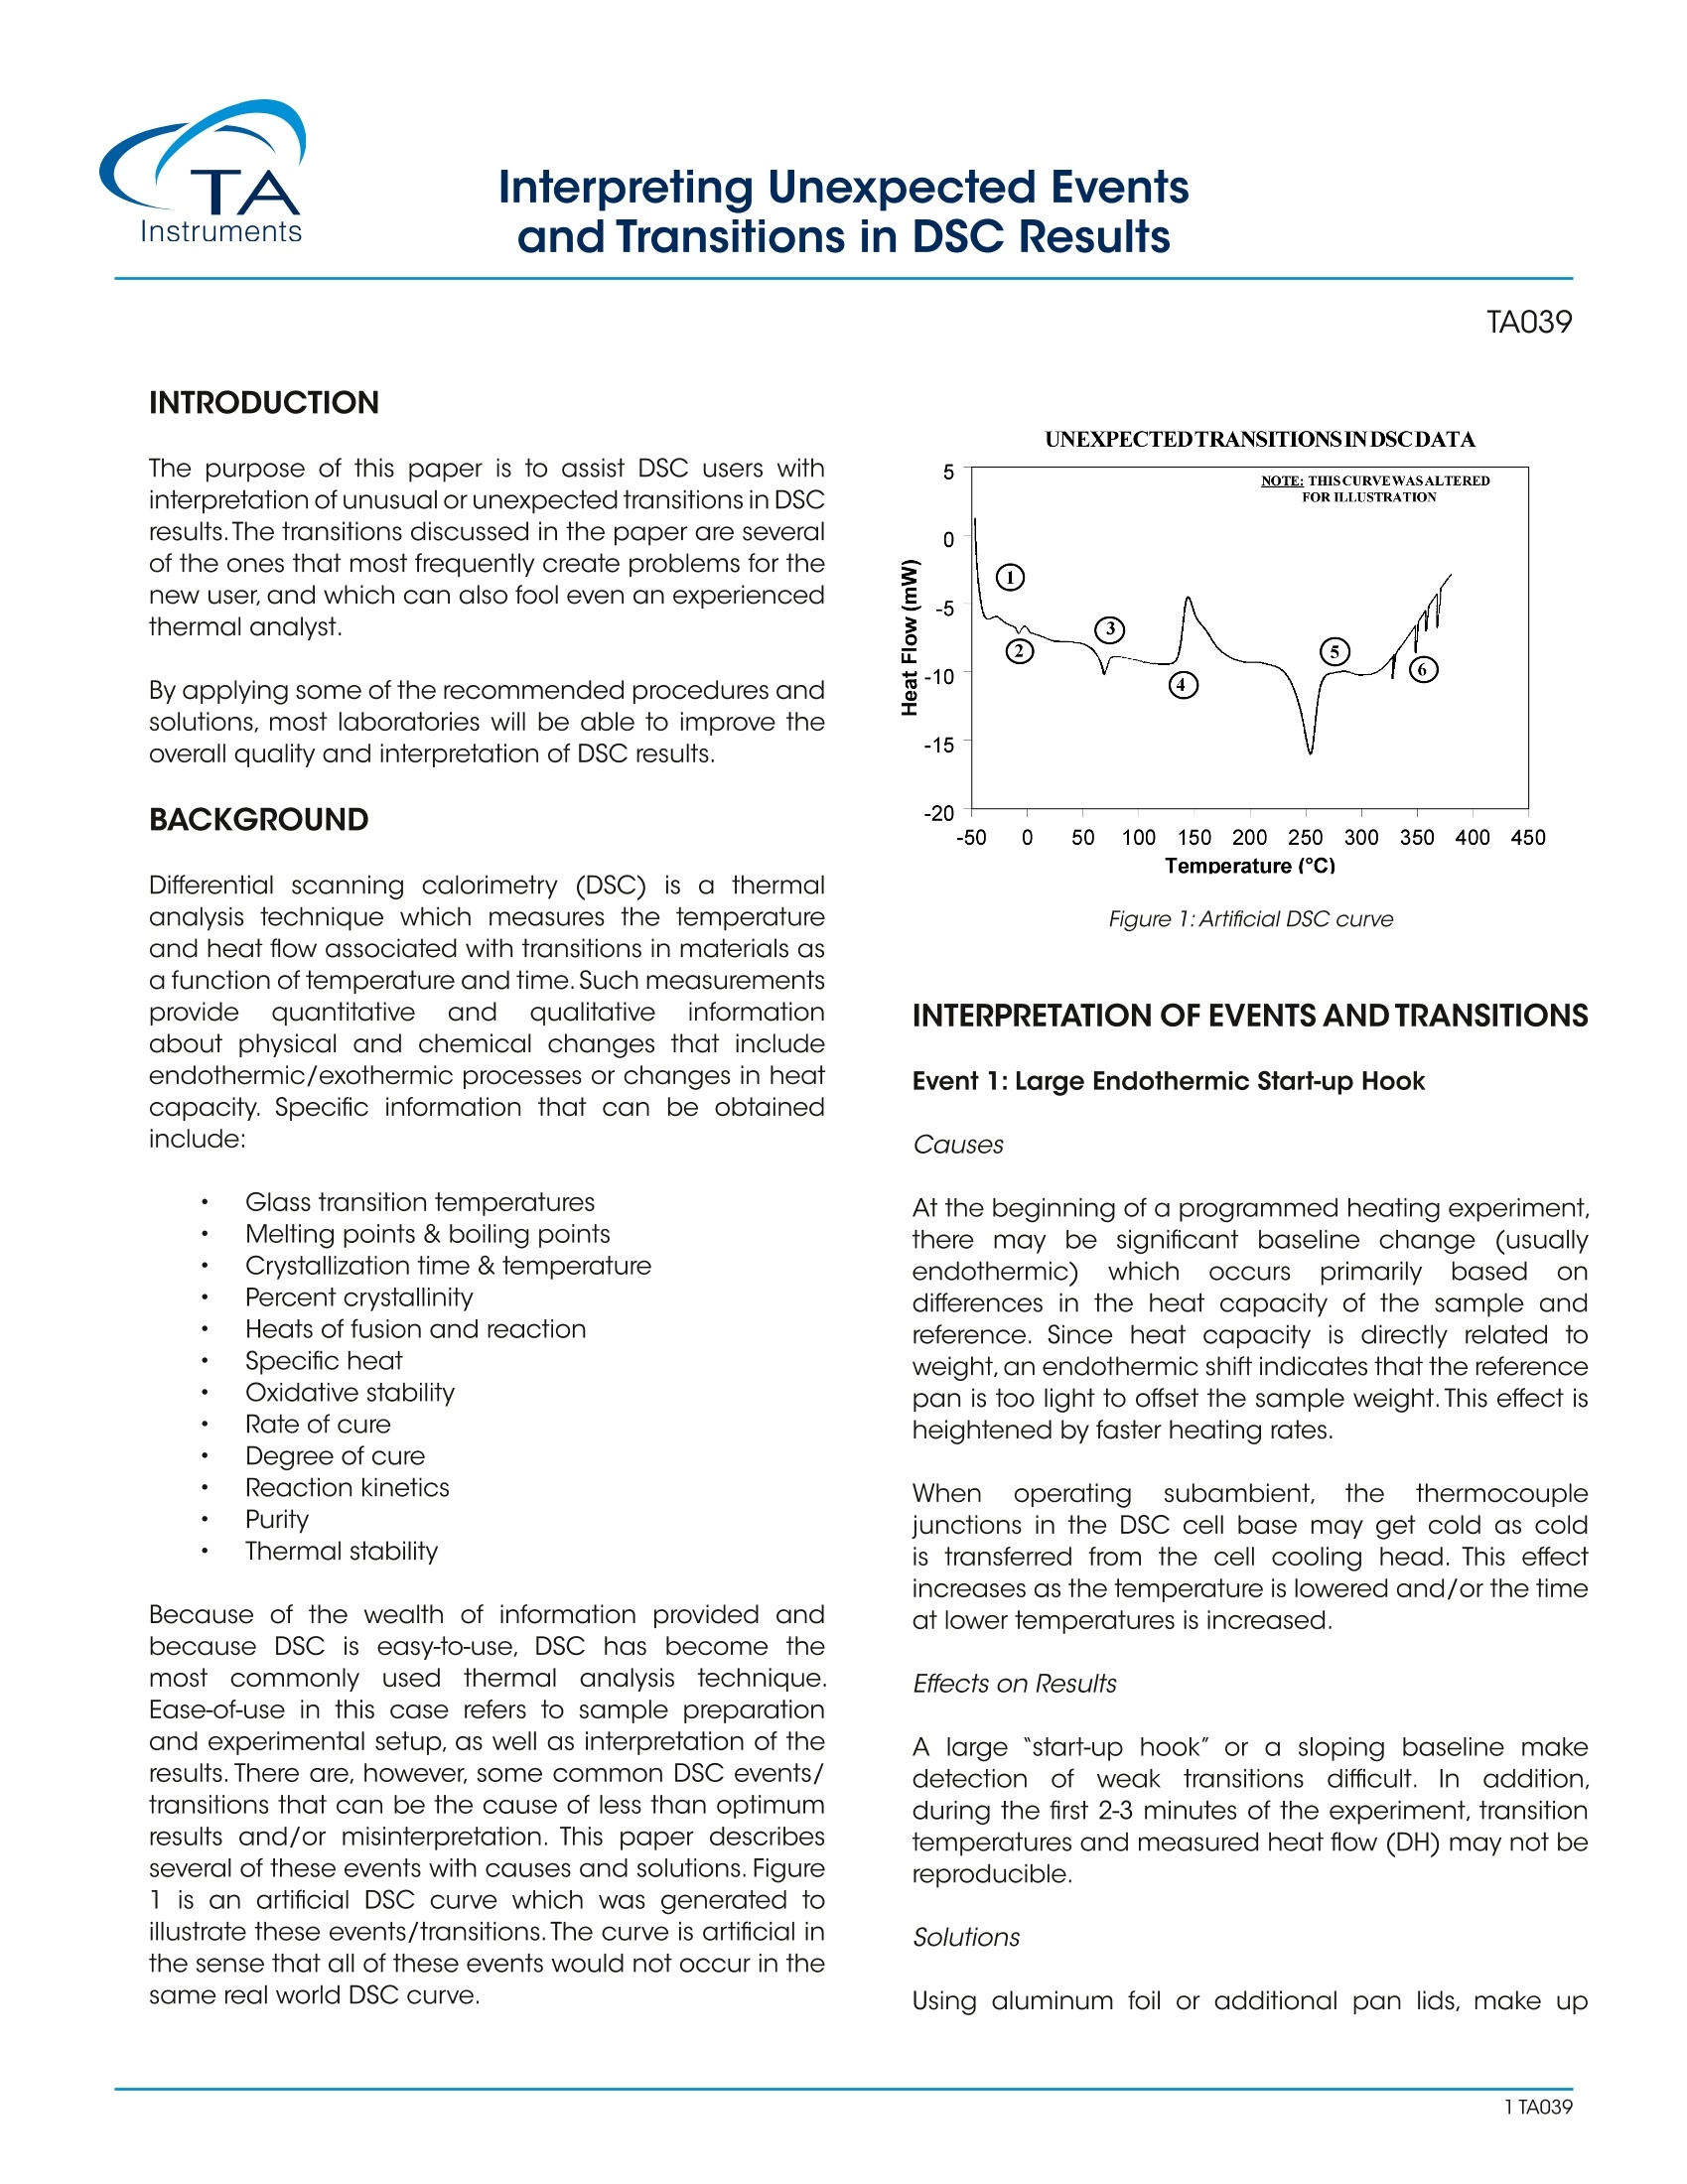
The purpose of this paper is to assist DSC users with interpretation of unusual or unexpected transitions in DSC results. The transitions discussed in the paper are several of the ones that most frequently create problems for the new user, and which can also fool even an experienced thermal analyst.
By applying some of the recommended procedures and solutions, most laboratories will be able to improve the overall quality and interpretation of DSC results.
方案详情

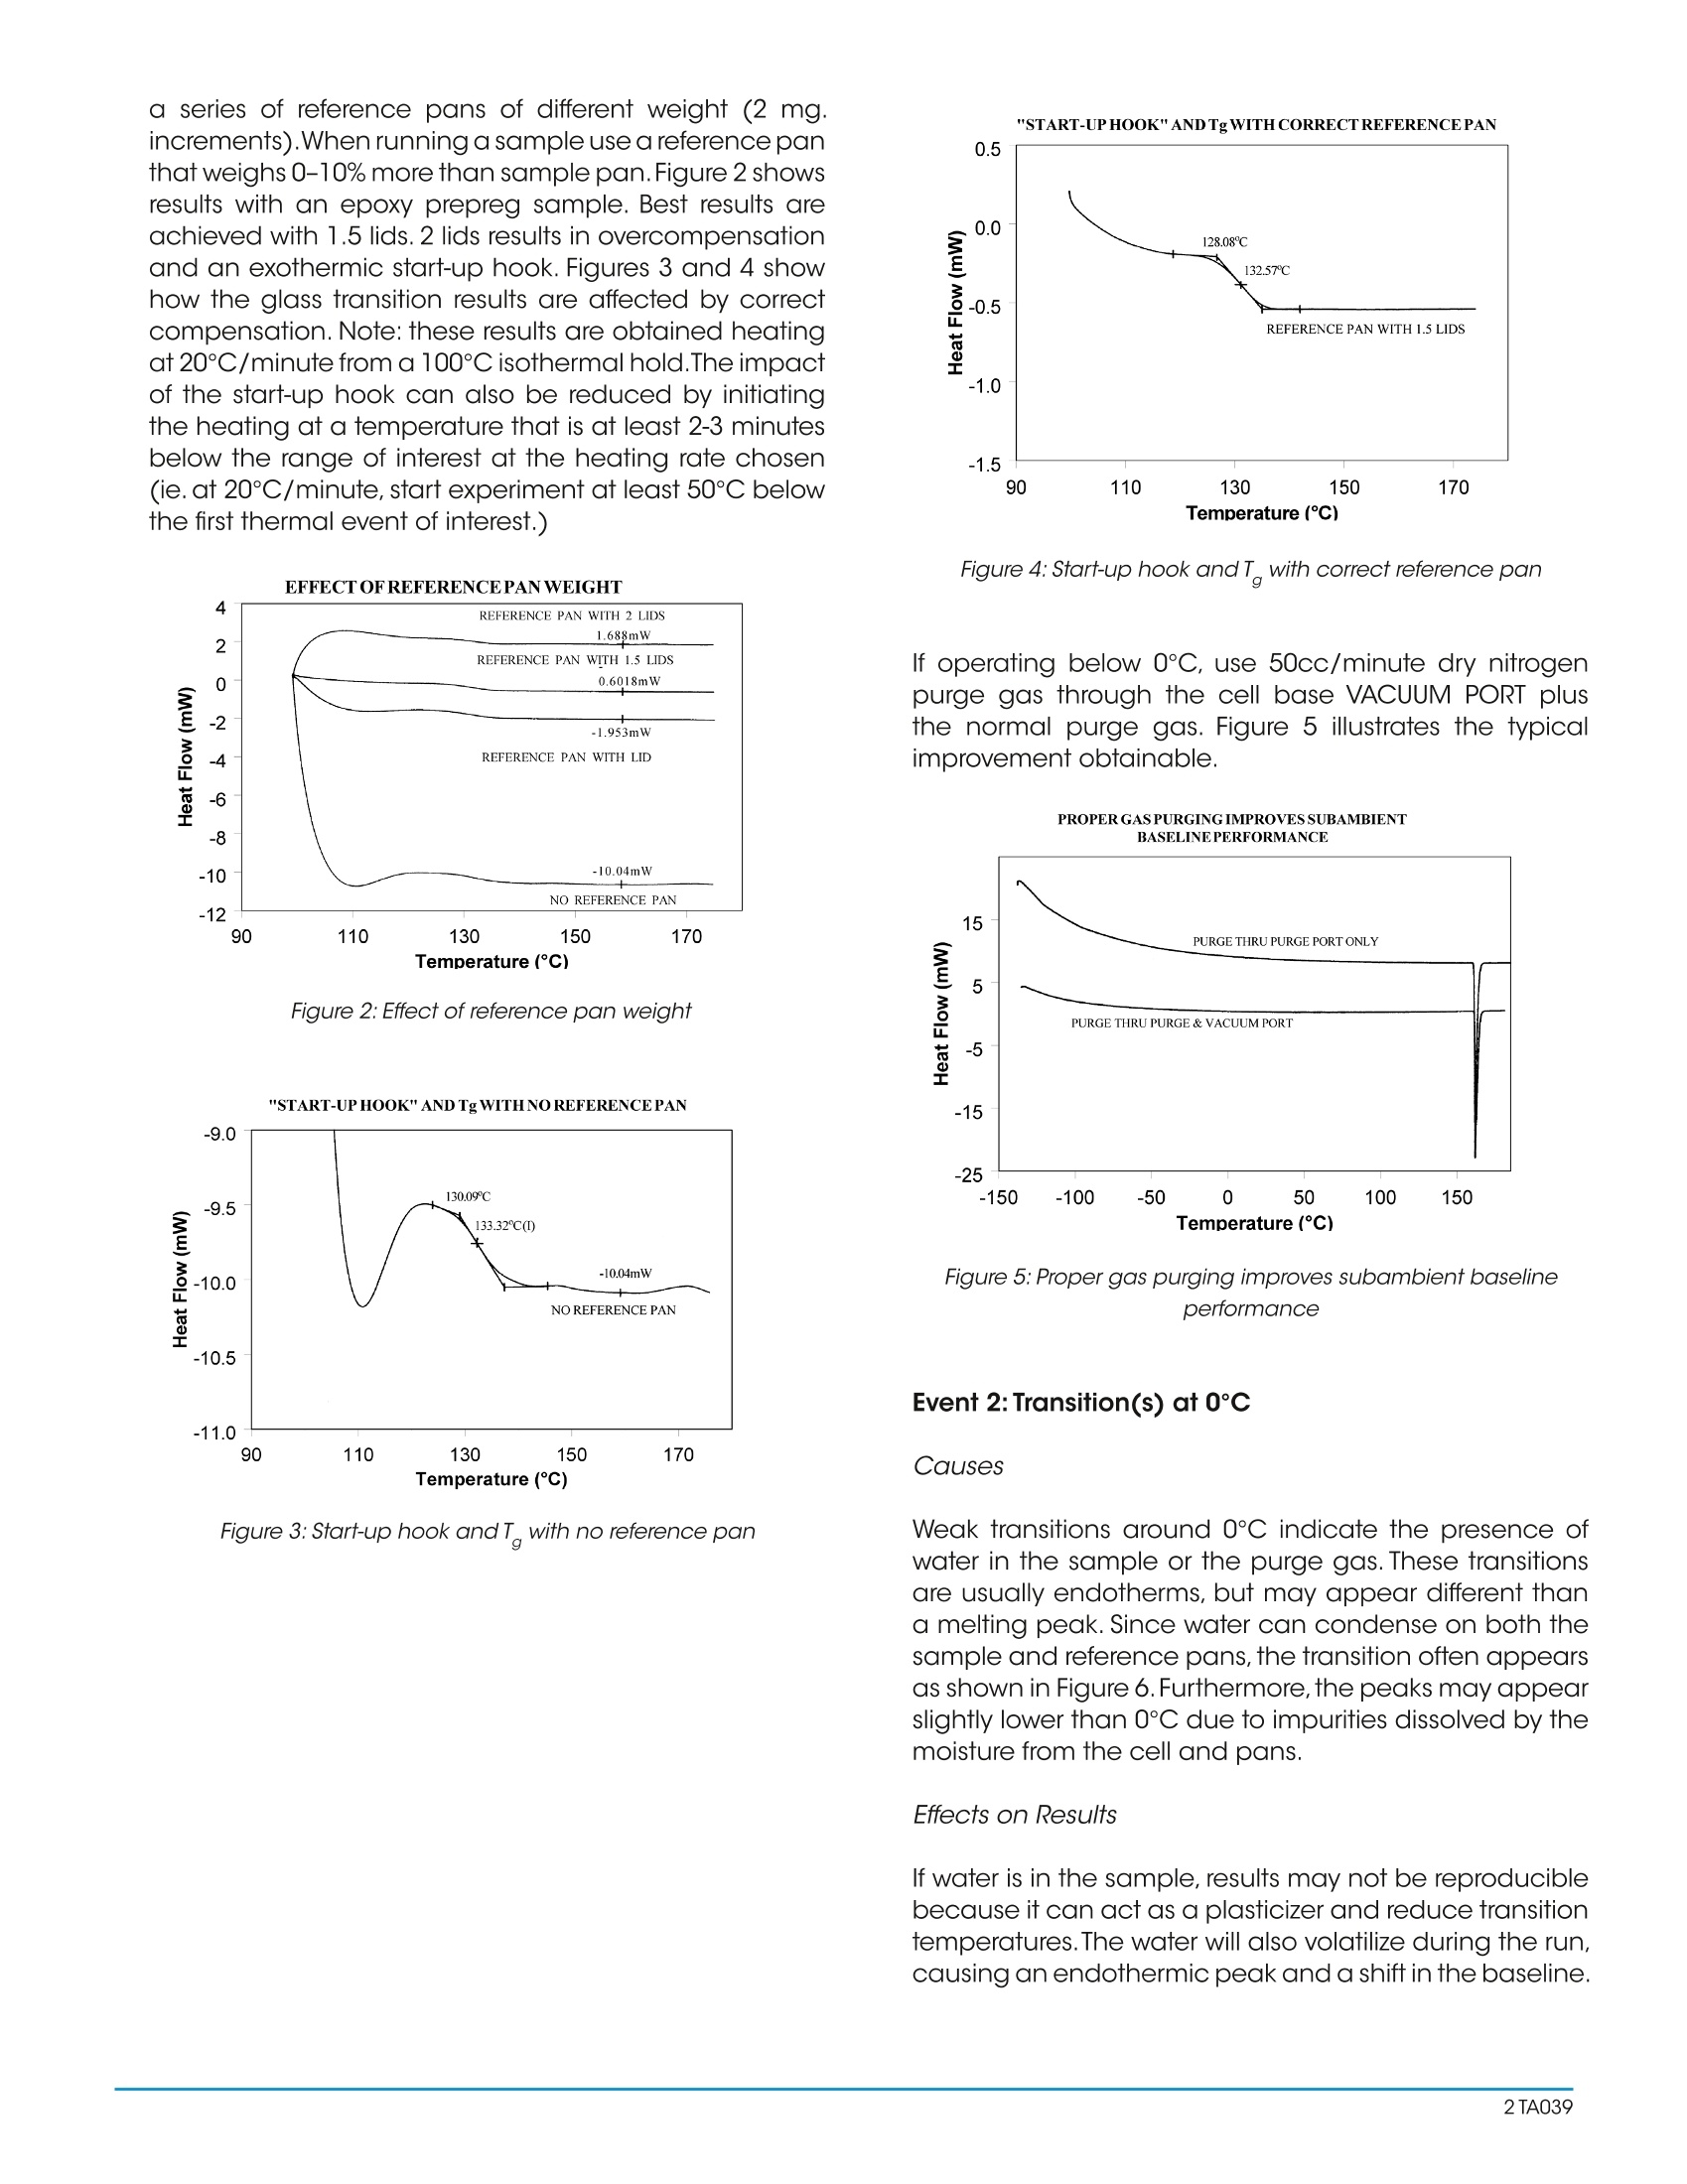
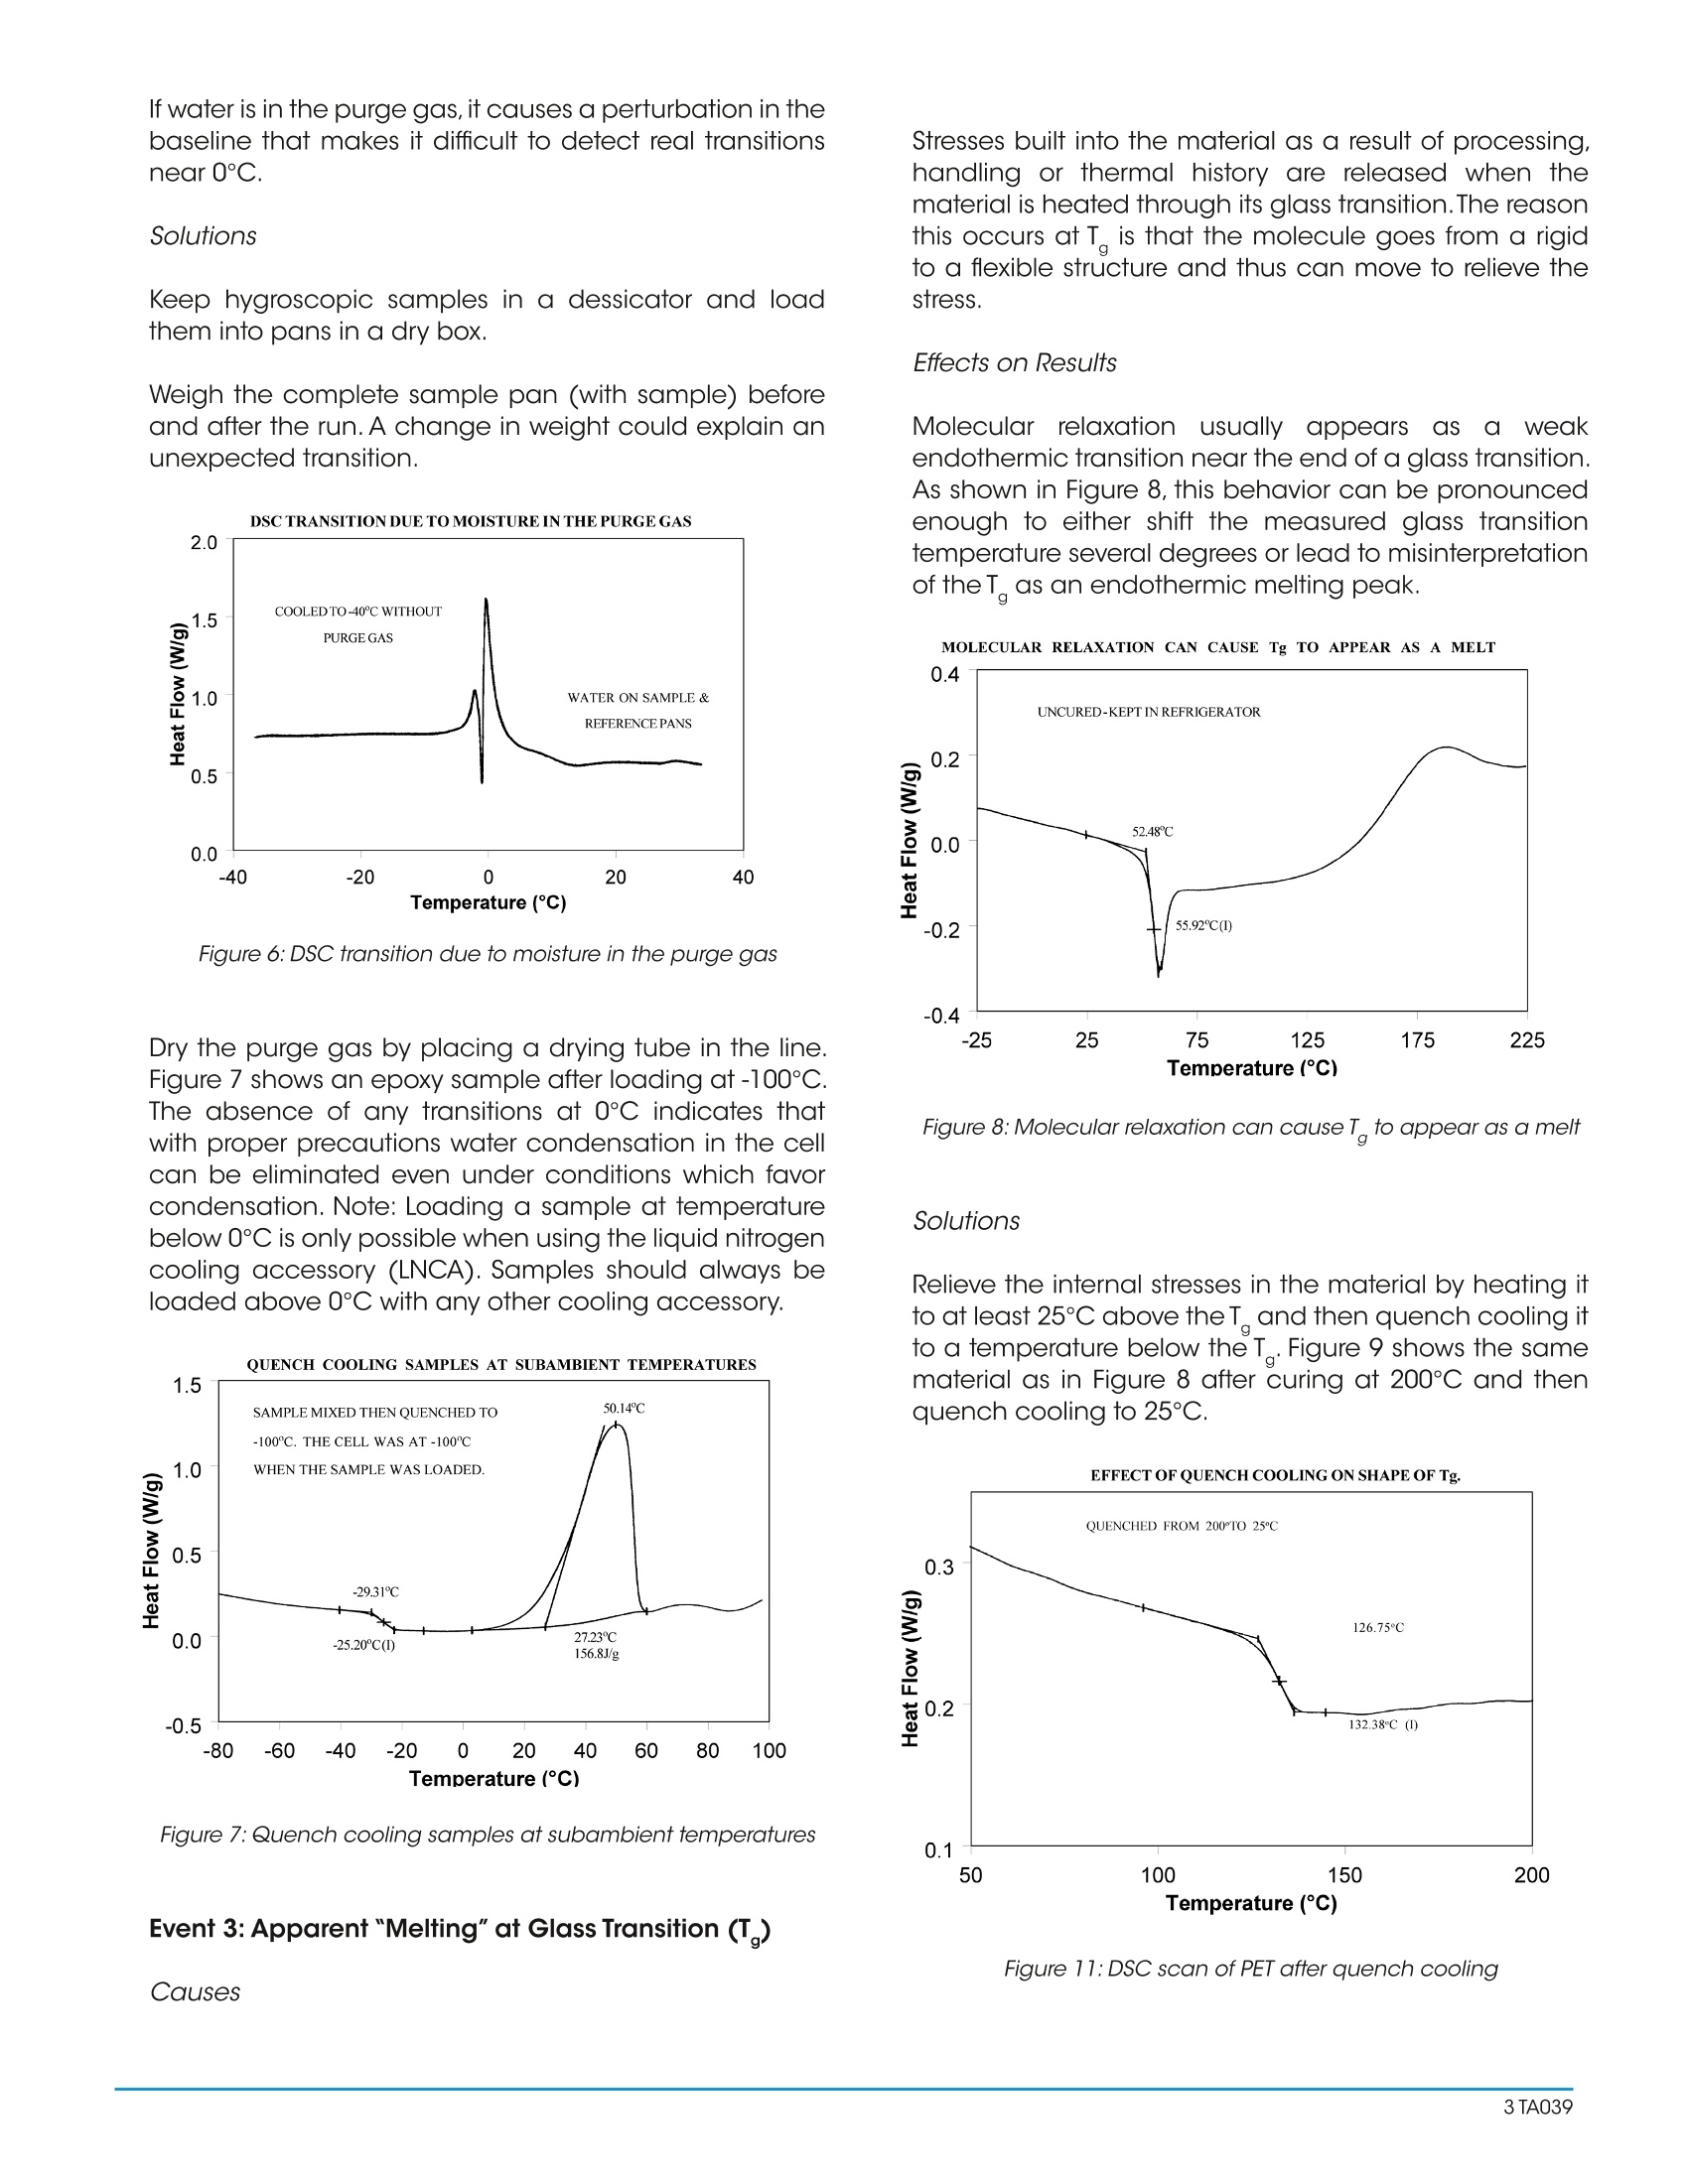
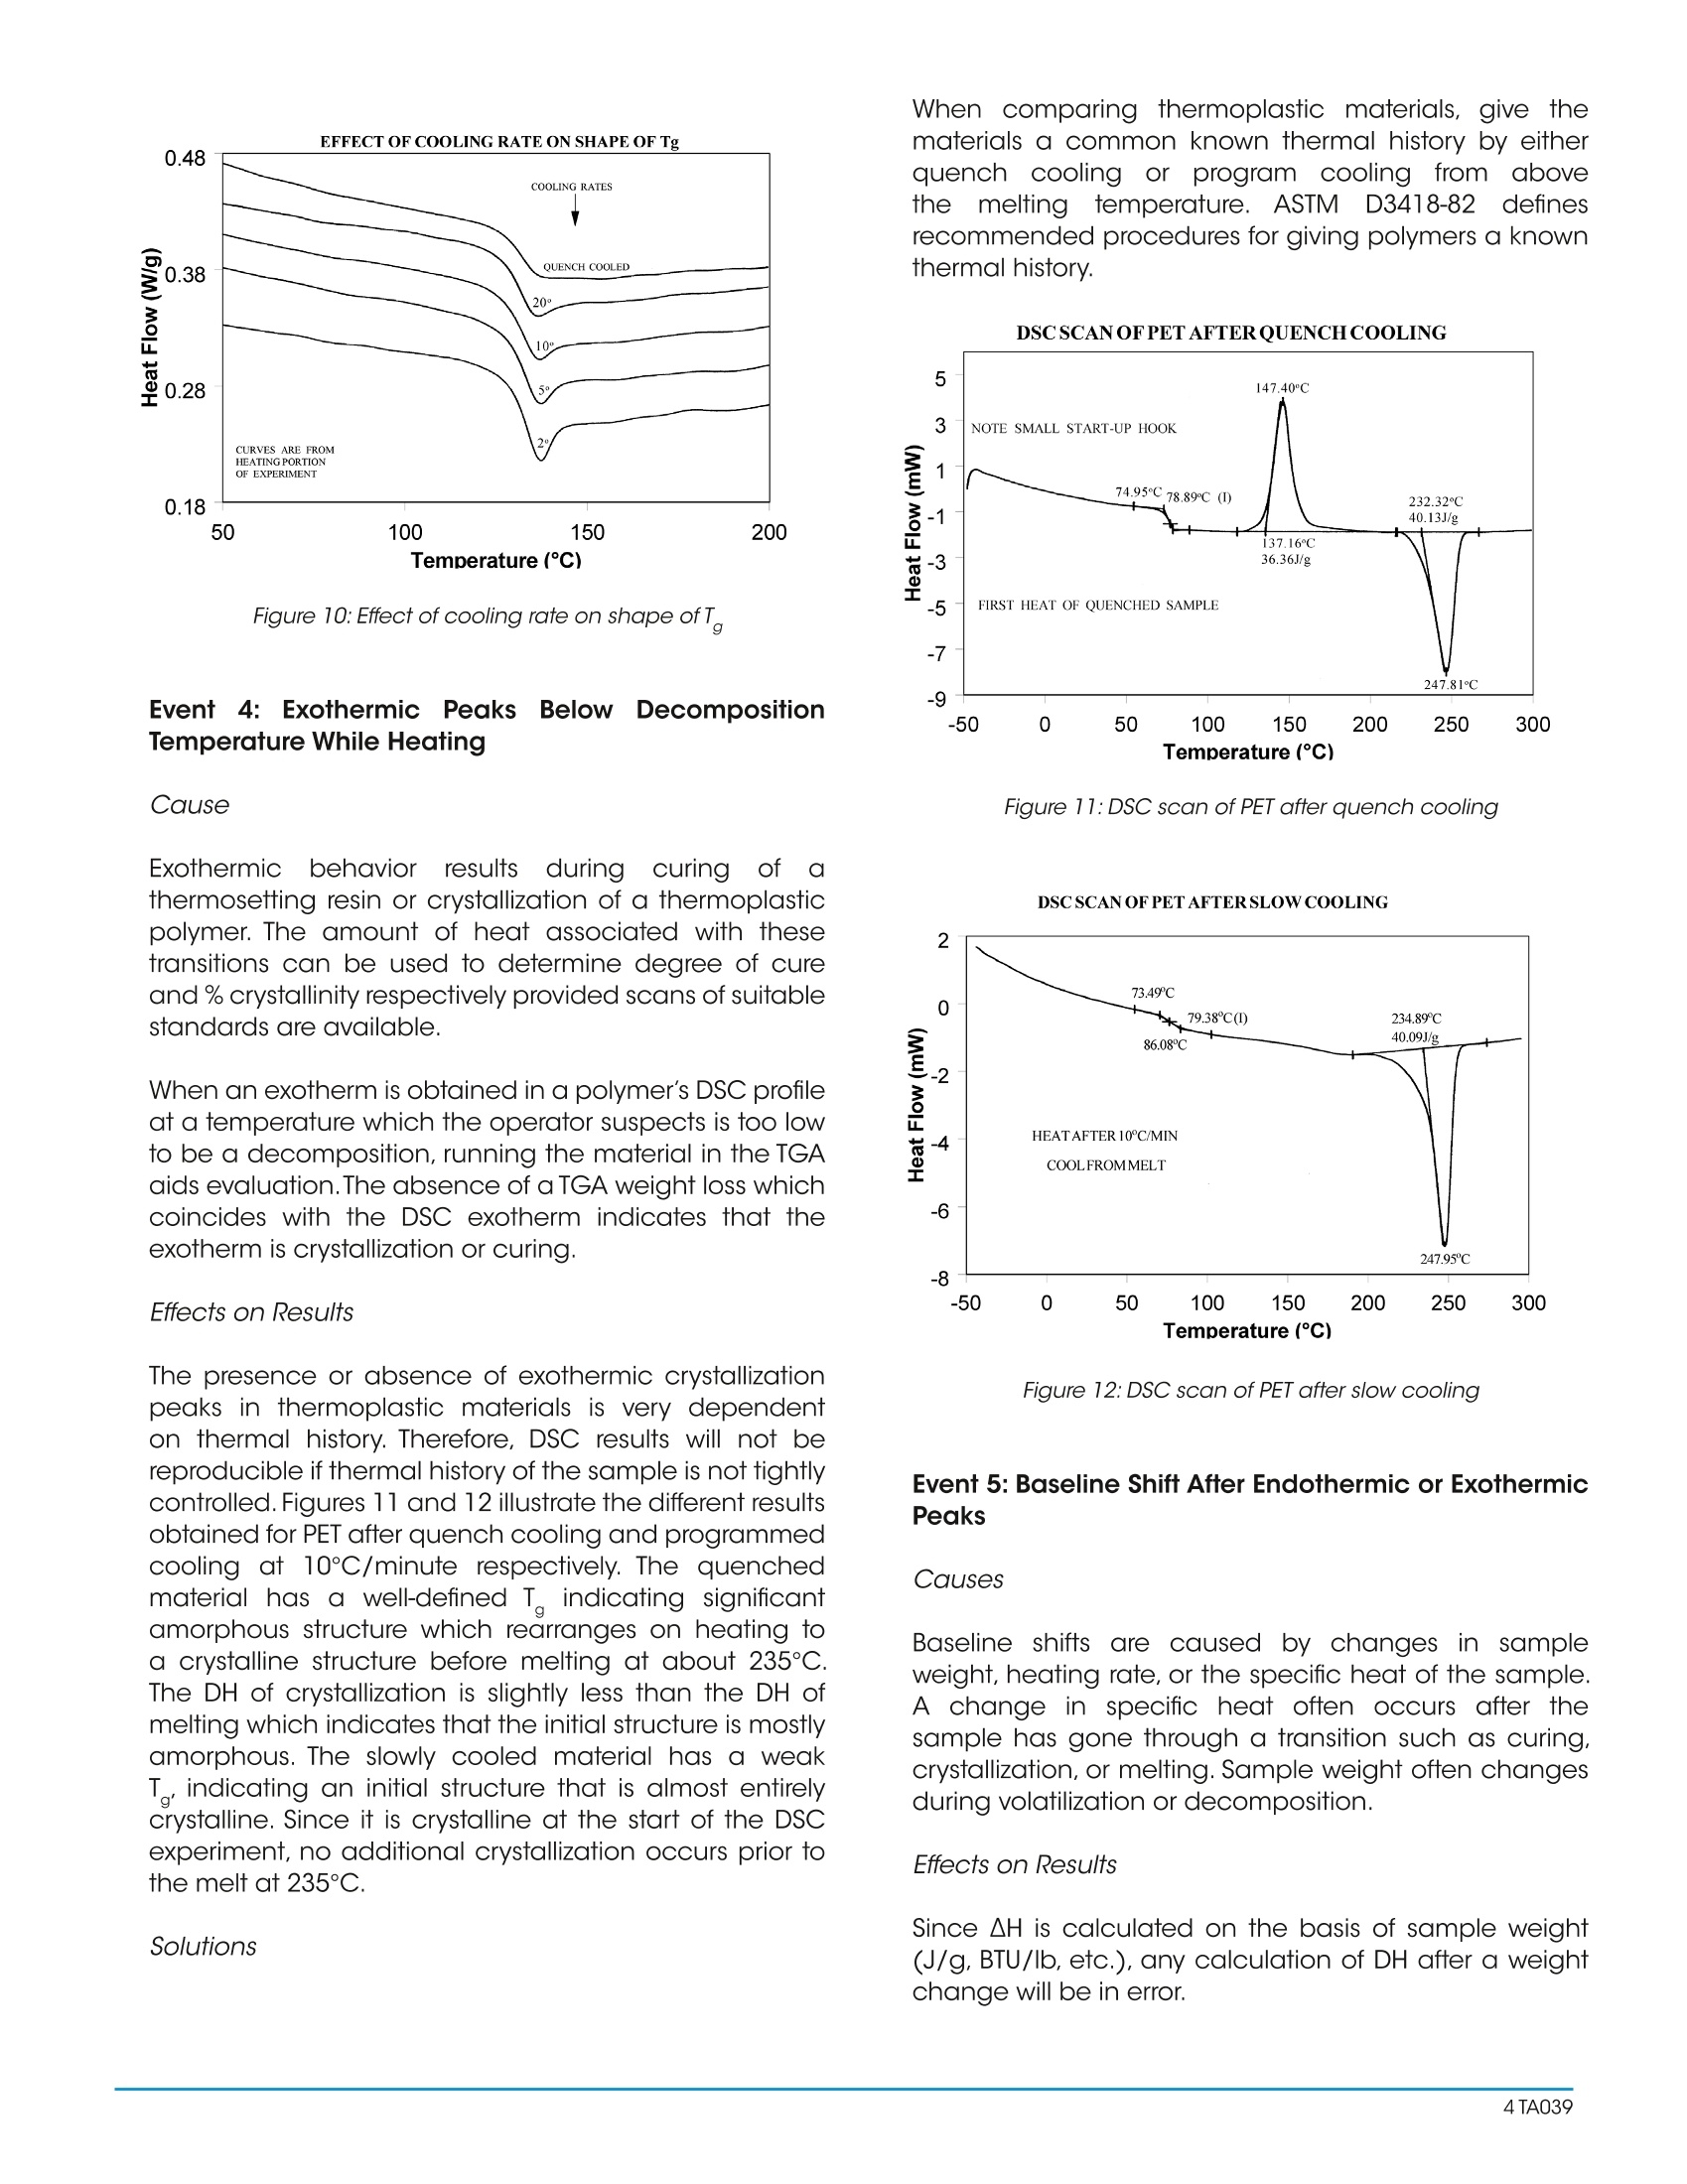
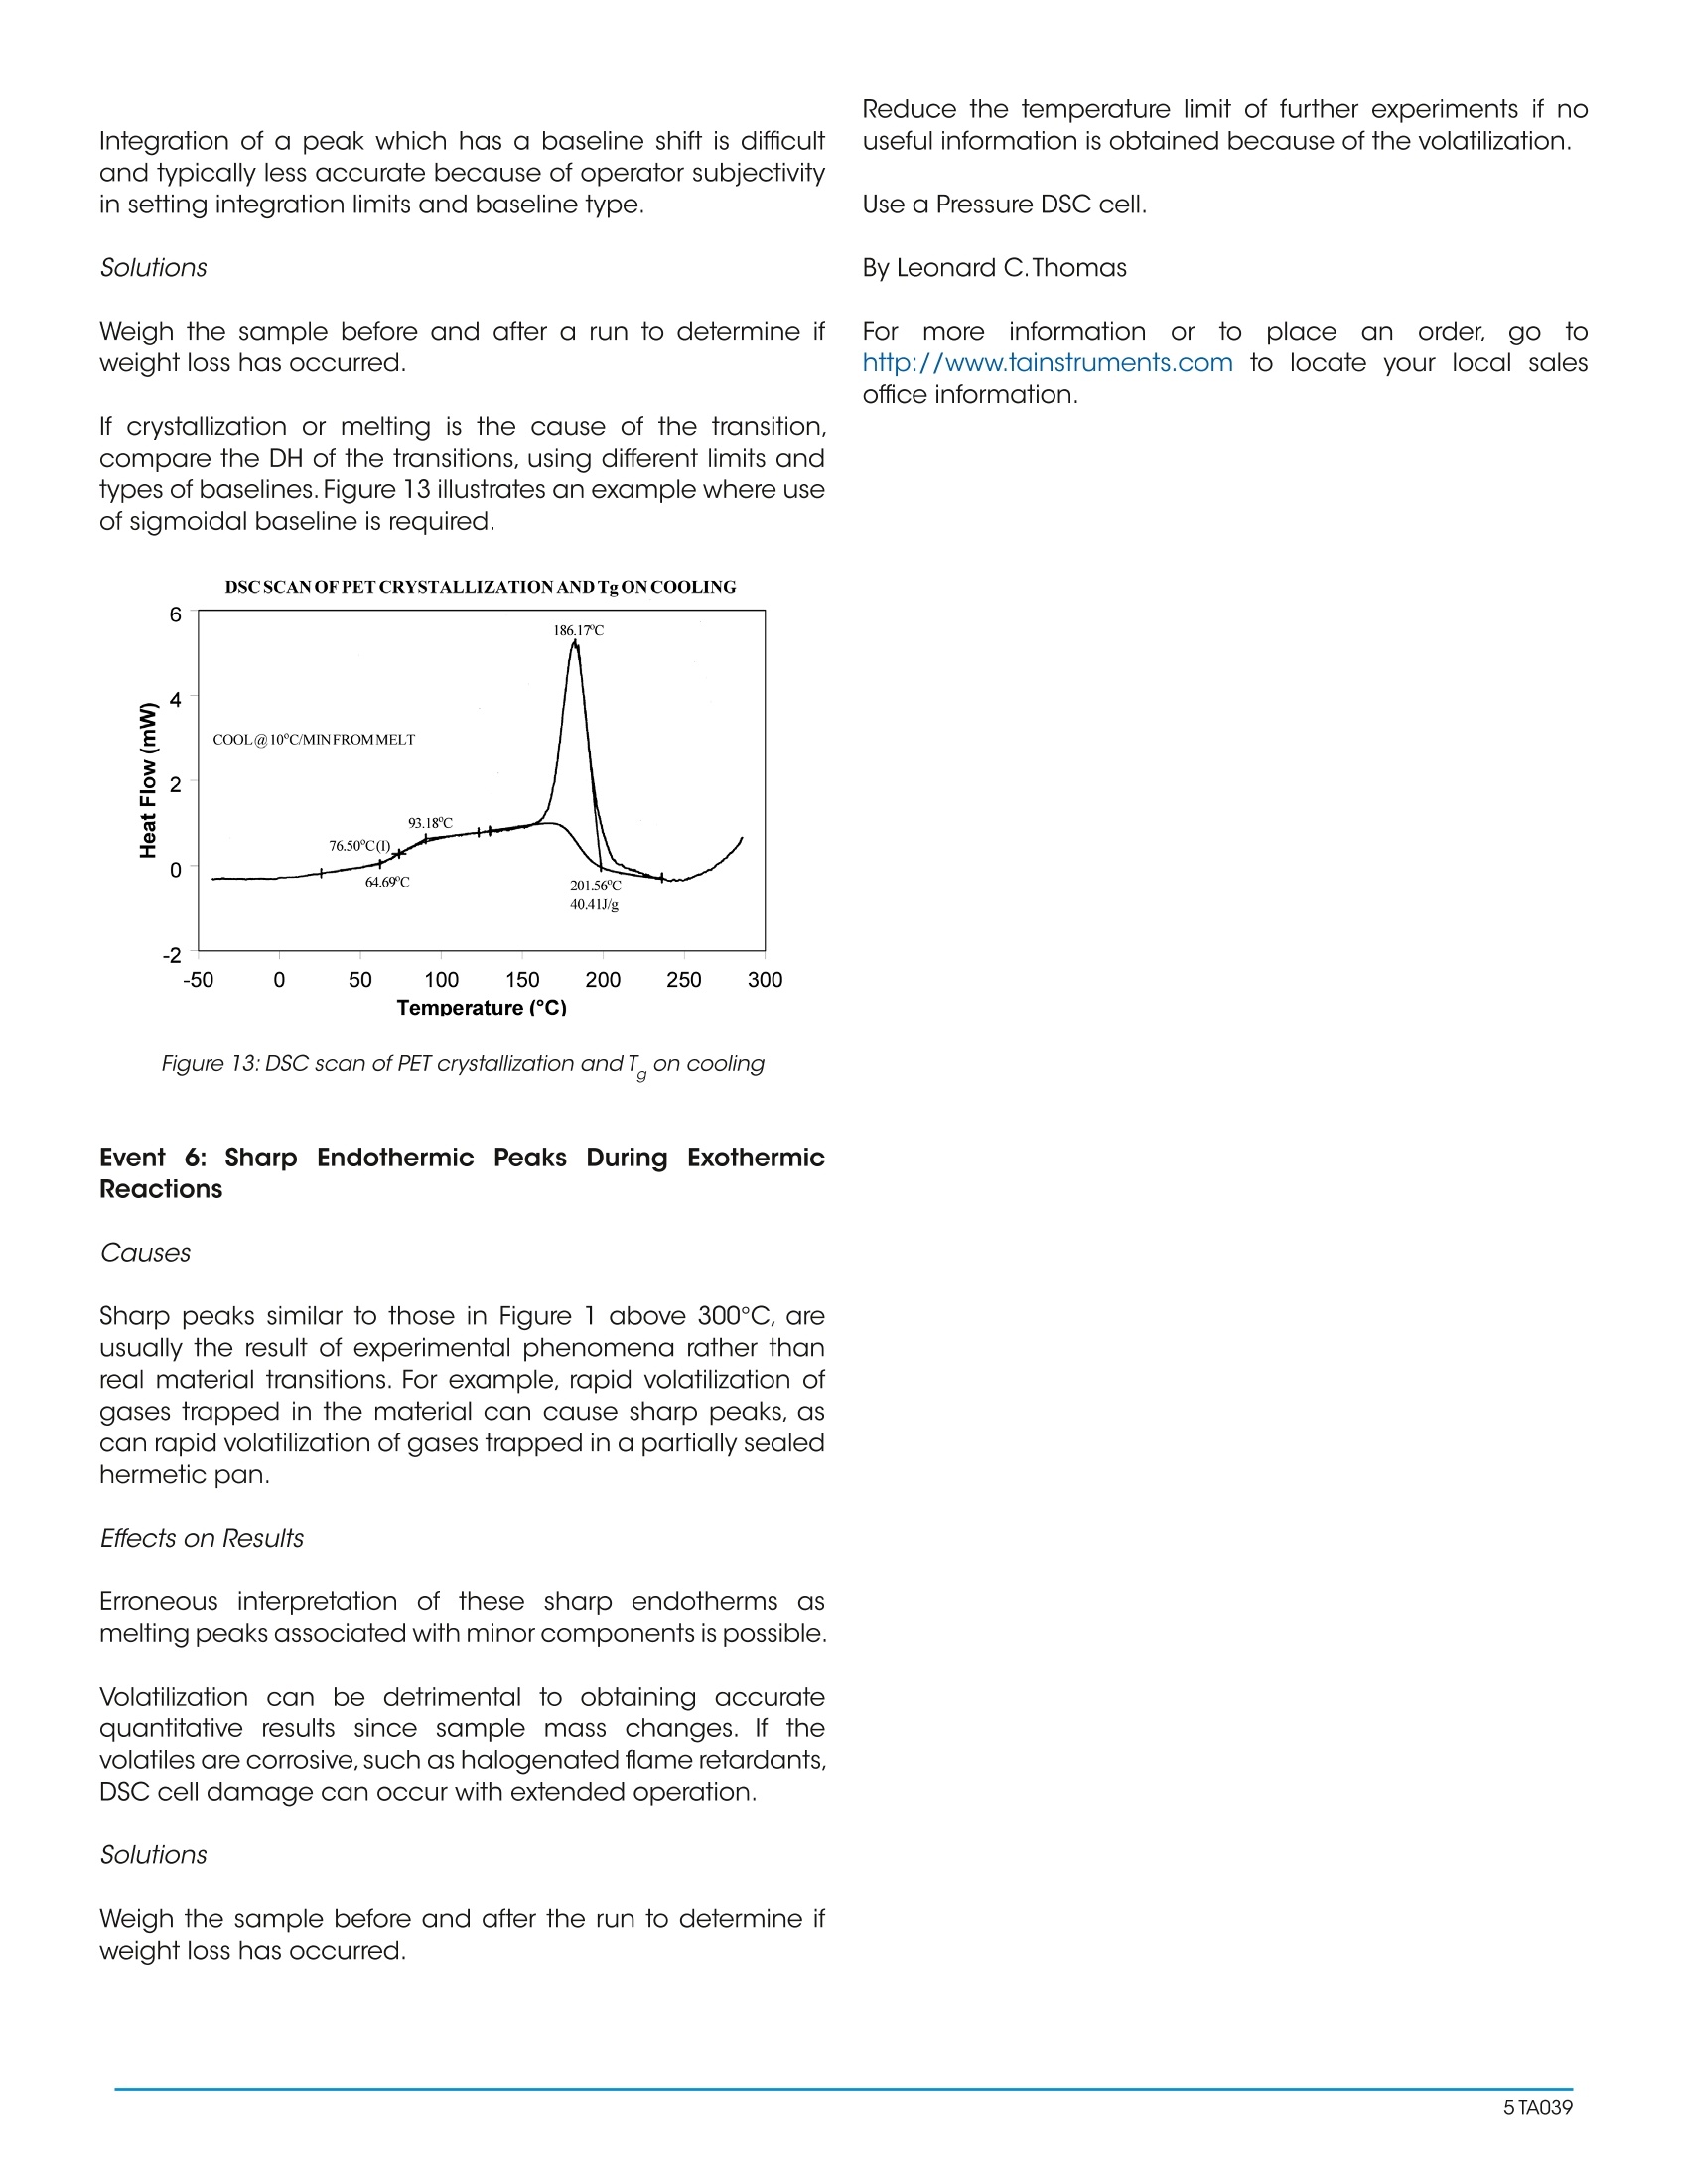
Interpreting Unexpected Eventsand Transitions in DSC Results INTRODUCTION The purpose of this paper is to assist DSC users withinterpretation of unusual or unexpected transitions in DSCresults. The transitions discussed in the paper are severalof the ones that most frequently create problems for thenew user, and which can also fool even an experiencedthermal analyst. By applying some of the recommended procedures andsolutions, most laboratories will be able to improve theoverall quality and interpretation of DSC results. BACKGROUND Differential scanning calorimetry (DSC) is a thermalanalysis technique which measures the temperatureand heat flow associated with transitions in materials asa function of temperature and time.Such measurementsprovide quantitative and qualitativeinformationabout physical and chemical changes that includeendothermic/exothermic processes or changes in heatcapacity. Specific information that can be obtainedinclude: Glass transition temperatures Melting points & boiling points Crystallization time & temperature Percent crystallinity Heats of fusion and reaction Specific heat Oxidative stability Rate of cure Degree of cure Reaction kinetics Purity Thermal stability Because of the wealth of information provided andbecause DSC is easy-to-use, DSC has become themost commonlyy used41thermal analysis technique.Ease-of-use in this case refers to sample preparationand experimental setup, as well as interpretation of theresults. There are, however, some common DSC events/transitions that can be the cause of less than optimumresults and/or misinterpretation. This paper describesseveral of these events with causes and solutions.Figure1 is an artificial DSC curve which was generated toillustrate these events/transitions.The curve is artificial inthe sense that all of these events would not occur in thesame real world DSC curve. Figure 1:Artificial DSC curve INTERPRETATION OF EVENTS AND TRANSITIONS Event 1: Large Endothermic Start-up Hook Causes At the beginning of a programmed heating experiment,there may be significant baseline change (usuallyendothermic))vwhichoccurs bprimarilyasedondifferences in the heat capacity of the sample andreference. Since heat capacity is directly related toweight,an endothermic shift indicates that the referencepan is too light to offset the sample weight. This effect isheightened by faster heating rates. Whenoperating ssubambient.tthe thermocouplejunctions in the DSC cell base may get cold as coldis transferred from the cell cooling head. This effectincreases as the temperature is lowered and/or the timeat lower temperatures is increased. Effects on Results A large "start-up hook" or a sloping baseline makedetection of weak transitions difficult. In addition,during the first 2-3 minutes of the experiment, transitiontemperatures and measured heat flow (DH) may not bereproducible. Solutions Using aluminum foil or additional pan lids, make up a series of reference pans of different weight (2 mg.increments).When running a sample use a reference panthat weighs 0-10% more than sample pan. Figure 2 showsresults with an epoxy prepreg sample.Best results areachieved with 1.5 lids. 2 lids results in overcompensationand an exothermic start-up hook. Figures 3 and 4 showhow the glass transition results are affected by correctcompensation. Note: these results are obtained heatingat 20℃/minute from a 100°℃ isothermal hold.The impactof the start-up hook can also be reduced by initiatingthe heating at a temperature that is at least 2-3 minutesbelow the range of interest at the heating rate chosen(ie. at 20°C/minute, start experiment at least 50C belowthe first thermal event of interest.) EFFECTOFREFERENCEPANWEIGHT Figure 2:Effect of reference pan weight Figure 3: Start-up hook and Twith no reference pan Figure 4: Start-up hook and T with correct reference pan If operating below 0℃, use 50cc/minute dry nitrogenpurge gas through the cell base VACUUM PORT plusthe normal purge gas. Figure 5 illustrates the typicalimprovement obtainable. Figure 5: Proper gas purging improves subambient baselineperformance Event 2: Transition(s) at0℃ Causes Weak transitions around 0℃ indicate the presence ofwater in the sample or the purge gas. These transitionsare usually endotherms, but may appear different thana melting peak. Since water can condense on both thesample and reference pans, the transition often appearsas shown in Figure 6. Furthermore, the peaks may appearslightly lower than 0℃ due to impurities dissolved by themoisture from the cell and pans. Effects on Results If water is in the sample, results may not be reproduciblebecause it can act as a plasticizer and reduce transitiontemperatures.The water will also volatilize during the run,causing an endothermic peak and a shift in the baseline. If water is in the purge gas, it causes a perturbation in thebaseline that makes it difficult to detect real transitionsnear 0°C. Solutions keep hygroscopic samples in a dessicator and loadthem into pans in a dry box. Weigh the complete sample pan (with sample) beforeand after the run. A change in weight could explain anunexpected transition. Figure 6:DSC transition due to moisture in the purge gas Dry the purge gas by placing a drying tube in the line.Figure 7 shows an epoxy sample after loading at -100℃.The absence of any transitions at 0℃ indicates thatwith proper precautions water condensation in the cellcan be eliminated even under conditions which favorcondensation. Note: Loading a sample at temperaturebelow 0℃ is only possible when using the liquid nitrogencooling accessory (LNCA). Samples should always beloaded above 0℃ with any other cooling accessory. QUENCH COOLING SAMPLES AT SUBAMBIENT TEMPERATURES Figure 7:Quench cooling samples at subambient temperatures Event 3: Apparent "Melting" at Glass Transition (T) Causes Stresses built into the material as a result of processing,handling or thermal history are released when thematerial is heated through its glass transition.The reasonthis occurs at T is that the molecule goes from a rigidto a flexible structure and thus can move to relieve thestress. Effects on Results Molecular relaxation usually appears caS a weakendothermic transition near the end of a glass transition.As shown in Figure 8, this behavior can be pronouncedenough to either shift the measured glass transitiontemperature several degrees or lead to misinterpretationof theT, as an endothermic melting peak. Figure 8:Molecular relaxation can cause T to appear as a melt Solutions Relieve the internal stresses in the material by heating itto at least 25℃ above the T and then quench cooling itto a temperature below the T. Figure 9 shows the samematerial as in Figure 8 after curing at 200°℃ and thenquench cooling to 25C. Figure 11:DSC scan of PET after quench cooling Figure 10:Effect of cooling rate on shape ofT Event4::Exothermic PeaksBelowDecompositionTemperature While Heating Cause Exothermic behavior results during curing ofathermosetting resin or crystallization of a thermoplasticpolymer. The amount of heat associated with thesetransitions can be used to determine degree of cureand % crystallinity respectively provided scans of suitablestandards are available. When an exotherm is obtained in a polymer's DSC profileat a temperature which the operator suspects is too lowto be a decomposition, running the material in the TGAaids evaluation.The absence of a TGA weight loss whichcoincides with the DSC exotherm indicates that theexotherm is crystallization or curing. Effects on Results The presence or absence of exothermic crystallizationpeaks in thermoplastic materials is very dependenton thermal history. Therefore, DSC results will not bereproducible if thermal history of the sample is not tightlycontrolled.Figures 11 and 12 illustrate the different resultsobtained for PET after quench cooling and programmedcooling at 10℃/minute respectively. The quenchedmaterial has a well-defined T indicating significantamorphous structure which rearranges on heating toa crystalline structure before melting at about 235℃.The DH of crystallization is slightly less than the DH ofmelting which indicates that the initial structure is mostlyamorphous. The slowly cooled material has a weakT, indicating an initial structure that is almost entirelycrystalline. Since it is crystalline at the start of the DSCexperiment, no additional crystallization occurs prior tothe melt at 235°C. Solutions When comparing thermoplastic materials, give thematerials a common known thermal history by eitherquench cooling or program cooling from abovethe melting temperature. ASTM [D3418-82 definesrecommended procedures for giving polymers a knownthermal history. DSCSCANOFPETAFTERQUENCHCOOLING Figure 11: DSC scan of PET after quench cooling DSCSCANOFPETAFTER SLOW COOLING Figure 12: DSC scan of PET after slow cooling Event 5: Baseline Shift After Endothermic or ExothermicPeaks Causes Baseline shifts are caused by changes in sampleweight, heating rate, or the specific heat of the sample.A change in specific heat often occurs after thesample has gone through a transition such as curing,crystallization, or melting. Sample weight often changesduring volatilization or decomposition. Effects on Results Since AH is calculated on the basis of sample weight(J/g, BTU/lb, etc.), any calculation of DH after a weightchange will be in error. Integration of a peak which has a baseline shift is difficultand typically less accurate because of operator subjectivityin setting integration limits and baseline type. Solutions Weigh the sample before and after a run to determine ifweight loss has occurred. If crystallization or melting is the cause of the transition,compare the DH of the transitions, using different limits andtypes of baselines. Figure 13 illustrates an example where useof sigmoidal baseline is required. DSCSCAN OFPET CRYSTALLIZATION AND Tg ONCOOLING Figure 13: DSC scan of PET crystallization and T on cooling Event 6: Sharp Endothermic Peaks During ExothermicReactions Causes Sharp peaks similar to those in Figure 1 above 300℃, areusually the result of experimental phenomena rather thanreal material transitions. For example, rapid volatilization ofgases trapped in the material can cause sharp peaks, ascan rapid volatilization of gases trapped in a partially sealedhermetic pan. Effects on Results Erroneous interpretation of these sharp endotherms asmelting peaks associated with minor components is possible. Volatilization can be detrimental to obtaining accuratequantitative results since sample mass changes. If thevolatiles are corrosive, such as halogenated flame retardants,DSC cell damage can occur with extended operation. Solutions Weigh the sample before and after the run to determine ifweight loss has occurred. Reduce the temperature limit of further experiments if nouseful information is obtained because of the volatilization. Use a Pressure DSC cell. By Leonard C.Thomas For moreinformation or to place an order, go tohttp://www.tainstruments.com to locate your local salesoffice information. TA A The purpose of this paper is to assist DSC users with interpretation of unusual or unexpected transitions in DSC results. The transitions discussed in the paper are several of the ones that most frequently create problems for the new user, and which can also fool even an experienced thermal analyst.By applying some of the recommended procedures and solutions, most laboratories will be able to improve the overall quality and interpretation of DSC results.
确定
还剩3页未读,是否继续阅读?

TA仪器为您提供《材料中玻璃化转变检测方案(差示扫描量热)》,该方案主要用于其他中玻璃化转变检测,参考标准--,《材料中玻璃化转变检测方案(差示扫描量热)》用到的仪器有
相关方案
更多
该厂商其他方案
更多