


1. 能够准确测量含量高达9000ppm的高富集HDO的水样品(delta_2H ~ +57,000‰), 其精度和准确度是目前测量天然水样所能达到的最高水平;
2. 在测量高富集样品后的1个小时之内,用户即可应用同样的设置测量普通的自然水样,快速的消除记忆效应,没有同位素质谱仪可以做到这一点;
3. 文章中报道LGR水同位素分析仪可每天测量60个高富集水样品;
4. 文章所述LGR水同位素分析仪的高性能在所有EP型号的水同位素分析仪上均可实现,无需特殊设置。
方案详情

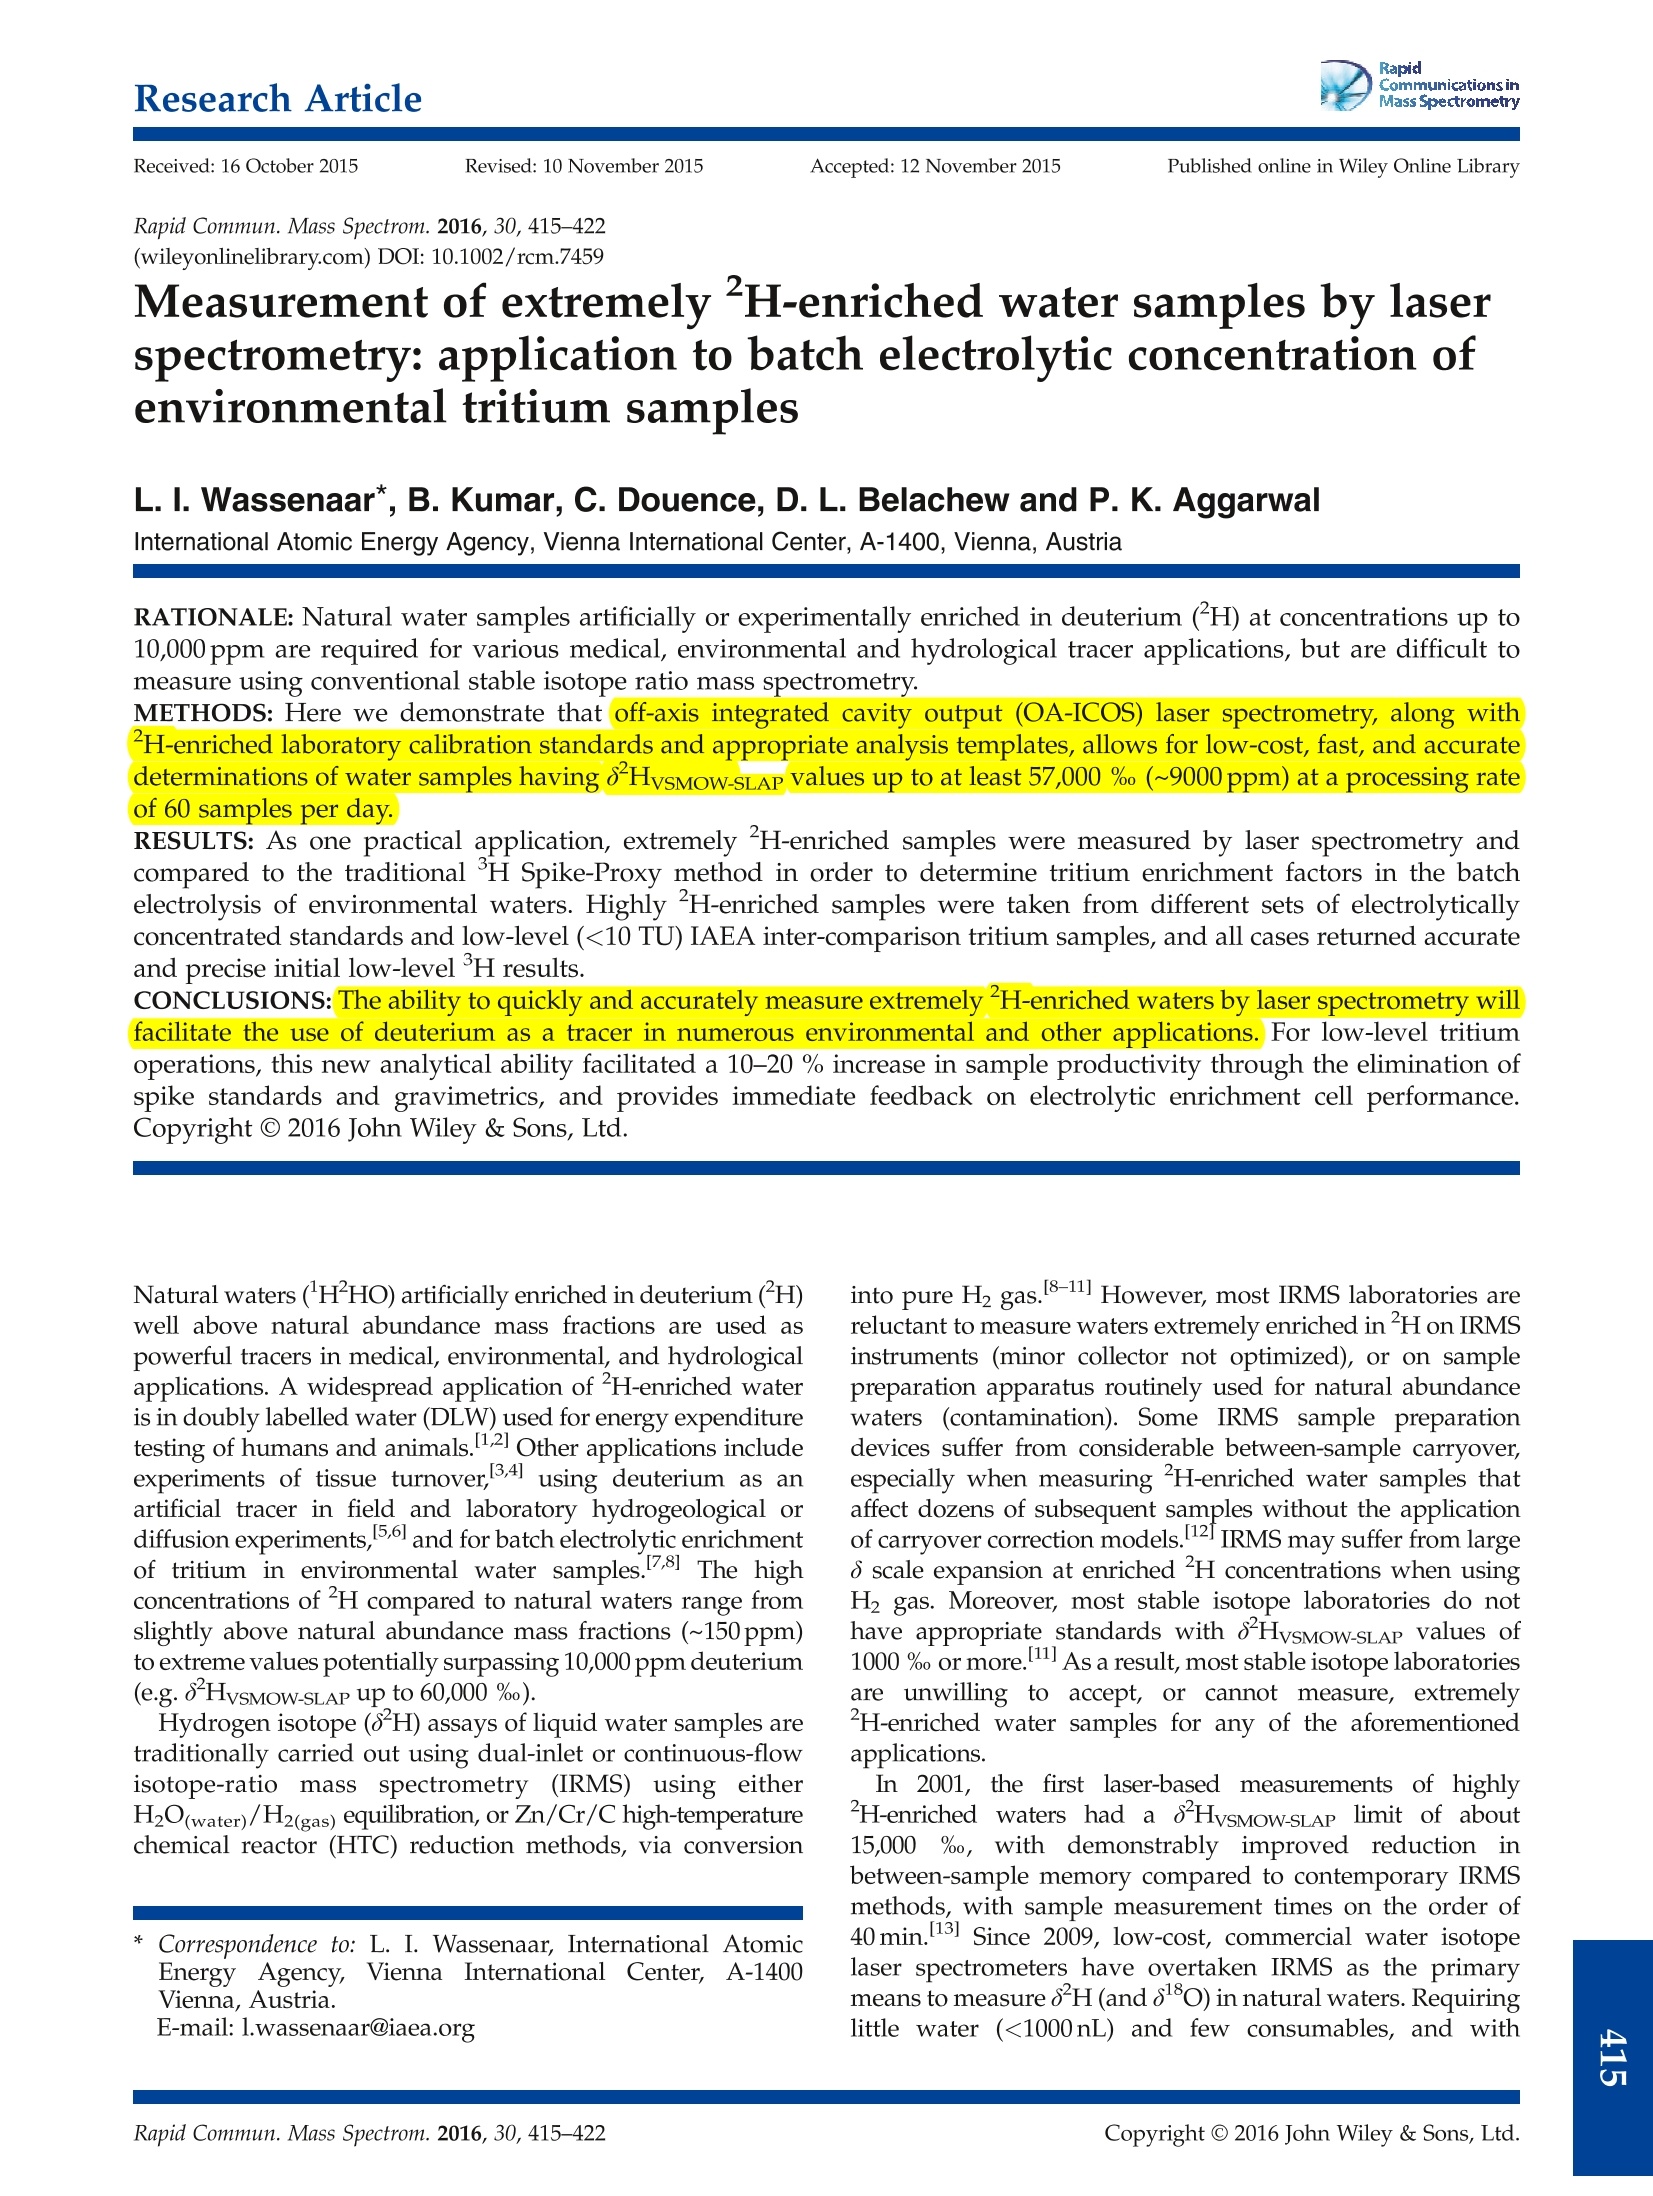
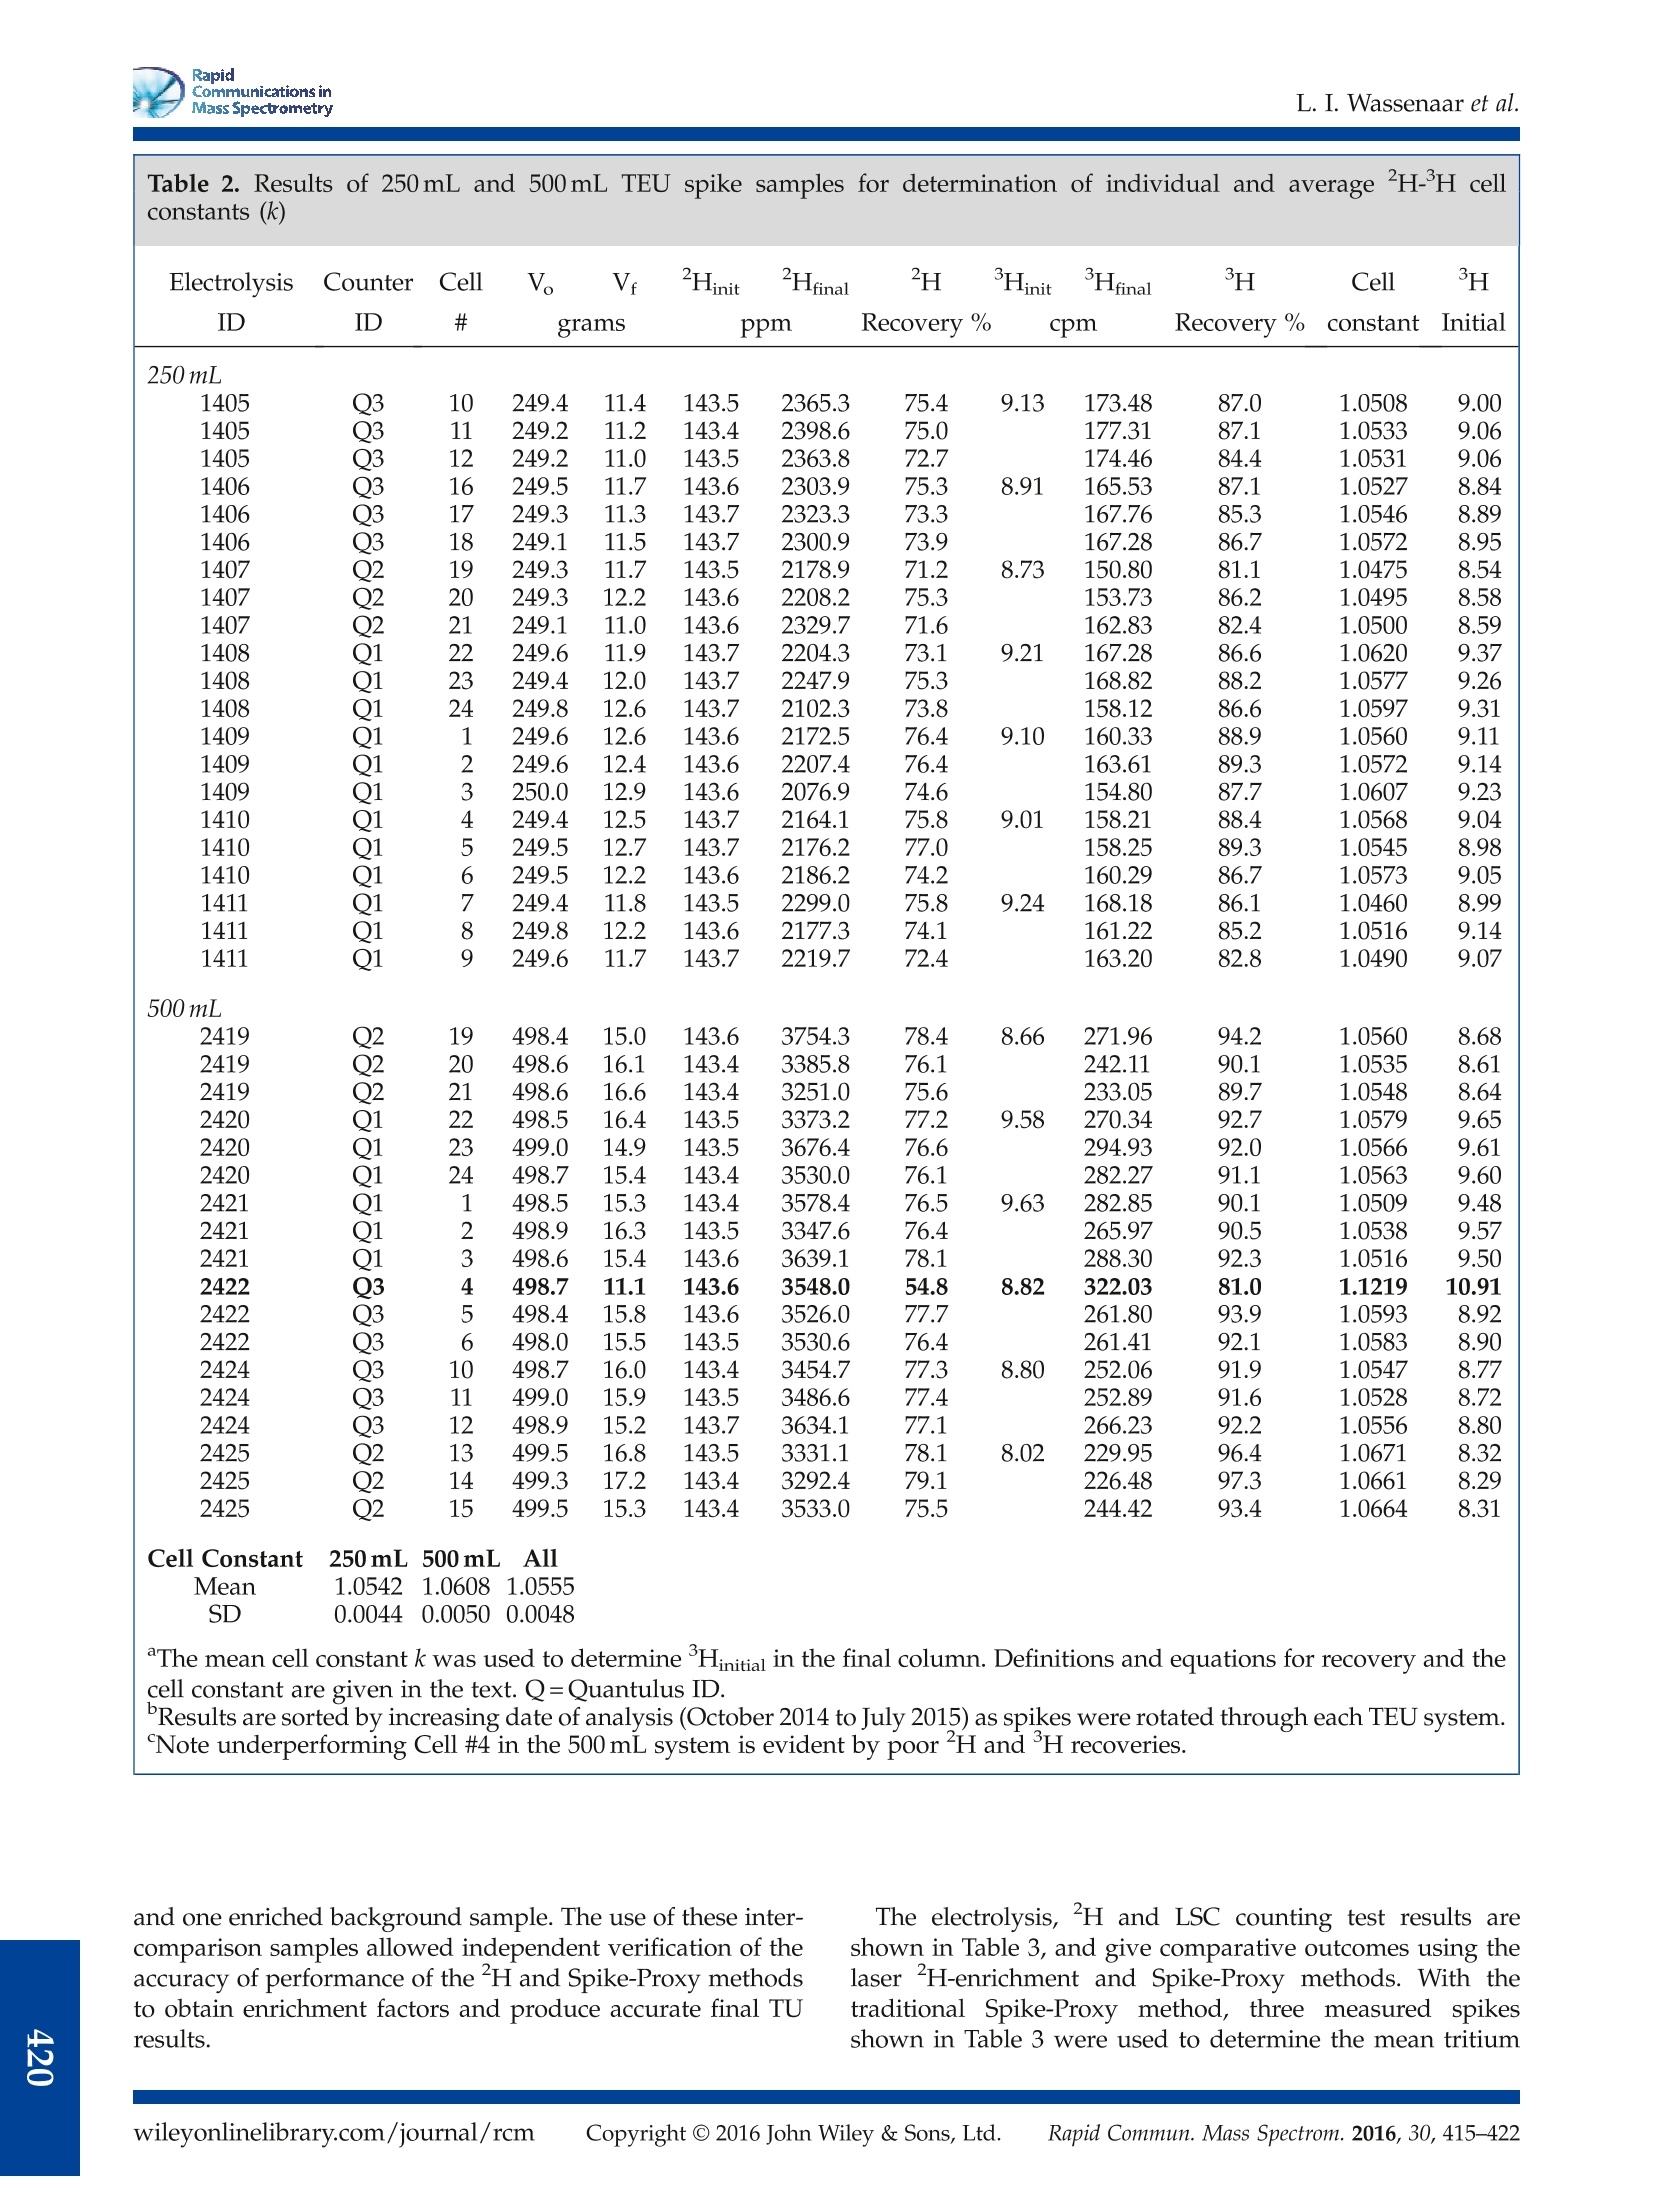
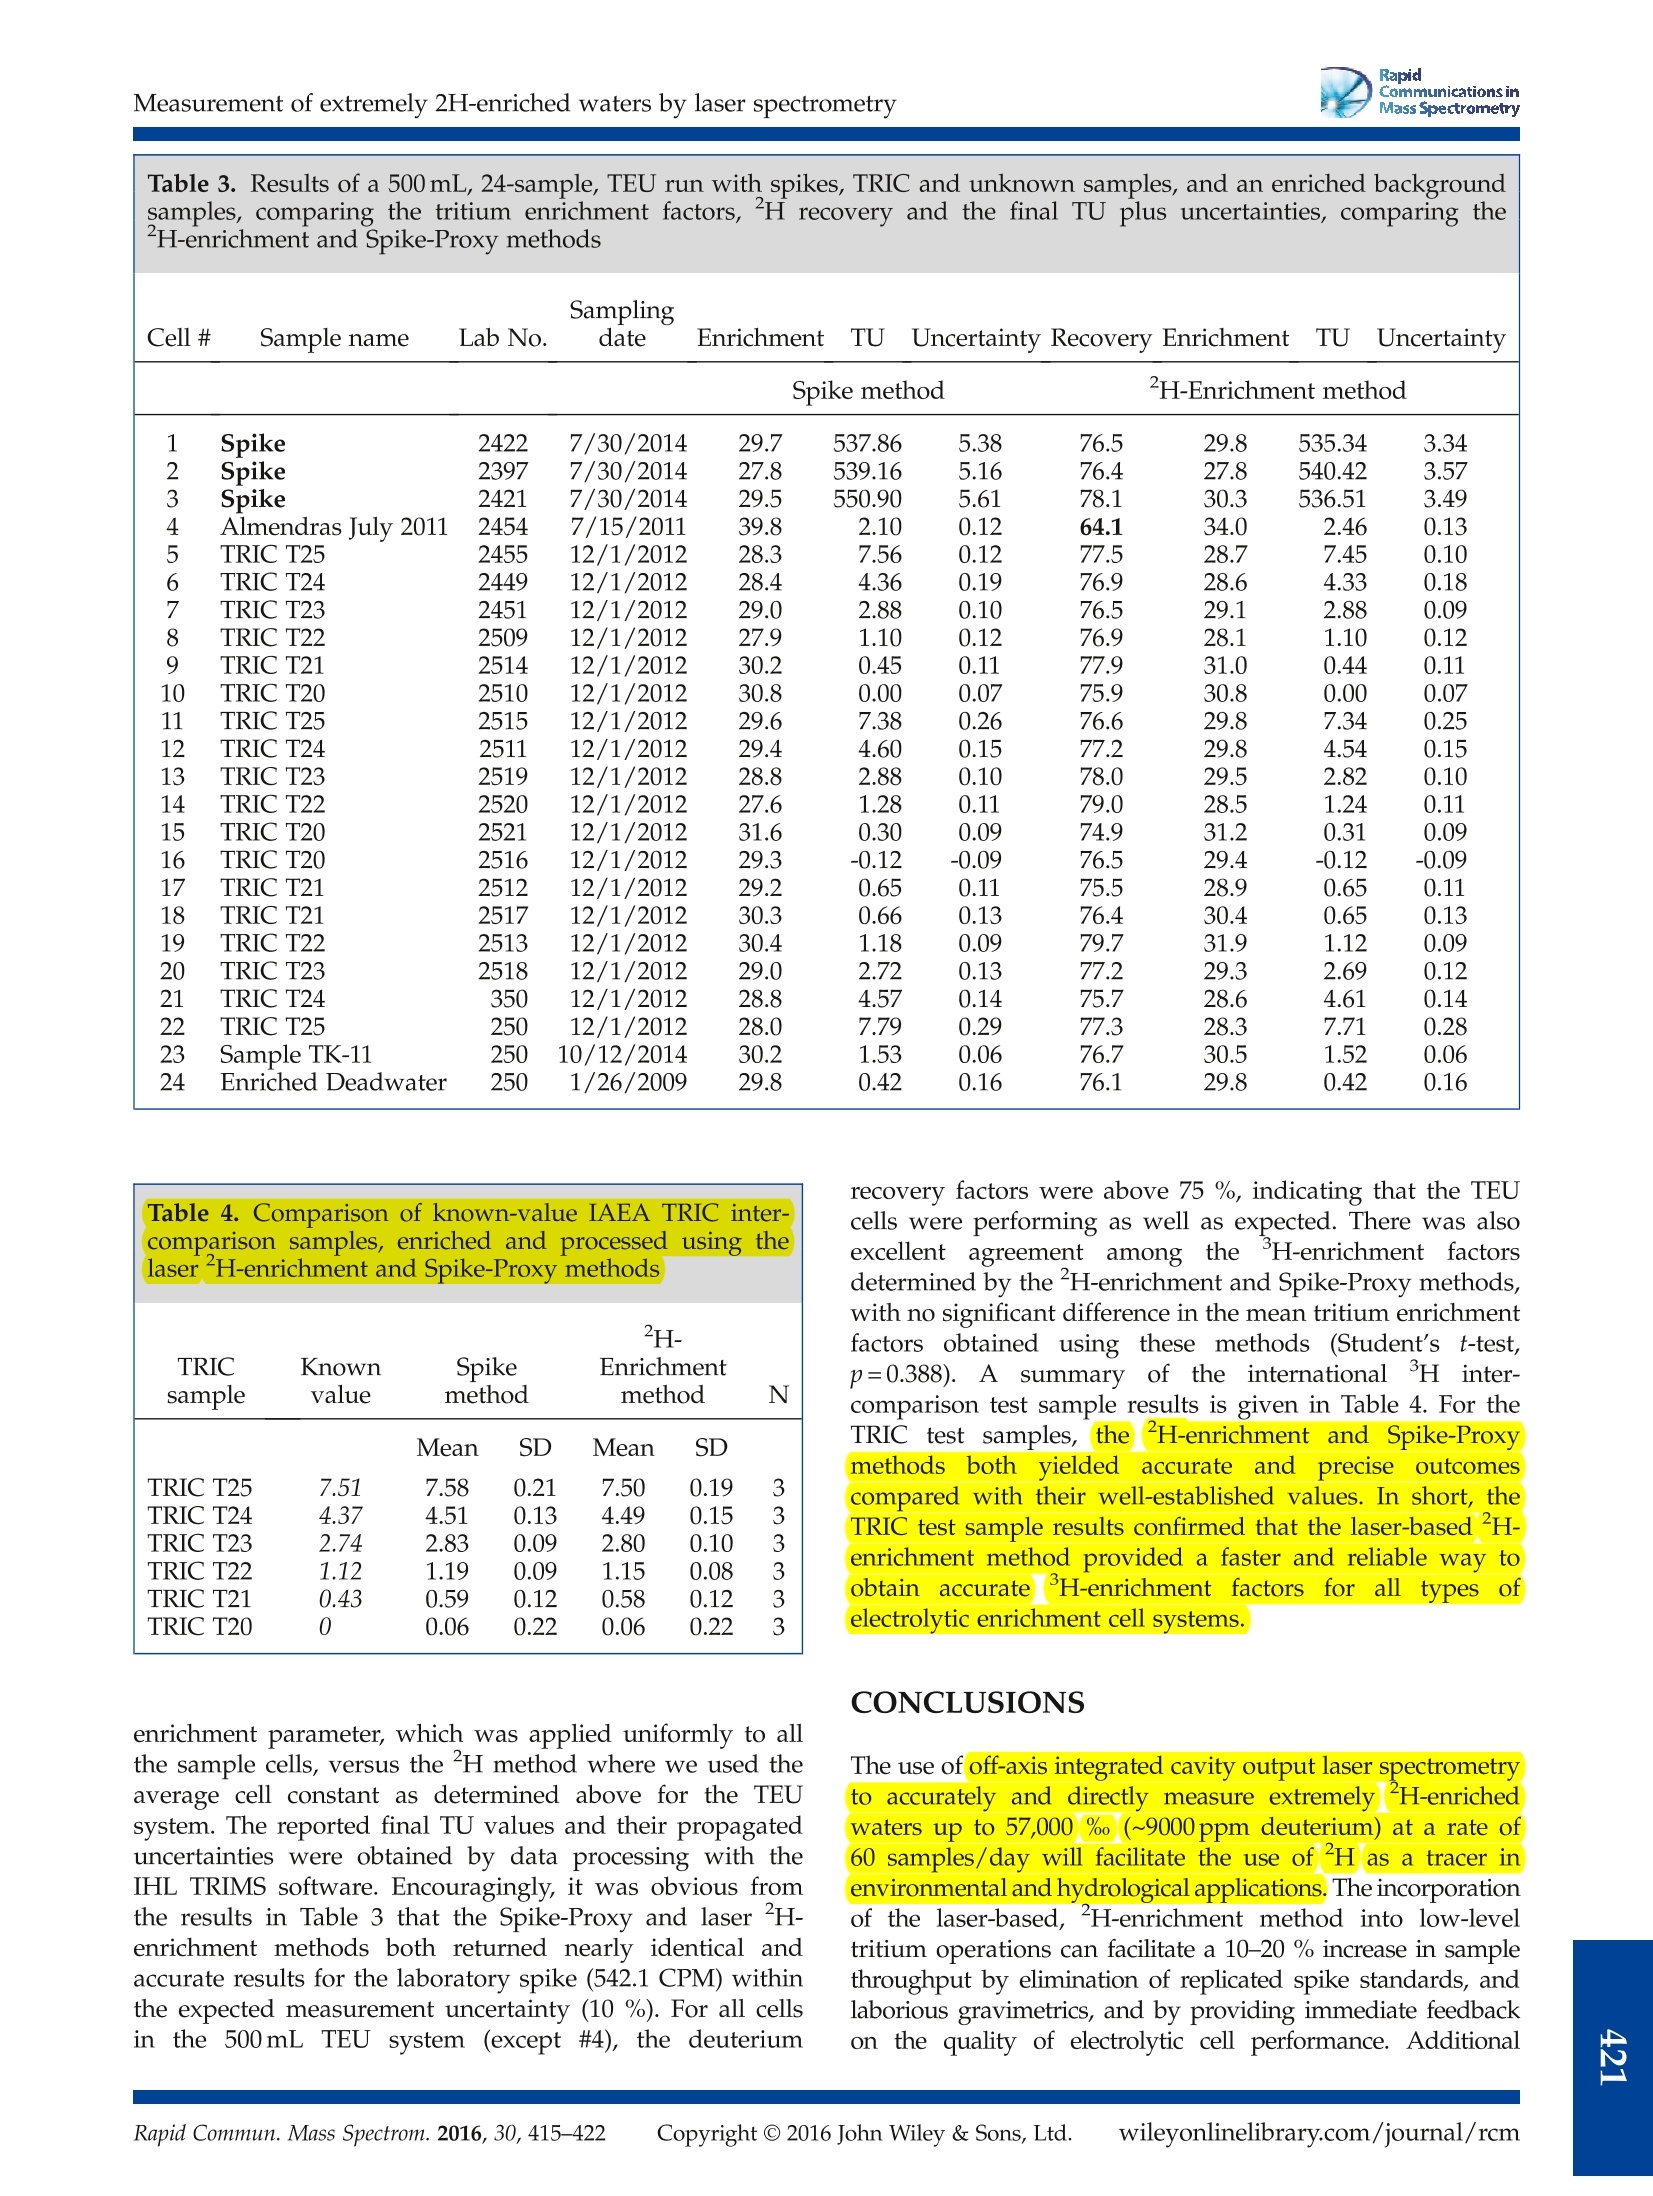
RapidCommunications inMass SpectrometryResearch ArticleRevised: 10 November 2015 Accepted: 12 November 2015Published online in Wiley Online Library RapidCommunications inMass SpectrometryL. I. Wassenaar et al. Received: 16 October 2015 Rapid Commun. Mass Spectrom. 2016, 30, 415-422 (wileyonlinelibrary.com) DOI: 10.1002/rcm.7459 Measurement of extremely "H-enriched water samples by laserspectrometry: application to batch electrolytic concentration ofenvironmental tritium samples L. I. Wassenaar*, B. Kumar, C. Douence, D. L. Belachew and P. K. Aggarwal International Atomic Energy Agency, Vienna International Center, A-1400, Vienna, Austria RATIONALE: Natural water samples artificially or experimentally enriched in deuterium (H) at concentrations up to10,000ppm are required for various medical, environmental and hydrological tracer applications, but are difficult tomeasure using conventional stable isotope ratio mass spectrometry. METHODS: Here we demonstrate that off-axis integrated cavity output (OA-ICOS) laser spectrometry, along withH-enriched laboratory calibration standards and appropriate analysis templates, allows for low-cost, fast, and accuratedeterminations of water samples having 8 HvsMOW-SLAP values up to at least 57,000 %o (~9000 ppm) at a processing rateof 60 samples per day. RESULTS: As one practical application, extremely H-enriched samples were measured by laser spectrometry andcompared to the traditional H Spike-Proxy method in order to determine tritium enrichment factors in the batchelectrolysis of environmental waters. Highly H-enriched samples were taken from different sets of electrolyticallyconcentrated standards and low-level (<10 TU) IAEA inter-comparison tritium samples, and all cases returned accurateand precise initial low-level H results. CONCLUSIONS: The ability to quickly and accurately measure extremely H-enriched waters by laser spectrometry willfacilitate the use of deuterium as a tracer in numerous environmentaland other applications.For low-level tritiumoperations, this new analytical ability facilitated a 10-20 % increase in sample productivity through the elimination ofspike standards and gravimetrics, and provides immediate feedback on electrolytic enrichment cell performance.Copyright ◎ 2016 John Wiley & Sons, Ltd. Natural waters(HHO) artificially enriched in deuterium (’H)well above natural abundance mass fractions are used aspowerful tracers in medical, environmental, and hydrologicalapplications. A widespread application of H-enriched wateris in doubly labelled water (DLW) used for energy expendituretesting of humans and animals. 1.2] Other applications includeexperiments of tissue turnover 34 using deuterium as anartificial tracer in field and laboratory hydrogeological ordiffusion experiments, 5,.6 and for batch electrolytic enrichmentof tritium in environmental water samples.8 The highconcentrations of H compared to natural waters range fromslightly above natural abundance mass fractions (~150ppm)to extreme values potentially surpassing 10,000 ppm deuterium(e.g.8HvsMOW-SLAP up to 60,000%). Hydrogen isotope (8H) assays of liquid water samples aretraditionally carried out using dual-inlet or continuous-flowisotope-ratio mass spectrometry (IRMS) using eitherH2O(water)/H2(gas) equilibration, or Zn/Cr/C high-temperaturechemical reactor (HTC) reduction methods, via conversion ( *( Correspondence to: L. I . Wassenaar, Internationa l Atomic Energy A gency, ViennaInternational Center, A-1400 Vienna, Austria. E-mail: 1.wassenaar@iaea.org ) into pure H2 gas.[8-11] However, most IRMS laboratories arereluctant to measure waters extremely enriched in²H on IRMSinstruments (minor collector not optimized), or on samplepreparation apparatus routinely used for natural abundancewaters (contamination). Some IRMS samplee preparationdevices suffer from considerable between-sample carryover,especially when measuring H-enriched water samples thataffect dozens of subsequent samples without the applicationof carryover correction models. 12 IRMS may suffer from largeo scale expansion at enriched H concentrations when usingH2 gas. Moreover, most stable isotope la) n01boratories do nothave appropriate standards with 8HysMOW-SLAP values of1000 %o or more. As a result, most stable isotope laboratoriesare unwilling to accept, or cannot measure, extremelyH-enriched water samples for any of the aforementionedapplications. In 2001, the first laser-basedi measurements of highlyH-enriched waters had a HvsMoW-SLAp limit of about15,000 Vwithdemonstrablyimproved reductioninbetween-sample memory compared to contemporary IRMSmethods, with sample measurement times on the order of40 min. 13] Since 2009, low-cost, commercial water isotopelaser spectrometers have overtaken IRMS as the primarymeans to measure 8H(and8o) in natural waters. Requiringlittle water (<1000nL) and few consumables, and with minimal training, laser-based water isotope measurements areat a stage of widespread adoption and affordability.l14,15l(Thefirst tests ofH-enriched DLW water by commercial cavity ringdown (CRDS) laser spectrometry showed success with sampleshaving 8HvsMow-SLAp values up to ~750 %, but required morethan 20 sample injections to overcome significant between-sample memory; hence, only 15 samples per day could bemeasured.116]However, with recent developments in laserspectrometry, the potential for modern liquid water isotopelaser instrumentation has not been adequately explored forextremely 2H-enriched water samples, which may be usefulfortthe aforementioned applications,or intracer orexperimental studies. The objective of this paper is twofold: (i) to demonstratethatcommercial off-axisintegrateddcavity outputllaaserspectrometry (OA-ICOS)) can be used to rapidly obtainaccurate and precise 8 HysMOW-SLAP values for both naturalabundancecaand water samples extremely enrichedindeuteriumuppto 57,000 i and((ii)subsequently todemonstrate the efficacy of using this analytical capabilityforlaser-based2H-enrichment methods to improve theproductivity of environmental tritium laboratories engagedin batch mode electrolytic enrichment of H. H METHOD FOR DETERMININGELECTROLYTIC TRITIUM ENRICHMENT Tritium is a popular radiotracer of short-term hydrologic andground water residence times,[17]but exceedingly lowconcentrations in environmental waters nowadays are toolow for direct decay counting. Thus water samples typicallyrequire pre-concentration of H by electrolytic enrichment.7.18]Methods for pre-concentrating tritium using 250-1000 mLwater samples employ sets of mild-steel alkaline electrolysiscells, or polymer electrolytic membrane units.919,20] Alltritium enrichment units (TEUs) have three commonalities:(i) pre-distillation of samples to remove dissolved ions, (ii)electrolytic H enrichment of the distilled samples to 8-60mLfinal volume, and (iii) decay counting by liquid scintillation(LSC) or gas proportionall counting (GPC) instruments.Depending on the H concentration, starting and final samplevolumes, electrolytic cell-type, and operational conditions,water samples may be enriched in H by factors of 10-90times or moreas needed for LSC or GPC. Notably,?H iscorrespondingly concentrated during electrolysis. A critical requirement for any TEU is accurate determinationofthe tritium enrichment factor for each cell in order tocorrect each sample back to its original H concentration in theenvironment(with appropriatedecay correction). Mostlaboratories use the Spike-Proxy method, whereby 10-20 %of samples processed through the TEU are high-concentrationtritium standards (spikes). The tritium recovery (R)) isdetermined from pre- and post-electrolysis gravimetric HOrecoveries (Vfinal/Vinitial) and measurement of spike3Hconcentrations before and after electrolytic enrichment: where T is the tritium concentration of the spike (net countsper minute (CPM) after background subtraction) before(i) and after (f) electrolysis, and V is the water volume (e.g. grams H2O) of the spike sample before and afterelectrolysis. Initial tritium concentrations of unknown samplesprocessed through the TEU are determined by rearrangement: The tritium recovery factor (R), unfortunately, can only bedetermined on spike cells. Hence spike recoveries and derivedenrichment parameters are averaged and applied equally toall TEU cells containing unknown samples. Quantitative waterrecoveries and accurate weighing are critical in the Spike-Proxymethod. Disadvantages are a significant reduction in samplethroughput because of the spike requirement. An alternatiev et ot othe Spike-Proxy methodisthe?H-enrichment method,8] which leverages the fact thatH (HDO) is correspondingly concentrated in a TEUelectrolysis process, albeit to a lesser extent than tritium(HTO) due to different net isotope fractionation factors andvapor losses. Nevertheless, tritium (if present) and deuteriumare very strongly correlated during electrolytic enrichment. 8.9]Because the electrolytically enriched ?H sample can bemeasured as an independent variable, it provides a meansfor determining the H-enrichment factors for each cell.This led to the concept of a cell constant (k) that correlatesthe H-and ?H-enrichment factors to each other:[19] where D is the final (f) and initial (i) sample ²H concentrationin ppm, and T is as above. Rearrangement allows determinationof the initial unknown tritium concentration (T;) of a sampleby knowing k (for each, or by averaging identical cells),measuring H in the electrolytically enriched sample (T),and measuring the initial and enriched H concentrations: A key requirement of the H method for determiningtritium enrichment factors is accurate determination of thecell constant (k) for all TEU cells, by the ability to measureextremely, 2H-enriched liquid water samples. The cellconstant is determined empirically by coupled H and Hspike testing, along with careful gravimetric recoveries. Thecell constant can be determined for individual cells, oraveraged if identical behavior can be demonstrated foreach TEU set. 19] An added benefit of the H approachis elimination of laborious gravimetric weighing steps(see Eqn. (4)). While elimination of gravimetric weighingseems attractive, by maintaining it the deuterium recoveryfactor (Ra) for each cell can also be determined: The H recovery factor facilitates immediate detection ofelectrolytic cell performance degradation, by not having towait for weeks for spike LSC counting completion. Todate, the H method is employed by few laboratories, andin all cases highly ?H-enriched samples are usually dilutedby a factor of 1000 or more to the natural abundance rangeand measured by traditional IRMS at considerable extracost. The requisite large dilutions and isotope mass balancebudgeting contribute significant error to the overall process. EXPERIMENTAL H-enriched calibration standards In order to measure extremely 2H-enriched water samples,appropriate enriched calibration standards are needed thatspan the o range of the samples. 11,12] Until recently, noprimary reference waters highly enriched in deuterium wereavailable. In 2015, the International Atomic Energy Agency(IAEA, Vienna, Austria)announcednewH-(and180-)enrichedipprimary HDOstandards.[21]For the purposes oftritium enrichment, two of these standards (IAEA605,IAEA606) were useful for the development ofH-enrichedlaboratory calibration standards. The 8HvsMOW-SLAp valuesof the IAEA primary reference waters are summarized inTable 1. Owing to the small amount of reference materialsprovided (20mL), we prepared 20 L of three H-enrichedlaboratory standard waters for use in daily normalization;these laboratory standards were calibrated using assignedvalues for IAEA605 and IAEA606. Three new laboratory standards were prepared gravimet-rically using distilled tap water (8-HvsMOW-SLAP=-77 %o),and by adding 32-200g of 99.9993 % deuterium oxide(Sigma-Aldrich, St. Louis, MO, USA) in order to span the8H range for 250-2000 mL electrolytically enriched samplesobtained in typical tritium operations (estimated to be in the6000-60,000 %o range for 8HysMOW-SLAP). The laboratorystandards were homogenized for 1 week prior to isotopicanalysis and stored at 0.5bar argon gas pressure in steelsiphon-dispensing containers. All 8HysMOW-SLAP calibrationswere conducted by off-axis integrated cavity output laserspectrometry, as described below. In order to obtain assigned 8HysMOW-SLAP values for thelaboratory standards, we conductedtwo-point datanormalization using IAEA605 and IAEA606 as calibrationstandards, with the laboratory standards measured asunknowns. After calibration, 8HysMOW-SLAP values wereassigned to all three H-enriched laboratory standards (IHLW-62, IHL W-63 and IHL W-68) and used to normalize the results of electrolytically enriched samples and spikes asmeasured by laser spectrometry. Each laboratory standardwas measured several hundred times against IAEA605 andIAEA606.Notably, IHL W-68was predicted to fallconsiderably outside the calibration range of the IAEA605and IAEA606 reference materials. Tritium enrichment unit test water samples All the H water samples for H-enrichment testing werespike standards that were measured for volumetric massbalances and H and H concentrations, using 250mL and500 mL pre- and post-electrolytic TEU systems. A second setof test samples consisted of 500 mL low-level H samplesfrom the 2012 IAEA TRIC inter-comparison.23 The TRICsamples allowed us to determine how well laser-based Hmethods resulted in tritium enrichment factors that returnedaccurate and precise original low-level H results. Batch electrolytic enrichments were conducted using mildsteel 24-cell TEU systems (250mL, 500mL) at the IAEAIsotope Hydrology Laboratory (IHL) which have been inuse for over 20 years. The alkaline TEU system and itsoperation are fully described in the IAEA tritium standardoperating procedure (SOP) available from the IsotopeHydrology Laboratory.4 Briefly, the IHL uses the Spike-Proxy method where 3 of the 24 (13%) samples in eachTEU processing batch are spikes. These spike triplets areadvanced by one position in each new electrolytic run. Thus,spikes are cycled through the TEU every 8 runs, and are usedto determine enrichment parameters for all the remainingcells. For this test, 0.5mL pre- and enriched spike sampleswere sampled opportunistically for H from routine IHLsample processing operations. One discrete 500mL,24-sample, TEU analysis set contained triplicate samples oflow-level TRIC test water samples. Deuterium samplingconsisted of taking a 0.5 mL sub-sample of the pre-electrolysisspike (natural abundance, after pre-distillation) and a 0.5 mLsub-sample from the 10-12 mL final electrolytically enrichedpost-distilled sample (extremelyH-enriched). All the Table 1. HysMOW-SLAP values of primary isotopically enriched reference waters, gravimetric estimates and laserspectrometric assay of three highly H-enriched IHL laboratory water standards used in routine tritium processing IAEA Primary Standards 8HvsMOW-SLAP(%) H(ppm) VSMOW2 0 142.8 SLAP2 -427.5 89.2 IAEA605 5,997.9 1088.8 IAEA606 15,993.6 2639.9 Enriched Laboratory Standards HysMOW-SLAP 0 HVSMOW-SLAP N H (ppm) (%, gravimetric) (%o, measured) IHL W-62 9249-9064 9173.7±3 490 1582.1 IHL W-63 17,919-18,282 18,064.2±6 320 2960.6 IHL W-68 58,211-57,057 56,842.8±10 116 8929.1 Gravimetric estimates were based on 20L (kg) of distilled tap water (8HvsMOW-SLAP=-77 %) and adding 32.00, 64.00 and 200.00g of 99.9993 deuterium oxide, assuming 1 % weighing error. Gravimetric estimates were made by mixing and 200.00g of 99.9993 deuterium oxide, assuming 1 % weighing error. Gravimetric estimates were made by mixing and isotope mass balance equations. [221 N=number of measurements made by laser spectroscopy. Boldface is mean±SEM, with assigned 8 values used in the IHL laboratory. distilled pre- and post-electrolysis samples for ?H analysiswere stored in tightly sealed 1.5 mL Teflon septum cappedlaser spectrometry vials until analysis. Laser analyses wereconducted within 1 day to 1 week after collection. Tritium measurements Unenriched and enriched spike samples corresponding to thesame H sub-samples were measured by liquid scintillationcounting (LSC) on a Quantulus 1220 (Perkin Elmer, Akron,OH, USA). The tritium-counting procedure is fully describedin the IAEA SOP.I24] Briefly, 8mL of pre- and post-enrichedspikes were mixed with 12 mL of Ultima Gold uLLT (PerkinElmer) scintillation cocktail and allowed to stabilize in thedark. The LSC template consisted of 24 unknown enrichedsamples including 3 enriched spikes, as well as 2 unenrichedspikes, 2 calibration standards, and 4 background samples.The total counting time was 500 min/sample conducted over10 counting cycles (approx. 12 days). Optimal operation of theQuantulus LSC has been described previously.251 All spectralregions of interest were optimized for low-level H betacounting in water to obtain the highest figure of merit(FOM). Net CPM values for pre- and post-enriched spikeswere obtained by subtraction of the mean background CPM(~0.5 to 0.8 CPM) on a per run basis. For this study, weextracted net CPM data of pre-and post-spike data obtainedfrom multiple Quantulus LSC runs covering the period fromOctober 2014 to July 2015, and where deuterium measurementswere conducted. All data processing was done using anExcel-based Tritium Information Management System (TRIMS)developed at the IHL. Error propagation was determined forall the processing steps as outlined in the IAEA SOP, and thiswas included in the final uncertainty reporting of the H results. Laser spectrometry for H-enriched samples Several off-axis integrated cavity output water isotope laserinstruments from Los Gatos Research (Mountain View, CAUSA) were tested for directly measuring highly 2H-enrichedwaters. We tested 1st-3rd generation Los Gatos Research laserinstruments and found they did not correctly report 8Hvalues above ~12,000-15,000 %o, despite apparently goodisotopologue optical spectrometry, due internal softwarelimitations in these older instruments (Doug Baer, Los GatosResearch, personalcommunication). Innthisstudywetherefore used the newest Los Gatos Research liguid waterisotope analyzer model 912-0032 (4generation). For laser-based HDO measurements, all the pre-and enrichedpost-electrolysis samples and laboratory calibration standardswere separated into three groups. The first comprised pre-enrichment samples having natural abundance H levels.Thesewere measured by routine laser spectrometry using naturalabundance water standards, controls, and data-processingprocedures using LIMS for Lasers 2015, as fully describedelsewhere.15,26] A batch of 24 TEU pre-enriched water samplesand standards employed an analysis protocol of 8 injections,ignoring the first 4, at a rate of 11 min/sample. For extremely H-enriched water samples beyond theVSMOW-SLAP calibration scale, the same procedure wasused but with some modifications. First, water sampleswere separated by TEU size and the expected degree ofH enrichment. For example, 250mL cell and 500mL cell deuterium samplesWeree grouped separately. For the250 mL TEU system, we predicted 8 values around 12,000 %oand therefore used a two-point calibration using laboratorystandardsIHL W-62((low standard))andIHLW-63(high standard); in the case of the 500 mL TEU or 1000 mLand higher experimental enrichments samples, we usedIHL W-62 (low standard) and IHL W-68 (high standard),and IHL W-63 was used as a control (Table 1). The only other minor modification for laser spectrometrycompared with the natural abundance procedures was thenumber of injections per vial. Owing to the highly enrichedH levels, we empirically determined that 12 injections,ignoring the first 4, was sufficient to obtain accurate resultsandminimize between-samplememory correctionsasquantified by LIMS for Lasers 2015. This resulted in ananalysis rate of 16 min/sample for each enriched sample.For the routine TEU sets of 24 samples, this translated to only504 injections per set on the laser instrument, well withinhigh-performance septa specifications (Supelco ThermogreenLB-2, 6 mm disks; Supelco, Bellefonte, PA, USA). Includinglaboratory standards and controls, the processing rate was60 unknown samples per day. If the laser instrument usedfor highly H-enrichedsamples was subsequently neededfor natural abundance water samples (pre-enriched samples,all other samples), approximately 50 sequential injections(approximately 1 h) of tap water was sufficient to flush awaythe residual memory of the H-enriched water samples. Inshort, complete sets ofpre- andpost-electrolysis watersamples could be analyzed by laser spectrometry in less than48 h, thereby providing near immediate feedback on the batchTEU electrolytic enrichment performance. All laser-based deuterium results (8HysMOW-SLAP) wereprocessed and reported in the%o notation relative to theVSMOW standard, and processed using LIMS for Lasers2015. The 8 values data were transformed into mass fractionsdeuterium (ppm) using: RESULTS AND DISCUSSION H-enriched laboratory standards Gravimetrically determined and laser-measured 8HvsMow.sLAp values for three IHL laboratory standards measuredrelative to IAEA605 and IAEA606 are summarized in Table 1.lnthe case of IHL W-62 andIHL W-63, the laserspectrometry-measured 8H results fell within the 8 rangepredicted by gravimetric determinations. For sample IHLW-68, the measured 8H value was only slightly lower thanpredicted by gravimetric calculations, probably because thesample was far outside the IAEA605 and IAEA606 referencecalibration range, and due to possible effects of very slightisotopic o-scale compression on the laser instrument. As afurther check, we measured IHL W-63 as an unknown sampleusing assigned values of IHL W-62 and IHL W-68 ascalibration standards. In this case, IHL W-63 returned a8HysMOW-SLAp value of+18,232±33 %(n=38), close to thatreported in Table 1, and within the range predicted by gravimetric estimates. Without primary standards coveringthis higher o range, the IHL W-68 value remains tentative,but for such a high enrichment was remarkably close tothe predicted H value. For our purposes, we acceptedthe laser-measured 8H values in Table 1 as correct, andthese 8 values and their uncertainties were assigned for allsubsequent routine H electrolysis and data-processingoperations. Sample 8 value conversions into mass fractions(ppm) are listed in Table 1. For the primary RMs andlaboratory standards, the mass fractions ofdeuteriumranged from 89.2ppm (VSLAP2) to 2639.9ppm (IAEA606),whereas the enriched IHL lab standards ranged from1582.1 ppm (IHL W-62) to 8929.1ppm (IHL W-68). Thesefindings show that commercial laser spectrometry can beused to quickly and accurately measure water samplesextremely enriched in H, and having 8’H values up to atleast 57,000 %, and possibly even higher. The enriched laboratory standard IHL W-68 was prepared inanticipation of electrolytic enrichment of large 1-2 Lsamples,which will be increasingly required as environmentalHlevelsdecline to background levels. Indeed, the recent TRIC testrevealed that only laboratories that enriched water samples50x or higher were able to achieve accurate and preciseresults for low-level (<5 TU) tritiumy teststsamples.23Currently, few laboratories enrich samples greater than500 mL (e.g.8HVSMOW-SLAP of ~25,000 %) due to extra costor the lack of a suitable TEU apparatus. The ability to directlymeasureH at extreme concentrations by laser spectrometryprovides a new way to quickly determine cell performanceand H-enrichment factors beforehand, without having towait weeks for LSC spike-counting results. Results of tritium spike standards The results of H and ?H assays on spikes processed on250 mL and 500 mL TEU systems between October 2014 andJuly 2015 are tabulated in Table 2. TheH and H recoveriesfor each electrolytic cell were determined using Eqns. (1)and (5). The average deuterium recovery for the 250 mLTEU was 74.4±1.6%, with an overall range for individualcells of between 71 and 77%. The average deuteriumrecovery on the 500 mL TEU was 77.0±1.0 %, with a rangefor individual cells of between 75 and 79 %. Notably, cell #4(excluded from summaries) was known to be performingbadly, and was in the process of being reconditioned afterchemical treatment. This TEU cell still indicated poor Hrecovery of only 54.8 %. Thus, ?H can also be used as anindicator for monitoring cell-enrichment performance priorto starting LSC counting. In our case, a threshold of 70 %fordeuterium recovery appeared to be a reasonable lower boundto reveal cell degradation, upon which cell reconditioningmay be warranted, and samples from degraded cells shouldnot be used. Similarly, the mean H recovery on the 250mLTEU system was 86.3±2.2%, with an overall range forindividual cells of 81-89 %. The mean3‘H recovery forthe 500 mL TEU system was 92.4±2.1 %, with an overallrange for individual cells of from 90 to 97 %. Poorly performingcell #4 had a lowH recovery of only 81.0 %. The cell H-H constant (k) values for the 250mL and500 mL TEUs were determined using Eqn. (3) and themeasured 8H and H values from each triplicated spikeand cell. The initial CPM of the unenriched spike sample for each triplet was the mean of two measurements, summarizedin Table 2. The individual cell constants were remarkablysimilar within and across both mild-steel TEU systems. Forthe 250 mL TEU system, the mean cell constant k was1.0542±0.0044, with an overall range for the individual cellsbetween 1.0460 and 1.0620. For the 500 mL TEU system themean cell constant was 1.0592±0.0101, with the overall rangefor individual cells ranging from 1.0509 to 1.0670. A Student’st-test revealed that there was no significant differencebetween the mean cell constants of the 250 mL and 500 mLTEU systems (p=0.058). The mean cell constant for thecombined 250 and 500 mL TEU systems was therefore1.0555±0.0048. For all subsequent calculations, and due tothe absence of long track records for individual cell constants,we used the mean cell constant and its uncertainty asapplicable to the 250 mL and 500 mL IHL TEU systems. To demonstrate how well using a cell constant k recoveredthe initial measured CPM for both IHL electrolysis systems,Eqn. (4) was used to determine the initial sample H CPMvalues. In Table 2, a comparison ofHinit (e.g. un-enrichedspike) with the electrolytically enriched spike triplicatesCPM, and application of the uniform cell constant, revealedexcellent performance in determining the initial H content(last column), despite the fact TEU sample enrichmentswere conducted over a 10-month period with two differentTEU systems and using three different LSC counters. Notably,no gravimetric data was required with the ?H methodto determine the tritium enrichment factors or the initialsample H content. Poorly performing cell #4 showed a markedly differentkconstant (1.1219))1from tthhee good cells. Importantly,application of the measured cell constant yielded aninaccurate H recovery (10.91 CPM vs actual 8.82 CPM),indicating that the?H-derived cell constants cannot be usedblindly to remedy badly performing cells. Poorly performingcells should be removed from the TEU and reconditioned.Monitoring deuterium recovery factors isGttherefore animportant control in evaluating TEU cell performance. Ourdata suggest that ‘H results obtained from cells with poorH recoveries (e.g. <70 % on IHL TEU systems) should notbe accepted. These H control criteria will need to bedeveloped for each unique laboratory TEU system. Ideally,over time it may be possible to obtain robust individual meancell k constant criteria by maintaining regular or occasionalspike testing. While the use of individual cell constants seemsintuitively superior, it remains to be seen whether individualcell constants, versus averaged cell constants, providesdemonstrably betterH results after all sources of uncertaintyare factored in. Evaluating the H method for accuracy and precision The final test consisted of applying theH-H-determinedmean cell constant k to a routine set of 24 samples processedby enrichment on the 500 mL TEU system (including poorlyperforming cell #4), and then comparing the final tritium(TU±SD) outcomes withthoseobtainedusingtheconventional Spike-Proxy method. This test set includedtriplicates of the IAEA tritium inter-comparison samples,which consisted of five low-level samples <8 TU havingwell-established H values, 23] three spike standards (knownTU), two unknown samples (one DI water placed in cell #4) Electrolysis CounterrCell V Hinit Hfinal 2H Hinit Hfinal 3H Cell H ID ID # grams ppm Recovery % cpm Recovery % constant Initial 250mL 1405 Q3 10 249.4 11.4 143.5 2365.3 75.4 9.13 173.48 87.0 1.0508 9.00 1405 Q3 11 249.2 11.2 143.4 2398.6 75.0 177.31 87.1 1.0533 9.06 1405 Q3 12 249.2 11.0 143.5 2363.8 72.7 174.46 84.4 1.0531 9.06 1406 Q3 16 249.5 11.7 143.6 2303.9 75.3 8.91 165.53 87.1 1.0527 8.84 1406 Q3 17 249.3 11.3 143.7 2323.3 73.3 167.76 85.3 1.0546 8.89 1406 Q3 18 249.1 11.5 143.7 2300.9 73.9 167.28 86.7 1.0572 8.95 1407 Q2 19 249.3 11.7 143.5 2178.9 71.2 8.73 150.80 81.1 1.0475 8.54 1407 Q2 20 249.3 12.2 143.6 2208.2 75.3 153.73 86.2 1.0495 8.58 1407 Q2 21 249.1 11.0 143.6 2329.7 71.6 162.83 82.4 1.0500 8.59 1408 Q1 22 249.6 11.9 143.7 2204.3 73.1 9.21 167.28 86.6 1.0620 9.37 1408 Q1 23 249.4 12.0 143.7 2247.9 75.3 168.82 88.2 1.0577 9.26 1408 01 24 249.8 12.6 143.7 2102.3 73.8 158.12 86.6 1.0597 9.31 1409 Q1 1 249.6 12.6 143.6 2172.5 76.4 9.10 160.33 88.9 1.0560 9.11 1409 Q1 2 249.6 12.4 143.6 2207.4 76.4 163.61 89.3 1.0572 9.14 1409 Q1 3 250.0 12.9 143.6 2076.9 74.6 154.80 87.7 1.0607 9.23 1410 Q1 4 249.4 12.5 143.7 2164.1 75.8 9.01 158.21 88.4 1.0568 9.04 1410 Q1 5 249.5 12.7 143.7 2176.2 77.0 158.25 89.3 1.0545 8.98 1410 Q1 6 249.5 12.2 143.6 2186.2 74.2 160.29 86.7 1.0573 9.05 1411 Q1 7 249.4 11.8 143.5 2299.0 75.8 9.24 168.18 and one enriched background sample. The use of these inter-comparison samples allowed independent verification of theaccuracy of performance of the H and Spike-Proxy methodsto obtain enrichment factors and produce accurate final TUresults. The electrolysis, H and LSC counting test results areshown in Table 3, and give comparative outcomes using thelaser H-enrichment and Spike-Proxy methods. With thetraditional Spike-Proxy method, three measured spikesshown in Table 3 were used to determine the mean tritium Cell # Sample name Lab No. date Enrichment TUUncertainty Recovery Enrichment tTU Uncertainty Spike method H-Enrichment method 1 Spike 2422 7/30/2014 29.7 537.86 5.38 76.5 29.8 535.34 3.34 2 Spike 2397 7/30/2014 27.8 539.16 5.16 76.4 27.8 540.42 3.57 3 Spike 2421 7/30/2014 29.5 550.90 5.61 78.1 30.3 536.51 3.49 4 Almendras July 2011 2454 7/15/2011 39.8 2.10 0.12 64.1 34.0 2.46 0.13 5 TRIC T25 2455 12/1/2012 28.3 7.56 0.12 77.5 28.7 7.45 0.10 6 TRIC T24 2449 12/1/2012 28.4 4.36 0.19 76.9 28.6 4.33 0.18 7 TRIC T23 2451 12/1/2012 29.0 2.88 0.10 76.5 29.1 2.88 0.09 8 TRIC T22 2509 12/1/2012 27.9 1.10 0.12 76.9 28.1 1.10 0.12 9 TRIC T21 2514 12/1/2012 30.2 0.45 0.11 77.9 31.0 0.44 0.11 10 TRIC T20 2510 12/1/2012 30.8 0.00 0.07 75.9 30.8 0.00 0.07 11 TRIC T25 2515 12/1/2012 29.6 7.38 0.26 76.6 29.8 7.34 0.25 12 TRIC T24 2511 12/1/2012 29.4 4.60 0.15 77.2 29.8 4.54 0.15 13 TRIC T23 2519 12/1/2012 28.8 2.88 0.10 78.0 29.5 2.82 0.10 14 TRIC T22 2520 12/1/2012 27.6 1.28 0.11 79.0 28.5 1.24 0.11 15 TRIC T20 2521 12/1/2012 31.6 0.30 0.09 74.9 31.2 0.31 0.09 16 TRIC T20 2516 12/1/2012 29.3 -0.12 -0.09 76.5 29.4 -0.12 -0.09 17 TRIC T21 2512 12/1/2012 29.2 0.65 0.11 75.5 28.9 0.65 0.11 18 TRIC T21 2517 12/1/2012 30.3 0.66 0.13 76.4 30.4 0.65 0.13 19 TRIC T22 2513 12/1/2012 30.4 1.18 0.09 79.7 31.9 1.12 0.09 20 TRIC T23 2518 12/1/2012 29.0 2.72 0.13 77.2 29.3 2.69 0.12 21 TRIC T24 350 12/1/2012 28.8 4.57 0.14 75.7 28.6 4.61 0.14 22 TRIC T25 250 12/1/2012 28.0 7.79 0.29 77.3 28.3 7.71 0.28 23 Sample TK-11 Table 4. Comparison of known-value IAEA TRIC inter- comparison samples, enriched and processedusing the H-enrichment and Spike-Proxy methods laser“ 2H- TRIC Known Spike Enrichment sample value method method N Mean SD Mean SD TRIC T25 7.51 7.58 0.21 7.50 0.19 3 TRIC T24 4.37 4.51 0.13 4.49 0.15 3 TRIC T23 2.74 2.83 0.09 2.80 0.10 3 TRIC T22 1.12 1.19 0.09 1.15 0.08 3 TRIC T21 0.43 0.59 0.12 0.58 0.12 3 TRIC T20 0 0.06 0.22 0.06 0.22 3 enrichment parameter, which was applied uniformly to allthe sample cells, versus the H method where we used theaverage cell constant as determined above for the TEUsystem. The reported final TU values and their propagateduncertainties were obtained by data processing with theIHL TRIMS software. Encouragingly, it was obvious fromthe results in Table 3 that the Spike-Proxy and laser ?H-enrichment methods both returned nearly identical andaccurate results for the laboratory spike (542.1 CPM) withinthe expected measurement uncertainty (10 %). For all cellsin the 500mL TEU system (except #), the deuterium recovery factors were above 75 %, indicating that the TEUcells were performing as well as expected. There was alsoexcellent agreement among the H-enrichment factorsdetermined by the H-enrichment and Spike-Proxy methods,with no significant difference in the mean tritium enrichmentfactors obtained using these methods (Student’s t-test,p=0.388). A summary of the international H inter-comparison test sample results is given in Table 4. For theTRIC test samples,theH-enrichmenttand Spike-Proxymethodsbothyieldedaccurateand preciseoutcomescomparedwith their well-established values. In short, theTRIC test sample results confirmed that the laser-basedH-enrichment method provided a faster and reliable wayy itoobtainaccurateH-enrichmentfactorsforalltypesofelectrolytic enrichment cell systems. CONCLUSIONS The use of off-axis integrated cavity output laser spectrometryto accurately and directly measure extremelyH-enrichedwaters up to 57,000 % (~9000ppm deuterium) at a rate of60 samples/day will facilitate the use of H as a tracer inenvironmental and hydrological applications. The incorporationof the laser-based, 2H-enrichment method into low-leveltritium operations can facilitate a 10-20 % increase in samplethroughput by elimination of replicated spike standards, andlaborious gravimetrics, and by providing immediate feedbackon the quality of electrolytic cell performance. Additional benefits of laser spectrometry include low cost, ease of use,and the ability to quickly switch back to natural abundancewater samples for conducting conventional stable isotopeanalyses of environmental waters. Acknowledgements This research was funded by the International Atomic EnergyAgency. We thank D. Brummer and C. Sambandam forassistance with sample processing. We thank the reviewersfor their constructive comments. ( REFERENCES ) ( [1] D. A. Schoeller . Measurement of e nergy-expenditure infree-living humans b y using doubly lab e led wat e r. J. N utr. 1988, 1 18, 1 278. ) ( [2] K. A. N agy, I. A . Girard, T . K . B rown. Energetics o ffree-ranging mammals, reptiles, and birds. Annu. Rev. Nutr. 1999,19, 247. ) ( [3] D. X. Soto, K. A. Hobson, L. I. Wassenaar. The influence ofmetabolic effects o n stable h ydrogen is o topes in ti s sues ofaquatic organisms. Is o t. E n viron. Health Stud. 2013, 49, 305. ) ( [4] Z. D. Sharp, V. Atudorei , H.O. P anarello, J . Fernandez, C. D outhitt. . Hydrogen i sotope systematics o f hair:archeological a nd fo r ensic ap p lications. J. A r c haeol. Sci . 2003,30,1709. ) ( [5] GC. van der Kamp, D. R. van S t empvoort, L. I . Wassenaar. T h eradial diffusion method. 1. Using intact cores to determineisotopic composition, c h emistry, a n d effective po r osities forgroundwater in aquitards. Water Resources Res. 1 9 96, 32, 1815. ) ( [6] M. J . H endry, S. L. Barbour,K. Novakowski, L. I. W assenaar.Paleohydrogeology o f t he C retaceous sediments of theWilliston Basin u sing stable i sotopes of w a ter. Water Resources Res 2013,49,4580. ) ( [7] U. Morgenstern, C . B. Ta y lor. Ul t ra lo w -level tr it iummeasurement us i ng electrolytic e n richment an d LSC . Isot. Environ. H ealth Stud.2009, 45, 96. ) ( [8] C. B. Taylor. T he relationship between electrolytic deuteriumand t ritium separation factors, and attainment of improvedaccuracy i n r adiometric low-level t r itium m e asurement.Appl. Radiat. Isot. 1994,45,683. ) ( [9] H. O stlund, E. Werner, in T ritium in t he Physical and BiologicalSciences, vol. 1. Proceedings ofa Symposium, 1962. ) ( [10] J. H orita, C. Kendall. Stable isotope analysis of water and aqueous solutions b y co nventional d ual-inle t n mass spectrometry. in Handbook k of S S t t ableIsotope A n alytical T echniques, ( Ed: P. A. de Groot). Elsevier, 2004, pp . 1-37. ) ( [1 1 ] T. Donnelly, S . W aldron, A. Ta i t, J . D o u gans, S. Be a rhop.Hydrogen i s otope a nalysis of n atural abundance a nddeuterium-enriched w aters b y reduction over c h romium on-line to a d ynamic dual inlet isotope-ratio mass spectrometer. Rapid Commun. M a ss Spectrom. 2001, 15,1297. ) ( [12] S. Guidotti, H.d G. h . J J ansen , A T. T. Aerts-Bijma, B . M . V erstappen-Dumoulin,G. van Dij k , H. A. Mei j er.Doubly l abelled w ater analysis: : preparation, memory correction, calibration an d quality assurance fo r 8H and80 me a surements over four orders of magnitudes. Rapid Commun. Mass S p ectrom. 2013, 27,1055. ) ( [13] R. van Trigt, E. R . Kerstel, G. H. Visser, H . A . Meijer. Stable i sotope ratio measurements o n highly enriched w a tersamples by means of l a ser spectrometry. Anal. Chem. 2001, 73,2445. ) ( [14] G. L is, L. I . Wassenaar, M. J. H endry. High-precision lase r spectroscopy D/Hand10/0 measurements of microliter natural w ater samples. A n al. C h em. 2008, 80, 287. ) ( [15 ]L . I. Wassenaar, T. B. Coplen, P . K. Aggarwal. Approaches for achieving long-term accuracy and p recision of 88oand H fo r waters analyzed us i ng la s er a b sorption spectrometers. Environ. Sc i . T e chnol. 2 0 14, 48, 1 1 23. ) ( [16] T .Thorsen, T. Shriver, N. Racine, B. A. Richman,D. A. Schoeller.Doubly labeled water a n alysis u s ing cavity r i ng-downspectroscopy. Rapid Commun. Mass Spectrom. 2011, 25,3. ) ( [17 ] I . D . Clark, P . F r itz. Environmental Is o topes in H y drogeolooy. L ewis Publishers, New Y ork, 1997. ) ( [18] C. M. Hoffman, G. L. S tewart. Quantitative determinationof t ritium in natural waters, USGS Water-Supply Paper1696-D, 1966. ) ( [19] T.Muranaka,N. Shima. Electrolytic enrichment of tritium inwater u s ing SPE fil m . in E le c trolysis, (E d s: J. K l e peris, V. L i nkov). InTech, 2012, pp. 141-62. ) ( [20] C . T aylor, in Proceedings o f International Conference o n Low-Radioactivity Measurements andApplications, ,CSSR. Slovenske P edagogicke Nakladatestvo, 19 7 7, p. 1 3 1. ) ( [21] V. Faghihi, B. Verstappen-Dumoulin, H. Jan s en, G. D ij k ,A. Aerts-Bijma, E. Kerstel , M. Groning, H. Meijer. A new high-quality set of singl y (’H ) and doubly (H and 18o)stable isotope labeled reference waters f or biomedical andother isotope-labeled research. Rapid Commun. Mass Spectrom.2015, 29, 3 11. ) ( [22] V . Faghihi, H . A. Meijer , M. Groning. A t horoughly v alidated s preadsheet f o r c a lculating isotopic abundances (H,1 o ,18O) for mixtures of waters with d i fferent i sotopic compositions. R a pid Commun. Mas s Spectrom. 2015, 29, 135 1 . ) ( [23] D. Hillegonds, L. Wassenaar, P. K laus, P. A ggarwal.Synthesis report: Intercomparison test for the determination of low-level tr itium a ctivities i n n atural w aters for age dating purposes (TRIC2012). I AEA I n ternal D ocument 2014.19. ) ( [24] | IAEA. Internation a l Atomi c Energy Agency 1 I sotope Hydrology Laboratory, 2014. ) ( [25 L ] . P u jol, J . A. S anchez-Cabeza. Optimisation o f liquid scintillation counting ( c onditions for r apid tritium determination in aqueous samples. J. Radioanal. N ucl. C hem. 1999,242,391. ) ( [26] T. B. Coplen, L . I . Wassenaar. LIMS fo r La s ers 2015 for achieving long-term accuracy and precision of 8H,8O,and 8 of w aters usi n g laser ab s orption spectrometry. Rapid Commun. Mass Spectrom.2015,2 9 ,2122. ) apid Commun. Mass Spectrom. opyright John Wiley & Sons, Ltd. ileyonlinelibrary.com/journal/rcmRapid Commun. Mass Spectrom. opyright @ John Wiley & Sons, Ltd. Measurement of extremely 2H-enriched water samples by laser spectrometry: application to batch electrolytic concentration of environmental tritium samples国际原子能机构(International Atomic Energy Agency -- IAEA)研究人员应用LGR水同位素分析仪测量高2H富集水样(备注:该文章是IAEA的研究人员独立发表的文章,具有权威性、客观性和独立性,亦可广泛使用。)IAEA的研究人员发表了一篇应用LGR 水同位素分析仪(912-0032)测量高2H富集水样的文章,文章有2个目的:(1)论证基于OA-ICOS技术的水同位素分析仪可以快速获得高准确性和高精度的自然丰度水样和氘富集水样(delta_2H ~ +57,000‰)的δ2HVSMOW-SLAP 数值;(2)随后论证基于激光技术2H富集方法测量水样的效能,以促进进行批处理3H电解富集的环境氚水实验室的生产力。文章中还简要说明了应用CRDS分析仪测量高2H富集水样的情况(CRDS水同位素分析仪可测量数值约为750‰的δ2HVSMOW-SLAP样品,但两个样品之间需要大于20次以上的注射才可去除显著的记忆效应。因此实际上每天只能测量15个样品)。2015年,IAEA(Vienna,Austria)宣布使用新的2H-(和18O-)富集的HDO基准标样。而所有δ2HVSMOW-SLAP 校准均使用的是OA-ICOS技术水同位素分析仪。【译者注:请注意,IAEA研究人员使用的是采用OA-ICOS技术的LGR水同位素分析仪,而非CRDS技术的仪器,这说明LGR水同位素分析仪可作为制作IAEA标样的分析仪,LGR分析仪更准确、更高精度、更稳定。】IAEA文章阐述了LGR水同位素分析仪的4个关键性优势:1. 能够准确测量含量高达9000ppm的高富集HDO的水样品(delta_2H ~ +57,000‰), 其精度和准确度是目前测量天然水样所能达到的最高水平;2. 在测量高富集样品后的1个小时之内,用户即可应用同样的设置测量普通的自然水样,快速的消除记忆效应,没有同位素质谱仪可以做到这一点;3. 文章中报道LGR水同位素分析仪可每天测量60个高富集水样品;4. 文章所述LGR水同位素分析仪的高性能在所有EP型号的水同位素分析仪上均可实现,无需特殊设置。结论:LGR水同位素分析仪性能高、耗材成本低、易于使用,并可快速切换回自然常规水样的稳定同位素分析测量,是同类水同位素分析仪器中的佼佼者。
确定
还剩6页未读,是否继续阅读?

产品配置单

北京理加联合科技有限公司为您提供《水中测量高2H富集水样检测方案(同位素质谱仪)》,该方案主要用于环境水(除海水)中理化分析检测,参考标准--,《水中测量高2H富集水样检测方案(同位素质谱仪)》用到的仪器有美国Picarro G2132-i 同位素分析仪 测量 CH4 的 δ13C
推荐专场