


从理论上来说,土壤热流变送器的校准,会受到变送器和校准介质之间导热系数和变送器几何形状的影响。本文对这些影响进行了研究,采用两种具有不同导热系数材质和几何形状的商品化土壤热流变送器,比较了这些参数对校准参数的影响。开发出一种理论校准公式并对此公式进行了评价。对两种类型共14个热流变送器采用稳态防护热板法在实验室内进行试验,所提供的热流密度变化范围为40~200W/m2,校准介质为导热系数变化范围为0.3~3W/mK的干燥饱和沙。其中一种热流变送器的平均校准因子要低于厂商数据12%,而理论预测值则更低于厂商数据26%~36%。其它类型热流变送器的平均校准因子则高于厂商数据7%,而理论预测值高于常数数据1%~11%。计算后的几何因子对圆形变送器为1.07,对正方形变送器为0.89,这些几何因子都小于理论值1.70,但与以往文献中报道的试验值范围1.02~1.31相近。
方案详情

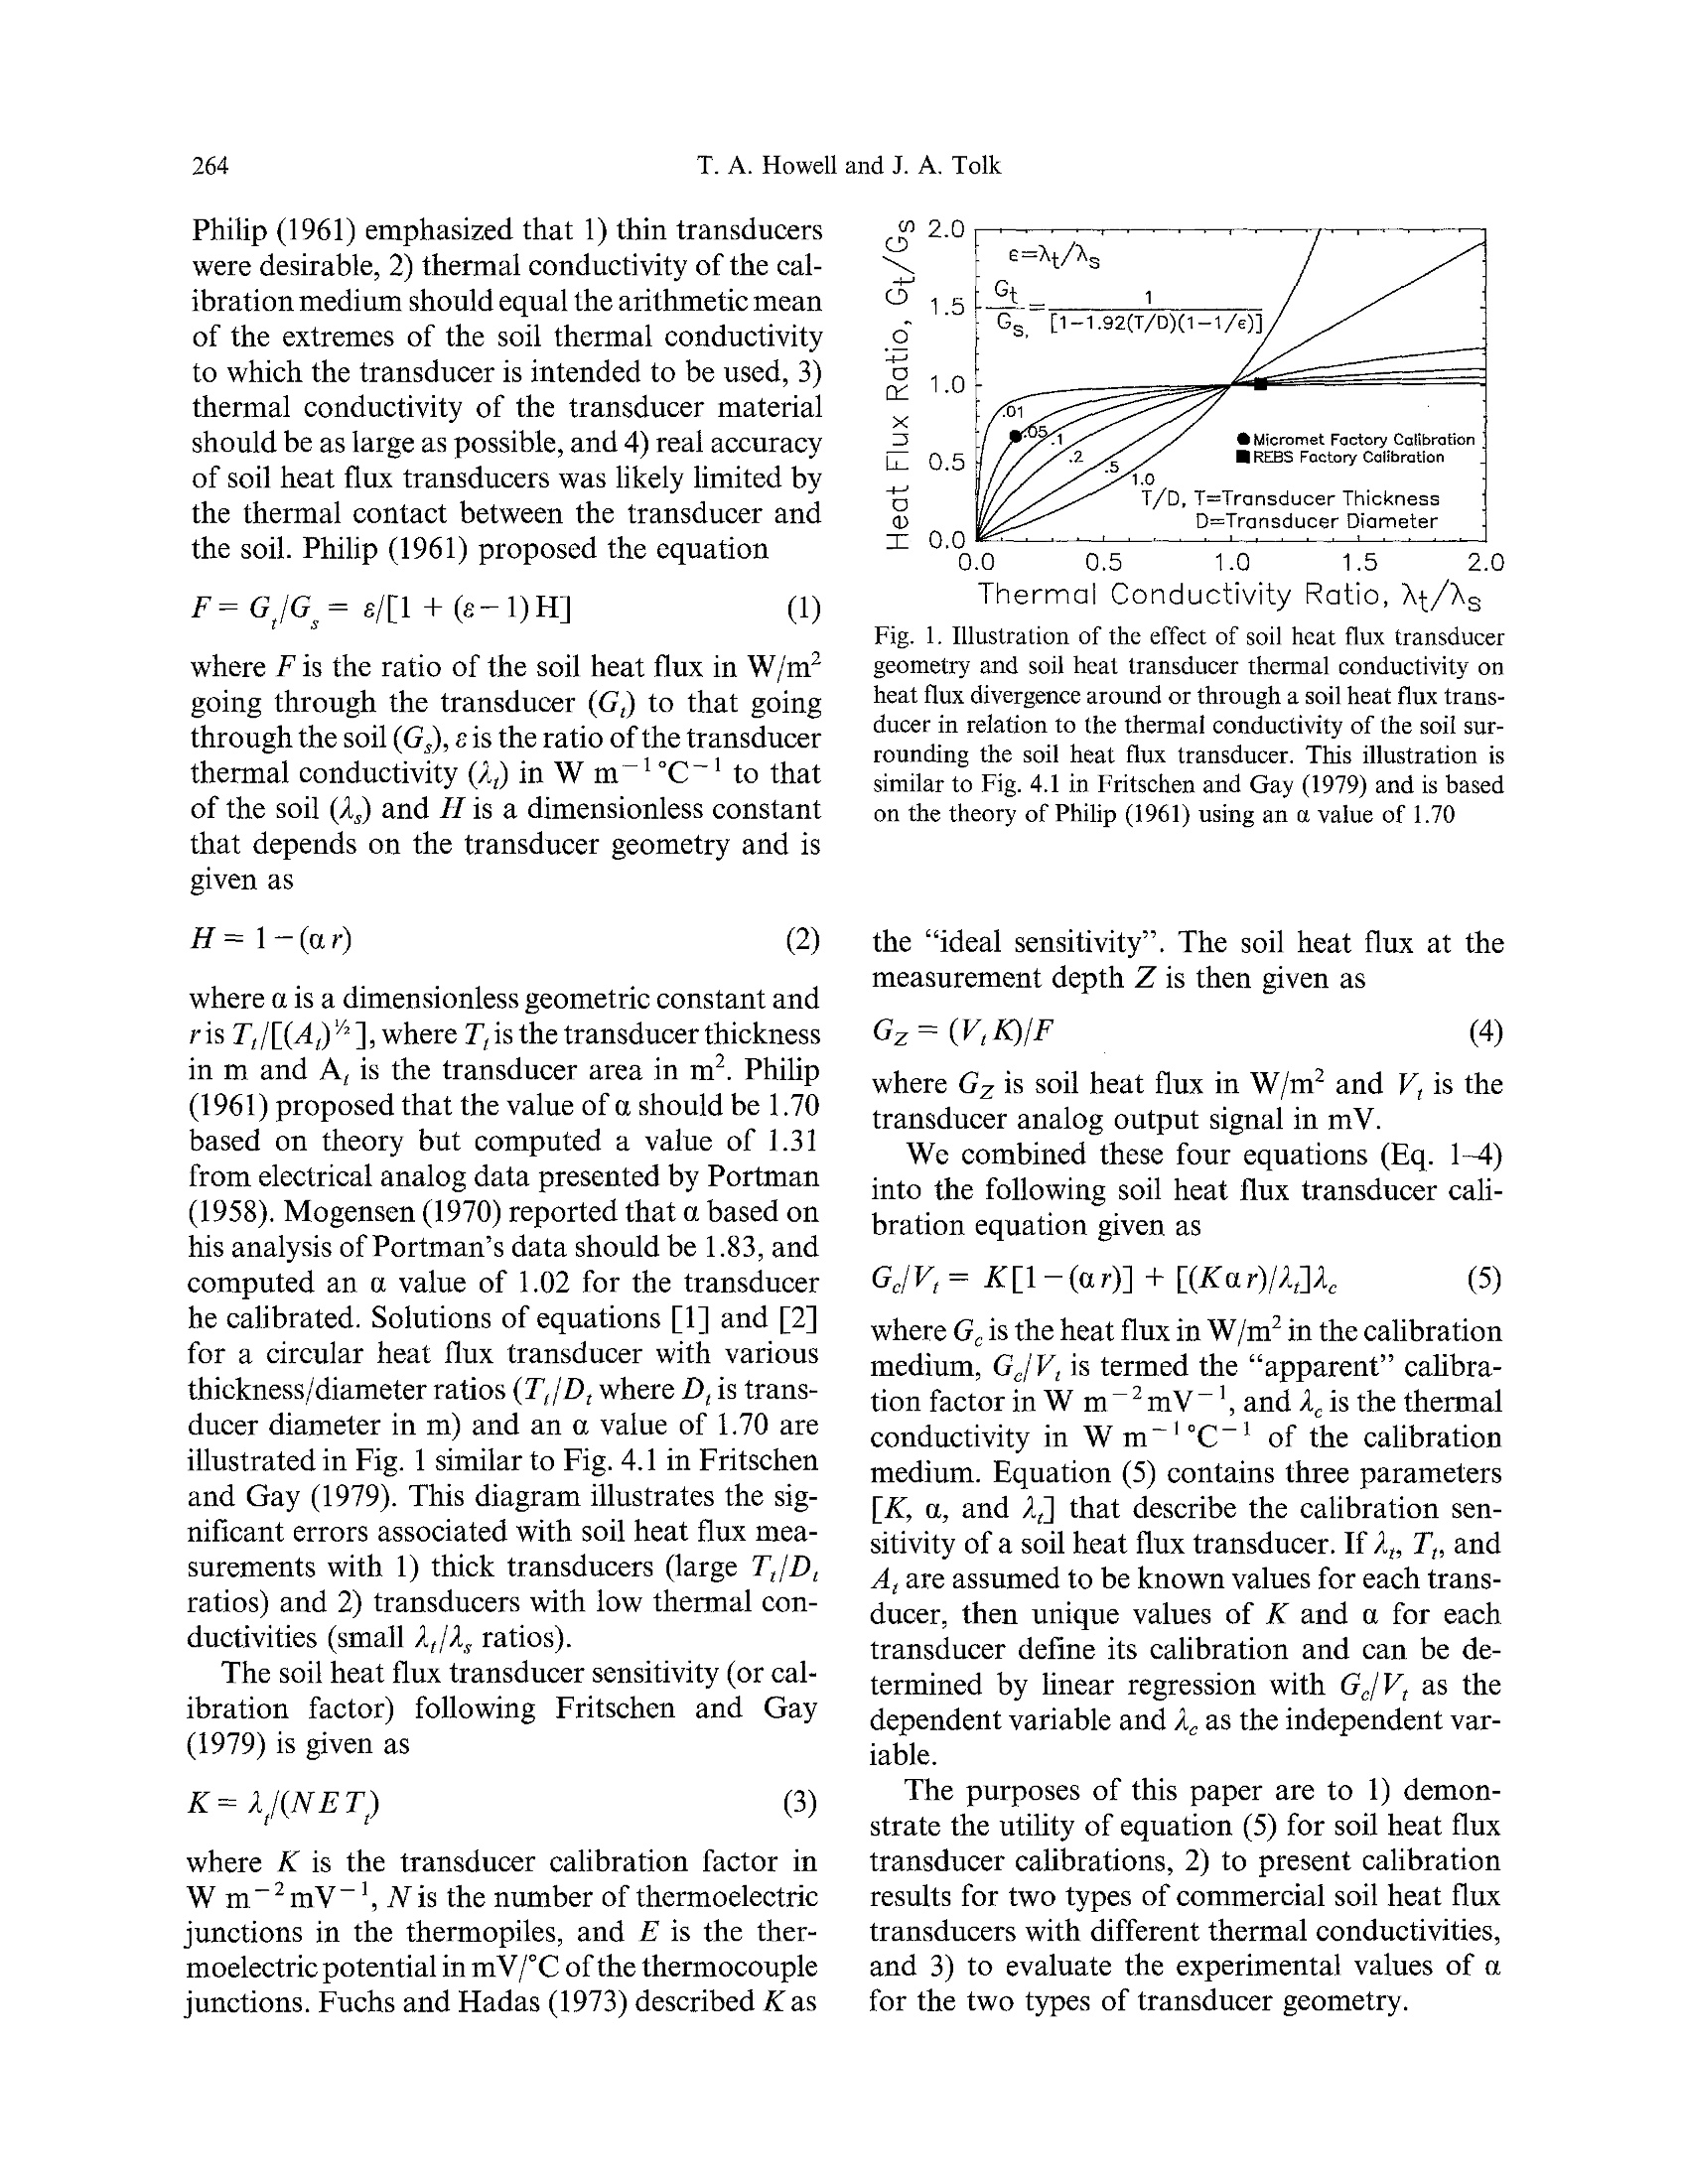
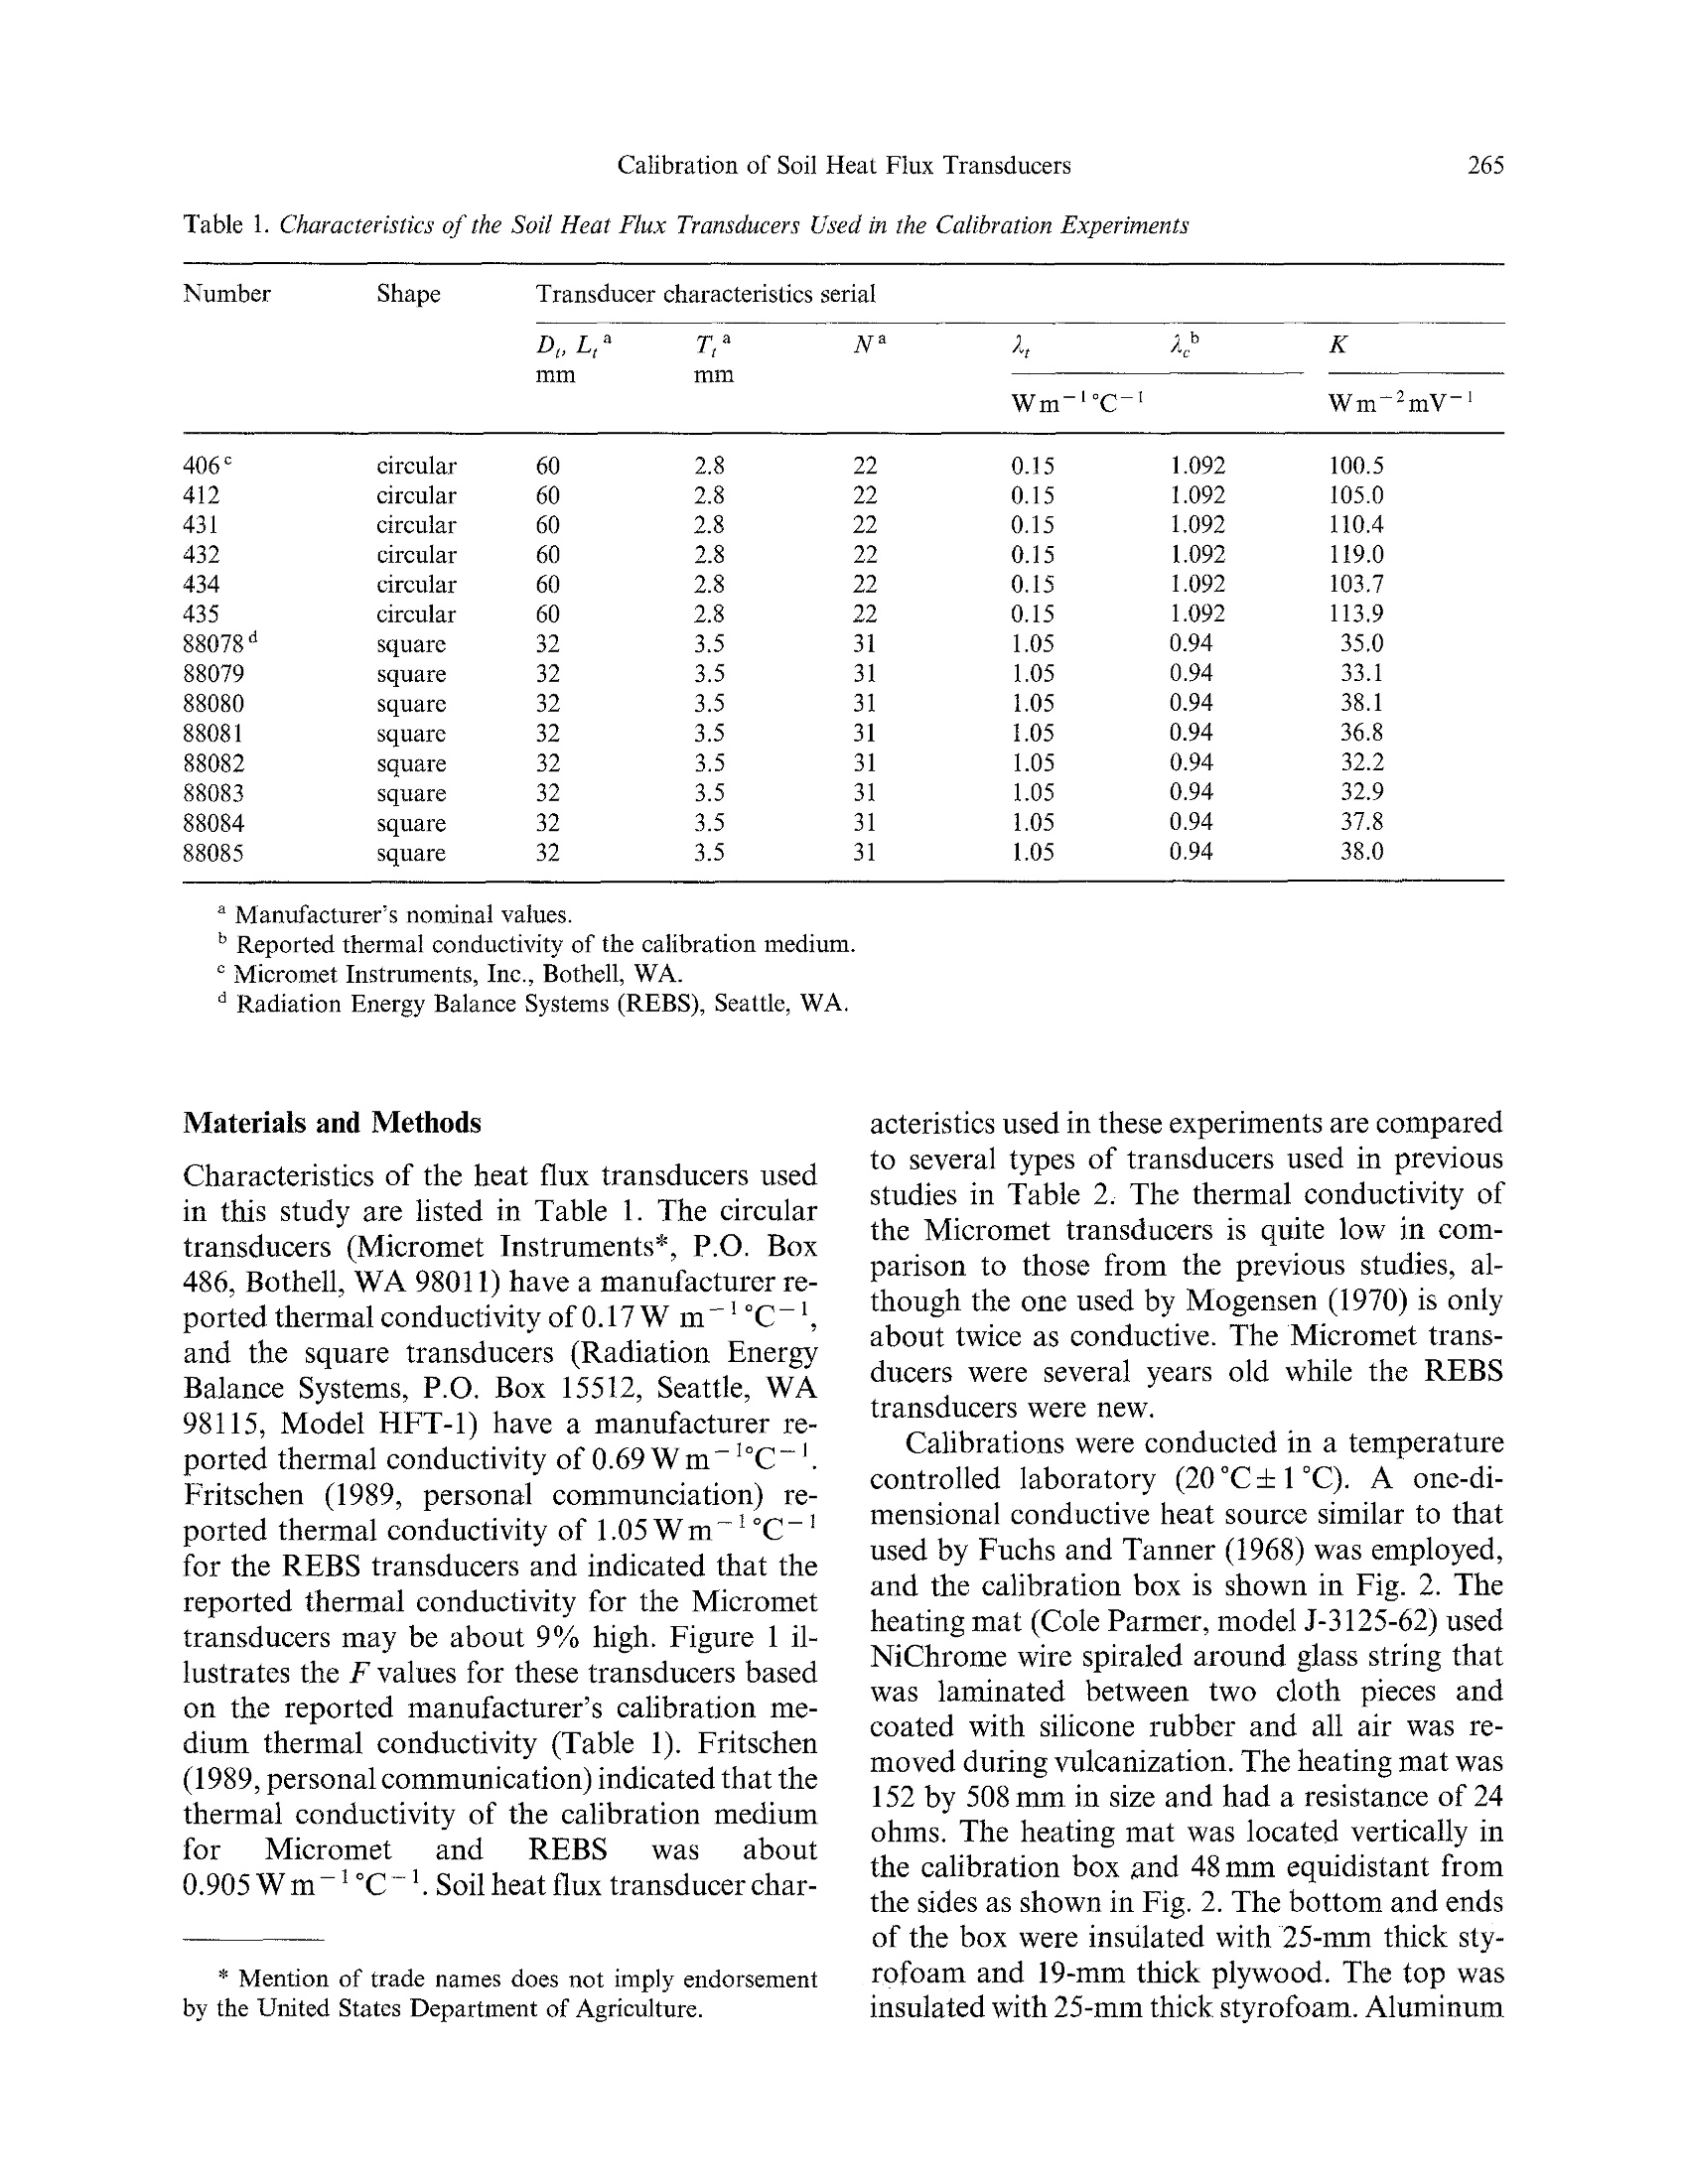
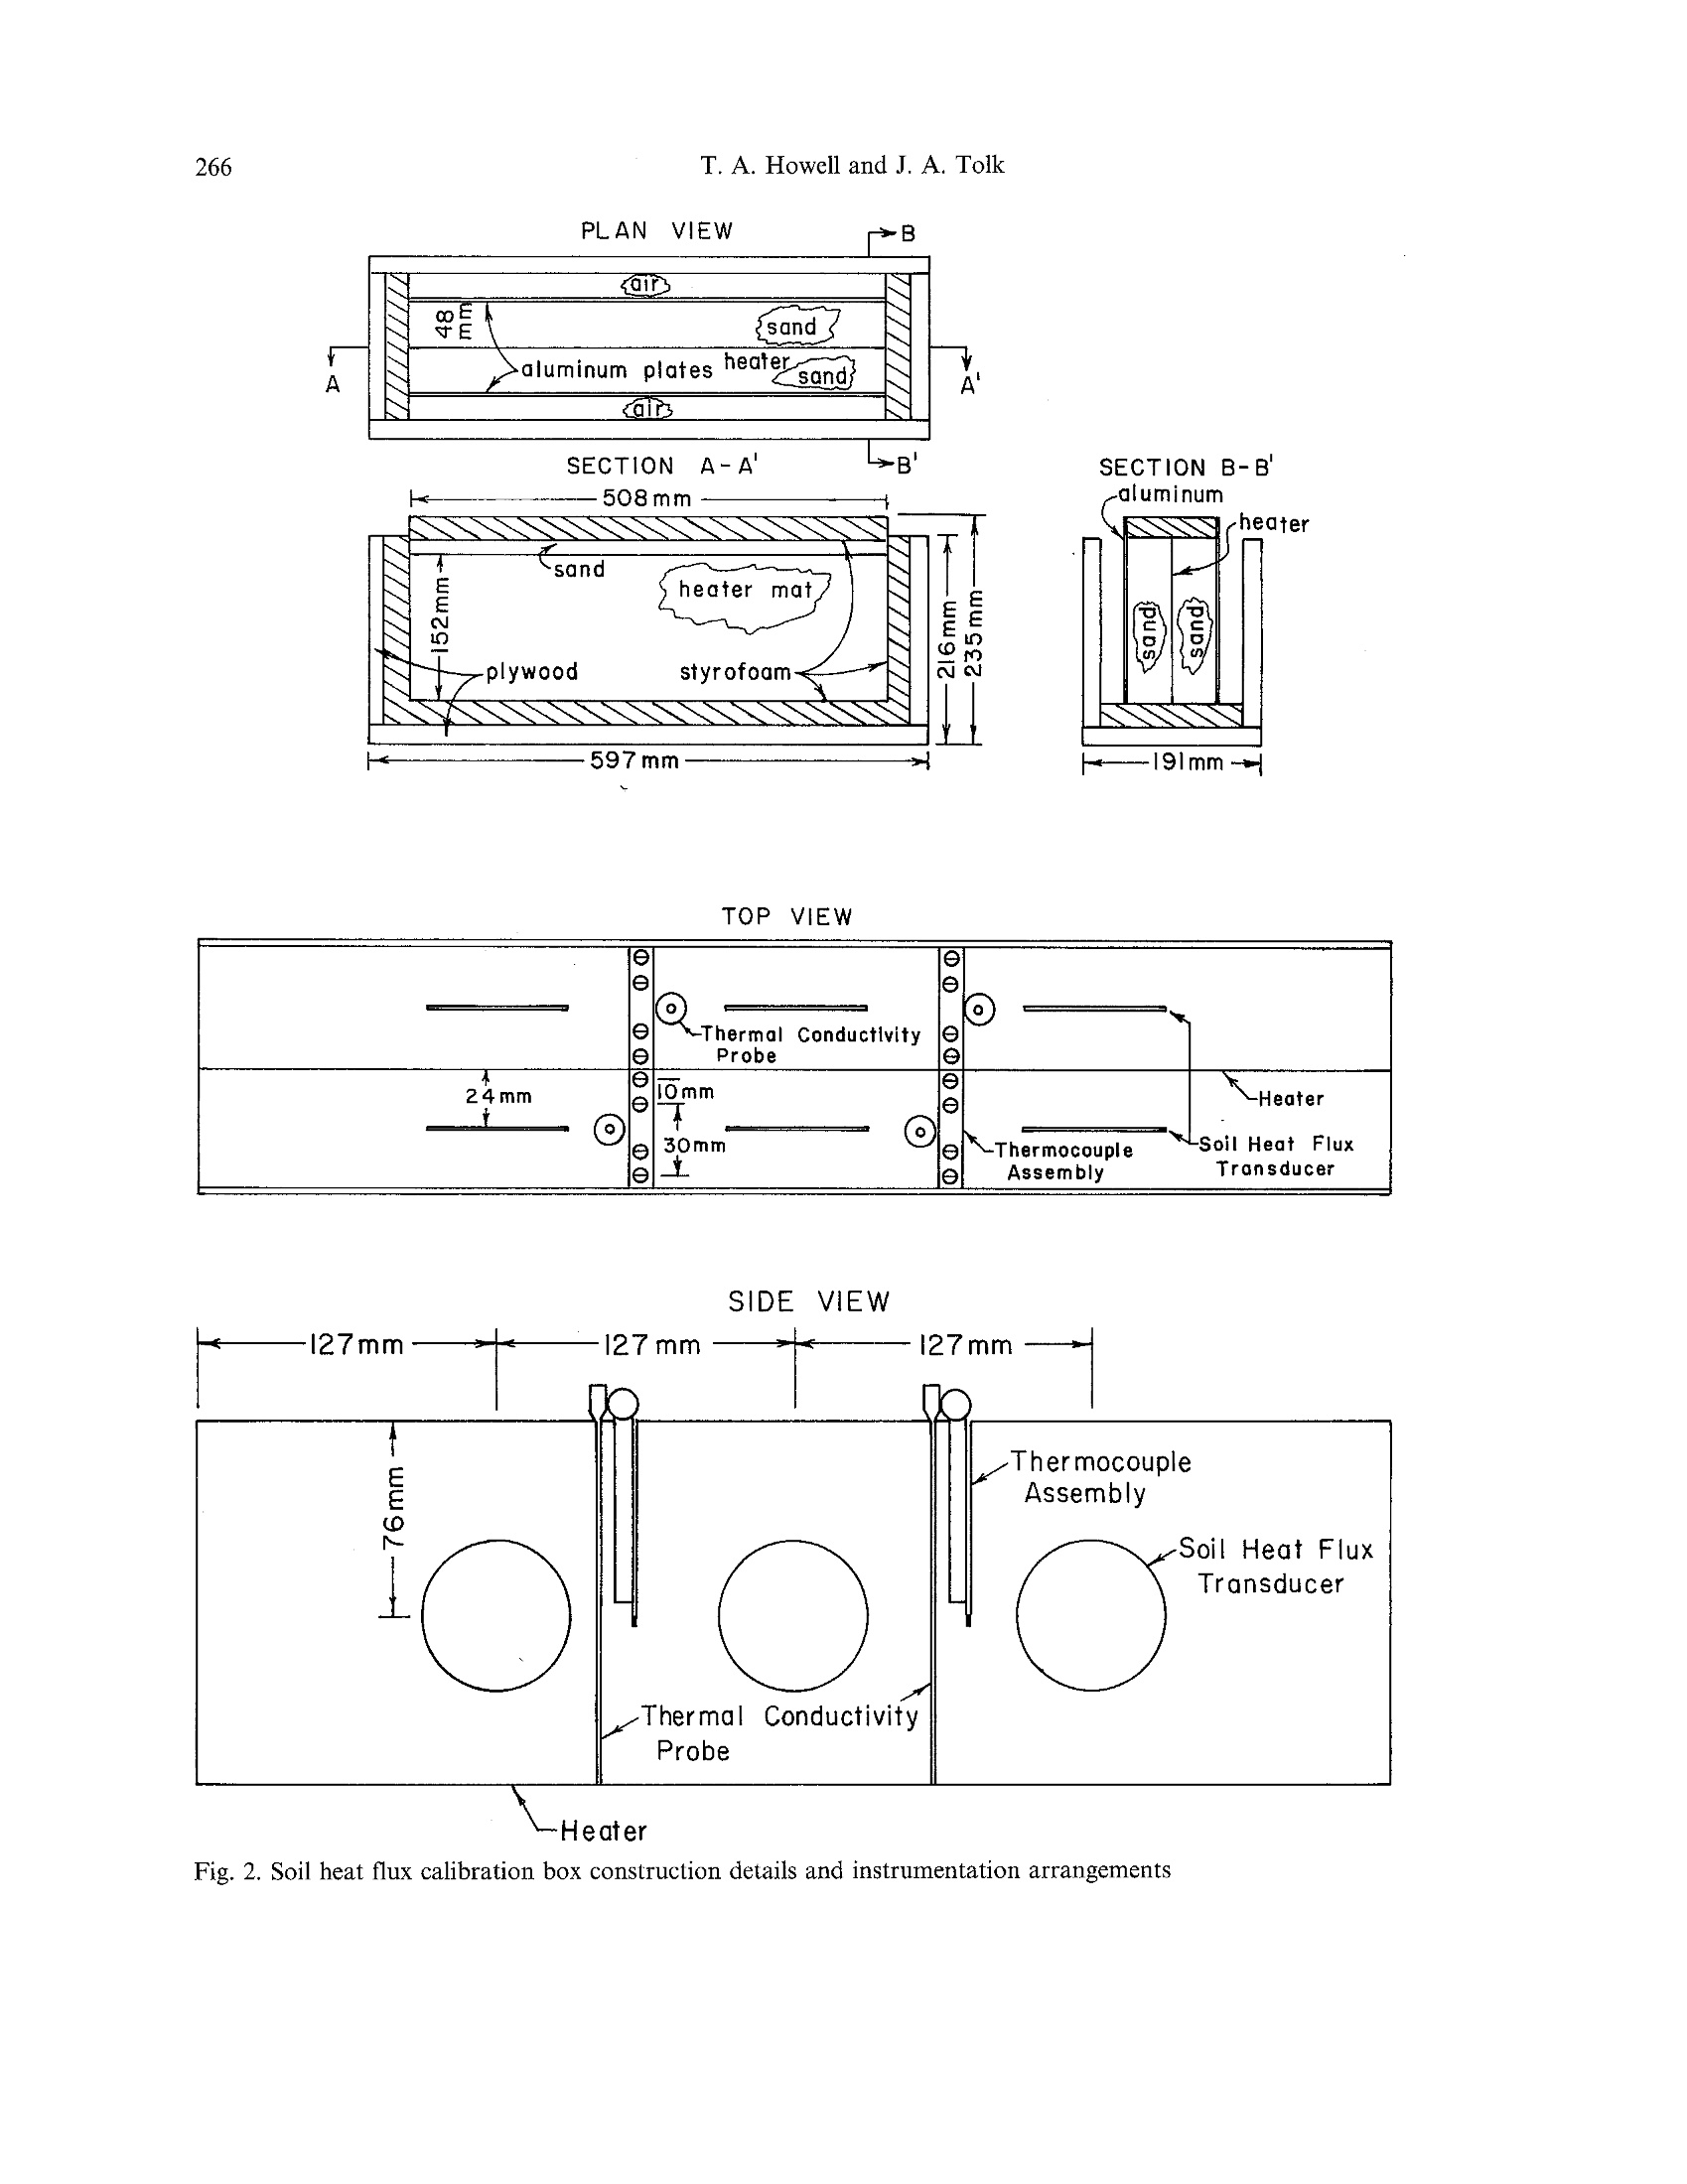
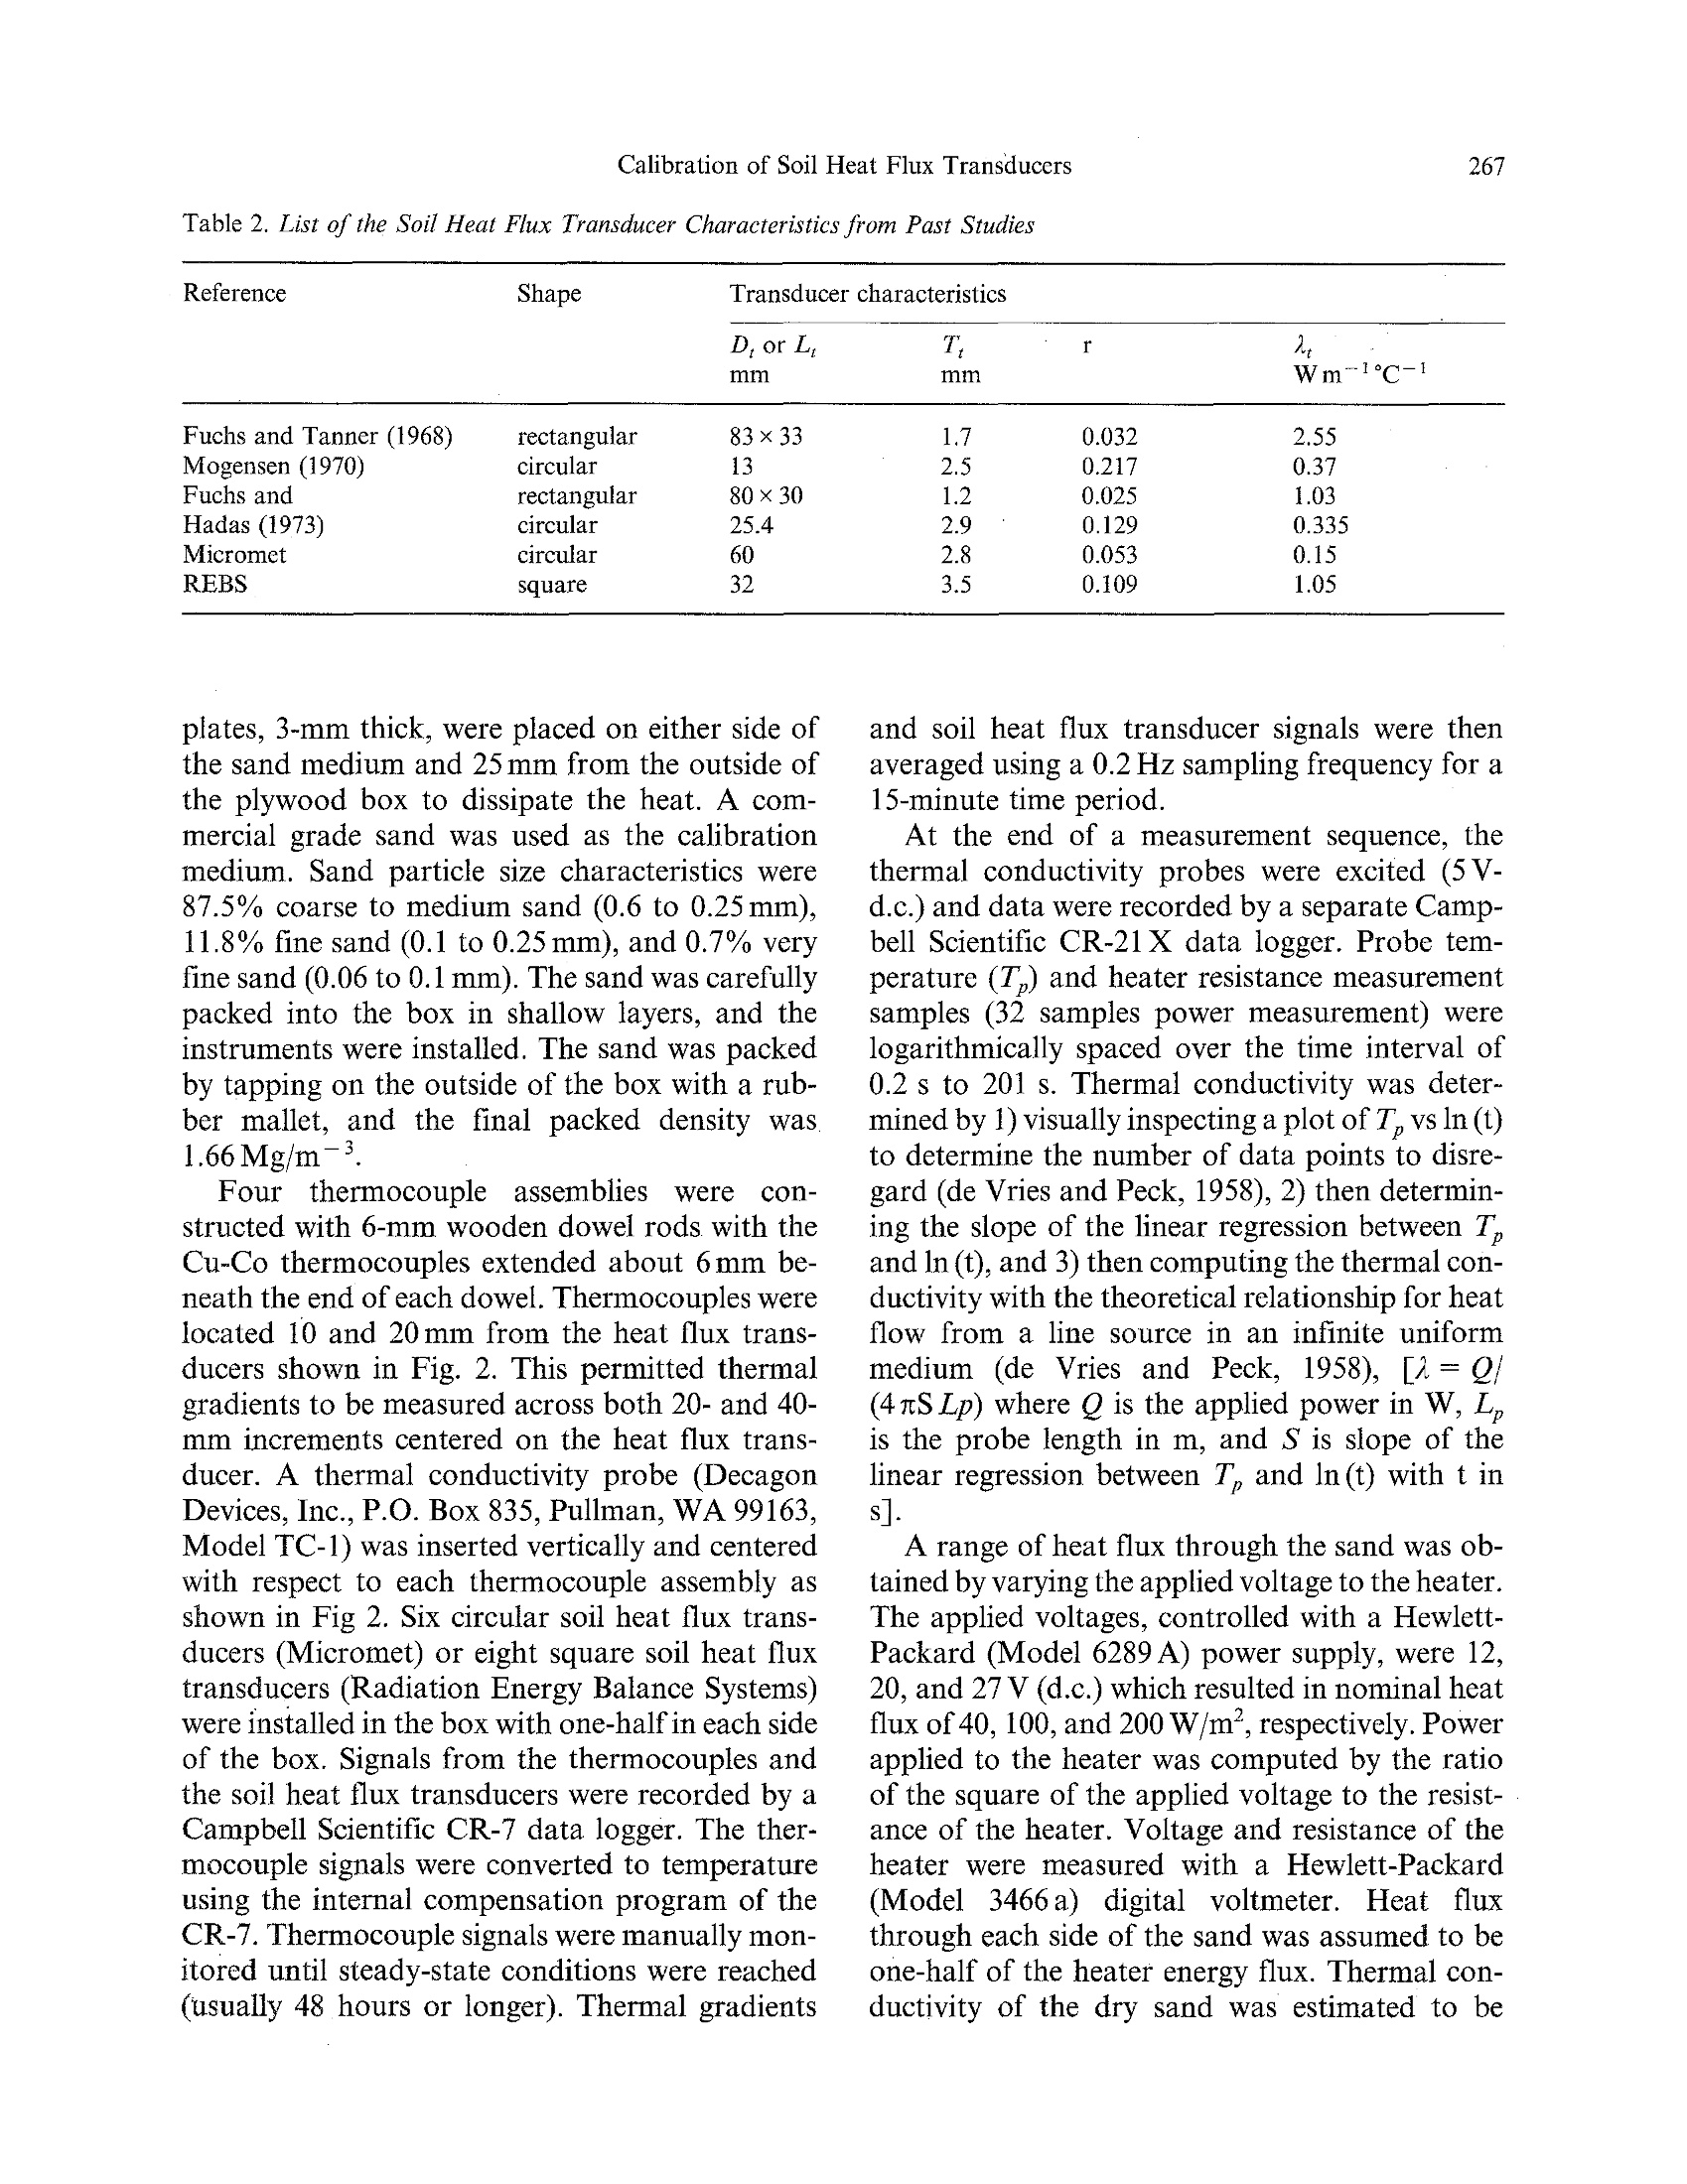
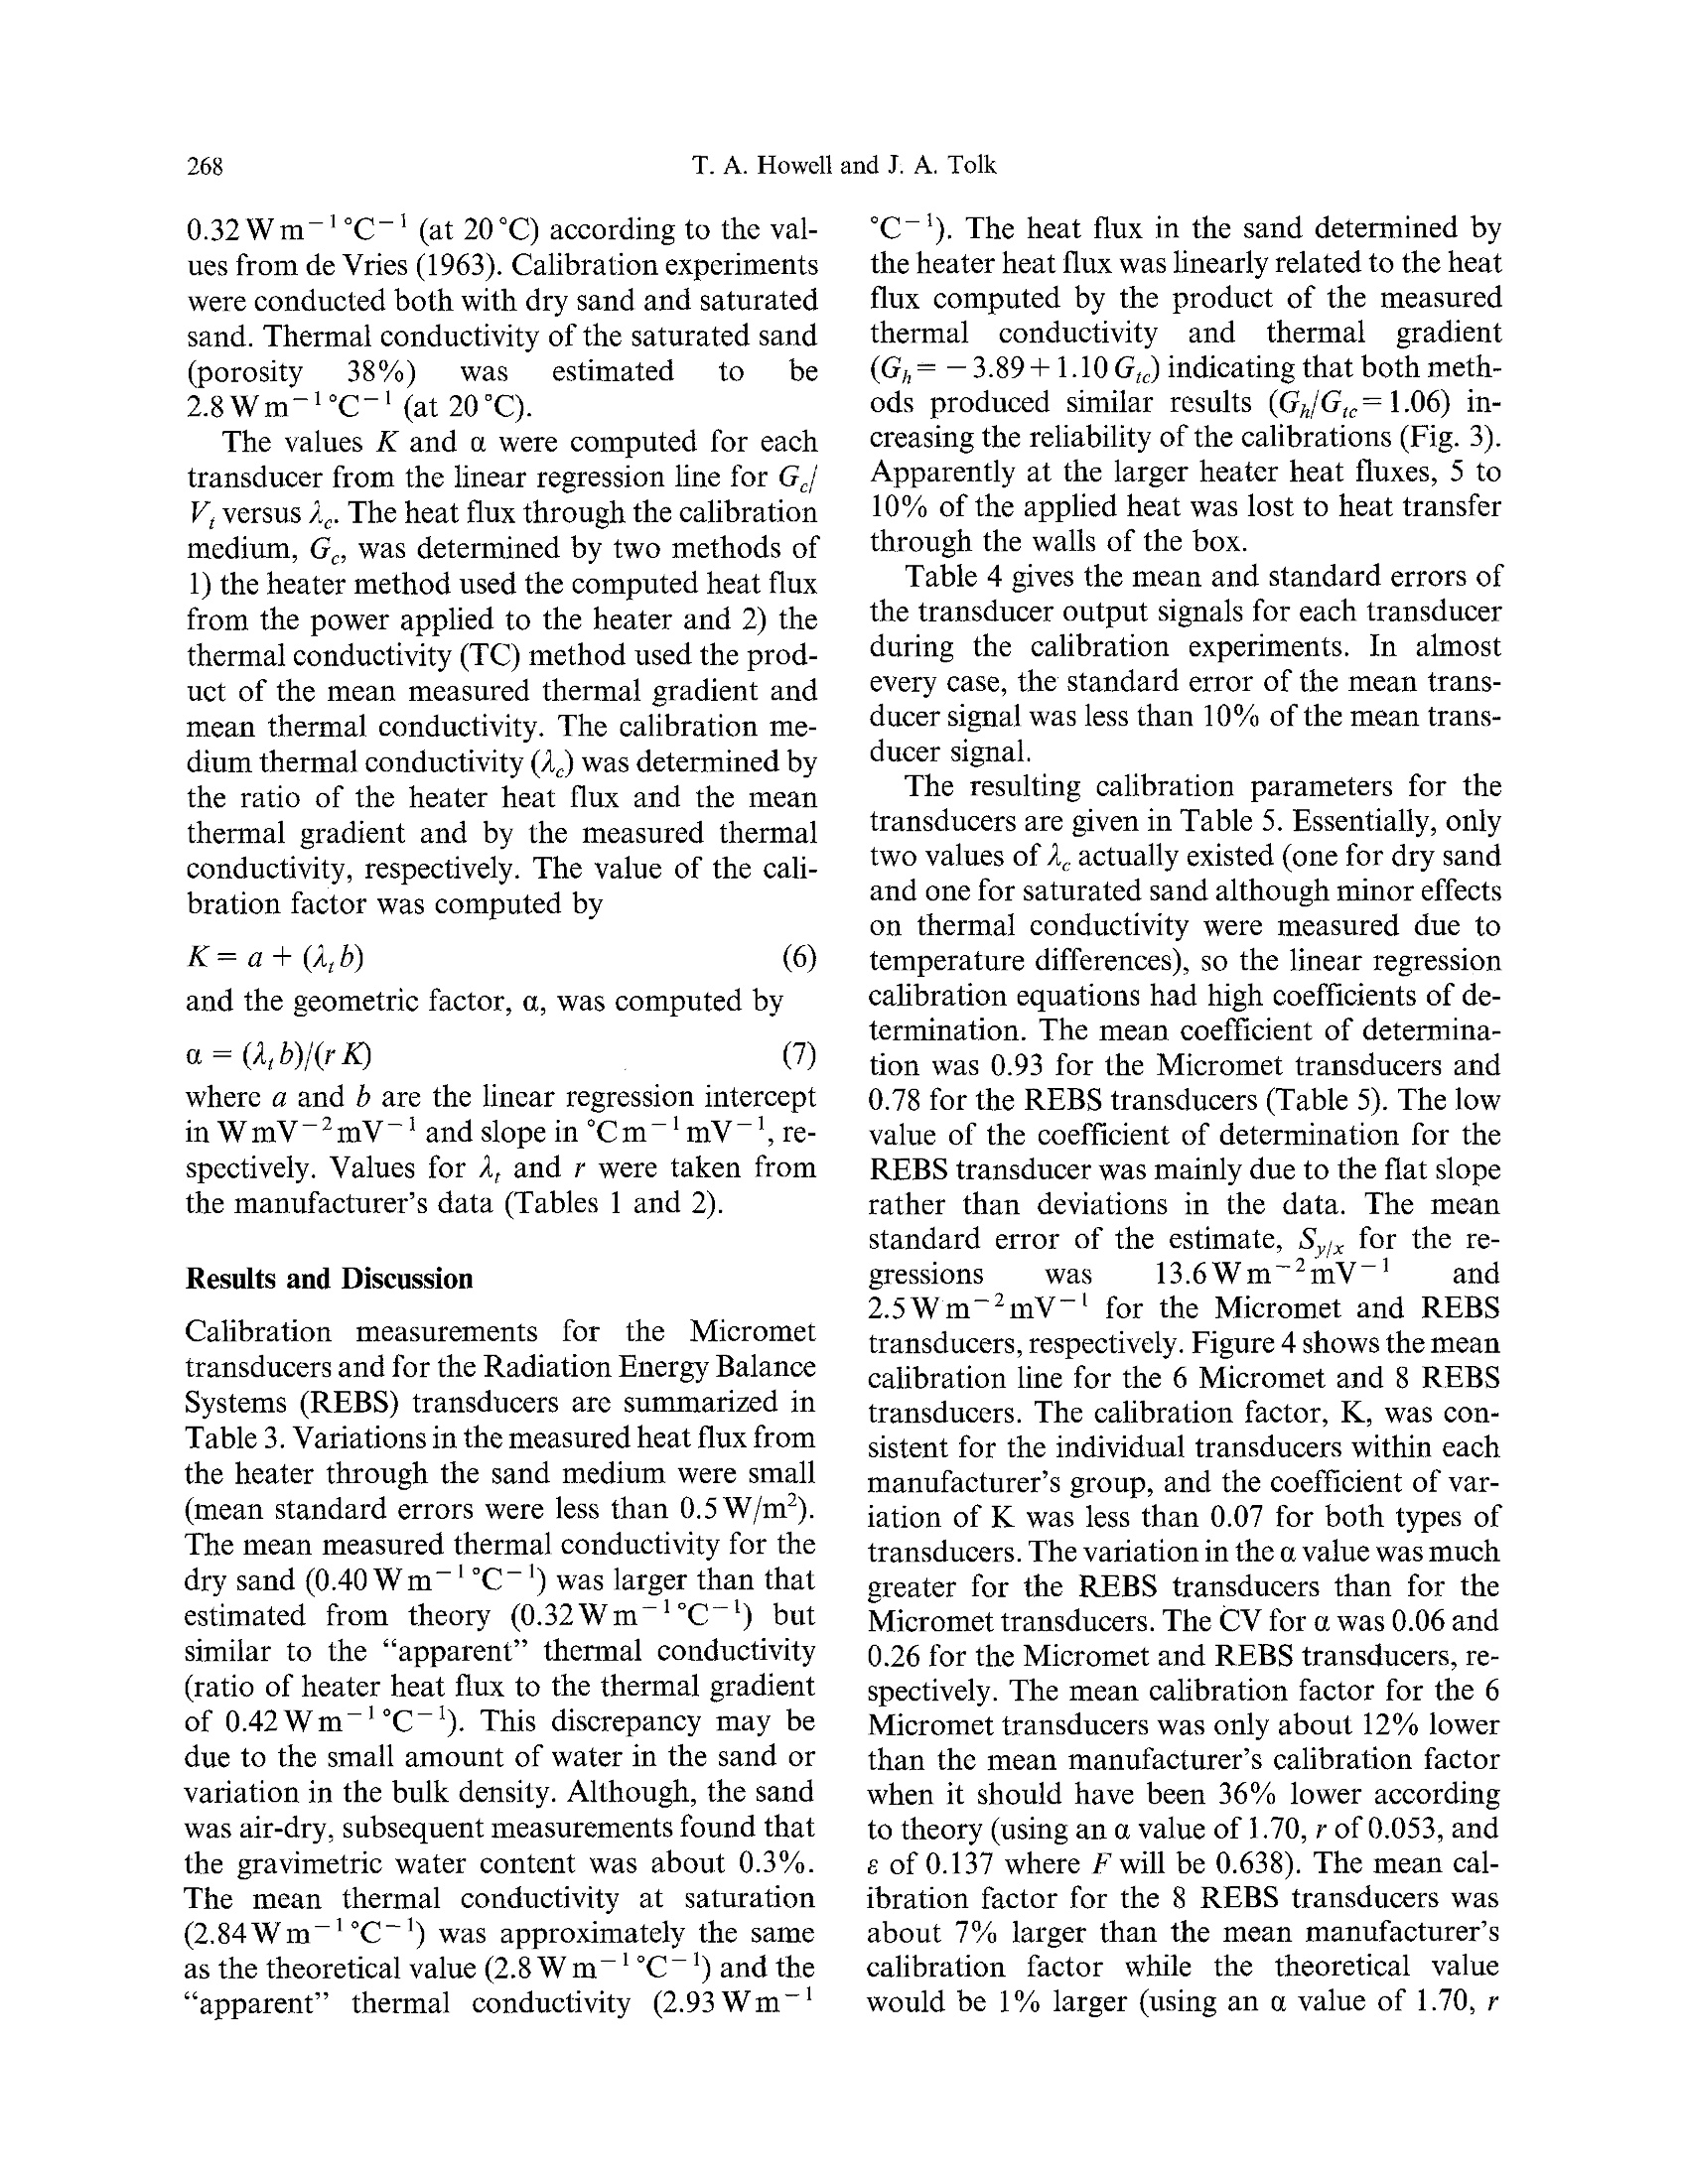
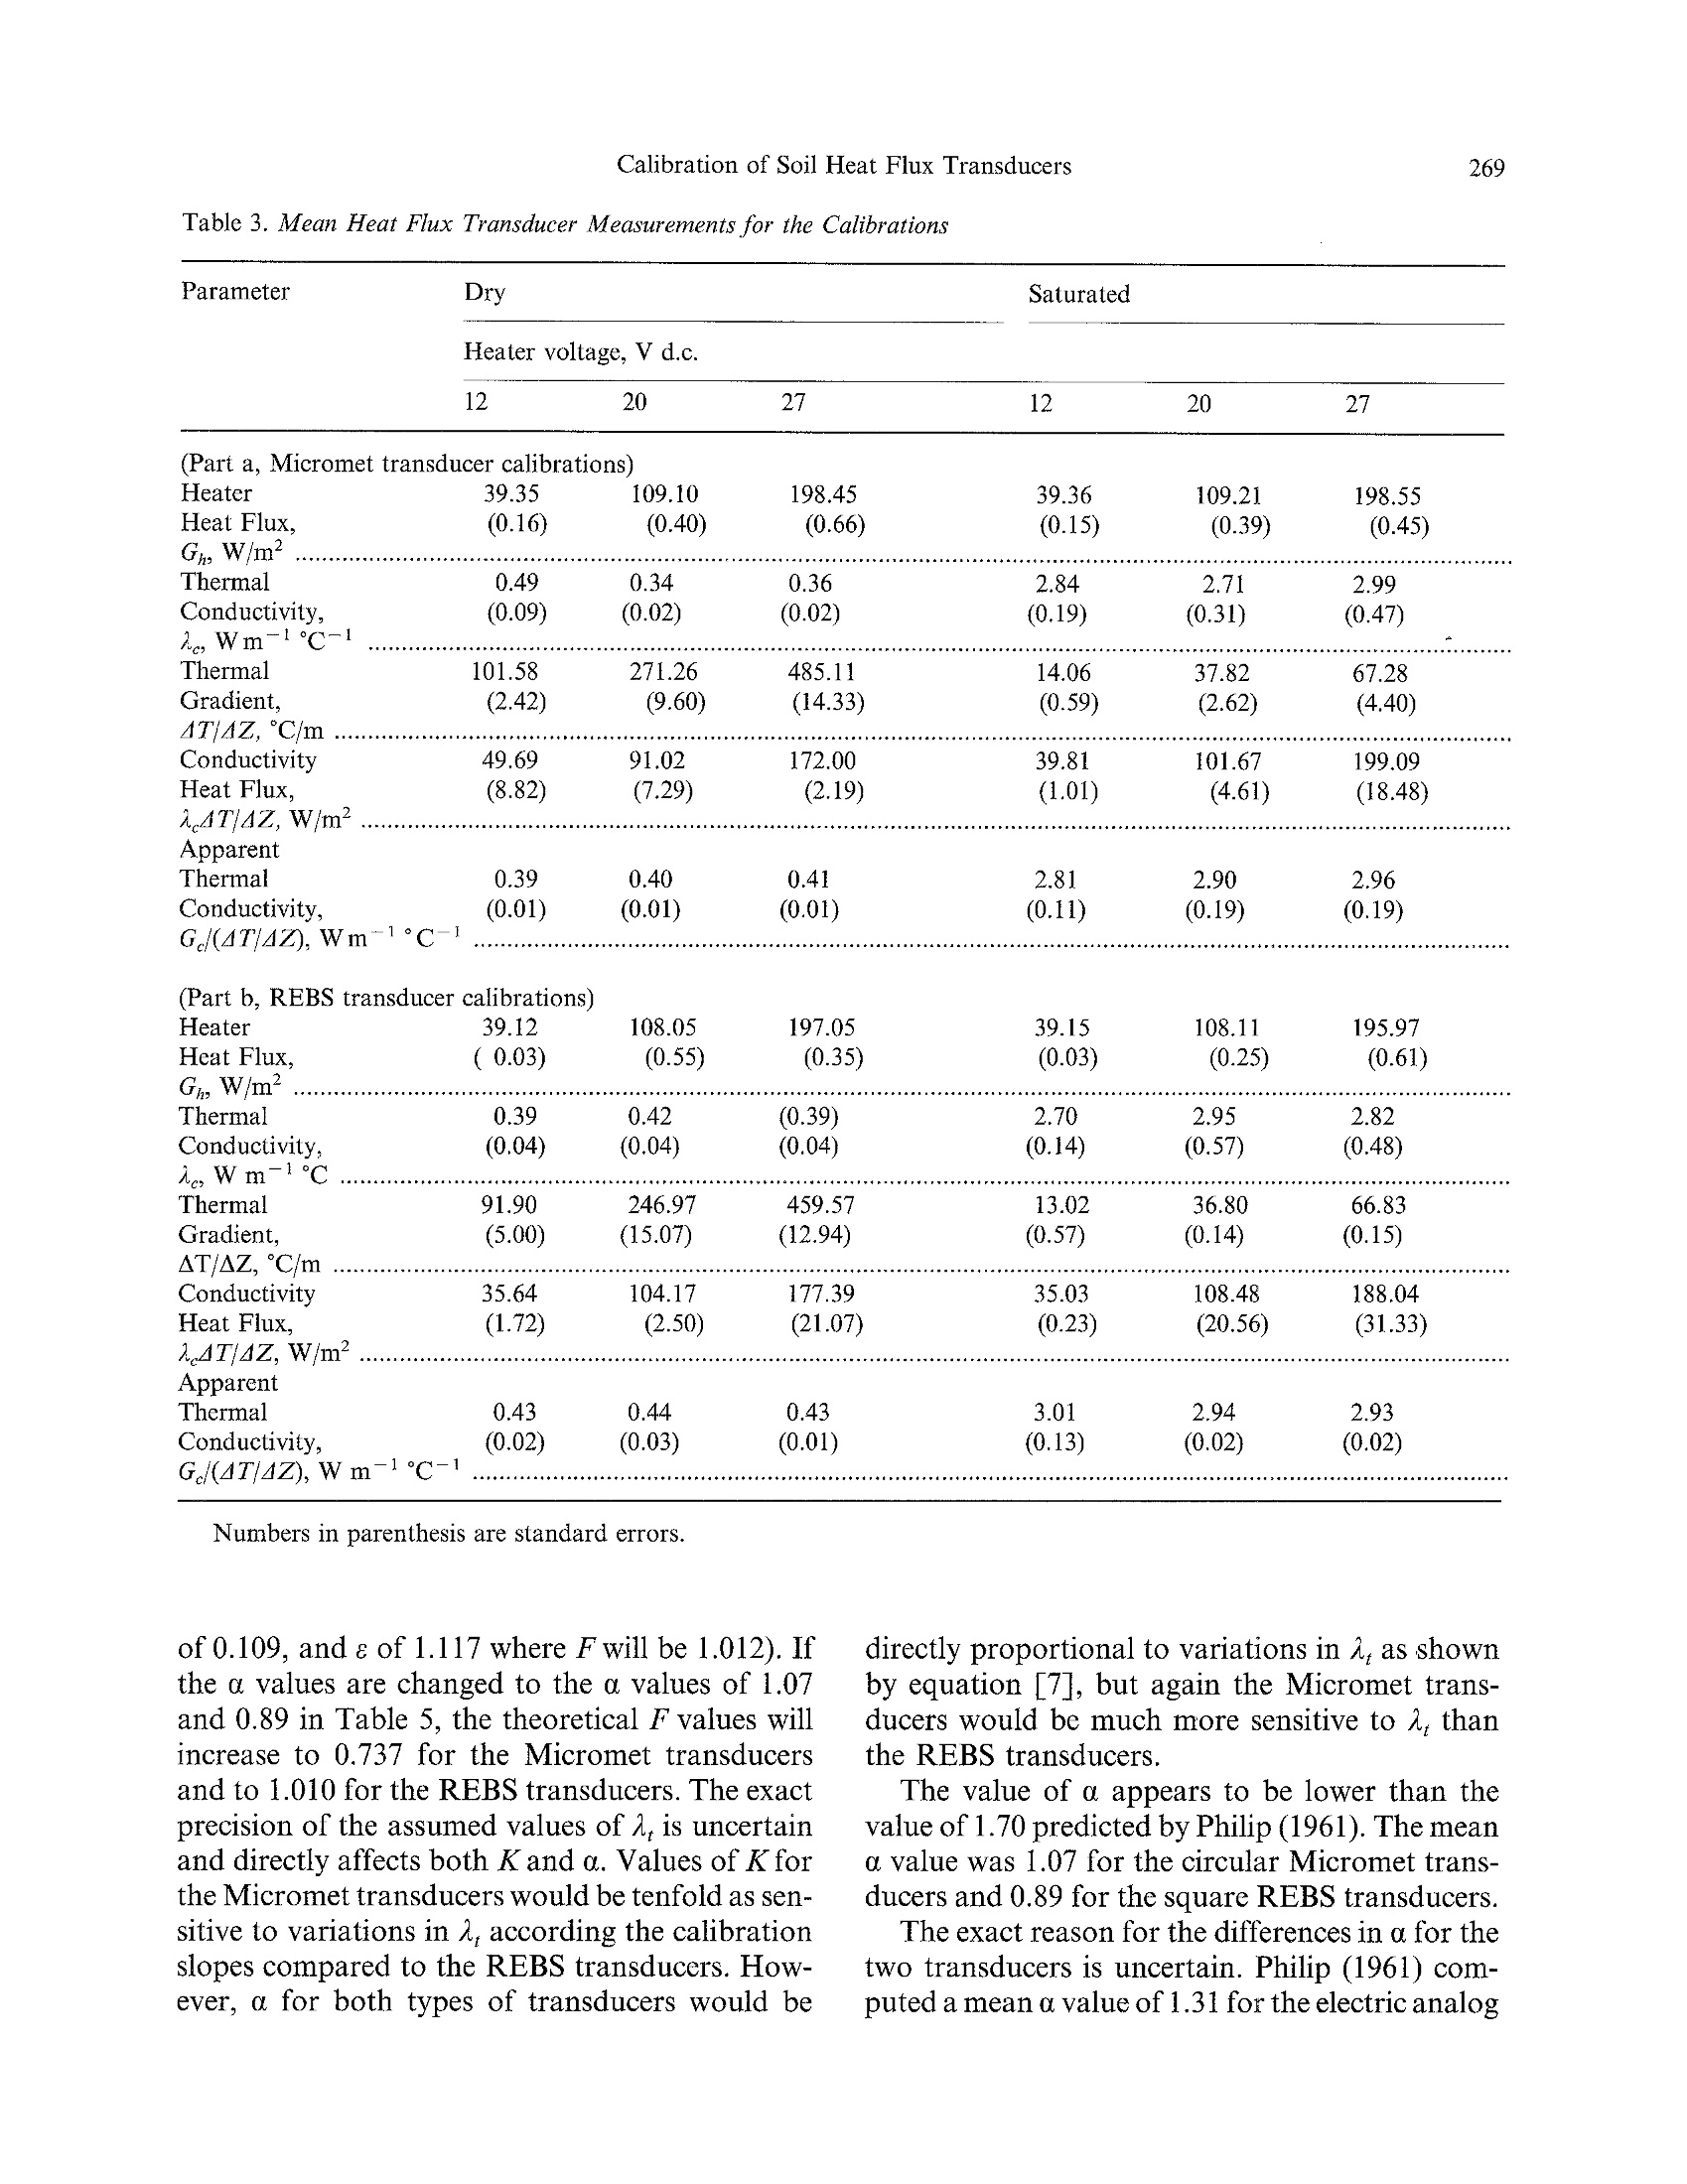
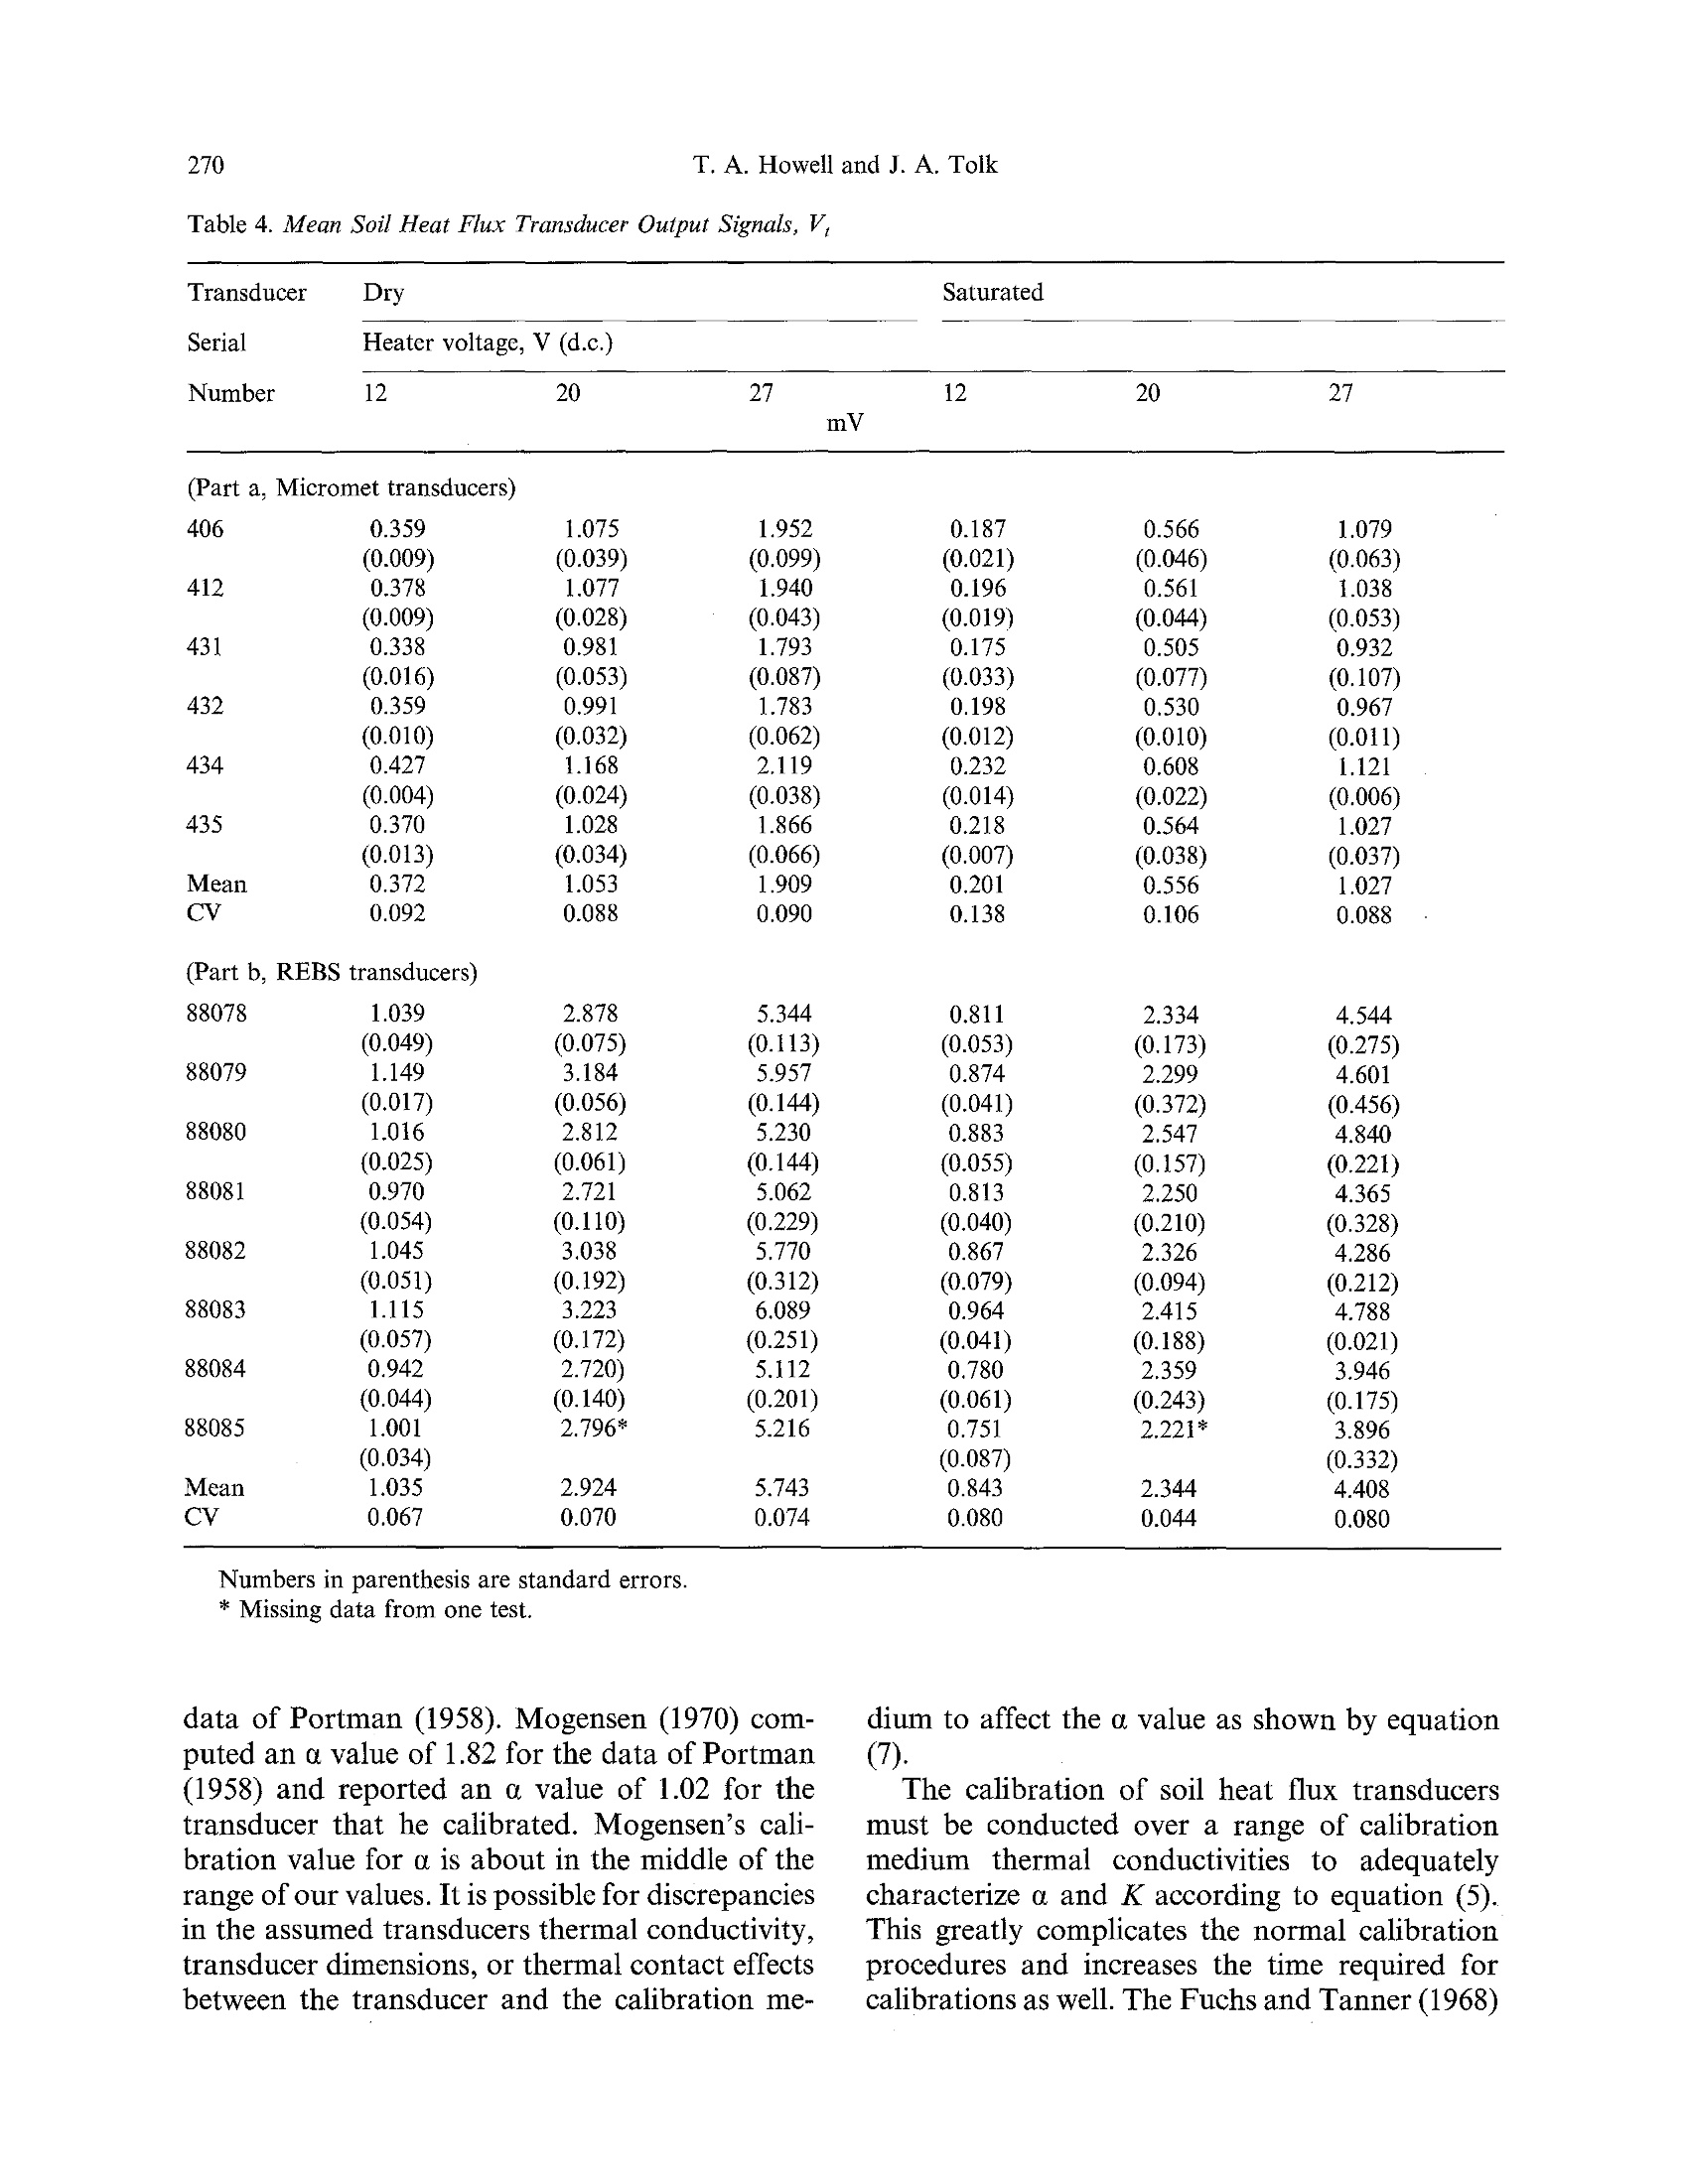
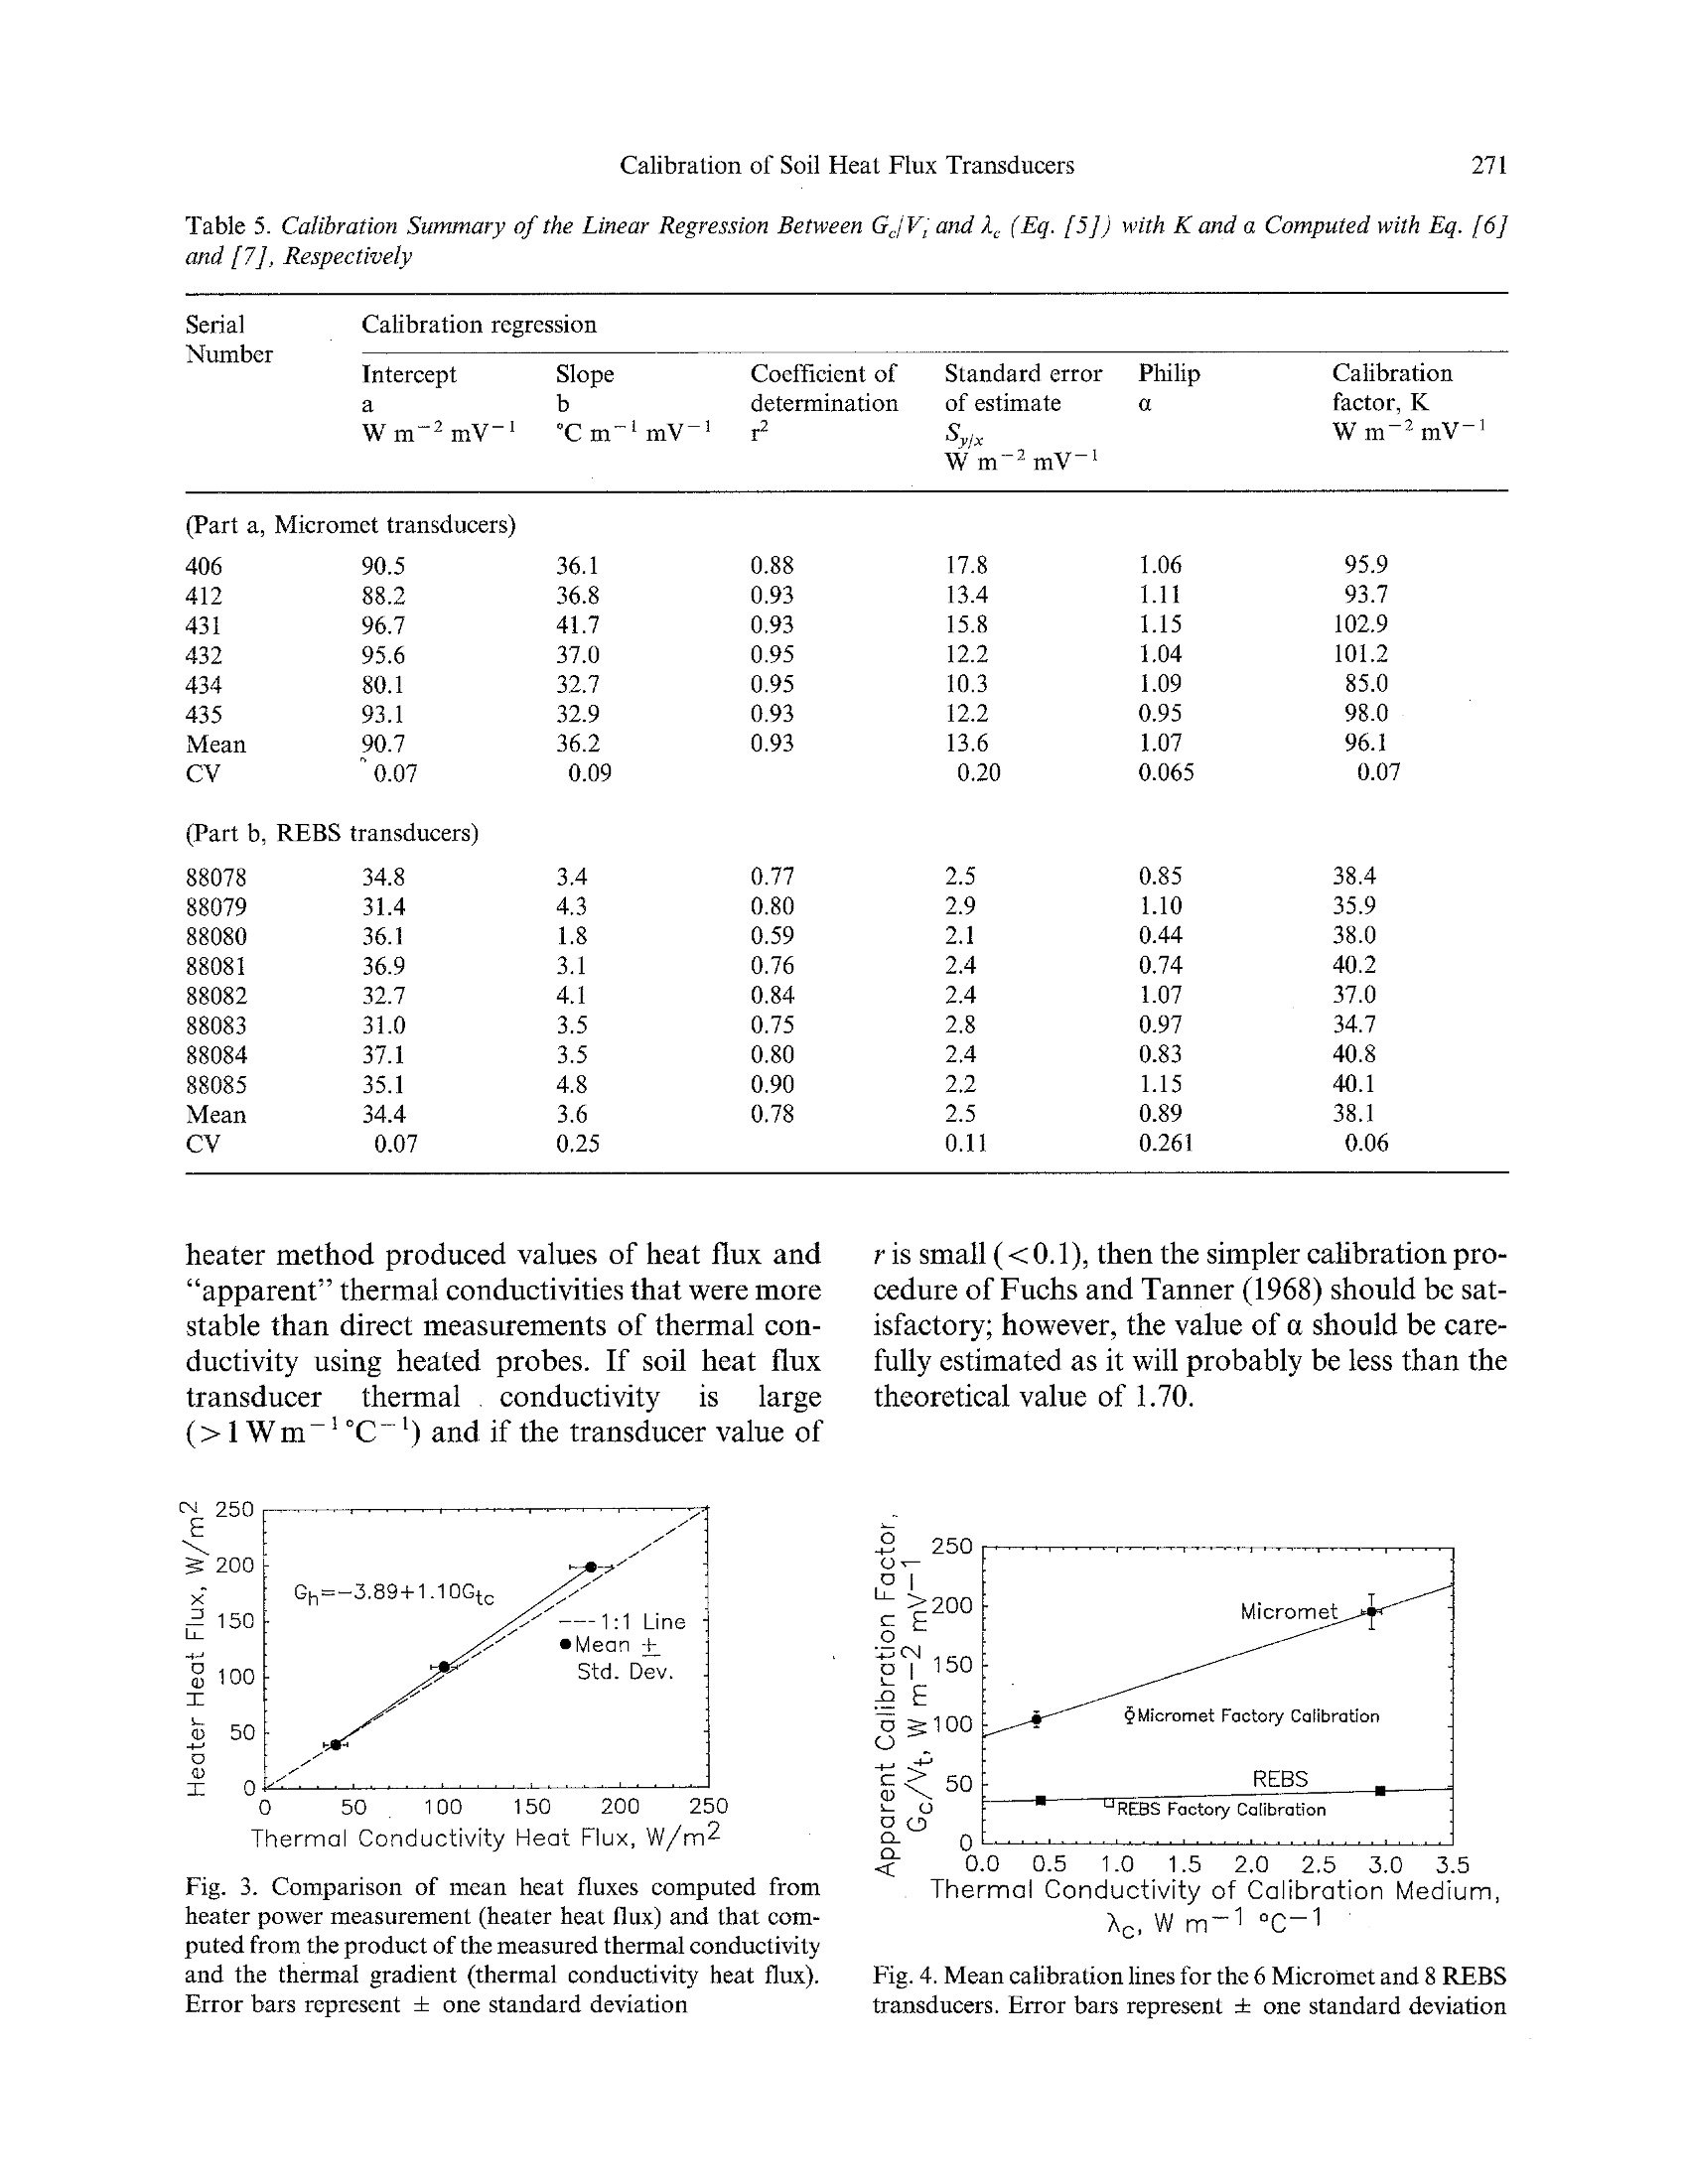
Theor. Appl. Climatol. 42, 263-272 (1990)and AppliedClimatologyC by Springer-Verlag 1990 264T. A. Howell and J. A. Tolk Theoretical 551.508:551.525 USDA-ARS, Conservation and Production Research Laboratory, Bushland, TX, U.S.A. Calibration of Soil Heat Flux Transducers* T. A. Howell and J. A. Tolk Summary Soil heat flux transducer calibration, according to theory, isinfluenced by the thermal conductivity difference between thetransducer and the calibration medium and the geometry ofthe transducer. This study was conducted to compare theinfluence of these parameters on the calibration factors oftwo types of commercial soil heat flux transducers with dif-ferent material thermal conductivities and different geome-tries. A theoretical calibration equation was developed andevaluated. Calibrations of 14 transducers representing twocommercial types were conducted in the laboratory usingsteady-state conductive methods over a range of heat fluxesfrom 40 W/mto 200 W/m. Thecalibration medium was dryand saturated sand with a thermal conductivity varying from0.3 to 3 Wm-1C-1. The mean calibration factor for onetype of transducer was 12% lower than the mean manufac-turer's calibration factor instead of the 26 to 36% lower valuepredicted by theory. The other type of transducer had a meancalibration factor 7% greater than the mean manufacturer’scalibration factor in contrast to the 1 to 11% larger valuepredicted from theory. The computed geometric factors were1.07 and, 0.89 for the circular and square transducers, re-spectively. These factors were less than the theoretical valueof 1.70 for each shape of transducer but similar to experi-mental values of 1.02 to 1.31 from previous studies reportedin the literature. The thermal conductivity of the calibrationmedium and the geometry of the transducer affects the cal-ibration factors of soil heat flux transducers, basically ac-cording to theory. Introduction Vertical flux of heat into the soil is one of thecomponents of the total surface energy balance. ( * Contribution from USDA-Agricultural Research Sery- ice, Southern Plains Area. ) Heat flux in the soil may be small and even neg-ligible when integrated over 24-h cycles (days orweeks), but over shorter time periods (minutes orhours) it is an important part of the partitioningof the total net radiation into the various energybalance components. During night-time, soil heatflux is one of the dominate sources of energy driv-ing the evaporative process. Traditional surfaceenergy balance studies have used methods similarto those described by Tanner (1960) in which soilheat flux is computed by the sum of the heat fluxmeasured at some depth (Z) with soil heat fluxtransducers and the calorimetrically estimatedheat storage in the layer above the transducer (0to Z). Soil heat flux is most often measured using heatflux transducers which are thin plates in which thetemperature difference across the plateis mea-sured with thermopiles (Fritschen and Gay, 1979).Deacon (1950) and Hatfield and Wilkins (1950)described the construction of early soil heat fluxtransducers and cited previous work back to the1930's. Fuchs and Tanner (1968) described theconstruction and calibration of soil heat flux trans-ducers. Fritschen and Gay (1979) described ninemethods (7 conductive and 2 radiative) for cali-brating soil heat flux transducers. Portman (1958) and Philip (1961) investigatedthe effects of transducer geometry (thickness, di-ameter, etc.) and transducer thermal conductivityon the performance of soil heat flux transducersas influenced by the soil thermal conductivity. Philip (1961) emphasized that 1) thin transducerswere desirable,2) thermal conductivity of the cal-ibration medium should equal the arithmetic meanof the extremes of the soil thermal conductivityto which the transducer is intended to be used, 3)thermal conductivity of the transducer materialshould be as large as possible, and 4) real accuracyof soil heat flux transducers was likely limited bythe thermal contact between the transducer andthe soil. Philip (1961) proposed the equation where F is the ratio of the soil heat flux in W/m"going through the transducer (G) to that goingthrough the soil (G), e is the ratio of the transducerthermal conductivity (a) in W m-1C-l to thatof the soil (a) and H is a dimensionless constantthat depends on the transducer geometry and isgiven as where o is a dimensionless geometric constant andris T/[(A)], where T, is the transducer thicknessin m and A. is the transducer area in m’. Philip(1961) proposed that the value of a should be 1.70based on theory but computed a value of 1.31from electrical analog data presented by Portman(1958). Mogensen (1970) reported that o based onhis analysis of Portman’s data should be 1.83, andcomputed an a value of 1.02 for the transducerhe calibrated. Solutions of equations [1] and [2]for a circular heat flux transducer with variousthickness/diameter ratios (TD where Dis trans-ducer diameter in m) and an a value of 1.70 areillustrated in Fig. 1 similar to Fig. 4.1 in Fritschenand Gay (1979). This diagram illustrates the sig-nificant errors associated with soil heat flux mea-surements with 1) thick transducers (large T,/D,ratios) and 2) transducers with low thermal con-ductivities (small ar/1,ratios). The soil heat flux transducer sensitivity (or cal-ibration factor) following Fritschen and Gay(1979) is given as where K is the transducer calibration factor inW m-2mV-1, N is the number of thermoelectricjunctions in the thermopiles, and E is the ther-moelectric potential in mV/C of the thermocouplejunctions. Fuchs and Hadas (1973) described K as Fig. 1. Illustration of the effect of soil heat flux transducergeometry and soil heat transducer thermal conductivity onheat flux divergence around or through a soil heat flux trans-ducer in relation to the thermal conductivity of the soil sur-rounding the soil heat flux transducer. This illustration issimilar to Fig. 4.1 in Fritschen and Gay (1979) and is basedon the theory of Philip (1961) using an a value of 1.70 the “ideal sensitivity". The soil heat flux at themeasurement depth Z is then given as where Gz is soil heat flux in W/m’ and V. is thetransducer analog output signal in mV. We combined these four equations (Eq. 1-4)into the following soil heat flux transducer cali-bration equation given as where G is the heat flux in W/min the calibrationmedium, G/V, is termed the “apparent”calibra-tion factor in W m-mV-,and A, is the thermalconductivity in Wm-1℃- of the calibrationmedium. Equation (5) contains three parameters[K, a, and a] that describe the calibration sen-sitivity of a soil heat flux transducer. If A,, T, andA, are assumed to be known values for each trans-ducer, then unique values of K and a for eachtransducer define its calibration and can be de-termined by linear regression with G/V, as thedependent variable and A. as the independent var-iable. The purposes of this paper are to 1) demon-strate the utility of equation (5) for soil heat fluxtransducer calibrations, 2) to present calibrationresults for two types of commercial soil heat fluxtransducers with different thermal conductivities,and 3) to evaluate the experimental values of ofor the two types of transducer geometry. Table 1. Characteristics of the Soil Heat Flux Transducers Used in the Calibration Experiments Number Shape Transducer characteristics serial D,L T Na K mm mm Wm-1c-I Wm-一mV-1 406° circular 60 2.8 22 0.15 1.092 100.5 412 circular 60 2.8 22 0.15 1.092 105.0 431 circular 60 2.8 22 0.15 1,092 110.4 432 circular 60 2.8 22 0.15 1.092 119.0 434 circular 60 2.8 22 0.15 1.092 103.7 435 circular 60 2.8 22 0.15 1.092 113.9 88078 square 32 3.5 31 1.05 0.94 35.0 88079 square 32 3.5 31 1.05 0.94 33.1 88080 square 32 3.5 31 1.05 0.94 38.1 88081 square 32 3.5 31 1.05 0.94 36.8 88082 square 32 3.5 31 1.05 0.94 32.2 88083 square 32 3.5 31 1.05 0.94 32.9 88084 square 32 3.5 31 1.05 0.94 37.8 88085 square 32 3.5 31 1.05 0.94 38.0 a Manufacturer’s nominal values. Reported thermal conductivity of the calibration medium.°Micromet Instruments, Inc., Bothell, WA. Materials and Methods Characteristics of the heat flux transducers usedin this study are listed in Table 1. The circulartransducers Micromet Instruments*, P.O. Box486, Bothell, WA 98011) have a manufacturer re-ported thermal conductivity of 0.17 W m-℃-1,and the square transducers (Radiation EnergyBalance Systems, P.O. Box 15512, Seattle, WA98115, Model HFT-1) have a manufacturer re-ported thermal conductivity of 0.69 Wm-Ic-l.Fritschen (1989, personal communciation) re-ported thermal conductivity of 1.05 Wm-℃-for the REBS transducers and indicated that thereported thermal conductivity for the Micromettransducers may be about 9% high. Figure 1 il-lustrates the F values for these tra一Of tese talnissduuceers basedon the reported manufacturer’s calibration me-dium thermal conductivity (Table 1). Fritschen(1989, personalcommunication) indicated that thethermal conductivity of the calibration mediumfor Micromet and REBS was about0.905Wm-1°C-1. Soil heat flux transducer char- ( * Mention o f t rade names d oes n ot i mply e ndorsementby t he United S tates Department of Agriculture. ) acteristics used in these experiments are comparedto several types of transducers used in previousstudies in Table 2. The thermal conductivity ofthe Micromet transducers is quite low in com-parison to those from the previous studies, al-though the one used by Mogensen (1970) is onlyabout twice as conductive. The Micromet trans-ducers were several years old while the REBStransducers were new. Calibrations were conducted in a temperaturecontrolled laboratory (20°℃±1℃). A one-di-mensional conductive heat source similar to thatused by Fuchs and Tanner (1968) was employed,and the calibration box is shown in Fig. 2. Theheating mat (Cole Parmer, model J-3125-62) usedNiChrome wire spiraled around glass string thatwas laminated between two cloth piecesandcoated with silicone rubber and all air was re-moved during vulcanization.The heating mat was152 by 508 mm in size and had a resistance of 24ohms. The heating mat was located vertically inthe calibration box and 48mm equidistant fromthe sides as shown in Fig. 2. The bottom and endsof the box were insulated with 25-mm thick sty-rofoam and 19-mm thick plywood. The top wasinsulated with 25-mm thick styrofoam.Aluminum TOPVIEW SIDE VIEW -Heater Fig. 2. Soil heat flux calibration box construction details and instrumentation arrangements Table 2. List of the Soil Heat Flux Transducer Characteristics from Past Studies Reference Shape Transducer characteristics D, or L T r mm mm Wm-1c-1 Fuchs and Tanner (1968) rectangular 83×33 1.7 0.032 2.55 Mogensen (1970) circular 13 2.5 0.217 0.37 Fuchs and rectangular 80 ×30 1.2 0.025 1.03 Hadas (1973) circular 25.4 2.9 0.129 0.335 Micromet circular 60 2.8 0.053 0.15 REBS square 32 3.5 0.109 1.05 plates, 3-mm thick, were placed on either side ofthe sand medium and 25 mm from the outside ofthe plywood box to dissipate the heat. A com-mercial grade sand was used as the calibrationmedium. Sand particle size characteristics were87.5% coarse to medium sand (0.6 to 0.25mm),11.8% fine sand (0.1 to 0.25mm), and 0.7% veryfine sand (0.06 to 0.1 mm). The sand was carefullypacked into the box in shallow layers, and theinstruments were installed. The sand was packedby tapping on the outside of the box with a rub-ber mallet, and the final packed density was-31.66Mg/m- Four thermocouple assemblieswere3con-structed with 6-mm wooden dowel rods with theCu-Co thermocouples extended about 6mm be-neath the end of each dowel. Thermocouples werelocated 10 and 20mm from the heat flux trans-ducers shown in Fig. 2. This permitted thermalgradients to be measured across both 20- and 40-mm increments centered on the heat flux trans-ducer. A thermal conductivity probe (DecagonDevices, Inc., P.O. Box 835, Pullman, WA 99163,Model TC-1) was inserted vertically and centeredwith respect to each thermocouple assembly asshown in Fig 2. Six circular soil heat flux trans-ducers (Micromet) or eight square soil heat fluxtransducers (Radiation Energy Balance Systems)were installed in the box with one-half in each sideof the box. Signals from the thermocouples andthe soil heat flux transducers were recorded by aCampbell Scientific CR-7 data logger. The ther-mocouple signals were converted to temperatureusing the internal compensation program of theCR-7. Thermocouple signals were manually mon-itored until steady-state conditions were reached(usually 48 hours or longer). Thermal gradients and soil heat flux transducer signals were thenaveraged using a 0.2 Hz sampling frequency for a15-minute time period. At the end of a measurement sequence, thethermal conductivity probes were excited (5V-d.c.) and data were recorded by a separate Camp-bell Scientific CR-21X data logger. Probe tem-perature(T,) and heater resistance measurementsamples (32 samples power measurement) werelogarithmically spaced over the time interval of0.2 s to 201 s. Thermal conductivity was deter-mined by 1) visually inspecting a plot of T, vs ln (t)to determine the number of data points to disre-gard (de Vries and Peck, 1958), 2) then determin-ing the slope of the linear regression between T,and ln (t), and 3) then computing the thermal con-ductivity with the theoretical relationship for heatflow from a line source in an infinite uniformmedium (de Vries and Peck, 1958),[a=Q/(4nSLp) where g is the applied power in W, L,is the probe length in m, and S is slope of thelinear regression between T, and ln (t) with t ins. A range of heat flux through the sand was ob-tained by varying the applied voltage to the heater.The applied voltages, controlled with a Hewlett-Packard (Model 6289A) power supply, were 12,20, and 27 V(d.c.) which resulted in nominal heatflux of 40, 100, and 200 W/m, respectively. Powerapplied to the heater was computed by the ratioof the square of the applied voltage to the resist-ance of the heater. Voltage and resistance of theheater were measured with a Hewlett-Packard(Model 3466a) digital voltmeter.Heatifluxthrough each side of the sand was assumed to beone-half of the heater energy flux. Thermal con-ductivity of the dry sand was estimated to be 0.32Wm-1℃-(at 20℃) according to the val-ues from de Vries (1963). Calibration experimentswere conducted both with dry sand and saturatedsand. Thermal conductivity of the saturated sand(porosity38%) was estimated to be2.8 Wm-1c-1 (at 20℃). The values K and a were computed for eachtransducer from the linear regression line for G/V versus A. The heat flux through the calibrationmedium, G, was determined by two methods of1) the heater method used the computed heat fluxfrom the power applied to the heater and 2) thethermal conductivity (TC) method used the prod-uct of the mean measured thermal gradient andmean thermal conductivity. The calibration me-dium thermal conductivity (a) was determined bythe ratio of the heater heat flux and the meanthermal gradient and by the measured thermalconductivity, respectively. The value of the cali-bration factor was computed by and the geometric factor, a, was computed by where a and b are the linear regression interceptin WmV-2mV-1and slope in ℃m-mV-1,respectively. Values for A, and r were taken fromthe manufacturer’s data (Tables 1 and 2). Results and Discussion Calibration measurements for theMicromettransducers and for the Radiation Energy BalanceSystems (REBS) transducers are summarized inTable 3. Variations in the measured heat flux fromthe heater through the sand medium were small(mean standard errors were less than 0.5 W/m).The mean measured thermal conductivity for thedry sand (0.40Wm-℃-) was larger than thatestimated from theory (0.32Wm-℃-l) butsimilar to the “apparent”thermal conductivity(ratio of heater heat flux to the thermal gradientof 0.42 Wm-℃-). This discrepancy may bedue to the small amount of water in the sand orvariation in the bulk density. Although, the sandwas air-dry, subsequent measurements found thatthe gravimetric water content was about 0.3%.The mean thermal conductivity at saturation(2.84Wm-1℃-l) was approximately the sameas the theoretical value (2.8Wm-1℃-l) and the“apparent” thermal conductivity (2.93Wm C-). The heat flux in the sand determined bythe heater heat flux was linearly related to the heatflux computed by the product of the measuredthermal conductivity andthermal1gradient(G=-3.89+1.10G)indicating that both meth-ods produced similar results (G,/Grc=1.06) in-creasing the reliability of the calibrations (Fig.3).Apparently at the larger heater heat fluxes, 5 to10% of the applied heat was lost to heat transferthrough the walls of the box. Table 4 gives the mean and standard errors ofthe transducer output signals for each transducerduring the calibration experiments. In almostevery case, the standard error of the mean trans-ducer signal was less than 10% of the mean trans-ducer signal. The resulting calibration parameters for thetransducers are given in Table 5. Essentially, onlytwo values of Aactually existed (one for dry sandand one for saturated sand although minor effectson thermal conductivity were measured due totemperature differences), so the linear regressioncalibration equations had high coefficients of de-termination. The mean coefficient of determina-wastion was 0.93 for the Micromet transducers and0.78 for the REBS transducers (Table 5).The lowvalue of the coefficient of determination for theREBS transducer was mainly due to the flat sloperather than deviations in the data. The meanstandard error of the estimate, Syx for the re-gressions was 13.6Wm~mV-i and2.5Wm-2mV- for the Micromet and REBStransducers, respectively. Figure 4 shows the meancalibration line for the 6 Micromet and 8 REBStransducers. The calibration factor, K, was con-sistent for the individual transducers within eachmanufacturer’s group, and the coefficient of var-iation of K was less than 0.07 for both types oftransducers. The variation in the a value was muchgreater for the REBS transducers than for theMicromet transducers. The CV for a was 0.06 and0.26 for the Micromet and REBS transducers, re-spectively. The mean calibration factor for the 6Micromet transducers was only about 12% lowerthan the mean manufacturer's calibration factorwhen it should have been 36% lower accordingto theory (using an a value of 1.70, r of 0.053, and of 0.137 where F will be 0.638). The mean cal-ibration factor for the 8 REBS transducers wasabout 7% larger than the mean manufacturer’scalibration factor while the theoretical valuewould be 1% larger (using an a value of 1.70, r Table 3. Mean Heat Flux Transducer Measurements for the Calibrations of 0.109, and : of 1.117 where F will be 1.012). Ifthe a values are changed to the a values of 1.07and 0.89 in Table 5, the theoretical F values willincrease to 0.737 for the Micromet transducersand to 1.010 for the REBS transducers.The exactprecision of the assumed values of a, is uncertainand directly affects both Kand a.Values of K forthe Micromet transducers would be tenfold as sen-sitive to variations in a, according the calibrationslopes compared to the REBS transducers. How-ever, a for both types of transducers would be directly proportional to variations in A, as shownby equation [7], but again the Micromet trans-ducers would be much more sensitive to A, thanthe REBS transducers. The value of a appears to be lower than thevalue of 1.70 predicted by Philip(1961). The meana value was 1.07 for the circular Micromet trans-ducers and 0.89 for the square REBS transducers. The exact reason for the differences in o for thetwo transducers is uncertain. Philip (1961) com-puted a mean a value of 1.31 for the electric analog Table 4. Mean Soil Heat Flux Transducer Output Signals, V. Transducer Dry Saturated Numbers in parenthesis are standard errors. * Missing data from one test. data of Portman (1958). Mogensen (1970) com-puted an a value of 1.82 for the data of Portman(1958) and reported an a value of 1.02 for thetransducer that he calibrated. Mogensen’s cali-bration value for a is about in the middle of therange of our values. It is possible for discrepanciesin the assumed transducers thermal conductivity,transducer dimensions, or thermal contact effectsbetween the transducer and the calibration me- dium to affect the a value as shown by equation(7). The calibration of soil heat flux transducersmust be conducted over a range of calibrationmedium thermal conductivities to adequatelycharacterize a and K according to equation (5).This greatly complicates the normal calibrationprocedures and increases the time required forcalibrations as well.The Fuchs and Tanner (1968) Table 5. Calibration Summary of the Linear Regression Between G/V, and 1(Eq.[5]) with K and a Computed with Eq. [6]and [7], Respectively Serial Calibration regression Number Intercept Slope Coefficient of Standard error Philip Calibration a determination of estimate 0 factor, K Wm-2mV-1 -1 'Cm-mV- r Sy/x Wm-2mV-1 wm-²mV-1 (Part a, Micromet transducers) 406 90.5 36.1 0.88 17.8 1.06 95.9 412 88.2 36.8 0.93 13.4 1.11 93.7 431 96.7 41.7 0.93 15.8 1.15 102.9 432 95.6 37.0 0.95 12.2 1.04 101.2 434 80.1 32.7 0.95 10.3 1.09 85.0 435 93.1 32.9 0.93 12.2 0.95 98.0 Mean 90.7 36.2 0.93 13.6 1.07 96.1 CV 0.07 0.09 0.20 0.065 0.07 (Part b, REBS transducers) 88078 34.8 3.4 0.77 2.5 0.85 38.4 88079 31.4 4.3 0.80 2.9 1.10 35.9 88080 36.1 1.8 0.59 2.1 0.44 38.0 88081 36.9 3.1 0.76 2.4 0.74 40.2 88082 32.7 4.1 0.84 2.4 1.07 37.0 88083 31.0 3.5 0.75 2.8 0.97 34.7 88084 37.1 3.5 0.80 2.4 0.83 40.8 88085 35.1 4.8 0.90 2.2 1.15 40.1 Mean 34.4 3.6 0.78 2.5 0.89 38.1 CV 0.07 0.25 0.11 0.261 0.06 heater method produced values of heat flux and“aapparent”thermal conductivities that were morestable than direct measurements of thermal con-ductivity using heated probes. If soil heat fluxtransducer thermall. conductivity 1S large(>1Wm-c-l) and if the transducer value of Fig. 3. Comparison of mean heat fluxes computed fromheater power measurement (heater heat flux) and that com-puted from the product of the measured thermal conductivityand the thermal gradient (thermal conductivity heat flux).Error bars represent ± one standard deviation ris small(<0.1), then the simpler calibration pro-cedure of Fuchs and Tanner (1968) should be sat-isfactory; however, the value of a should be care-fully estimated as it will probably be less than thetheoretical value of 1.70. Fig. 4. Mean calibration lines for the 6 Micromet and 8 REBStransducers. Error bars represent ± one standard deviation Acknowledgements The authors gratefully acknowledge the contributions ofideas and discussions from Dr. R. J.Reginato,USDA-ARS,Phoenix, AZ, Dr.J. L. Steiner, USDA-ARS, Bushland, TX,and Dr. L. J. Fritschen, University of Washington, Seattle,WA. References ( Deacon, E . L., 1950: The measurement and recording of theheat flux into the soil. Q. J . Roy. Met. Soc., 76 , 479 483. ) ( De V ries, D . A., 1 963: T hermal properties of soils, pp. 210-235. I n: van Wijk, W . R. (ed.), Physics of Plant En-vironment.North-Holland, Amsterdam, The Netherlands. ) ( De Vries, D. A., Peck, A . J., 1 9 58: O n th e cylindrical probemethod o f m e asuring th e rmal conductivity with specialreferences to soils. I. extension of theor y and discussionof probe c h aracteristics. Austral. J . Phys. Sci., 11, 255-271. ) ( Fritschen, L. J., Gay L . W ., 1979: E n vironmental instru-mentation. Springer, New York, 216 pp. ) Fuchs, M., Hadas, A., 1973: Analysis of the performance ofan improved soil heat flux transducer. Soil Sci.Soc. Am.Proc., 37: 173-175. Fuchs, M., Tanner, C. B., 1968: Calibration and yield testof soil heat flux plates. Soil Sci. Soc. Am. Proc., 32,326-328. Hatfield, H. S., Wilkins, F. J., 1950: A new heat-flow meter.J. Sci. Instr., 27, 1-3. Mogensen, V. O., 1970: The calibration factor of heat fluxmeters in relation to the thermal conductivity of the sur-rounding medium. Agric. Met., 7, 401-410. Philip,J. R.,1961: The theory of heat flux meters. J. Geophys.Res.,66,571-579. Portman,D. J., 1958: Conductivity and length relationshipsin heat-flow transducers performance. Trans. Am. Geo-phys. Union, 39, 1089-1094. Tanner, C. B., 1960: Energy balance approach to evapo-transpiration. Soil Sci. Soc. Am. Proc., 24,1-9. Authors'address: Dr. T. A. Howell and J. A. Tolk, USDA-ARS, Conservation & Production Research Laboratory, P.O.Drawer 10, Bushland, TX 79012, U.S.A.
确定
还剩8页未读,是否继续阅读?

产品配置单
上海依阳实业有限公司为您提供《土壤热流变送器(热流计)的校准》,该方案主要用于其他中检测,参考标准--,《土壤热流变送器(热流计)的校准》用到的仪器有高灵敏度热阻式热流计
推荐专场

相关方案
更多
该厂商其他方案
更多