


方案详情
文
Thermo Scientific ARL QUANTX EDXRF 光谱仪提供出色的痕量分析灵敏度,打破了1纳米的检测限瓶颈。
方案详情

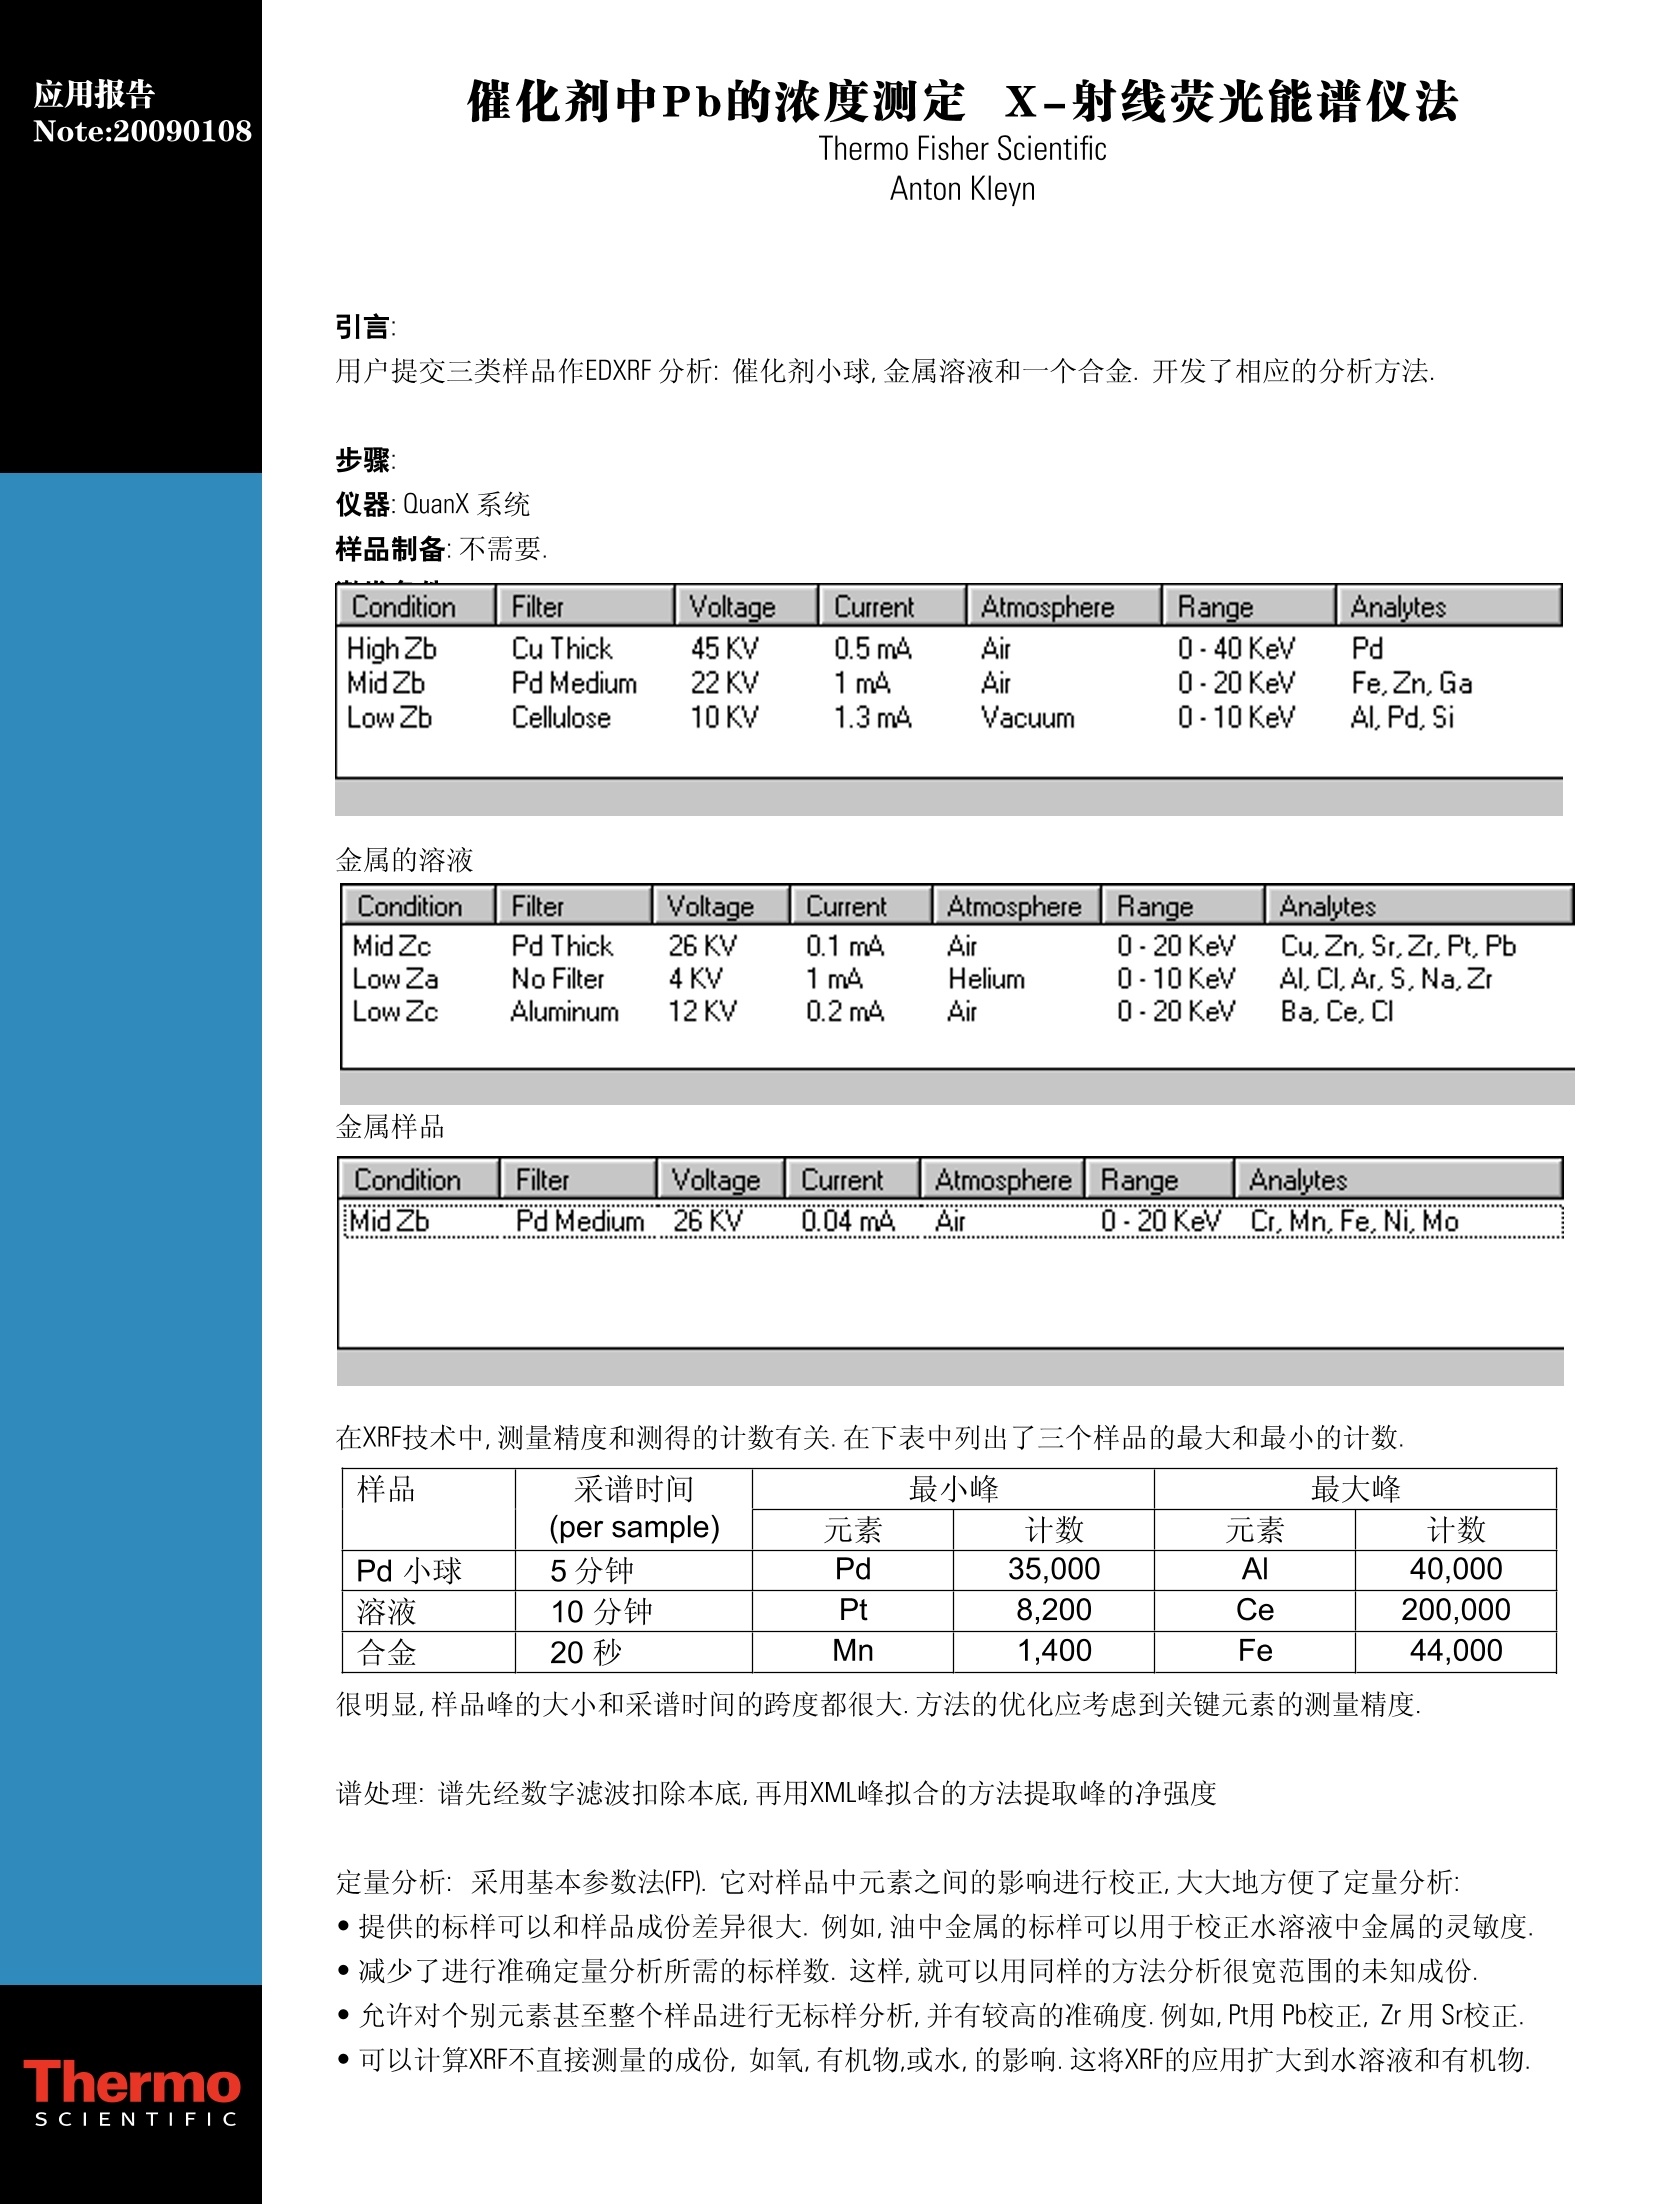
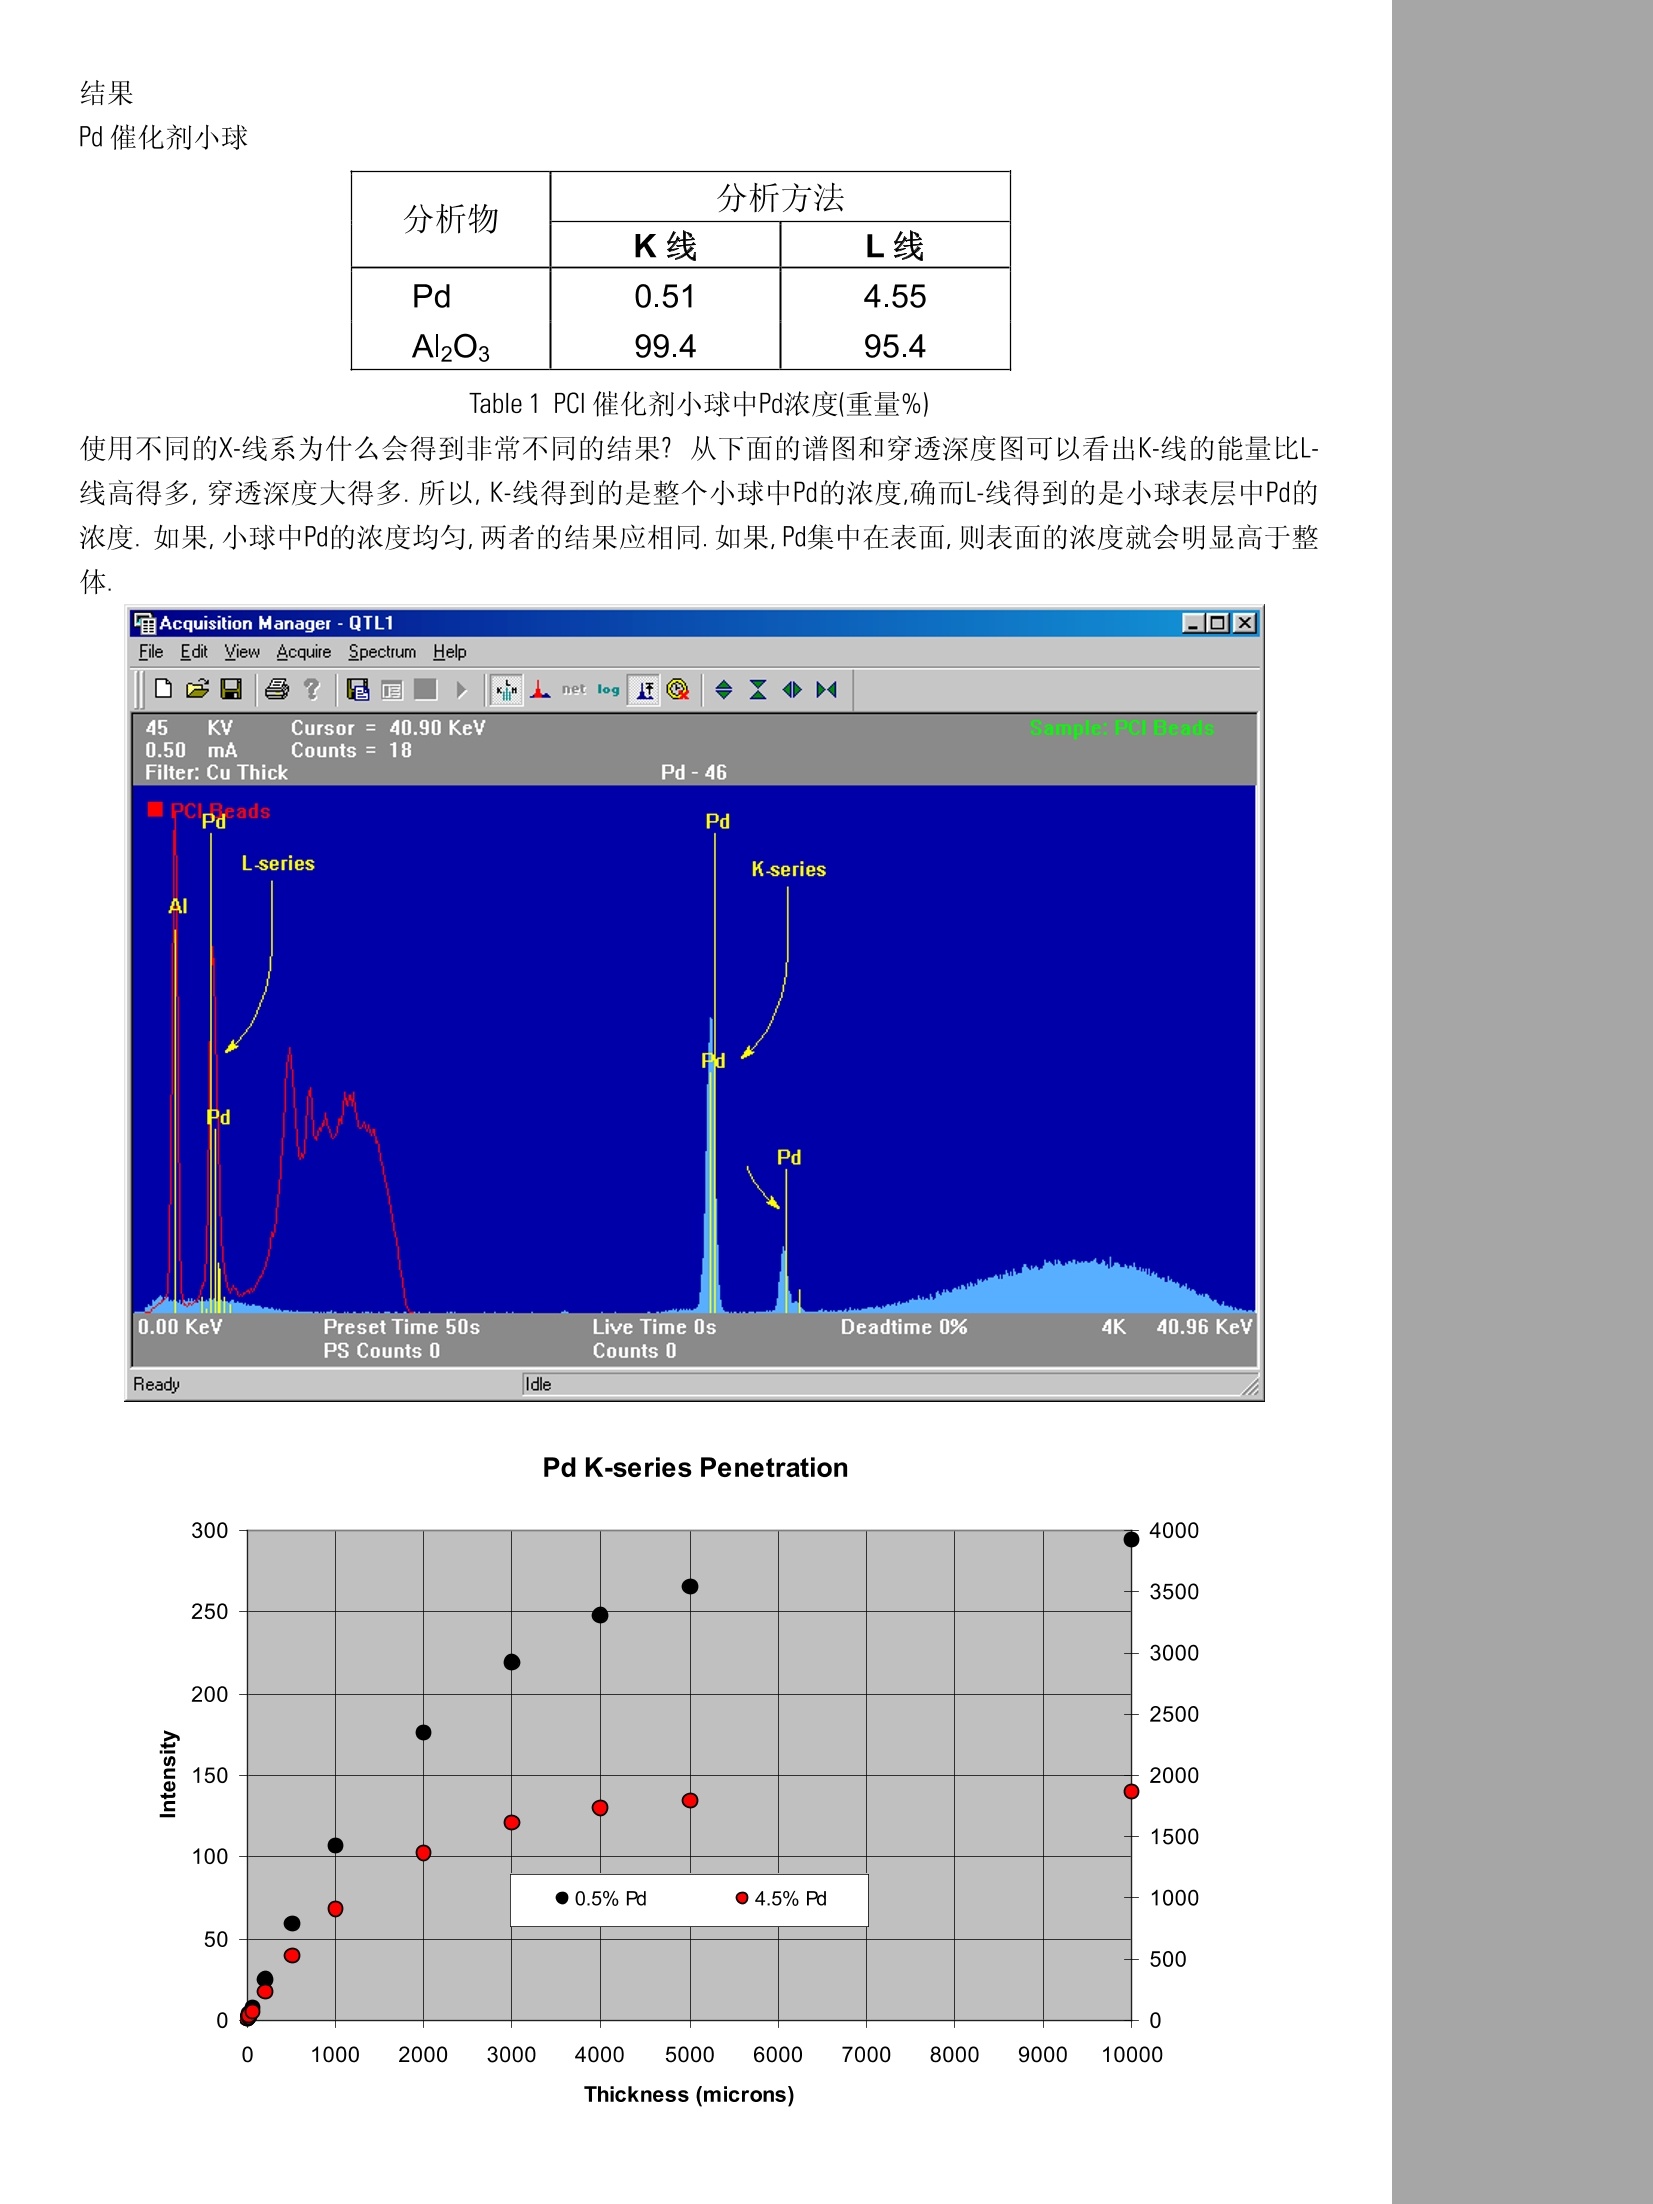
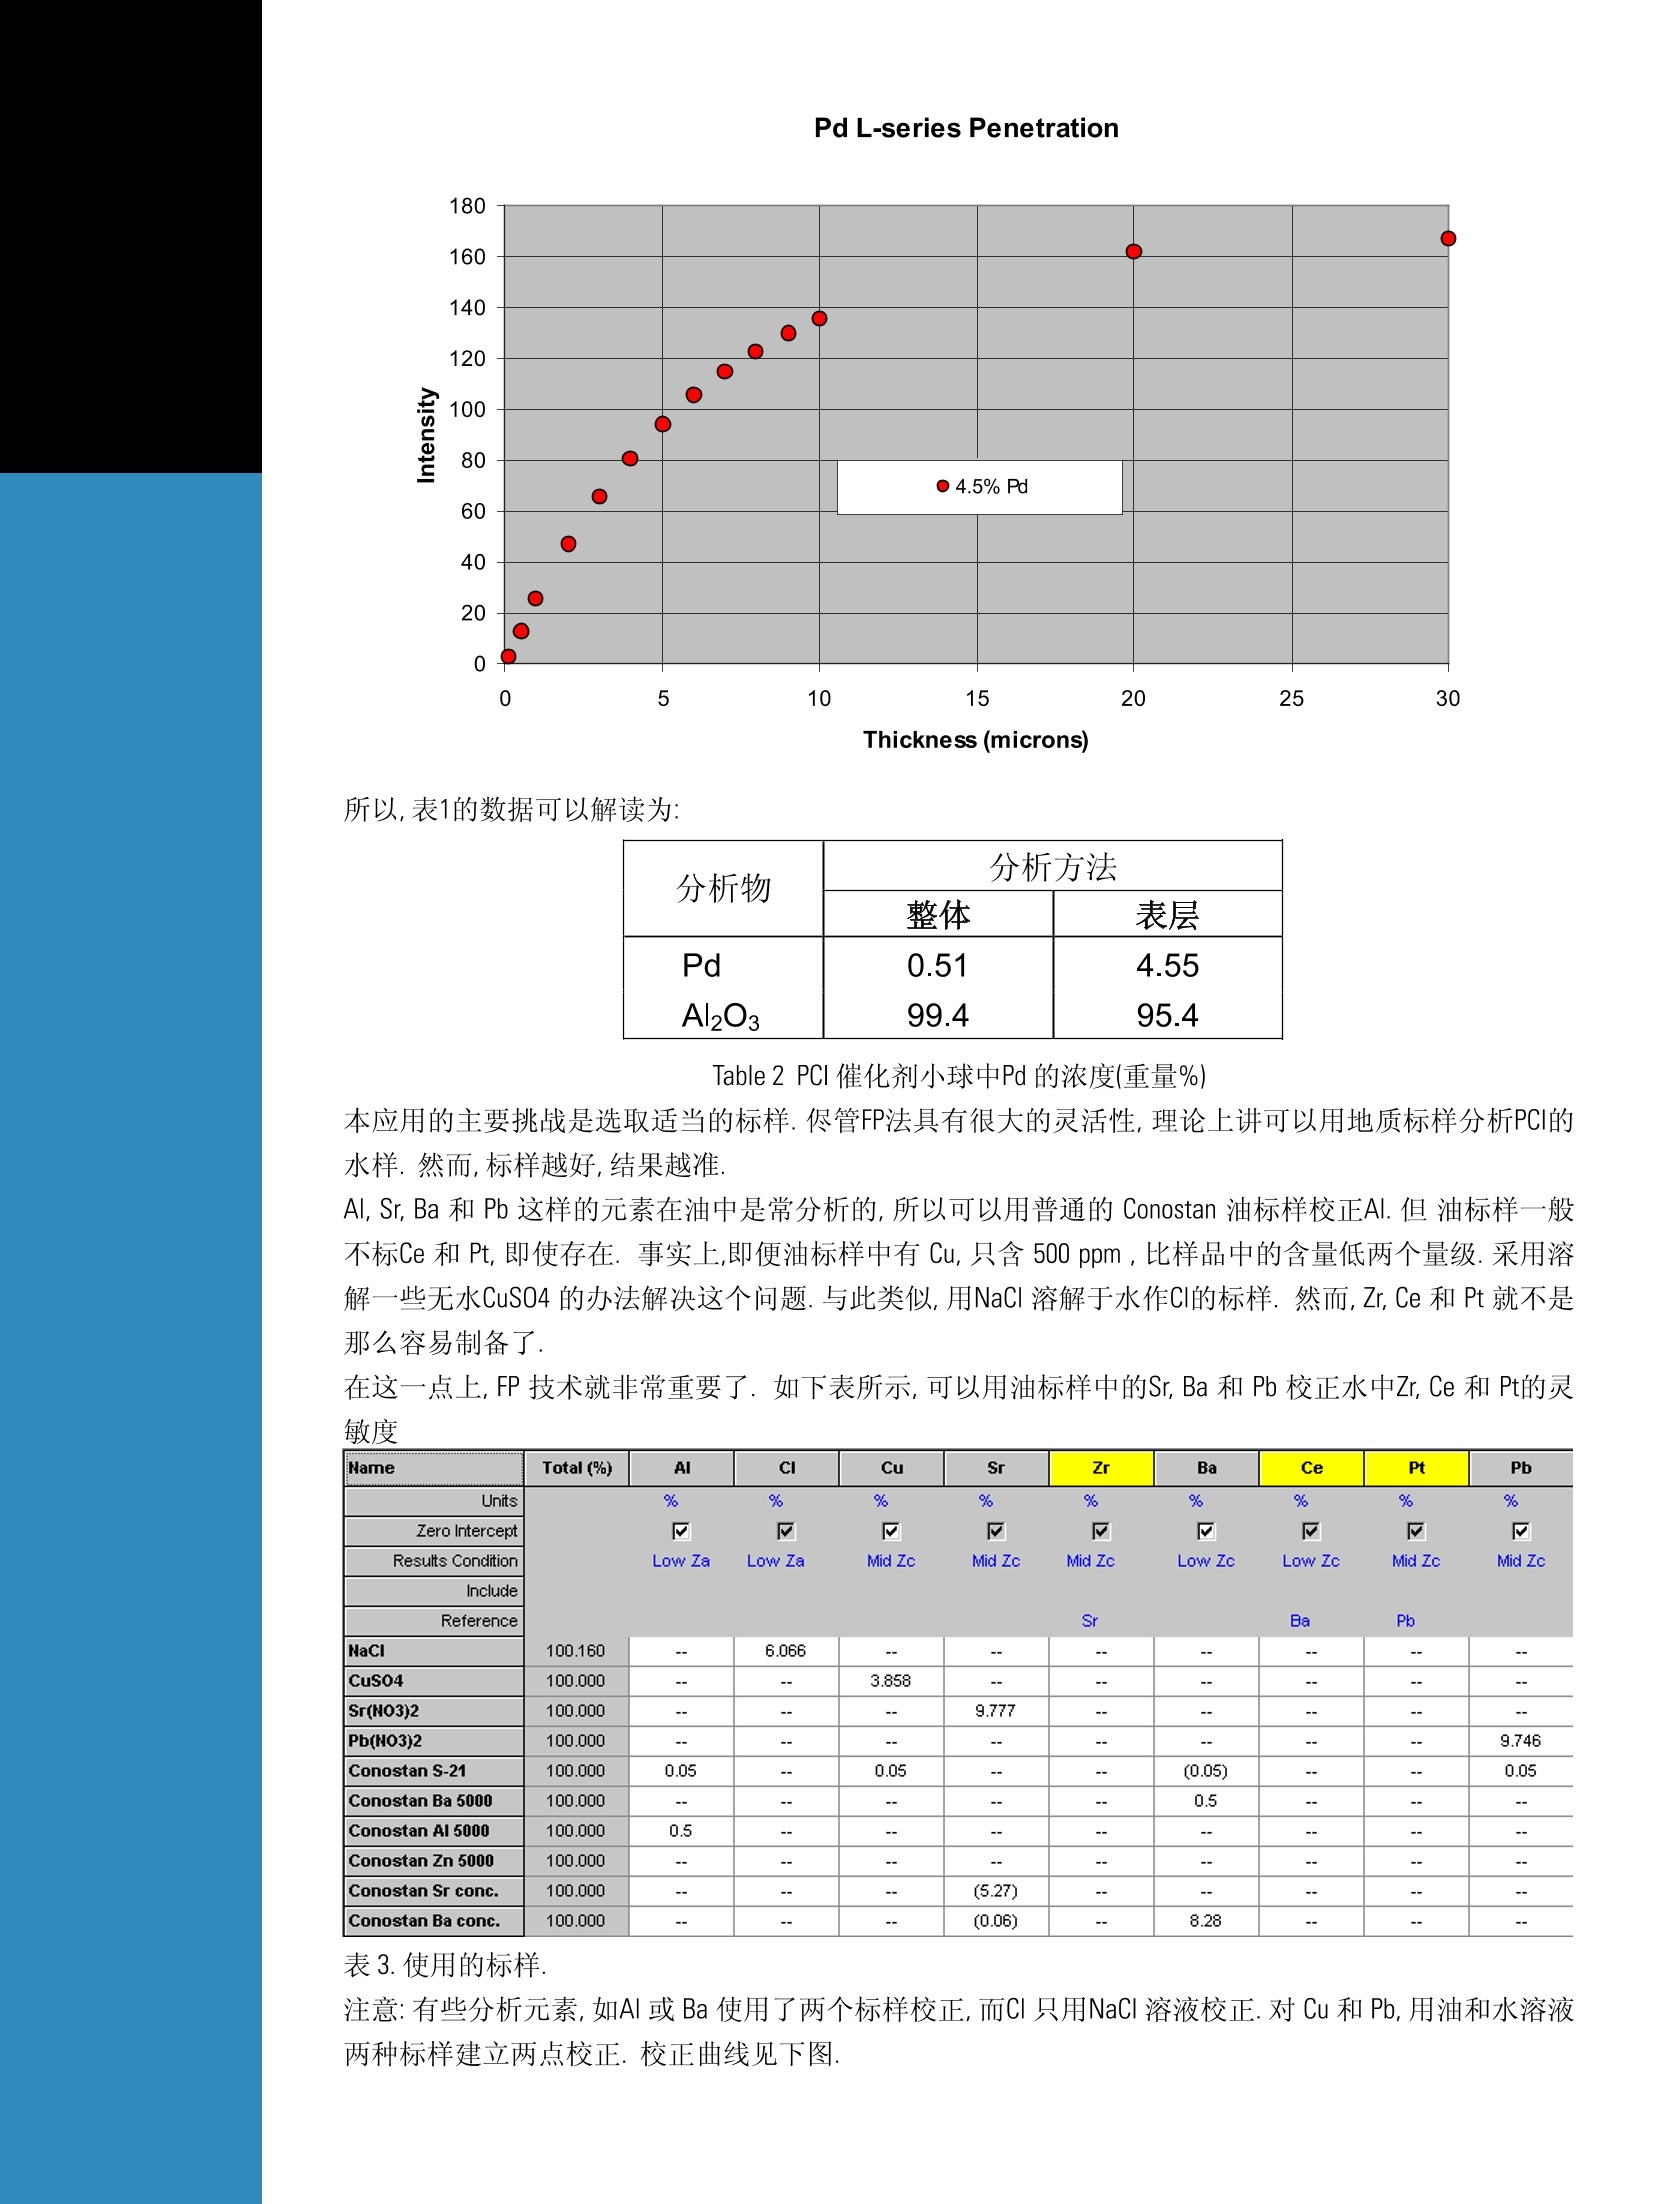
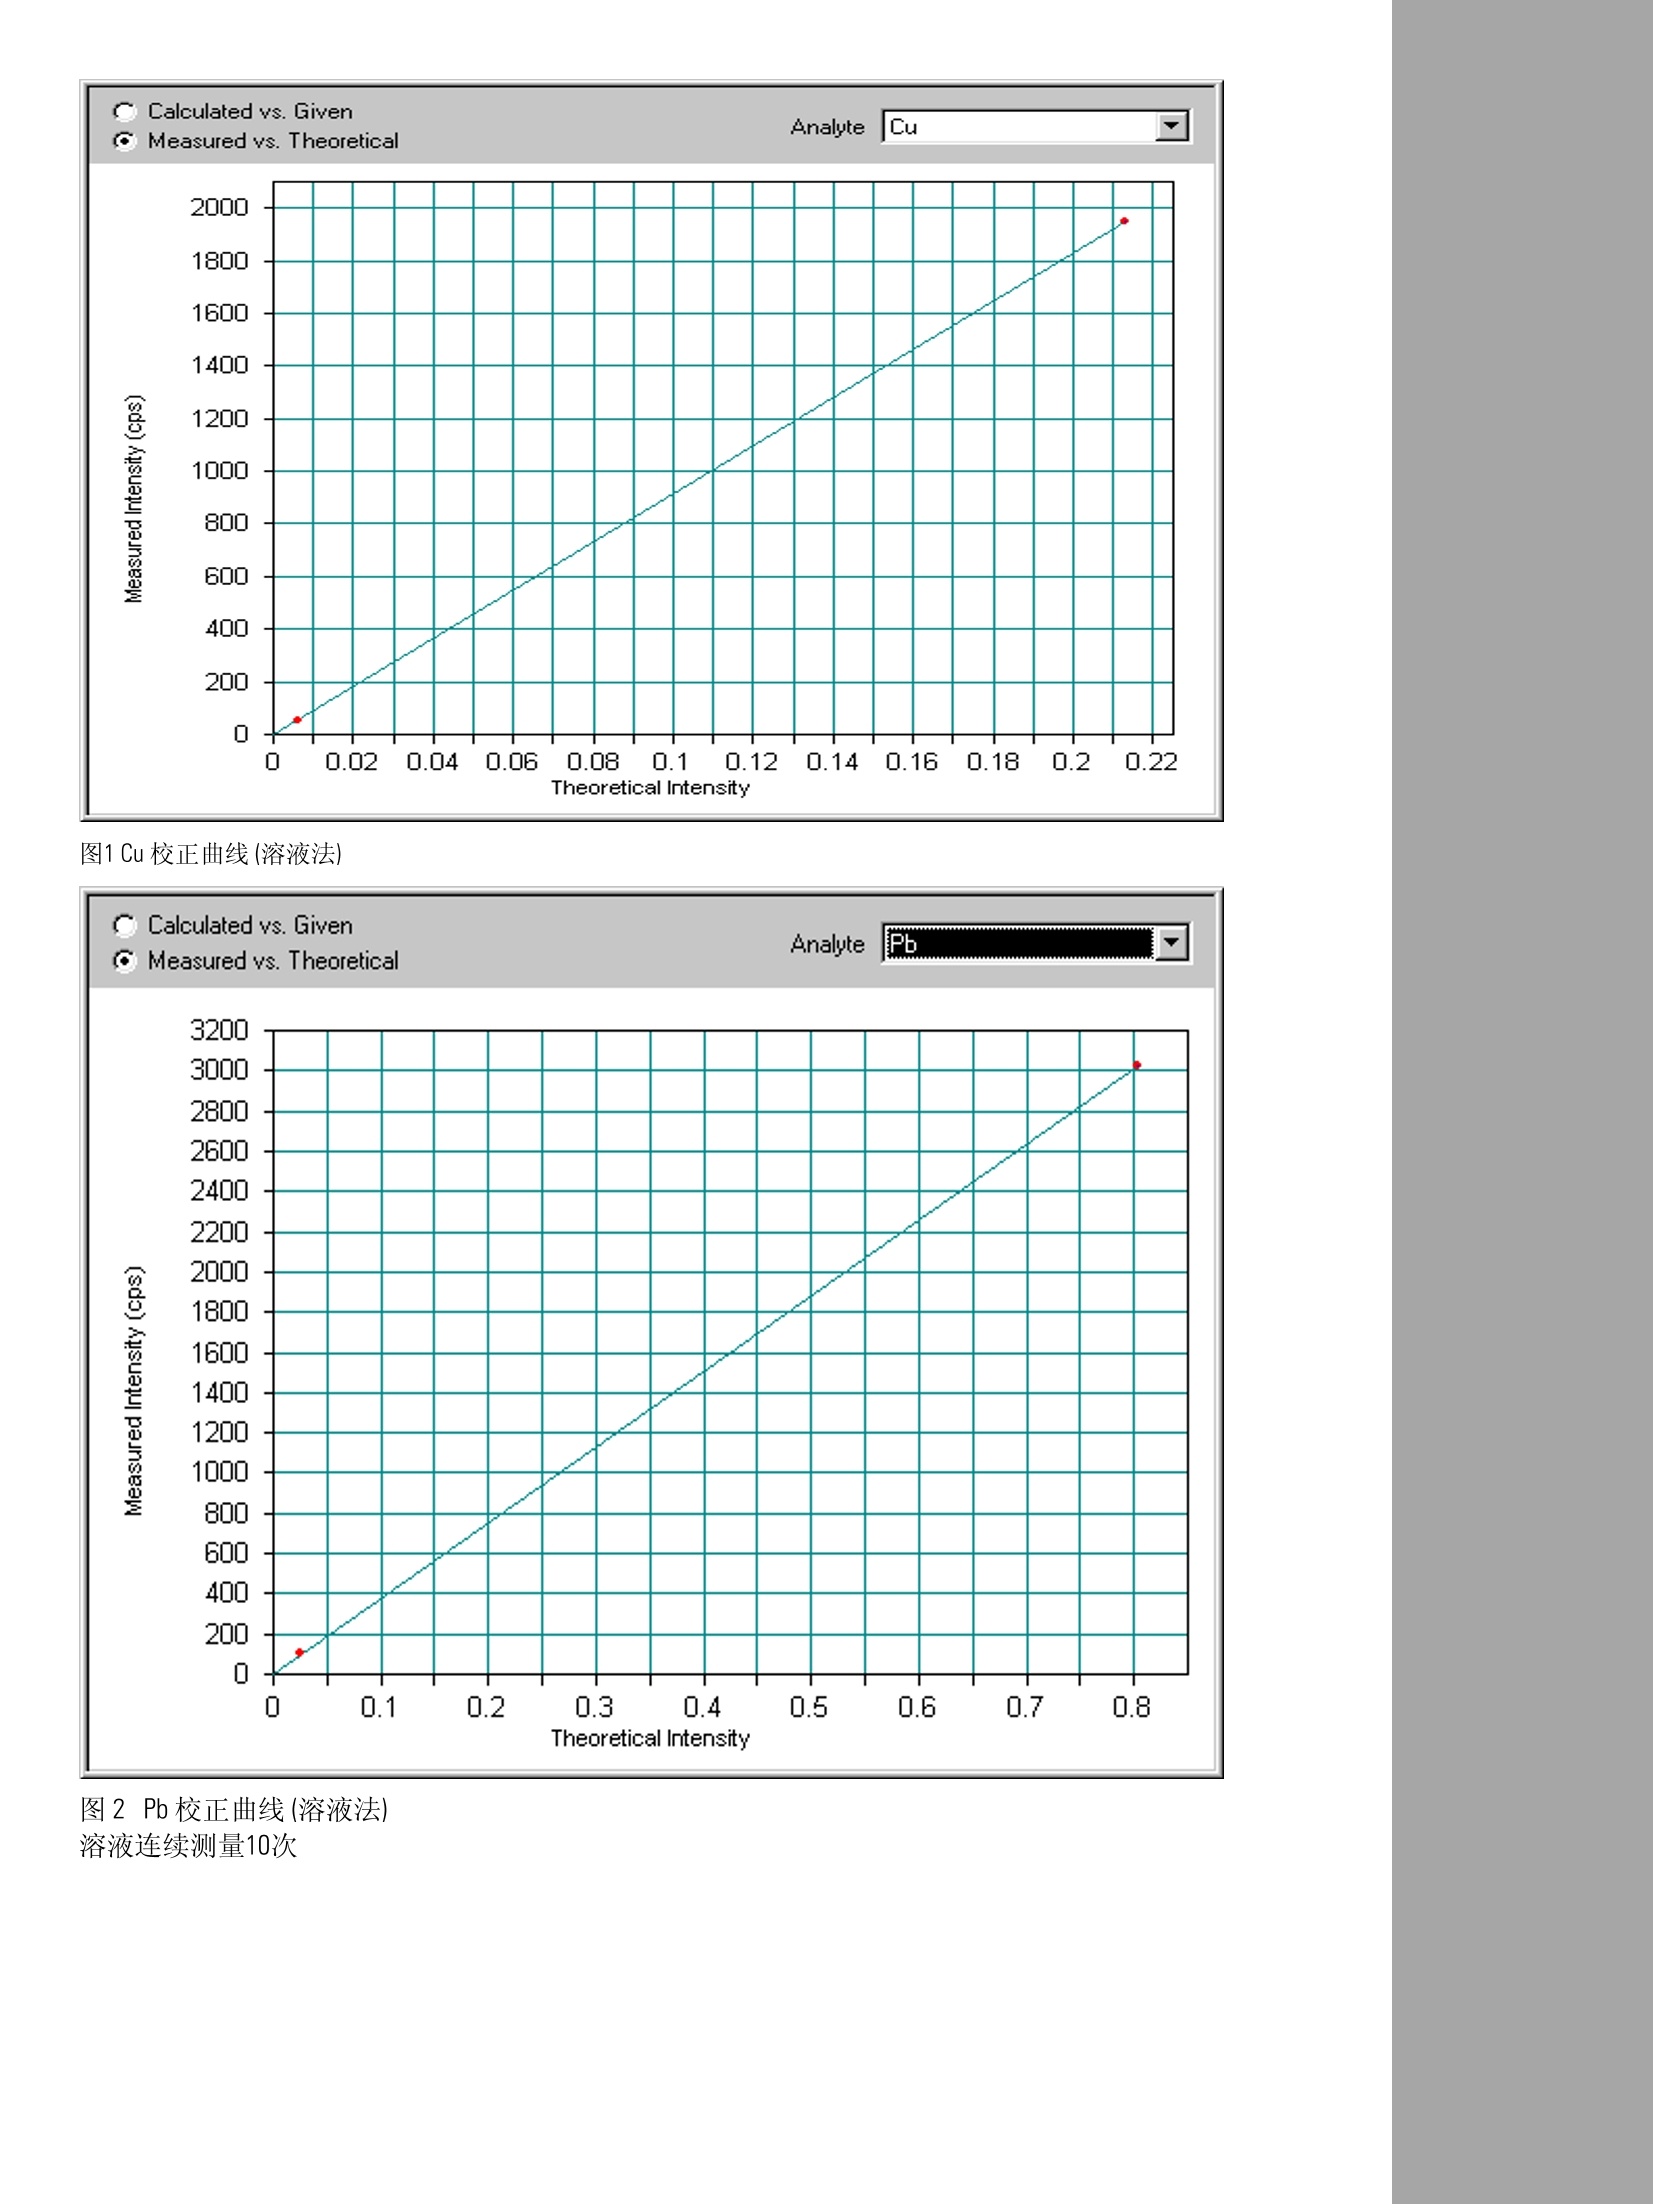
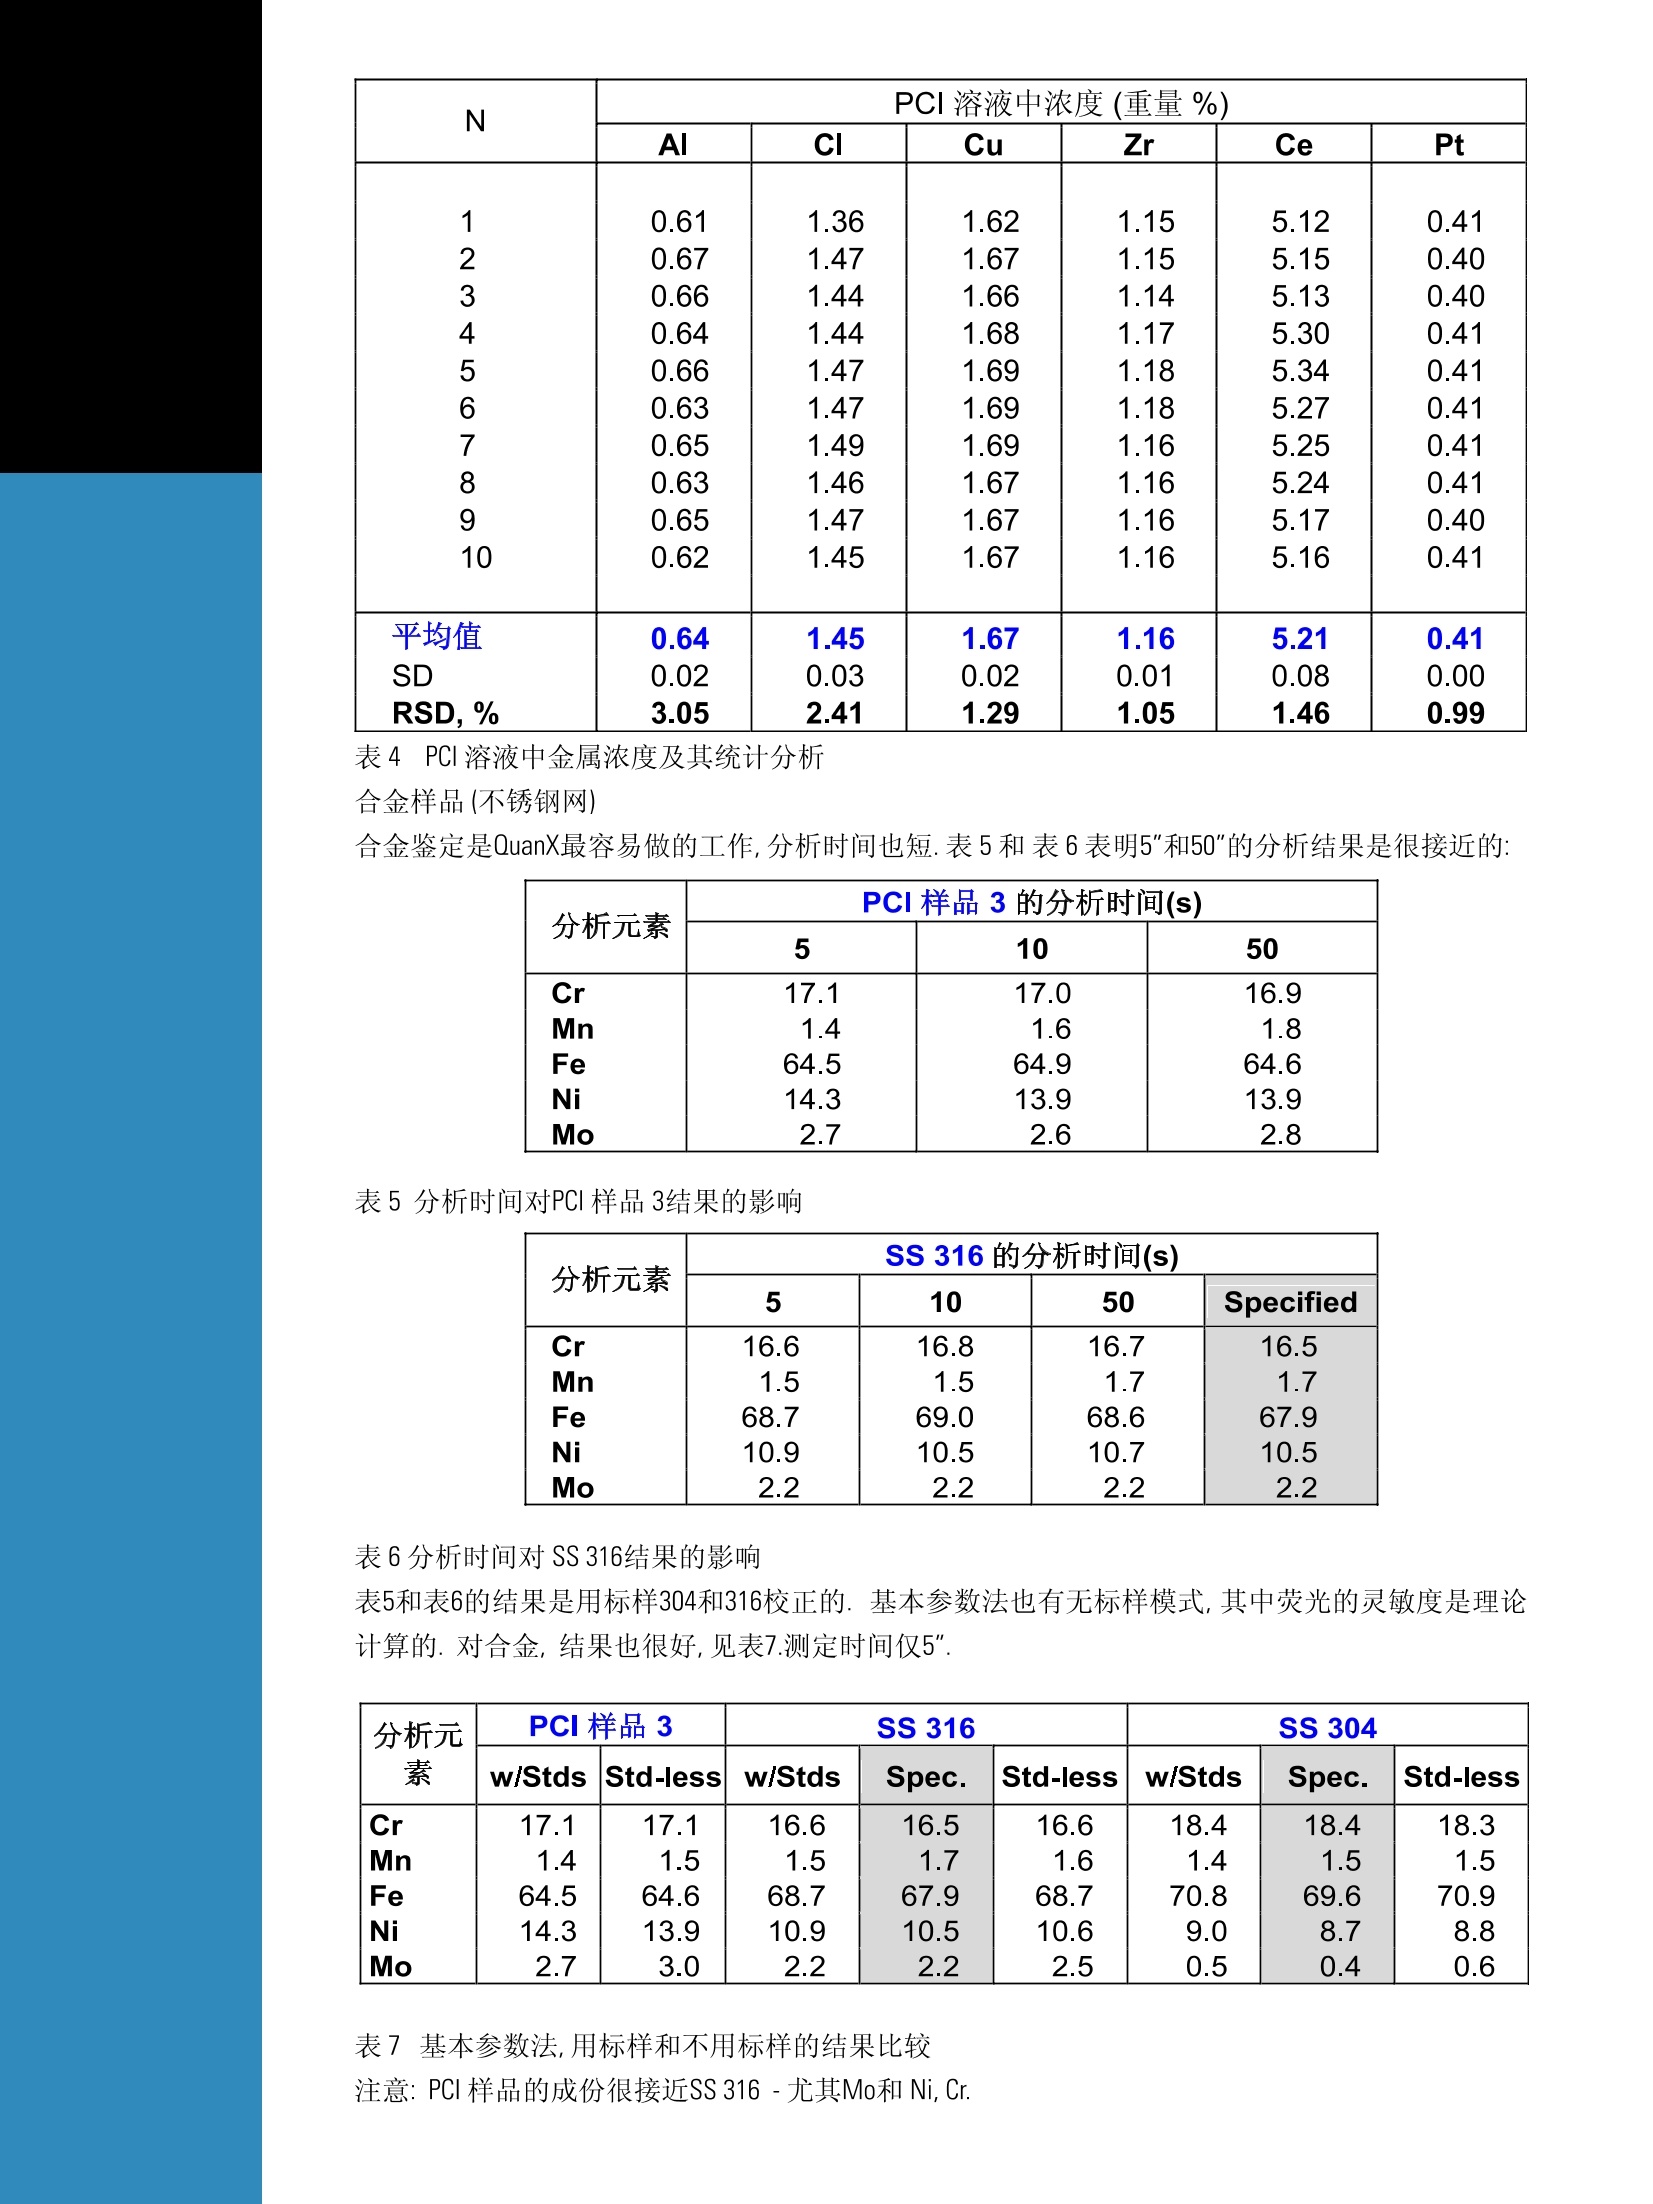
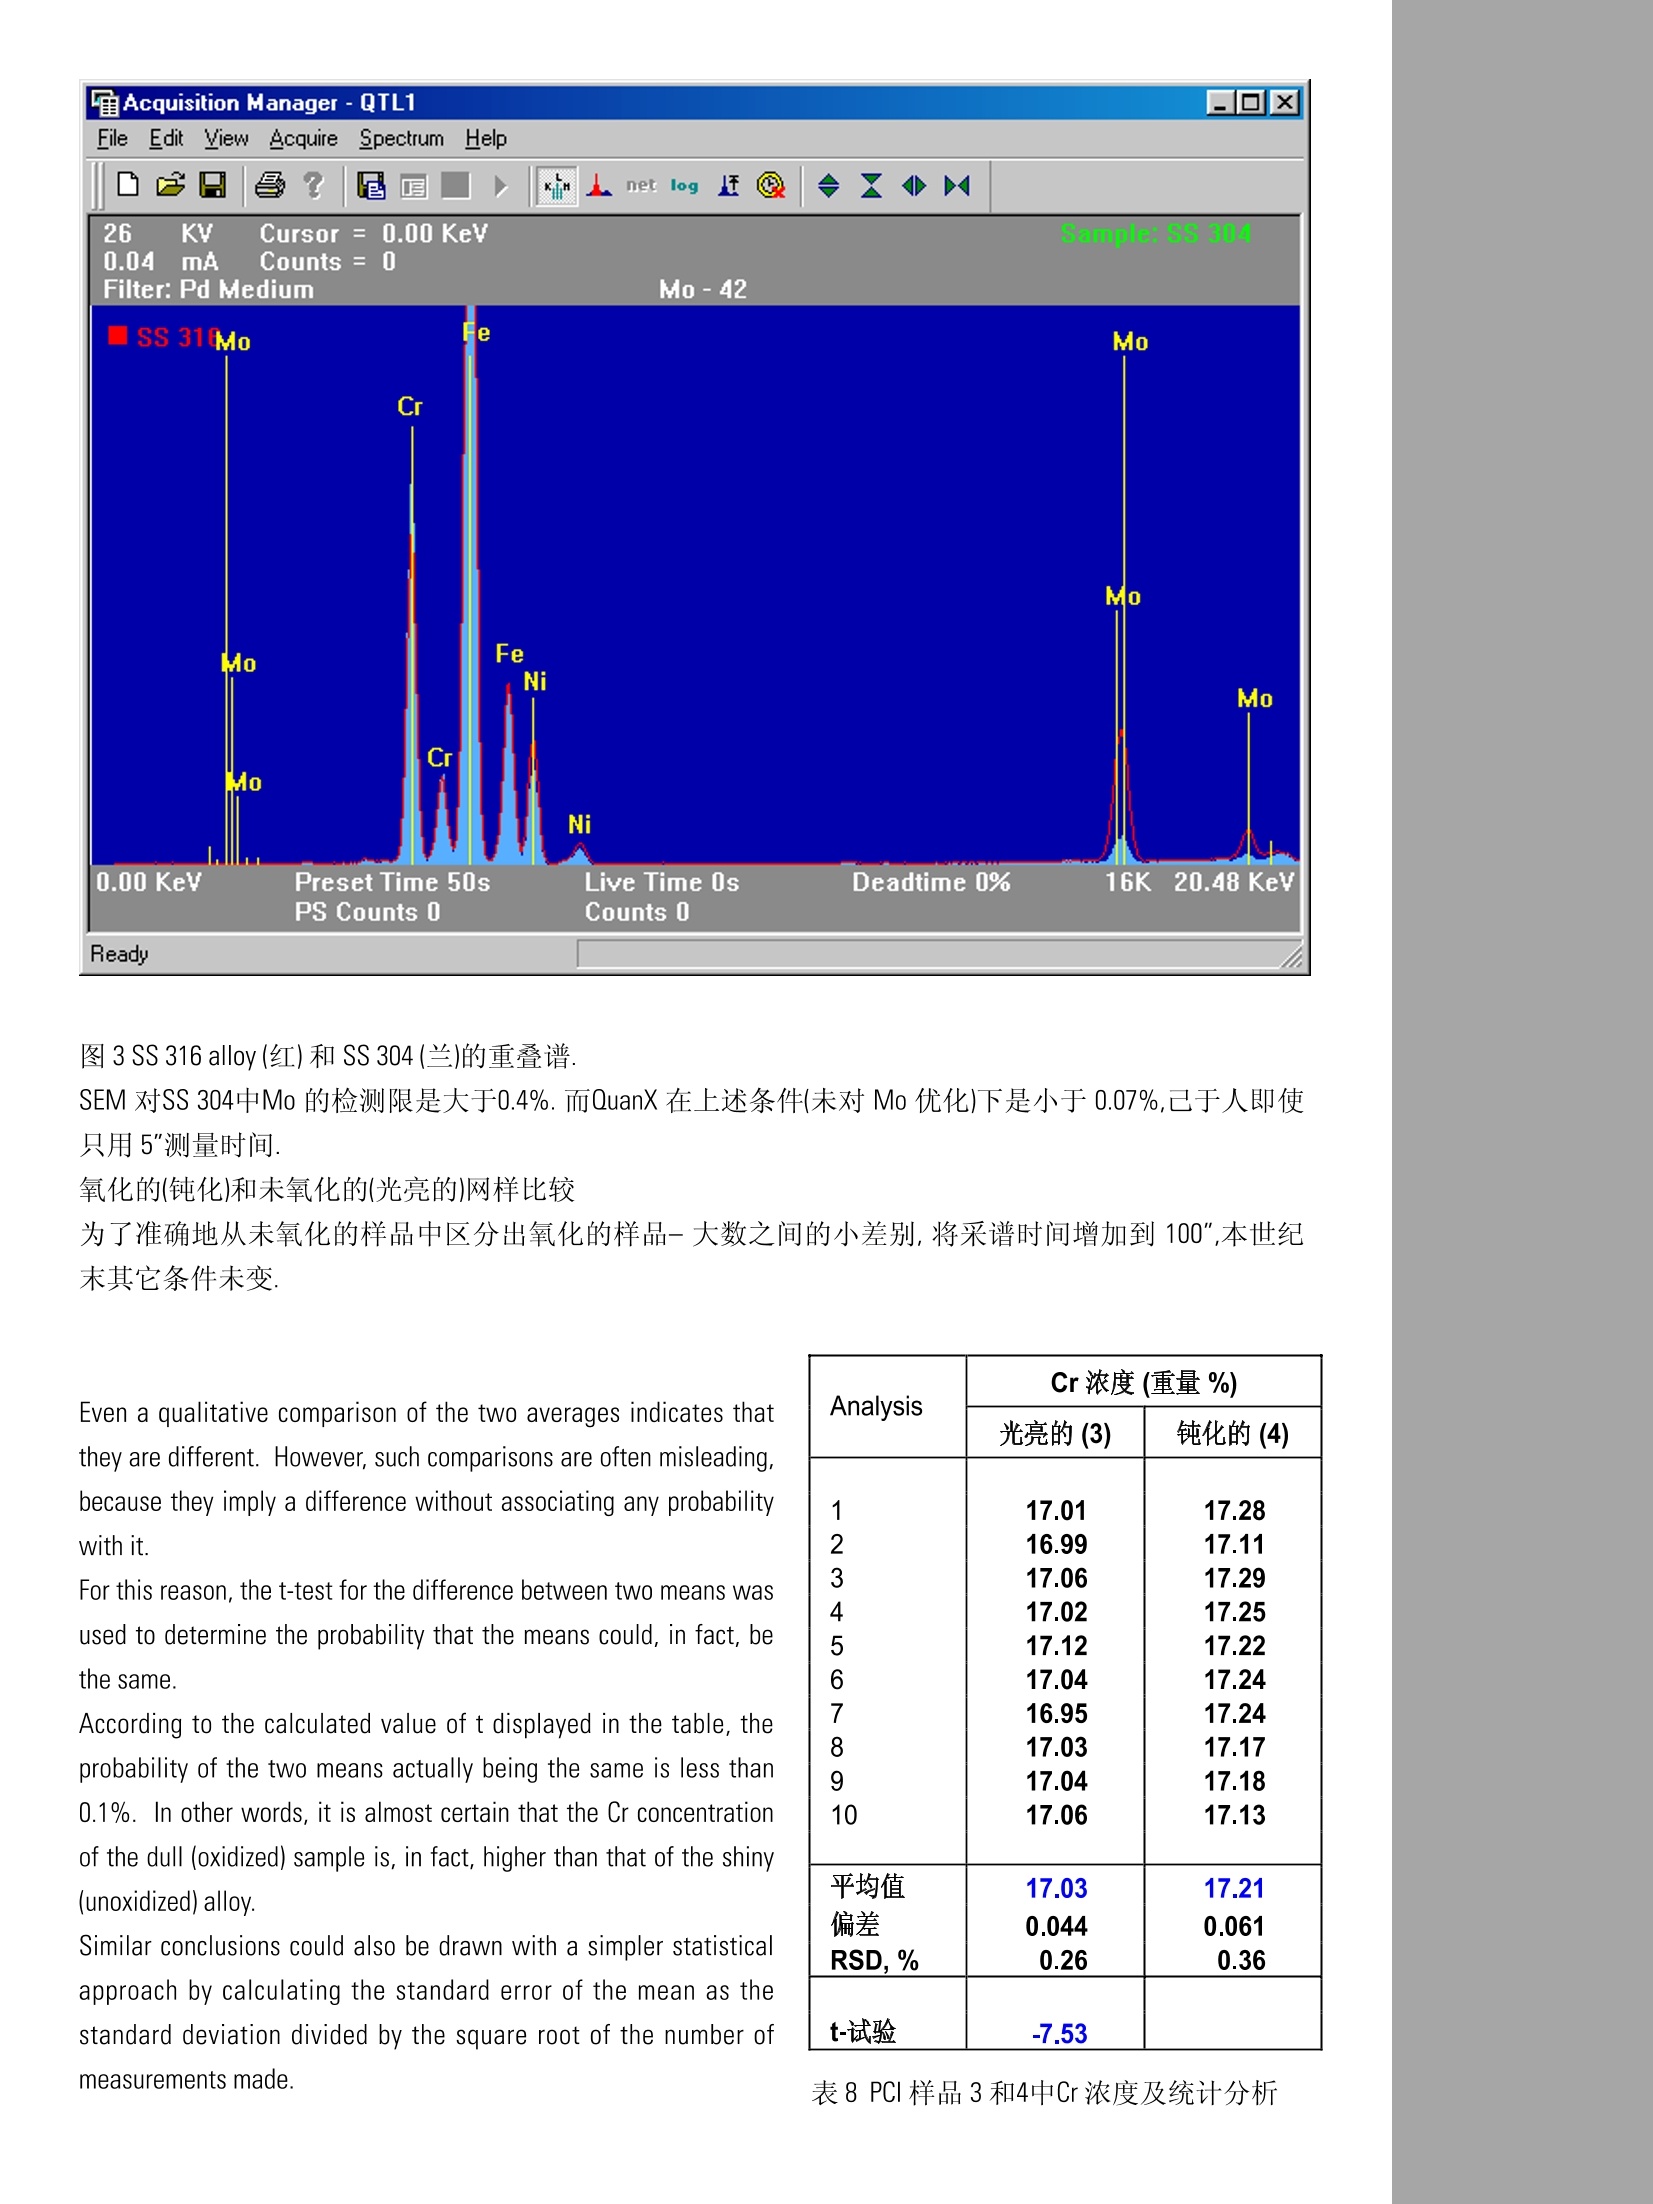
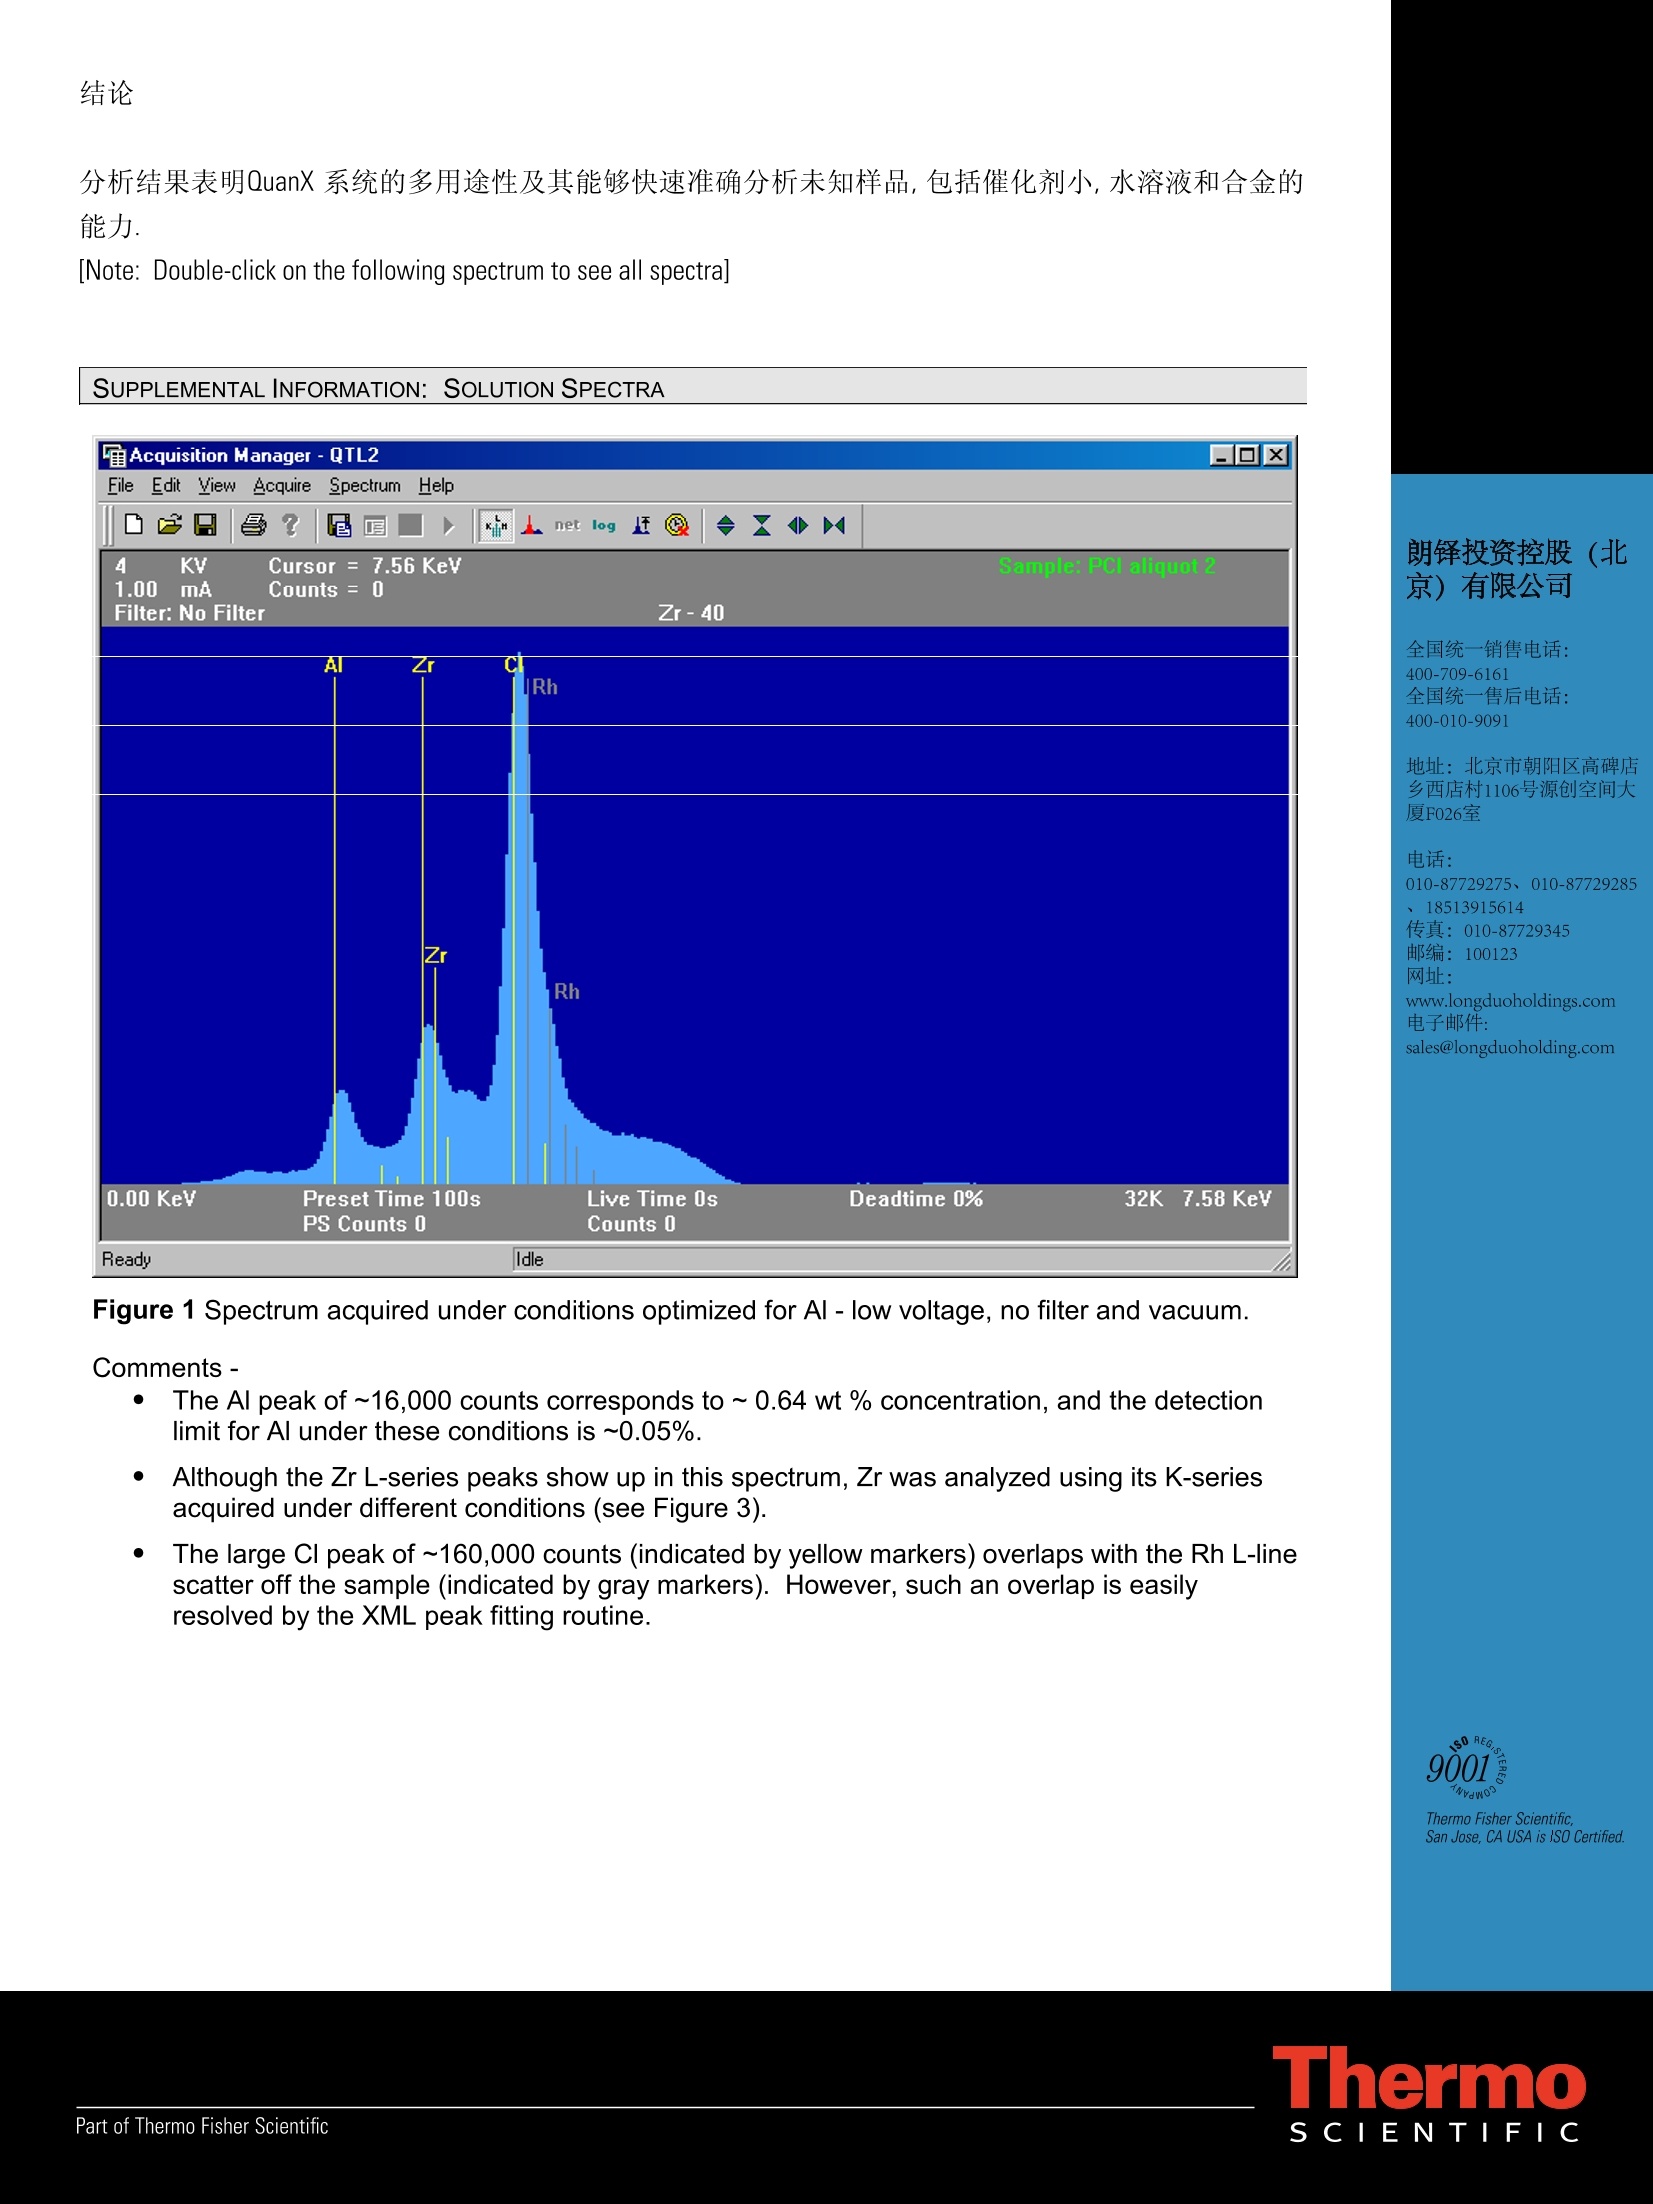
应用报告Note:20090108 Pd L-series Penetration Part of Thermo Fisher Scientific 催化剂中Pb的浓度测定X-射线荧光能谱仪法 Thermo Fisher Scientific Anton Kleyn 引言: 用户提交三类样品作EDXRF分析:催化剂小球,金属溶液和一个合金.开发了相应的分析方法. 步骤: 仪器: QuanX系统 样品制备:不需要. Condition Filter Voltage Current Atmosphere Range Analytes High Zb Cu Thick 45KV 0.5 mA. Air 0-40 KeV Pd Mid Zb Pd Medium 22 KV 1m4 Air 0·20KeV Fe,Zn.Ga LowZb Cellulose 10 KV 1.3 mA. Vacuum 0-10KeV AL Pd, Si 金属的溶液 Condition Filter Voltage Current Atmosphere Range Analytes Mid Zc Pd Thick 26 KV 0.1 mA. Air 0-20KeV Cu, Zn, SrZr, Pt Pb Low Za No Filter 4KV 1mA Helium 0-10KeV Al CLAr S. Na,Zr Low Zc Aluminum 12 KV 0.2 mA. Air 0-20KeV BaCe. CI 金属样品 Condition Filter Voltage Current AtmosphereRange AnalytesMid Zb Pd Medium26KV 0.04 mA Air 0-20KeV Cr.Mn Fe. Ni. Mo XRF技术中,测量精度和测得的计数有关.在下表中列出了三个样品的最大和最小的计数. 样品 采谱时间(per sample) 最小峰 最大峰 元素 计数 元素 计数 Pd 小球 5分钟 Pd 35,000 Al 40,000 溶液 10分钟 Pt 8.200 Ce 200,000 合金 20 秒 Mn 1,400 Fe 44,000 很明显,样品峰的大小和采谱时间的跨度都很大.方法的优化应考虑到关键元素的测量精度. 谱处理:谱先经数字滤波扣除本底,再用XML峰拟合的方法提取峰的净强度 定量分析:采用基本参数法(FP).它对样品中元素之间的影响进行校正,大大地方便了定量分析: ·提供的标样可以和样品成份差异很大.例如,油中金属的标样可以用于校正水溶液中金属的灵敏度. ·减少了进行准确定量分析所需的标样数.这样,就可以用同样的方法分析很宽范围的未知成知. ·允许对个别元素甚至整个样品进行无标样分析,并有较高的准确度.例如,Pt用 Pb校正, Zr用 Sr校正. ·可以计算XRF不直接测量的成份,如氧,有机物,或水,的影响.这将XRF的应用扩大到水溶液和有机物. 结果Pd 催化剂小球 分析物 分析方法 K线 L线 Pd Al2O3 0.51 99.4 4.5595.4 Table 1 PCI 催化剂小球中Pd浓度(重量%) 使用不同的X-线系为什么会得到非常不同的结果?从下面的谱图和穿透深度图可以看出K-线的能量比L-线高得多,穿透深度大得多.所以,K-线得到的是整个小球中Pd的浓度,确而L-线得到的是小球表层中Pd的浓度.如果,小球中Pd的浓度均匀,两者的结果应相同.如果,Pd集中在表面,则表面的浓度就会明显高于整体. Pd K-series Penetration Thickness (microns) 所以,表1的数据可以解读为: 分析物 分析方法 整体 表层 Pd 0.51 4.55 95.4 Al2O3 99.4 Table 2 PCI 催化剂小球中Pd的浓度(重量%) 本应用的主要挑战是选取适当的标样.样管FP法具有很大的灵活性,理论上讲可以用地质标样分析PCI的水样.然而,标样越好,结果越准. Al, Sr, Ba 和 Pb 这样的元素在油中是常分析的,所以可以用普通的 Conostan 油标样校正AI.但油标样一般不标Ce 和 Pt, 即使存在.事实上,即便油标样中有 Cu, 只含 500 ppm, 比样品中的含量低两个量级.采用溶解一些无水CuS04的办法解决这个问题.与此类似,用NaCl 溶解于水作CI的标样.然而, Zr, Ce 和 Pt 就不是那么容易制备了. 在这一点上, FP技术就非常重要了.如下表所示,可以用油标样中的Sr, Ba 和 Pb 校正水中Zr, Ce 和 Pt的灵敏度 Name Total(%) AI CI Cu Sr Zr Ba Ce Pt Pb Units % Zero Intercept Results Condition Low Zc Pb Include Ba Reference NaCl 100.160 6.066 -- -- -- -- -- CuSO4 100.000 -- 3.858 -- -- -- -- Sr(NO3)2 100.000 -- -- -- 9.777 -- -- -- -- Pb(H03)2 100.000 -- -- -- -- -m 9.746 Conostan S-21 100.000 0.05 -- 0.05 -- -- (0.05) -- -- 0.05 Conostan Ba 5000 100.000 -- -- -- -- -- 0.5 -- -- -- Conostan Al 5000 100.000 0.5 -- -- -- -- -- -m Conostan Zn 5000 100.000 -- -- -- -- -- -- -- Conostan Sr conc. 100.000 -- -- (5.27) -- -- -- -- Conostan Ba conc. 100.000 -- -- -- (0.06) -- 8.28 -- -- -- 表3.使用的标样. 注意:有些分析元素,如AI或 Ba 使用了两个标样校正,而CI只用NaCl 溶液校正.对 Cu 和Pb,用油和水溶液两种标样建立两点校正.校正曲线见下图. 图1Cu校正曲线(溶液法) 图2Pb校正曲线(溶液法) 溶液连续测量10次 N PCI 溶液中浓度(重量%) AI CI Cu Zr Ce Pt 1 2345678 9 10 1 0.61 1.36 1.62 1.15 5.12 0.41 2 0.67 1.47 1.67 1.15 5.15 0.40 3 0.66 1.44 1.66 1.14 5.13 0.40 4 0.64 1.44 1.68 1.17 5.30 0.41 0.66 1.47 1.69 1.18 5.34 0.41 0.63 1.47 1.69 1.18 5.27 0.41 0.65 1.49 1.69 1.161.16 5.255.24 0.41 1.461.47 1.671.67 1.16 5.17 0.410.40 0.62 1.45 1.67 1.16 5.16 0.41 平均值 SD RSD,% 0.640.023.05 1.45 1.67 1.16 5.21 0.410.000.99 0.032.41 0.021.29 0.011.05 0.081.46 表4 PCI溶液中金属浓度及其统计分析 合金样品(不锈钢网) 合金鉴定是QuanX最容易做的工作,分析时间也短.表5和表6表明5"和50"的分析结果是很接近的: 分析元素 PCI 样品3的分析时间(s) 5 10 50 CrMnFeNiMo 17.1 17.0 1.464.5 1.664.9 13.9 13.9 14.3 2.7 2.6 2.8 表5分析时间对PCI样品3结果的影响 分析元素 SS 316的分析时间(s) 5 16.6 10 16.8 50 16.7 Specified 16.5 CrMnFeNiMo 1.5 1.5 1.7 1.7 68.7 69.0 68.6 67.9 10.9 10.5 10.7 10.5 2.2 2.2 2.2 表6分析时间对 SS 316结果的影响 表5和表6的结果是用标样304和316校正的.基本参数法也有无标样模式,其中荧光的灵敏度是理论计算的.对合金,结果也很好,见表7.测定时间仅5". 分析元素 PCI样品 3 SS 316 SS 304 w/Stds Std-less w/Stds Spec. Std-less w/Stds Spec.m Std-less CrMnFe 17.11.4 17.1 16.6 16.5 16.6 18.4 18.4 18.3 1.5 1.5 1.7 1.6 1.4 1.5 1.5 64.514.3 64.6 68.7 67.9 68.7 70.8 69.6 70.9 NiMo 13.9 10.9 10.5 10.62.5 9.0 8.7 8.8 表7基本参数法,用标样和不用标样的结果比较 注意:PCI样品的成份很接近SS 316-尤其Mo和 Ni, Cr. 图3 SS 316 alloy (红) 和 SS 304 (兰)的重叠谱. SEM 对SS304中Mo 的检测限是大于0.4%.而QuanX在上述条件(未对 Mo 优化)下是小于0.07%,己于人即使只用5"测量时间. 氧化的(钝化)和未氧化的(光亮的)网样比较 为了准确地从未氧化的样品中区分出氧化的样品-大数之间的小差别,将采谱时间增加到100",本世纪末其他条件未变. Even a qualitative comparison of the two averages indicates thatthey are different. However, such comparisons are often misleading,because they imply a difference without associating any probabilitywith it. For this reason, the t-test for the difference between two means wasused to determine the probability that the means could, in fact, bethe same. According to the calculated value of t displayed in the table, theprobability of the two means actually being the same is less than0.1%. In other words, it is almost certain that the Cr concentrationof the dull (oxidized) sample is, in fact, higher than that of the shiny(unoxidized) alloy. Similar conclusions could also be drawn with a simpler statisticalapproach by calculating the standard error of the mean as thestandard deviation divided by the square root of the number ofmeasurements made. Analysis Cr浓度(重量%) 光亮的(3) 钝化的(4) 12345678910 17.0116.9917.0617.0217.1217.0416.9517.0317.0417.06 17.28 17.1117.2917.2517.2217.2417.2417.1717.1817.13 平均值偏差 RSD,% 17.030.0440.26 17.210.0610.36 t-试验 -7.53 表8PCI样品3和4中Cr浓度及统计分析 分析结果表明QuanX系统的多用途性及其能够快速准确分析未知样品,包括催化剂小,水溶液和合金的能力. [Note: Double-click on the following spectrum to see all spectra] SUPPLEMENTAL INFORMATION: SOLUTION SPECTRA 朗铎投资控股(北京)有限公司 全国统一销售电话: 400-709-6161 全国统一售后电话: 400-010-9091 地址:北京市朝阳区高碑店 乡西店村1106号源创空间大 厦F026室 电话: 010-87729275、010-87729285 、18513915614 传真:010-87729345 邮编:100123 网址: www.longduoholdings.com 电子邮件: sales@longduoholding.com Figure 1 Spectrum acquired under conditions optimized for Al-low voltage, no filter and vacuum. Comments- The Al peak of~16,000 counts corresponds to~ 0.64 wt % concentration, and the detectionlimit for Al under these conditions is ~0.05%. ●Although the Zr L-series peaks show up in this spectrum, Zr was analyzed using its K-seriesacquired under different conditions (see Figure 3). ·TThe large Cl peak of ~160,000 counts (indicated by yellow markers) overlaps with the Rh L-linescatter off the sample (indicated by gray markers). However, such an overlap is easilyresolved by the XML peak fitting routine.
确定
还剩5页未读,是否继续阅读?

朗铎科技(北京)有限公司为您提供《ARL台式荧光光谱仪应用》,该方案主要用于其他中--检测,参考标准--,《ARL台式荧光光谱仪应用》用到的仪器有
相关方案
更多