


方案详情
文
The ICM method gives useful information to cell researchers related with hpertrophy.
方案详情

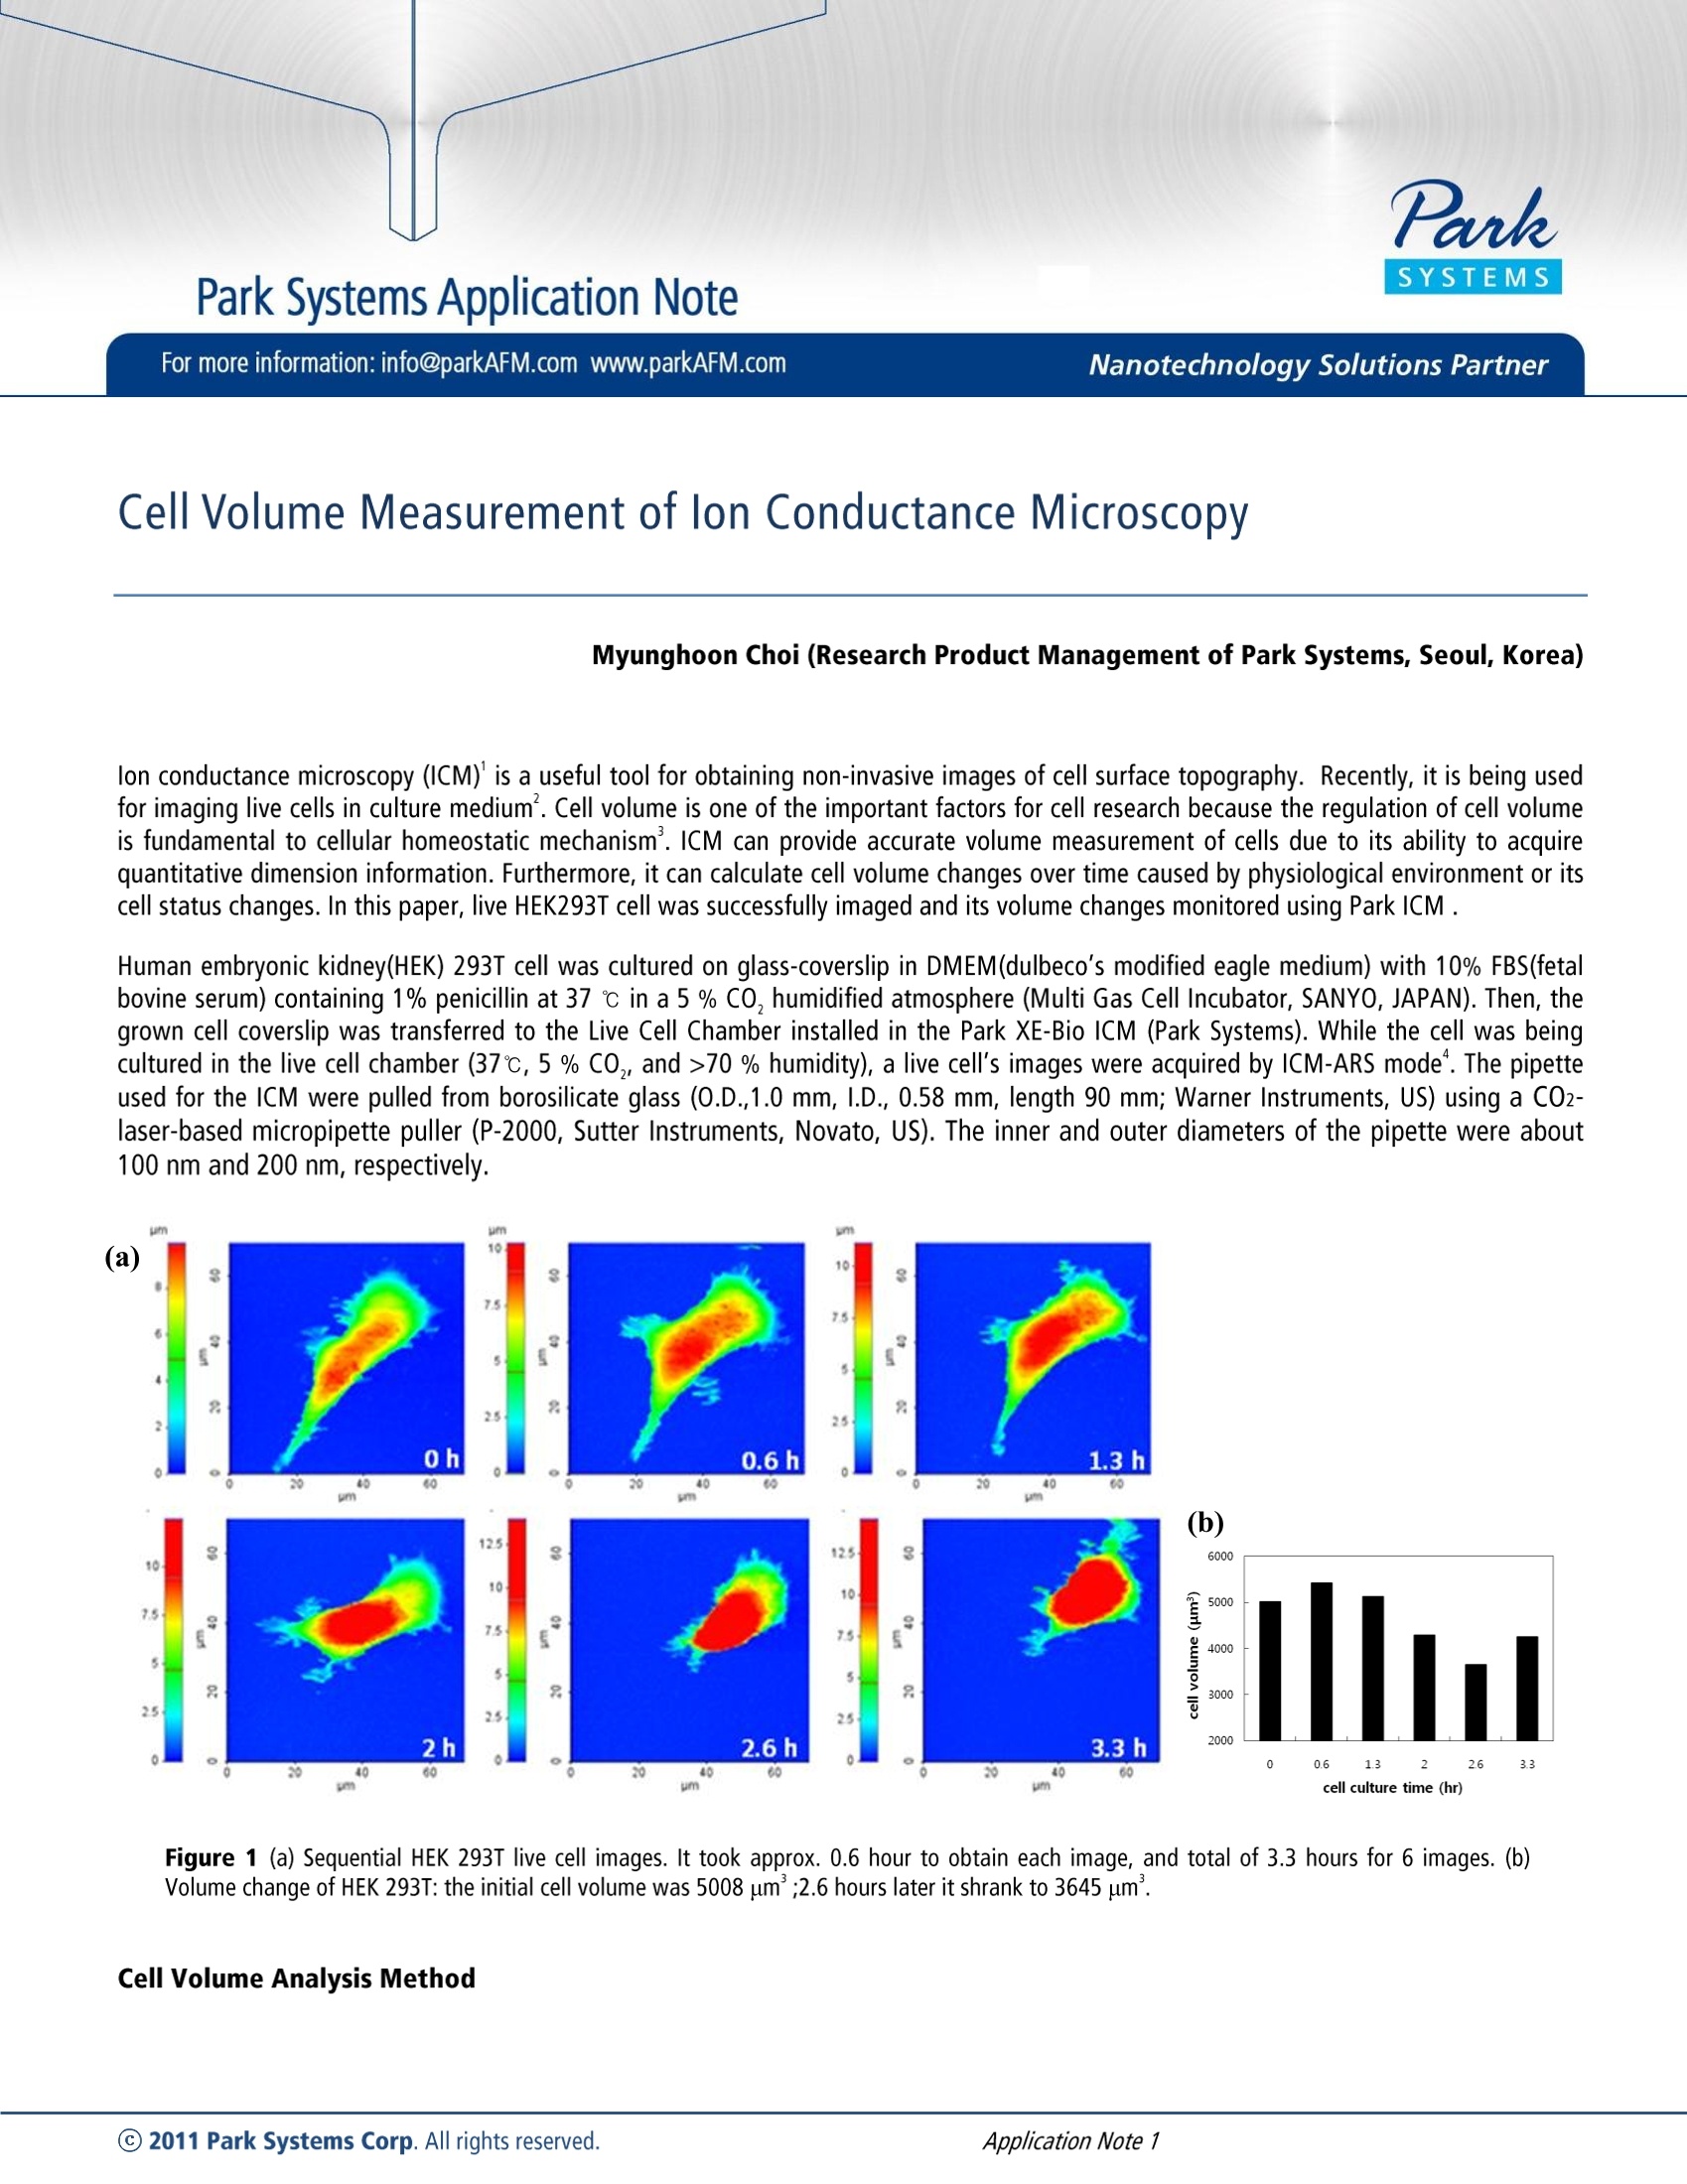
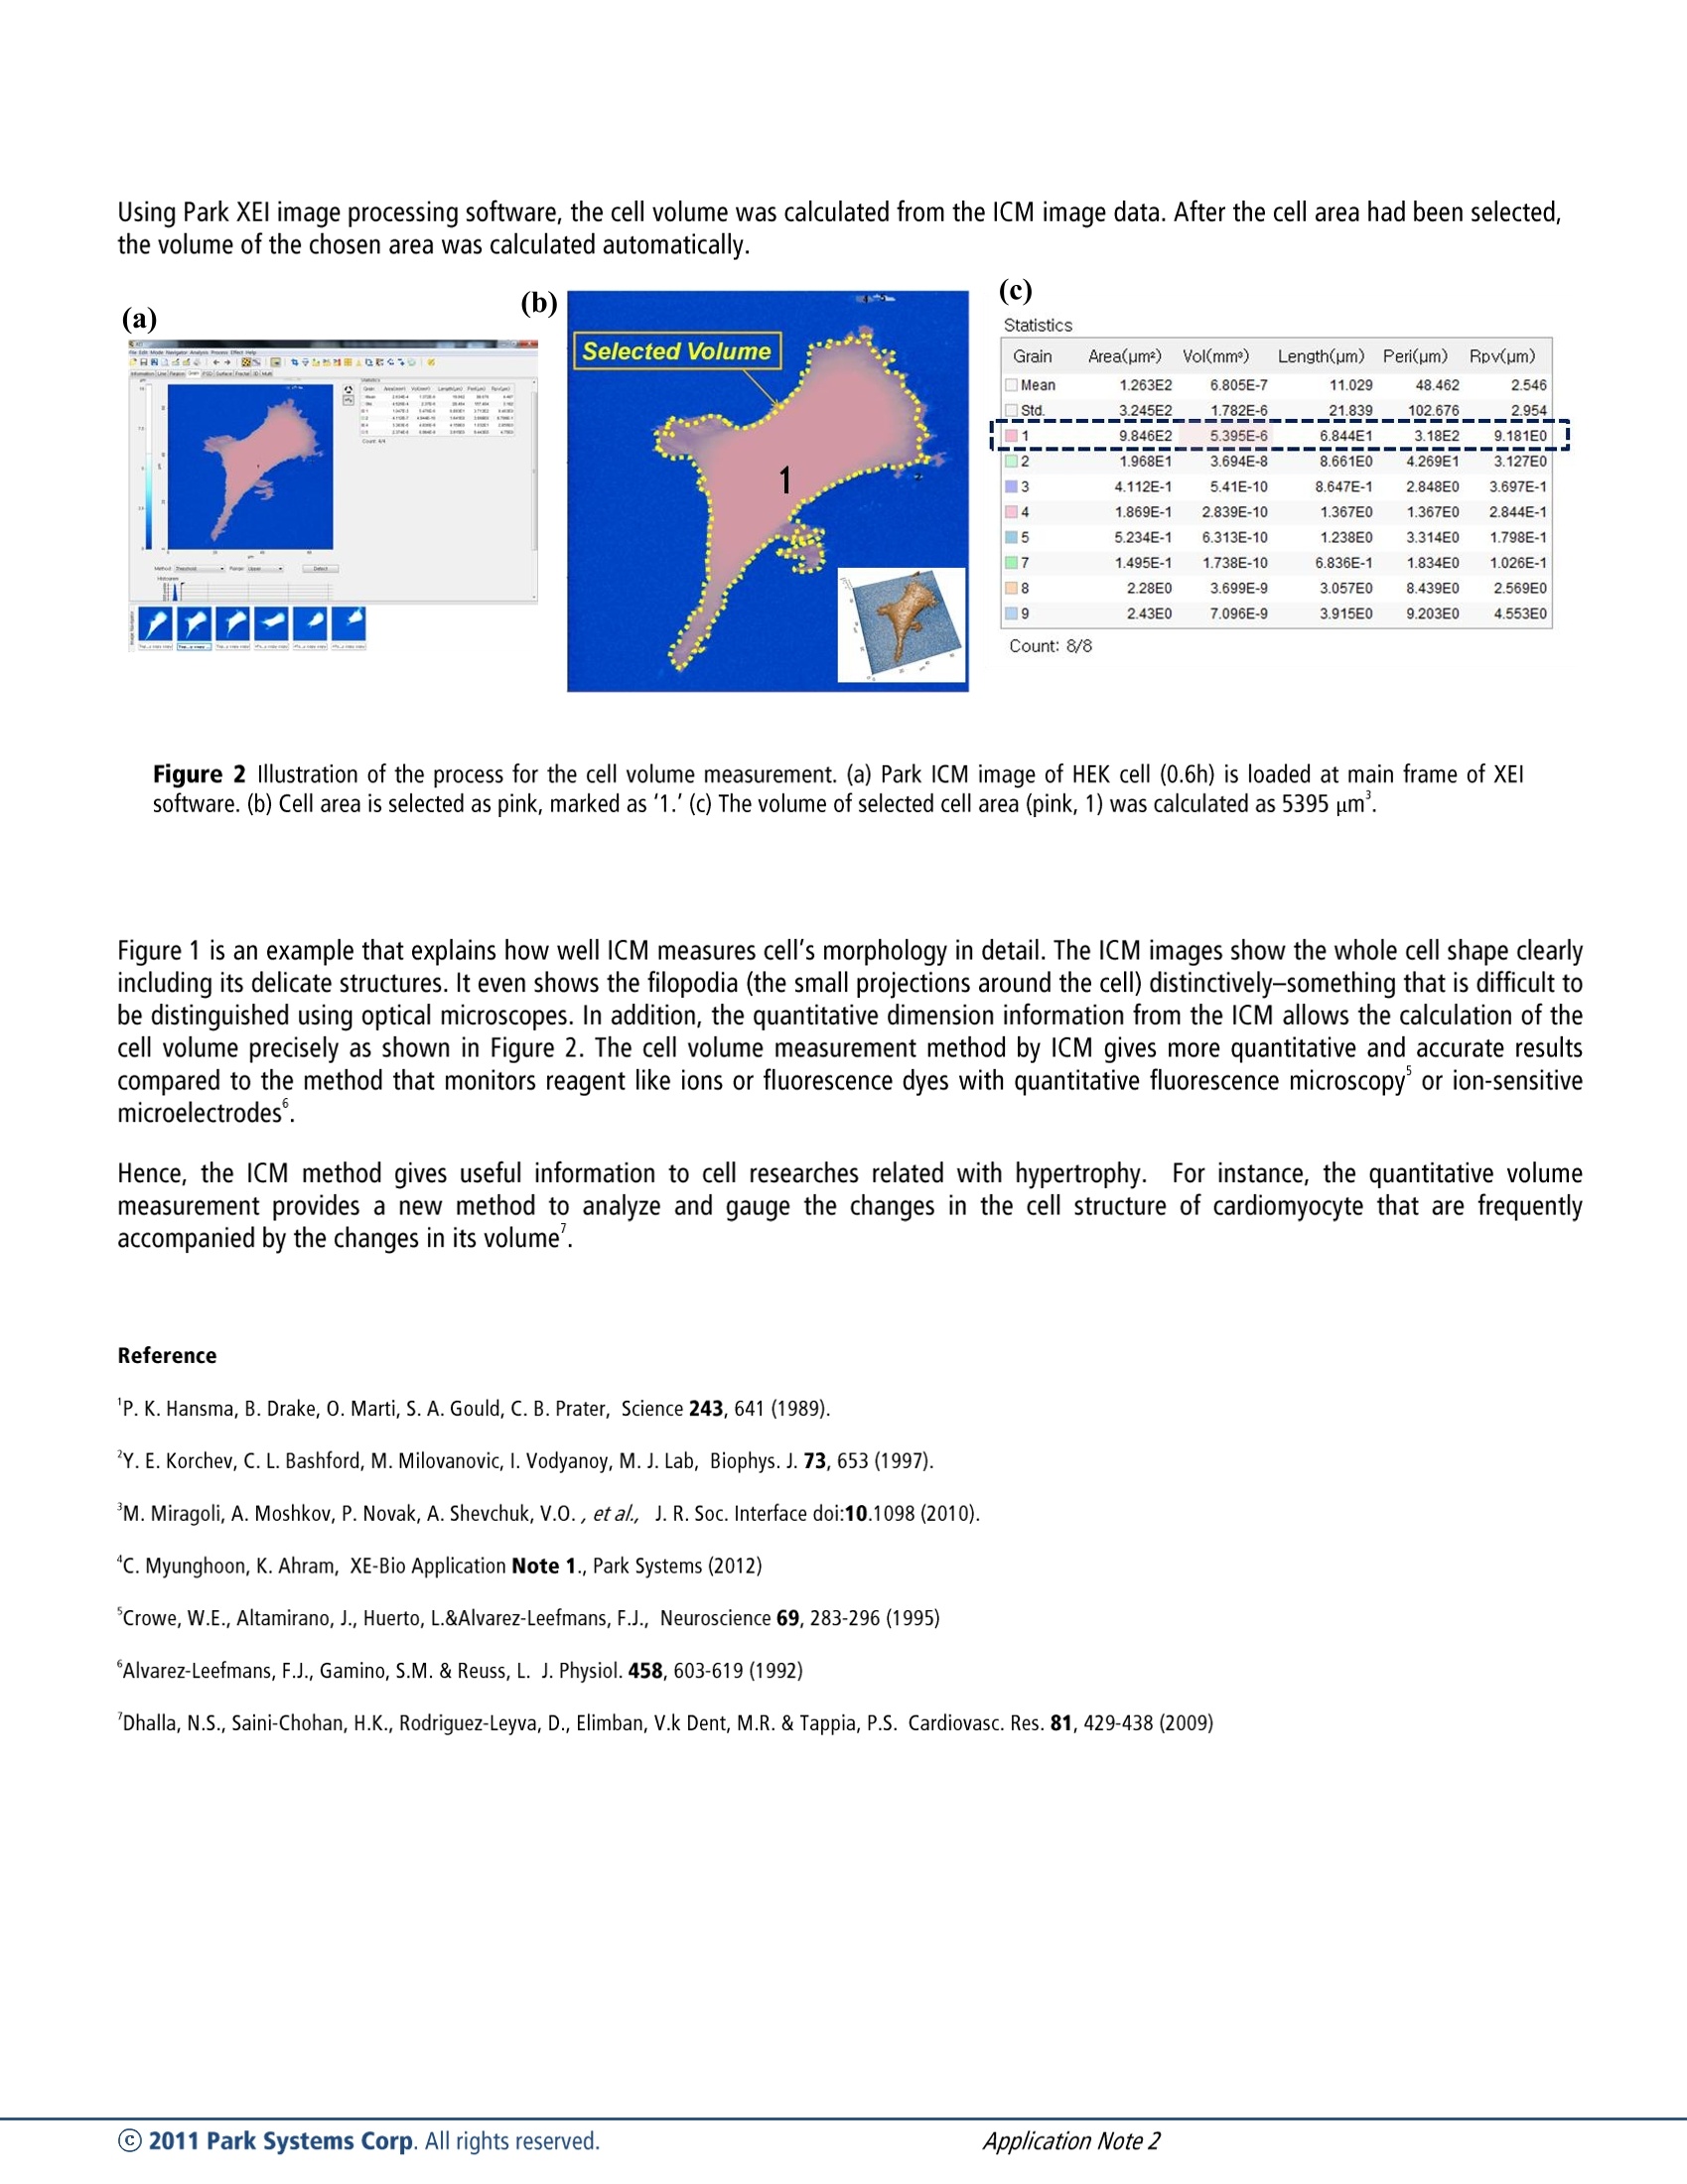
Park Systems Application Note For more information: info@parkAFM.com www.parkAFM.com Nanotechnology Solutions Partner Cell Volume Measurement of lon Conductance Microscopy Myunghoon Choi (Research Product Management of Park Systems, Seoul, Korea) lon conductance microscopy (ICM) is a useful tool for obtaining non-invasive images of cell surface topography. Recently, it is being usedfor imaging live cells in culture medium’. Cell volume is one of the important factors for cell research because the regulation of cell volumeis fundamental to cellular homeostatic mechanism. ICM can provide accurate volume measurement of cells due to its ability to acquirequantitative dimension information. Furthermore, it can calculate cell volume changes over time caused by physiological environment or itscell status changes. In this paper, live HEK293T cell was successfully imaged and its volume changes monitored using Park ICM . Human embryonic kidney(HEK) 293T cell was cultured on glass-coverslip in DMEM(dulbeco’s modified eagle medium) with 10% FBS(fetalbovine serum) containing 1% penicillin at 37 ℃ in a 5 % CO, humidified atmosphere (Multi Gas Cell Incubator, SANYO,JAPAN). Then, thegrown cell coverslip was transferred to the Live Cell Chamber installed in the Park XE-Bio ICM (Park Systems). While the cell was beingcultured in the live cell chamber (37℃,5 % Co,, and >70 % humidity), a live cell's images were acquired by ICM-ARS mode". The pipetteused for the ICM were pulled from borosilicate glass (0.D.,1.0 mm, I.D., 0.58 mm, length 90 mm; Warner Instruments, US) using a CO2-laser-based micropipette puller (P-2000, Sutter Instruments, Novato, US). The inner and outer diameters of the pipette were about100 nm and 200 nm, respectively. Figure 1 (a) Sequential HEK 293T live cell images. It took approx. 0.6 hour to obtain each image, and total of 3.3 hours for 6images. (b)Volume change of HEK 293T: the initial cell volume was 5008 um’;2.6 hours later it shrank to 3645 um. Using Park XEl image processing software, the cell volume was calculated from the ICM image data. After the cell area had been selected,the volume of the chosen area was calculated automatically. Figure 2 Illustration of the process for the cell volume measurement. (a) Park ICM image of HEK cell (0.6h) is loaded at main frame of XElsoftware. (b) Cell area is selected as pink, marked as'1.'(c) The volume of selected cell area (pink, 1) was calculated as 5395 um’. Figure 1 is an example that explains how well ICM measures cell's morphology in detail. The ICM images show the whole cell shape clearlyincluding its delicate structures. It even shows the filopodia (the small projections around the cell) distinctively-something that is difficult tobe distinguished using optical microscopes. In addition, the quantitative dimension information from the ICM allows the calculation of thecell volume precisely as shown in Figure 2. The cell volume measurement method by ICM gives more quantitative and accurate resultscompared to the method that monitors reagent like ions or fluorescence dyes with quantitative fluorescence microscopy’or ion-sensitivemicroelectrodes°. Hence, the ICM method gives useful information to cell researches related with hypertrophy. For instance, the quantitative volumemeasurement provides a new method to analyze and gauge the changes in the cell structure of cardiomyocyte that are frequentlyaccompanied by the changes in its volume. Reference ( P . K. Hansma, B. D r ake, O . M a rti, S . A. G ould, C. B. P rater, S cience 243,641 (1 9 89). ) ( Y .E. K o rchev, C. L . Bashford, M . Milovanovic, 1. V o dyanoy, M. J. L a b , Bi o phys. J. 7 3 , 653 (1997 ) . ) ( ' M. Miragoli, A. Moshkov, P. Novak, A. Shevchuk, V.O., et al.,J. R. Soc. Interface doi:10.1098(2010). ) ( “C. Myunghoon, K. Ahram, XE-Bio Application Note 1., Park Systems (2012) ) Crowe, W.E., Altamirano, J., Huerto, L.&Alvarez-Leefmans, F.J., Neuroscience 69,283-296(1995) Alvarez-Leefmans, F.J., Gamino, S.M. & Reuss, L. J. Physiol. 458, 603-619(1992) Dhalla, N.S., Saini-Chohan, H.K., Rodriguez-Leyva, D., Elimban, V.k Dent, M.R. & Tappia, P.S. Cardiovasc. Res.81, 429-438 (2009) Cell Volume Analysis Method) Park Systems Corp. All rights reserved.Application Note
确定
还剩1页未读,是否继续阅读?

Park帕克原子力显微镜为您提供《Cell Volume Measurement of Ion Conductance Microscopy》,该方案主要用于其他中--检测,参考标准--,《Cell Volume Measurement of Ion Conductance Microscopy》用到的仪器有
相关方案
更多