


方案详情
文
动态图像法是在样品运动的状态下进行颗粒表征,获取粒度粒形信息的一种方法。采用动态图像法能够全方位获取颗粒的形貌和粒径信息,例如纤维颗粒长度和宽度、长径比、卷曲度等。而静态法只能观察到颗粒的部分形貌和粒径,激光法等粒度分析法是将颗粒视做球形进行分析,因此,动态图像分析法是全方位获取颗粒形貌和粒径分布的最佳方法。
方案详情

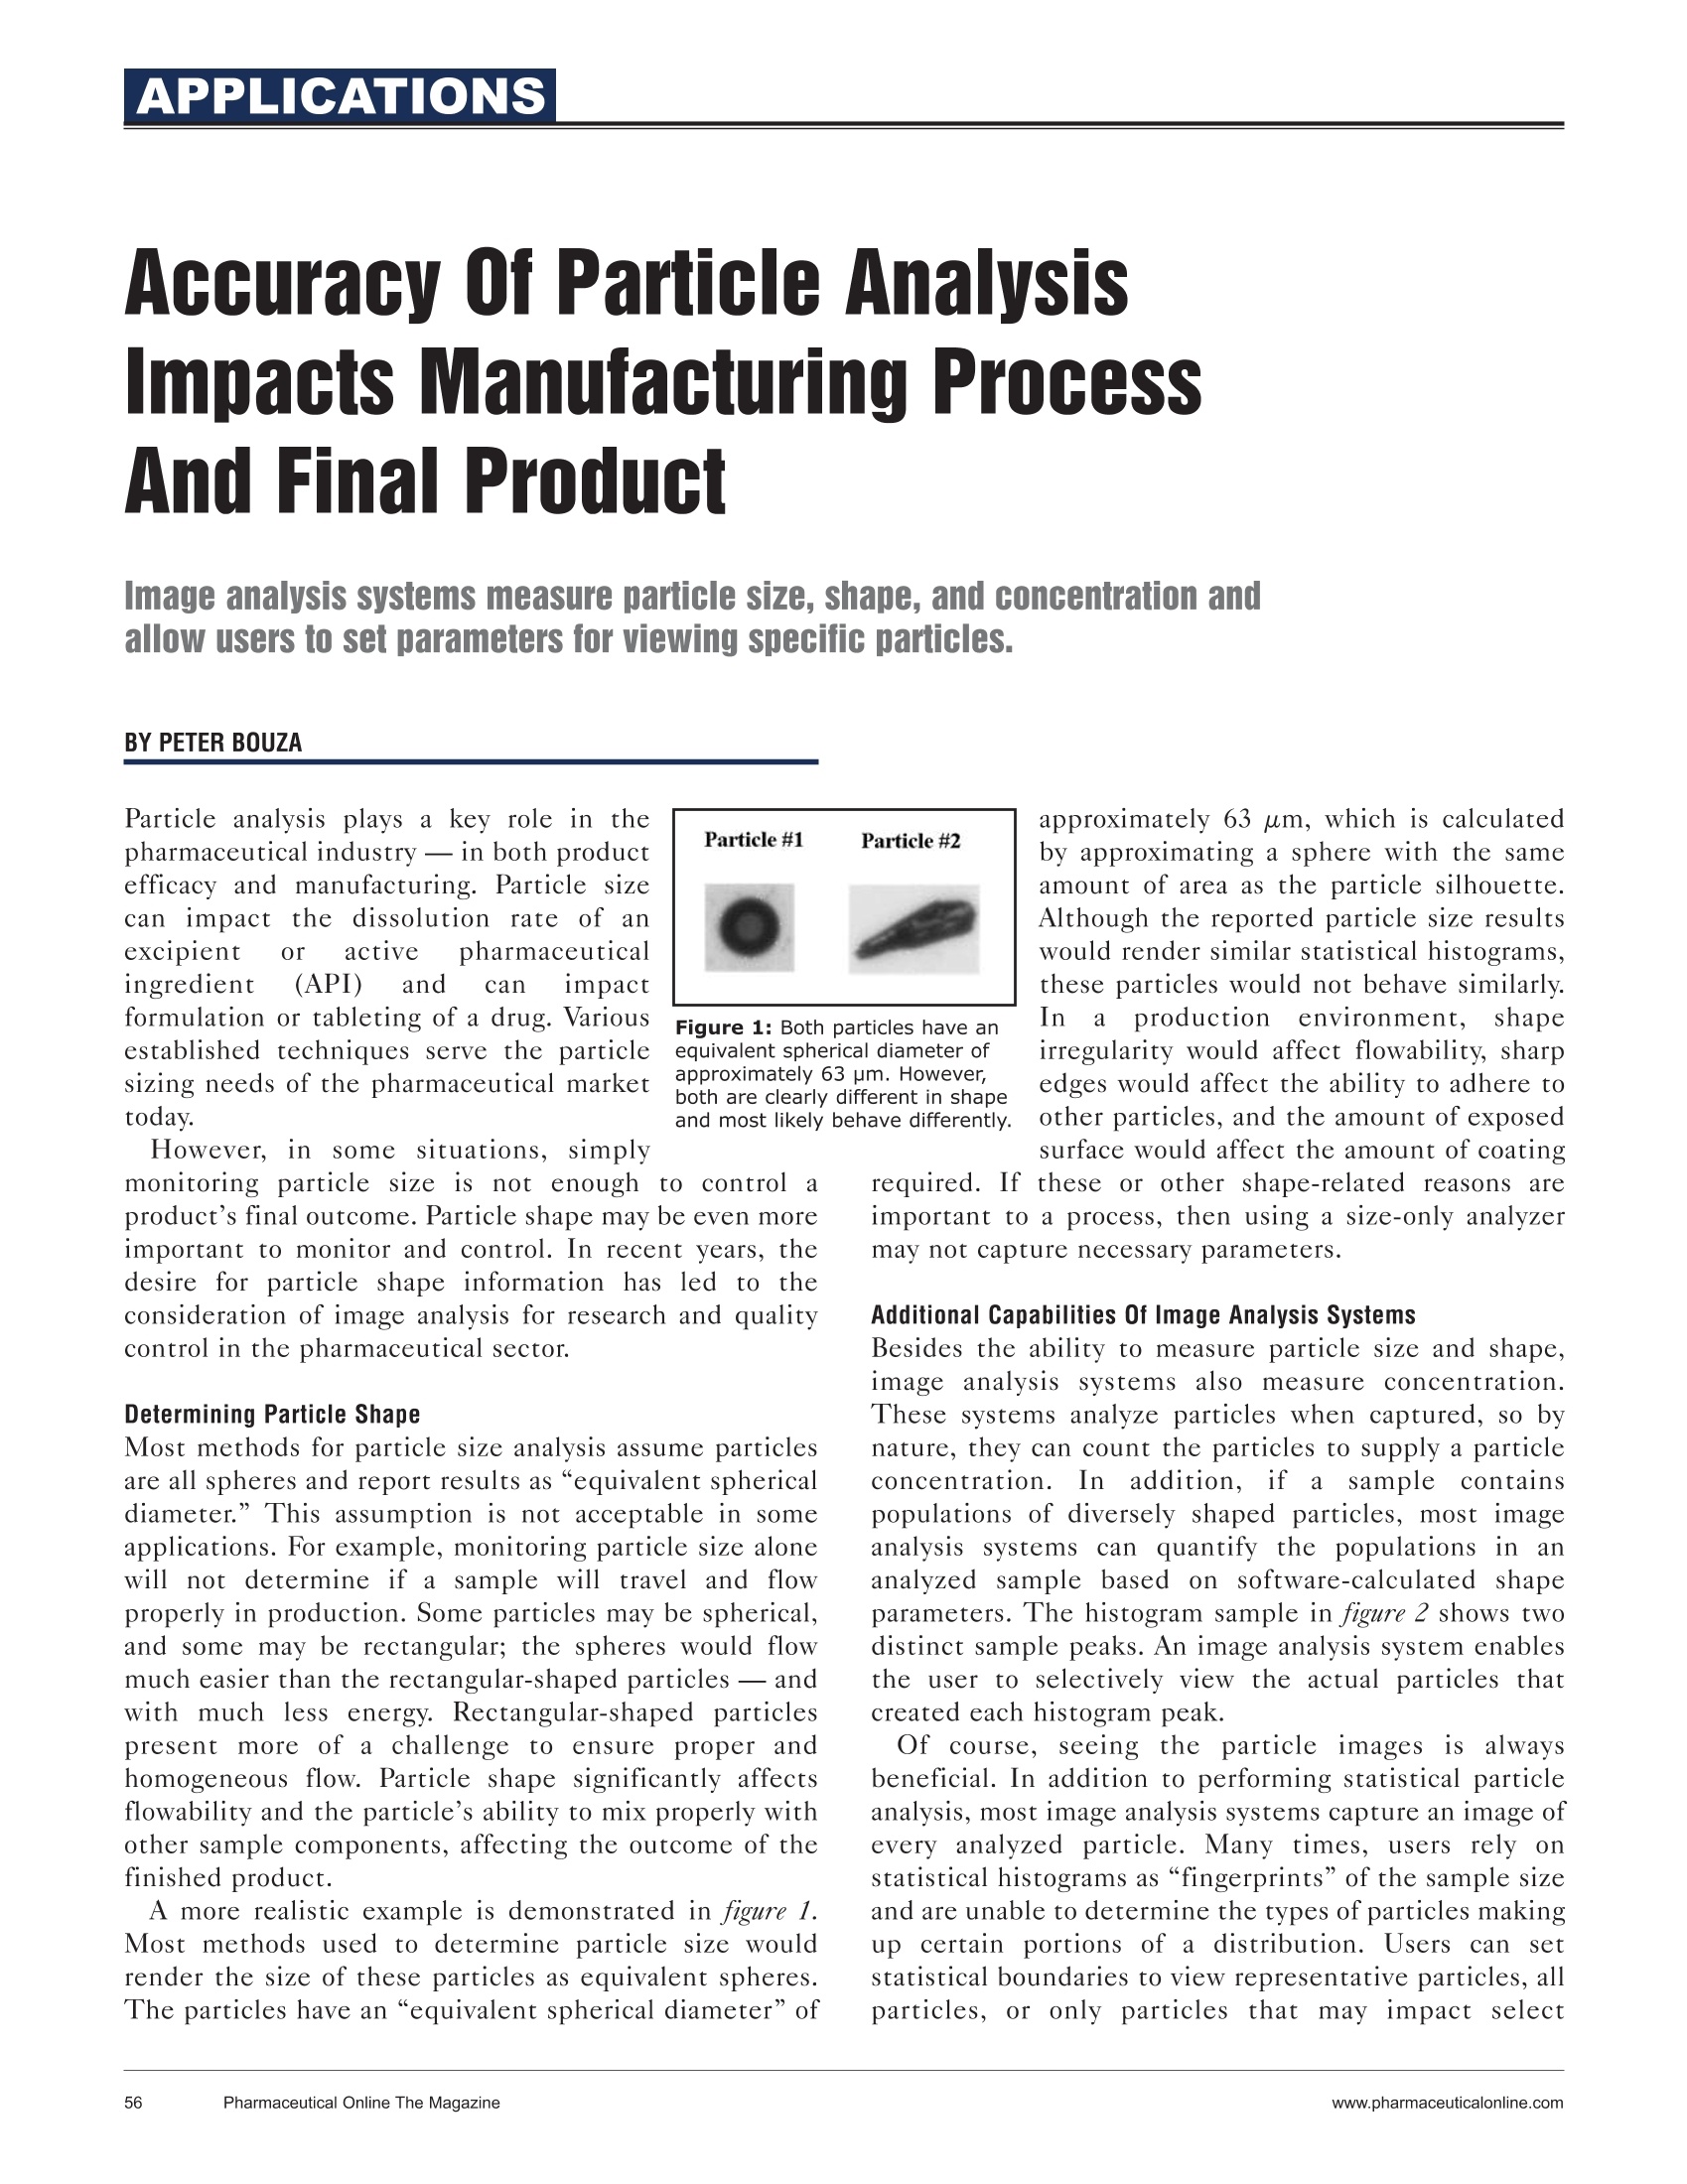
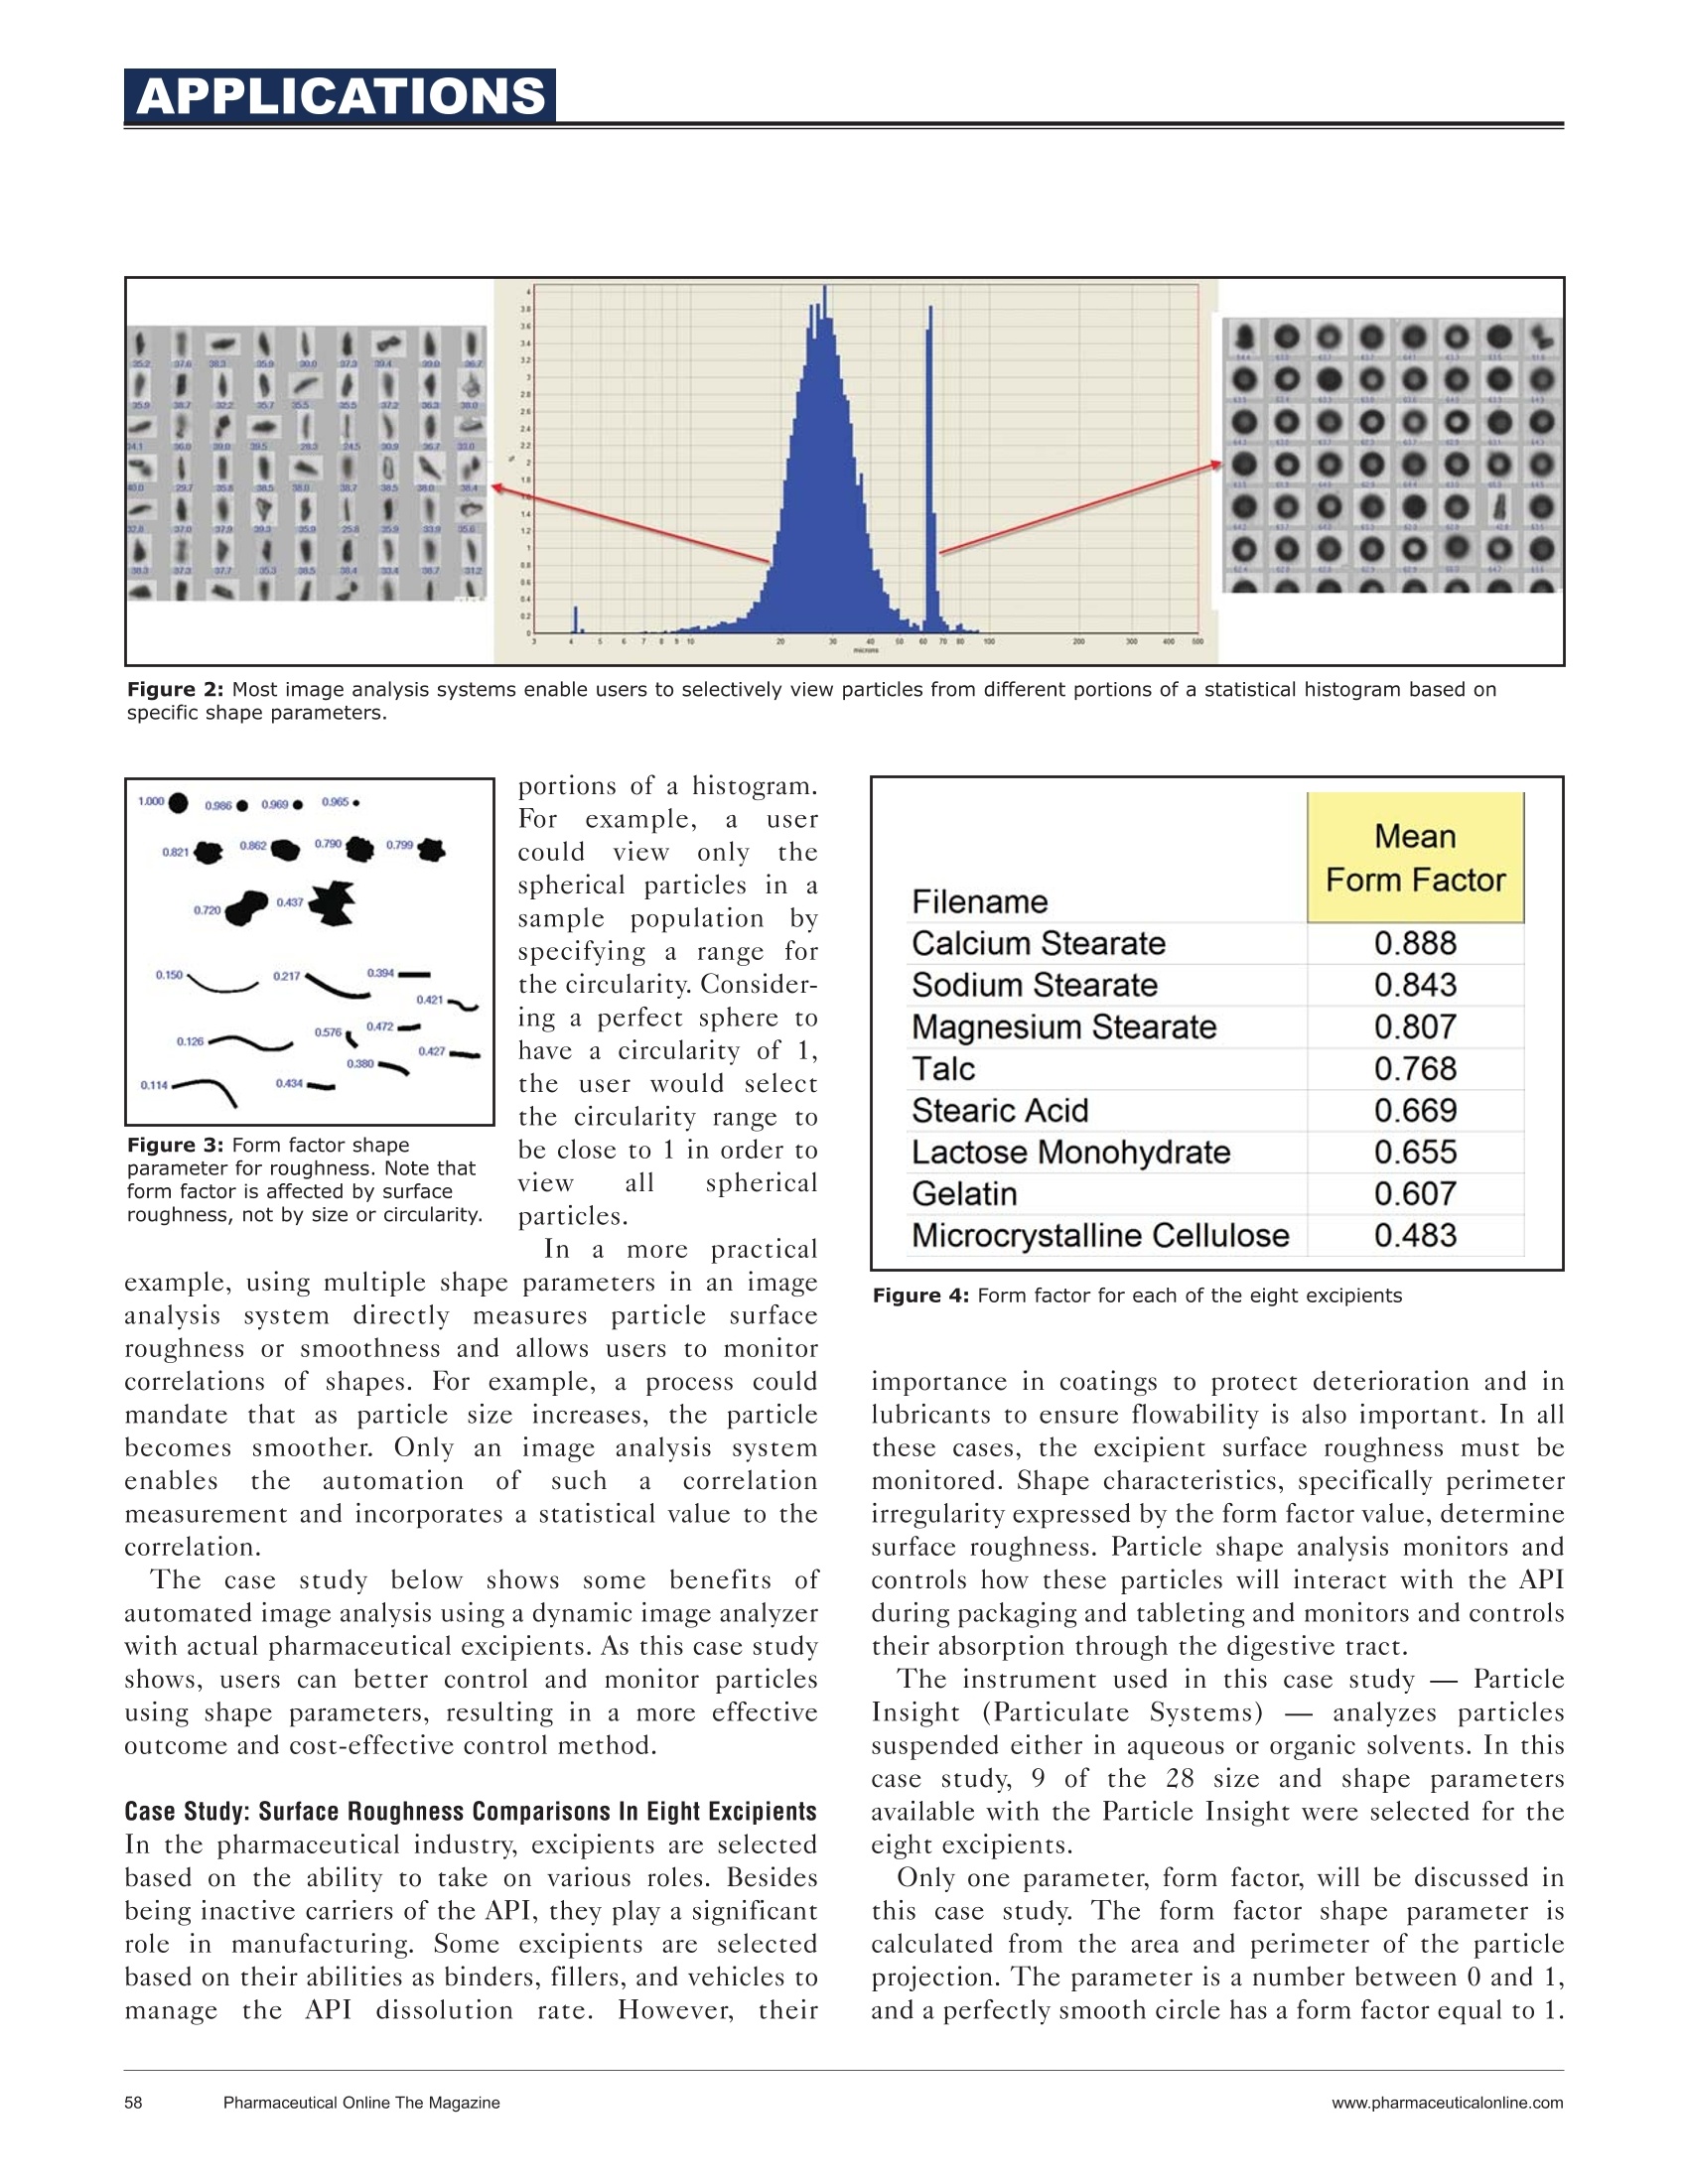
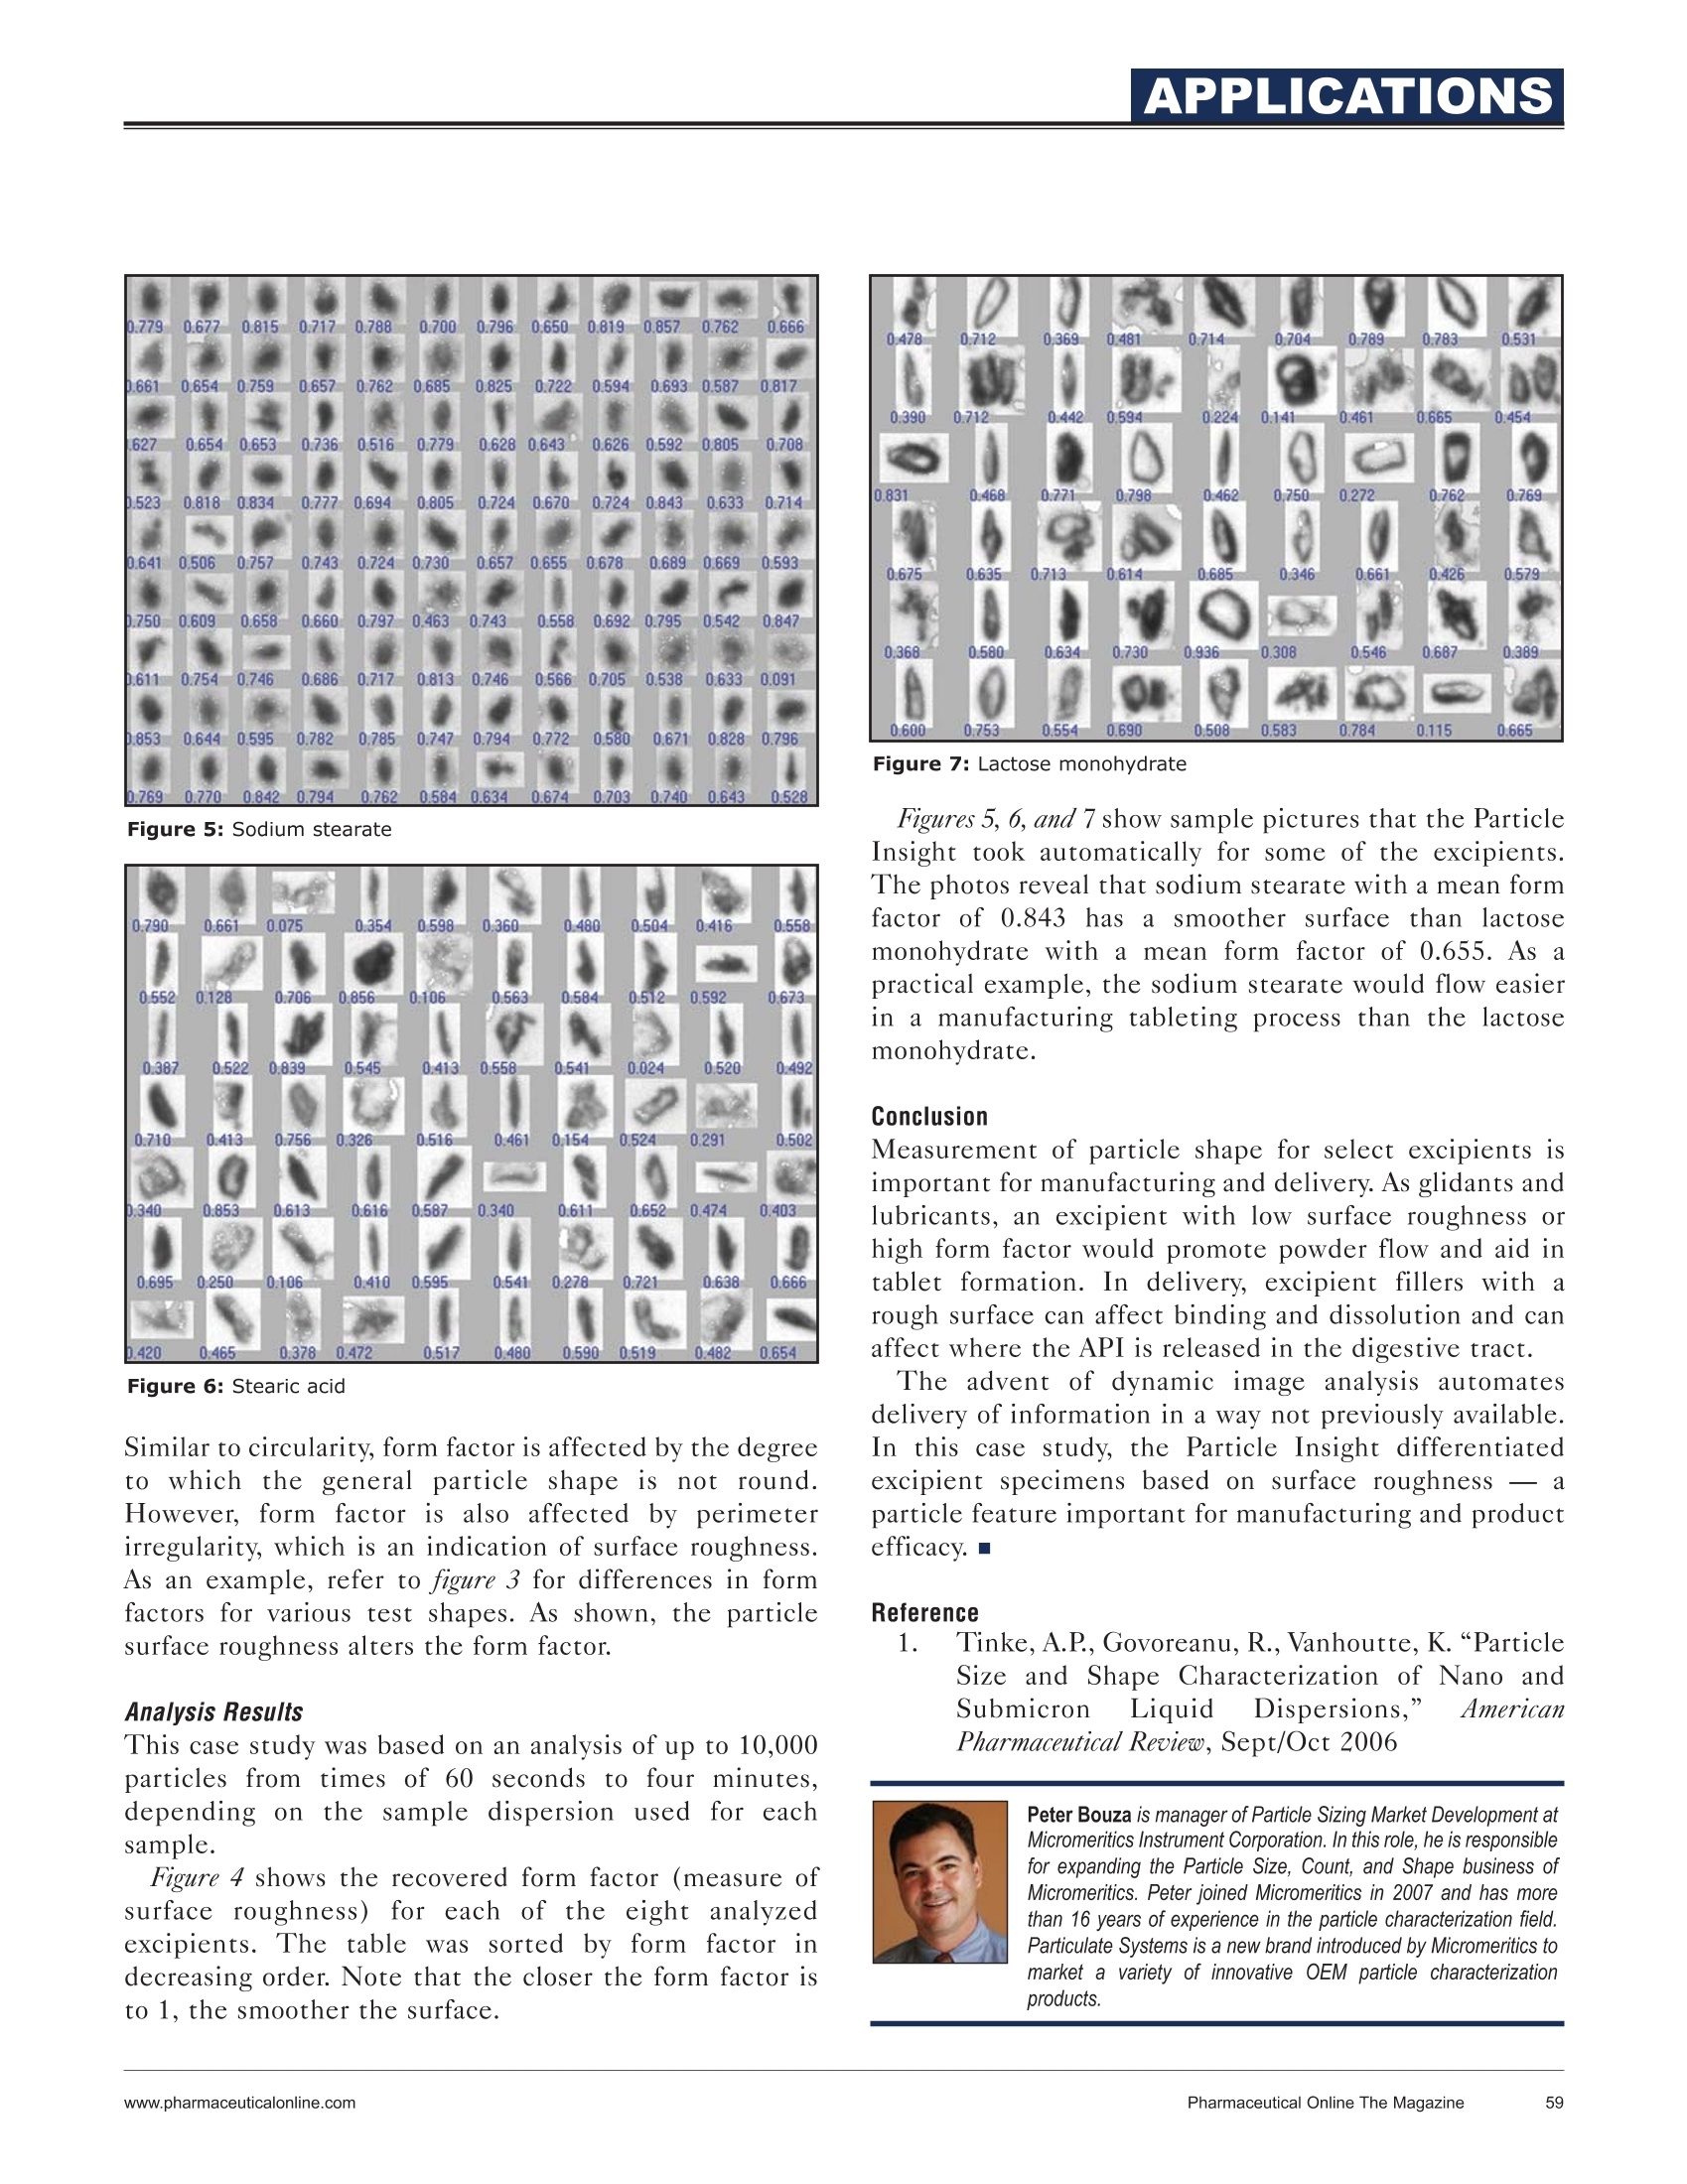
APPLICATIONS Accuracy Of Particle AnalysisImpacts Manufacturing ProcessAnd Final Product Image analysis systems measure particle size, shape, and concentration andallow users to set parameters for viewing specific particles. Particle analysis plays a key role in thepharmaceutical industry - in both productefficacy and manufacturing. Particle sizecan impact the dissolution rate of anexcipient or active pharmaceuticalingredient (API) and can impactformulation or tableting of a drug. Variousestablished techniques serve the particlesizing needs of the pharmaceutical markettoday. approximately 63 um, which is calculatedby approximating a sphere with the sameamount of area as the particle silhouette.Although the reported particle size resultswould render similar statistical histograms,these particles would not behave similarlyIn aaproductionnenvironment,,shapeirregularity would affect flowability, sharpedges would affect the ability to adhere toother particles, and the amount of exposedsurface would affect the amount of coatingare monitoring particle size is not enough to controll aproduct’s final outcome. Particle shape may be even moreimportant to monitor and control. In recent years, thedesire for particle shape information has led to theconsideration of image analysis for research and qualitycontrol in the pharmaceutical sector. Determining Particle Shape Most methods for particle size analysis assume particlesare all spheres and report results as “equivalent sphericaldiameter.”This assumption is not acceptable in someapplications. For example, monitoring particle size alonewill not determine if a sample will travel and flowproperly in production. Some particles may be spherical,and some may be rectangular; the spheres would flowmuch easier than the rectangular-shaped particles -andwith much less energy. Rectangular-shaped particlespresent more of a challenge to ensure proper andhomogeneous flow. Particle shape significantly affectsflowability and the particle's ability to mix properly withother sample components, affecting the outcome of thefinished product. A more realistic example is demonstrated in figure 1.Most methods used to determine particle size wouldrender the size of these particles as equivalent spheres.The particles have an “equivalent spherical diameter”of required. If these or other shape-related reasonsimportant to a process, then using a size-only analyzermay not capture necessary parameters. Additional Capabilities Of Image Analysis Systems Besides the ability to measure particle size and shape,image analysiss systems also measure concentration.These systems analyze particles when captured, so bynature, they can count the particles to supply a particleconcentration.In addition, if asample containspopulations of diversely shaped particles, most imageanalysisIs. systems can quantify the populationsiSirinananalyzed sample based on software-calculated shapeparameters. The histogram sample in figure 2 shows twodistinct sample peaks. An image analysis system enablesthe user to selectively viewthe actual particles thaticreated each histogram peak. Of course, seeingparticle imagesi athelwaysbeneficial. In addition to performing statistical particleanalysis, most image analysis systems capture an image ofevery analyzed particle. Many times, users rely onstatistical histograms as “fingerprints”of the sample sizeand are unable to determine the types of particles makingup certain portions of a distribution. Users can setstatistical boundaries to view representative particles, allparticles, or only particles that ti may impact select Figure 2: Most image analysis systems enable users to selectively view particles from different portions of a statistical histogram based onspecific shape parameters. Figure 3: Form factor shapeparameter for roughness. Note thatform factor is affected by surfaceroughness, not by size or circularity. portions of a histogram.For example, a usercould view only thespherical particles in asample population byspecifying a range forthe circularity. Consider-ing a perfect sphere tohave a circularity of 1,the user would selectthe circularity range tobe close to 1 in order toview all sphericalparticles. In a more practical example, using multiple shape parameters in an imageanalysissystemdirectly measures particlee surfaceroughness or smoothness and allows users to monitorcorrelations of shapes. For example, a process couldmandate that as particle size increases, the particlebecomessmoother. Only an image analysissystemenables the automation of such a correlationmeasurement and incorporates a statistical value to thecorrelation. The; caseestudy belowy showssomebenefitsofautomated image analysis using a dynamic image analyzerwith actual pharmaceutical excipients. As this case studyshows, users can better control and monitor particlesusing shape parameters, resulting in a more effectiveoutcome and cost-effective control method. Case Study: Surface Roughness Comparisons In Eight ExcipientsIn the pharmaceutical industry, excipients are selectedbased on the ability to take on various roles. Besidesbeing inactive carriers of the API, they play a significantrole in manufacturing. Some excipients are selectedbased on their abilities as binders, fillers, and vehicles tomanagethe API cdissolutionrate. jHowever, their MeanForm Factor Calcium Stearate 0.888 Sodium Stearate 0.843 Magnesium Stearate 0.807 Talc 0.768 Stearic Acid 0.669 Lactose Monohydrate 0.655 Gelatin 0.607 Microcrystalline Cellulose 0.483 Figure 4: Form factor for each of the eight excipients importance in coatings to protect deterioration and inlubricants to ensure flowability is also important. In allthese cases, the excipient surface roughness must bemonitored. Shape characteristics, specifically perimeterirregularity expressed by the form factor value, determinesurface roughness. Particle shape analysis monitors andcontrols how these particles will interact with the APIduring packaging and tableting and monitors and controlstheir absorption through the digestive tract. The instrument used in thisScase study-ParticleInsightt (Particulate Systems)-analyzes jparticlessuspended either in aqueous or organic solvents. In thiscase study, 9 of the 28 size and shape parametersavailable with the Particle Insight were selected for theeight excipients. Only one parameter, form factor, will be discussed inthis case study. The form factor shape parameter iscalculated from the area and perimeter of the particleprojection. The parameter is a number between 0 and 1,and a perfectly smooth circle has a form factor equal to 1. 0.779 1.6616271.5230.6410.7500.611 1.853 0.769 0.677 0.6540.6540.8180.5060.6090.754 0.644 0.770 0.815 0.7590.6530.8340.7570.6580.746 0.595 0.842 0.717 0.6570.7360.7770.7430.6600.686 0.782 0.794 0.788 0.7620.5160.6940.7240.79710.717 0.785 0.762 0.700 0.6850.7790.8050.7300.4630.813 0.747 0.584 0.796 0.8250.6280.7240.6570.7430.746 0.794 0.634 0.650 0.7220.6430.6700.6550.5580.566 0.772 0.674 0.8190.857 0.5940.6260.7240.6780.705 0.580 0.703 0.6930.5920.8050.8430.6890.6920.7950.538 0.671 0.740 0.762 0.5870.6330.6690.5420.633 0.828 0.643 0.666 0.8170.7080.7140.5930.8470.091 0.796 0.528 Figure 5: Sodium stearate Figure 6: Stearic acid Similar to circularity, form factor is affected by the degreetowhich the general particle shape isISnot round.However, form factor is also affected by perimeterirregularity, which is an indication of surface roughness.As an example, refer to figure 3 for differences in formfactors for various test shapes. As shown, the particlesurface roughness alters the form factor. Analysis Results This case study was based on an analysis of up to 10,000particles from times of 60 seconds to four minutes,depending on tthe sample dispersion used for eachsample. Figure 4 shows the recovered form factor (measure ofsurface roughness) for each of the eight analyzedexcipients. The table was sorted by form factor indecreasing order. Note that the closer the form factor isto 1, the smoother the surface. Figure 7: Lactose monohydrate Figures 5, 6, and 7 show sample pictures that the ParticleInsight took automatically for some of the excipients.The photos reveal that sodium stearate with a mean formfactor of 0.843 has a smoother surface than lactosemonohydrate with a mean form factor of 0.655. As apractical example, the sodium stearate would flow easierin a manufacturing tableting process than the lactosemonohydrate. Conclusion Measurement of particle shape for select excipients isimportant for manufacturing and delivery.As glidants andlubricants, an excipient with low surface roughness orhigh form factor would promote powder flow and aid intablet formation. In delivery, excipient fillers with arough surface can affect binding and dissolution and canaffect where the API is released in the digestive tract. The advent of dynamic image analysis automatesdelivery of information in a way not previously available.In this case study, the Particle Insight differentiatedexcipient specimens based on surface roughness - aparticle feature important for manufacturing and productefficacy.▪ Reference 1. Tinke, A.P., Govoreanu, R., Vanhoutte, K.“ParticleSize and Shape Characterization of Nano andSubmicron Liquid Dispersions,” AmericanPharmaceutical Review, Sept/Oct 2006 ( P eter Bouza is manager of Particle Sizing Market Development at M icromeritics Instrument Corporation. In th i s role, h e is r esponsiblefor expanding the Particle S ize, C ount, a nd S h ape business ofMicromeritics. Peter joined Micromeritics in 200 7 and has more t han 16 years of experience in the particle c h aracterization f i eld. P articulate Systems is a new brand introduced by Micromeritics tomarket a v a riety o f i n novative OEM par t icle cha r acterization products. ) harmaceutical Online The Magazinewww.pharmaceuticalonline.com ww.pharmaceuticalonline.comPharmaceutical Online The Magazine
确定
还剩1页未读,是否继续阅读?

麦克默瑞提克(上海)仪器有限公司为您提供《美国麦克颗粒图像分析优势——颗粒分析精确度影响着生产过程和最终产品》,该方案主要用于其他中--检测,参考标准--,《美国麦克颗粒图像分析优势——颗粒分析精确度影响着生产过程和最终产品》用到的仪器有
相关方案
更多