


飞纳台式扫描电镜独有的低真空技术,能够最大限度的保持样品的形貌,使得细胞类样品不易变形,低加速电压与CeB6灯丝结合,能够提供清晰的微观形貌。
方案详情

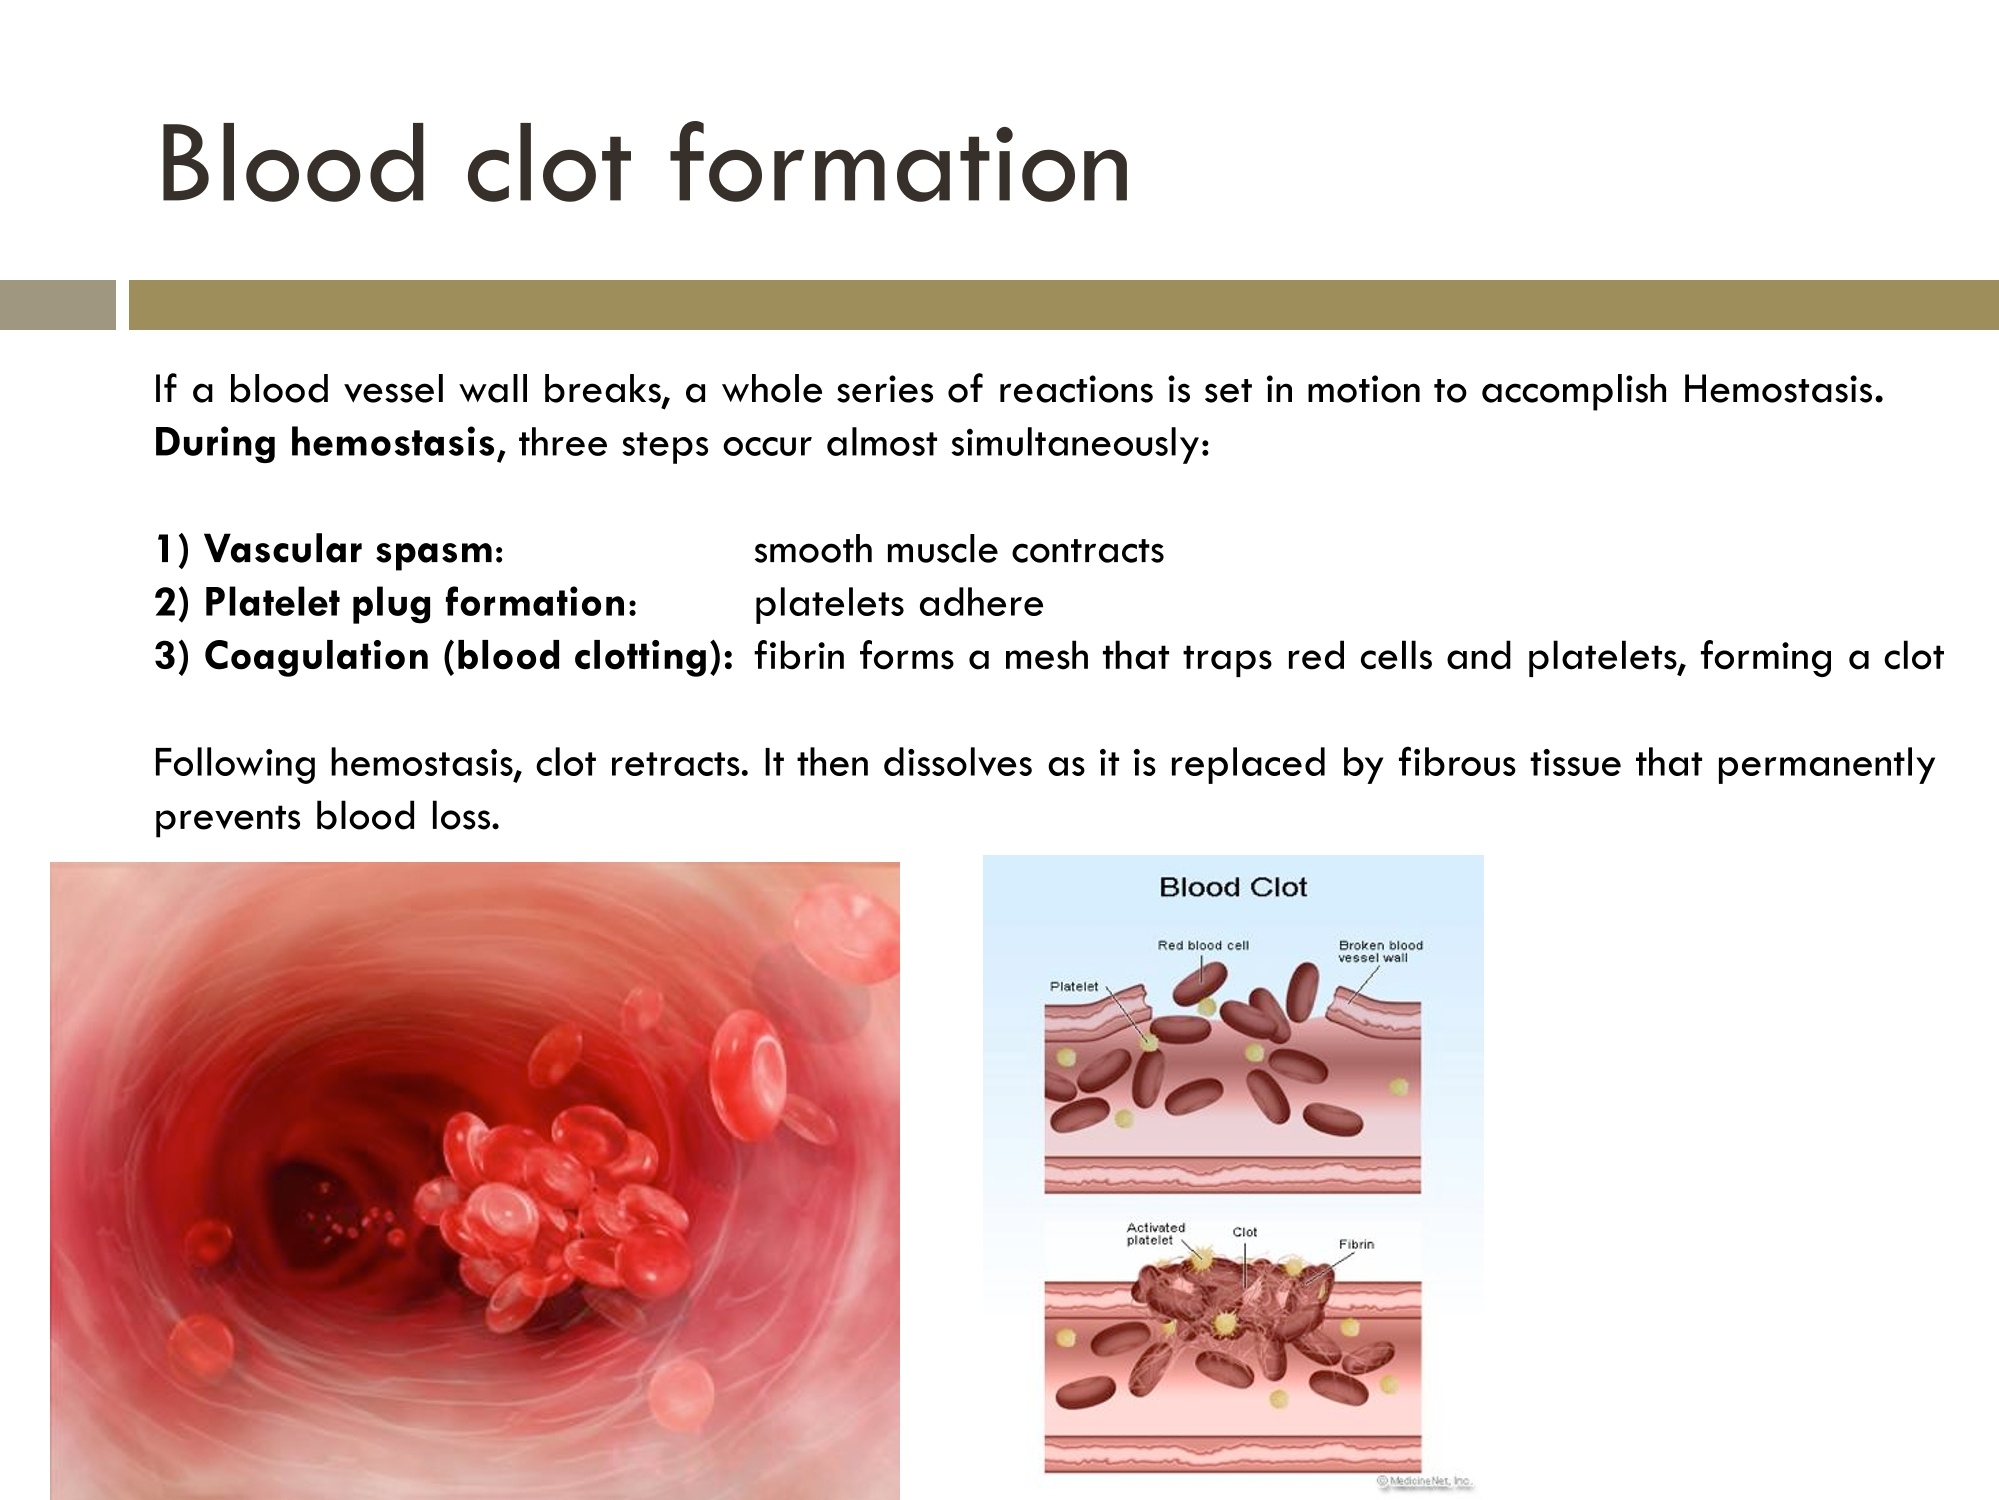
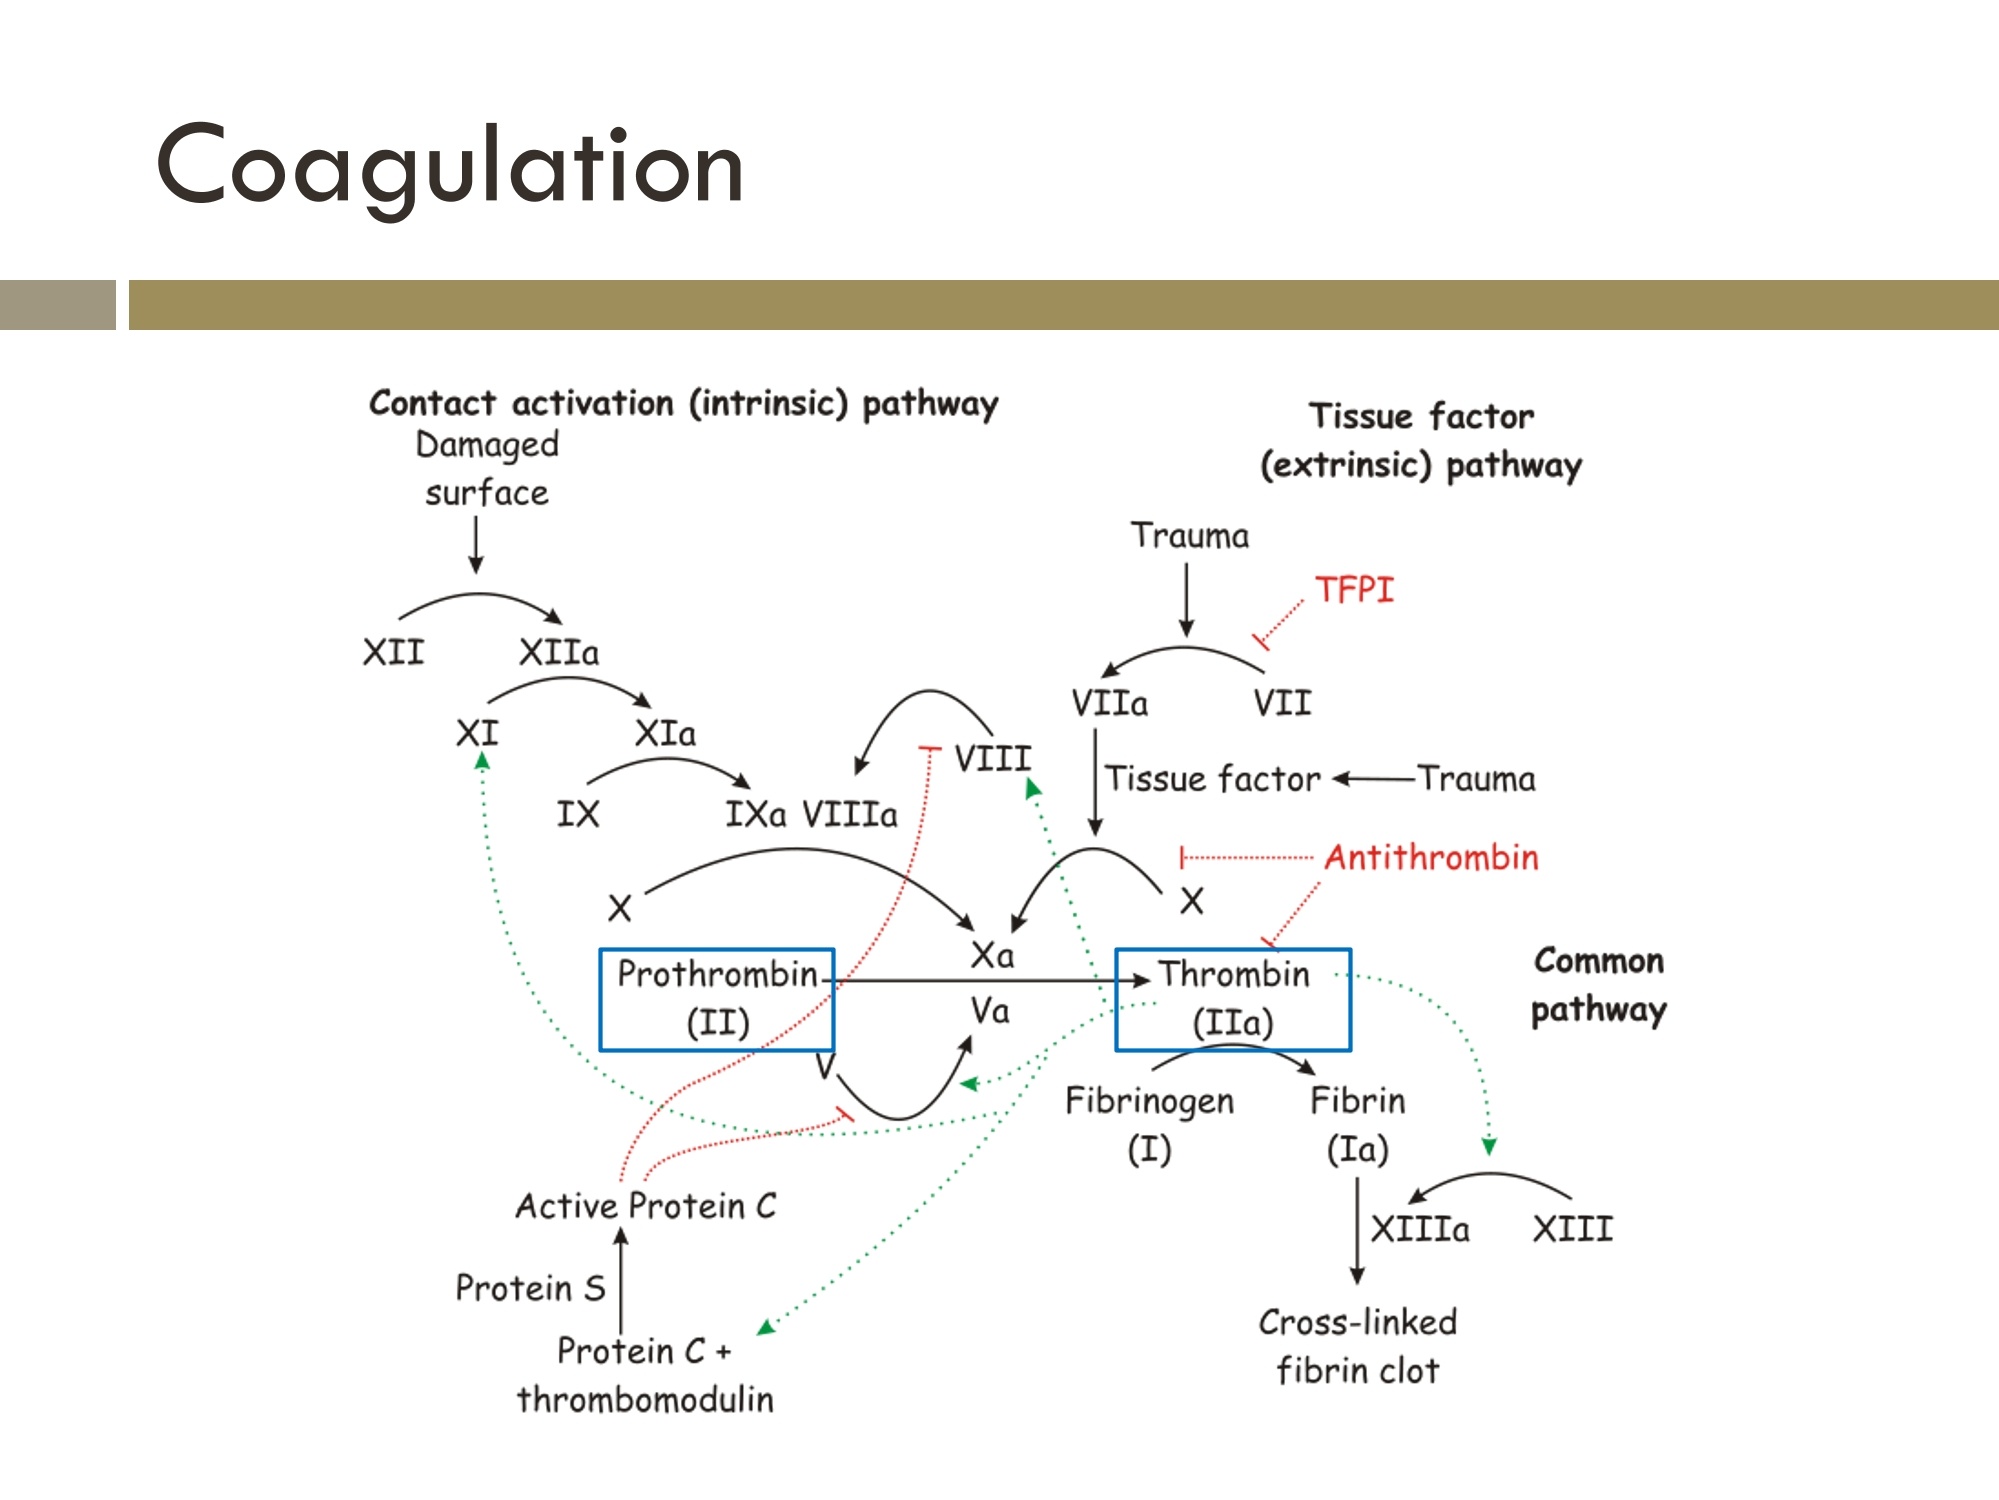
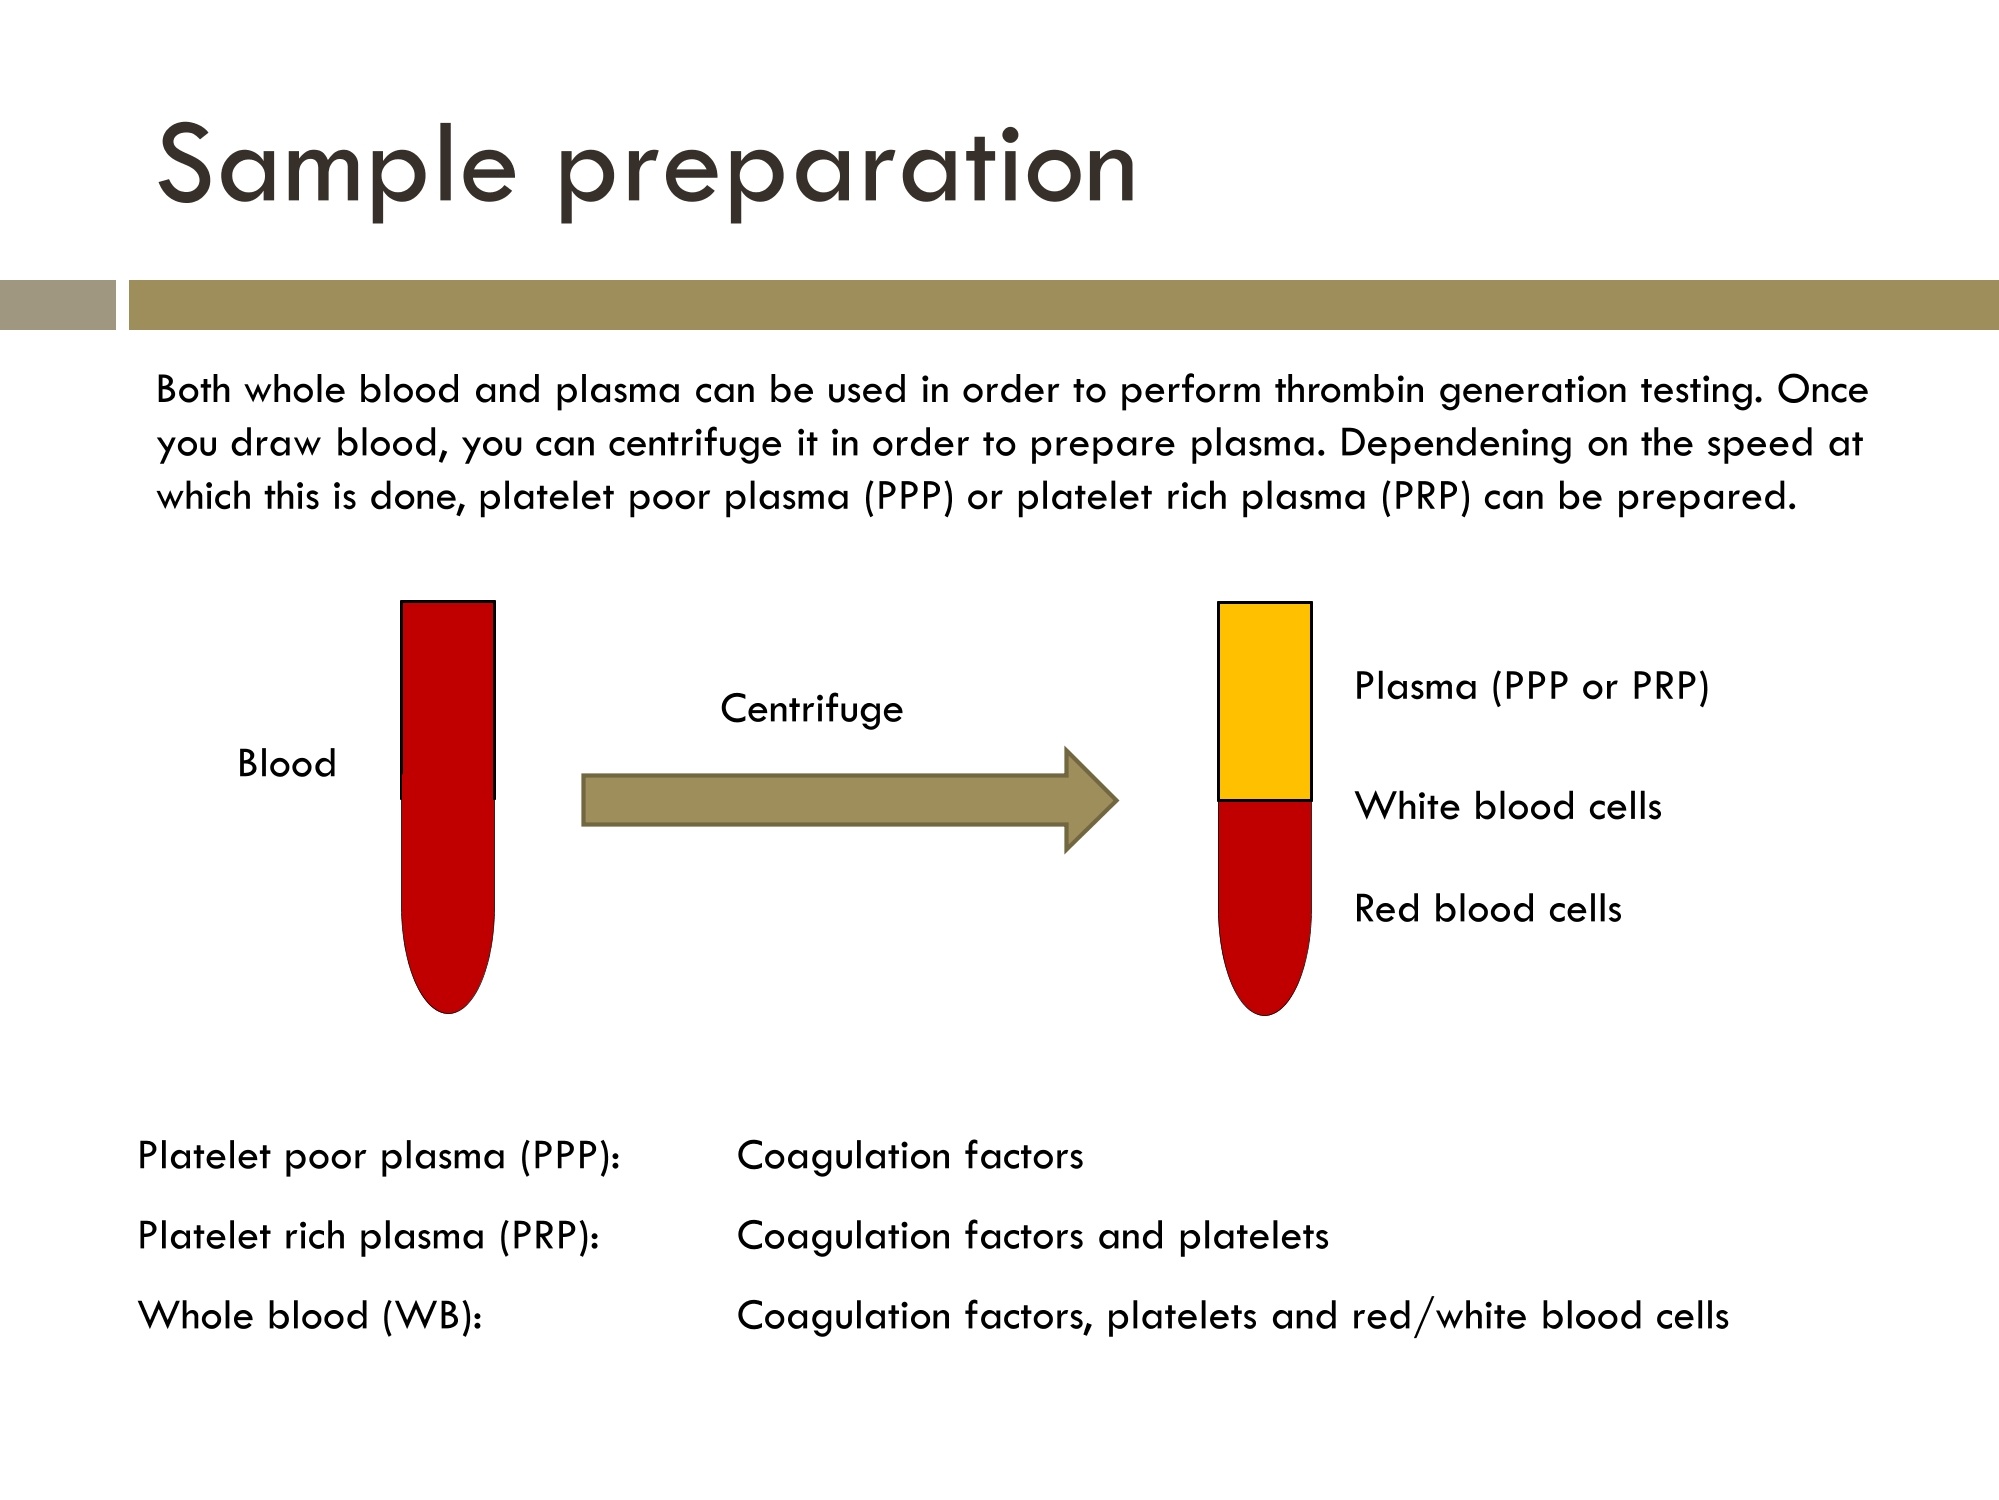
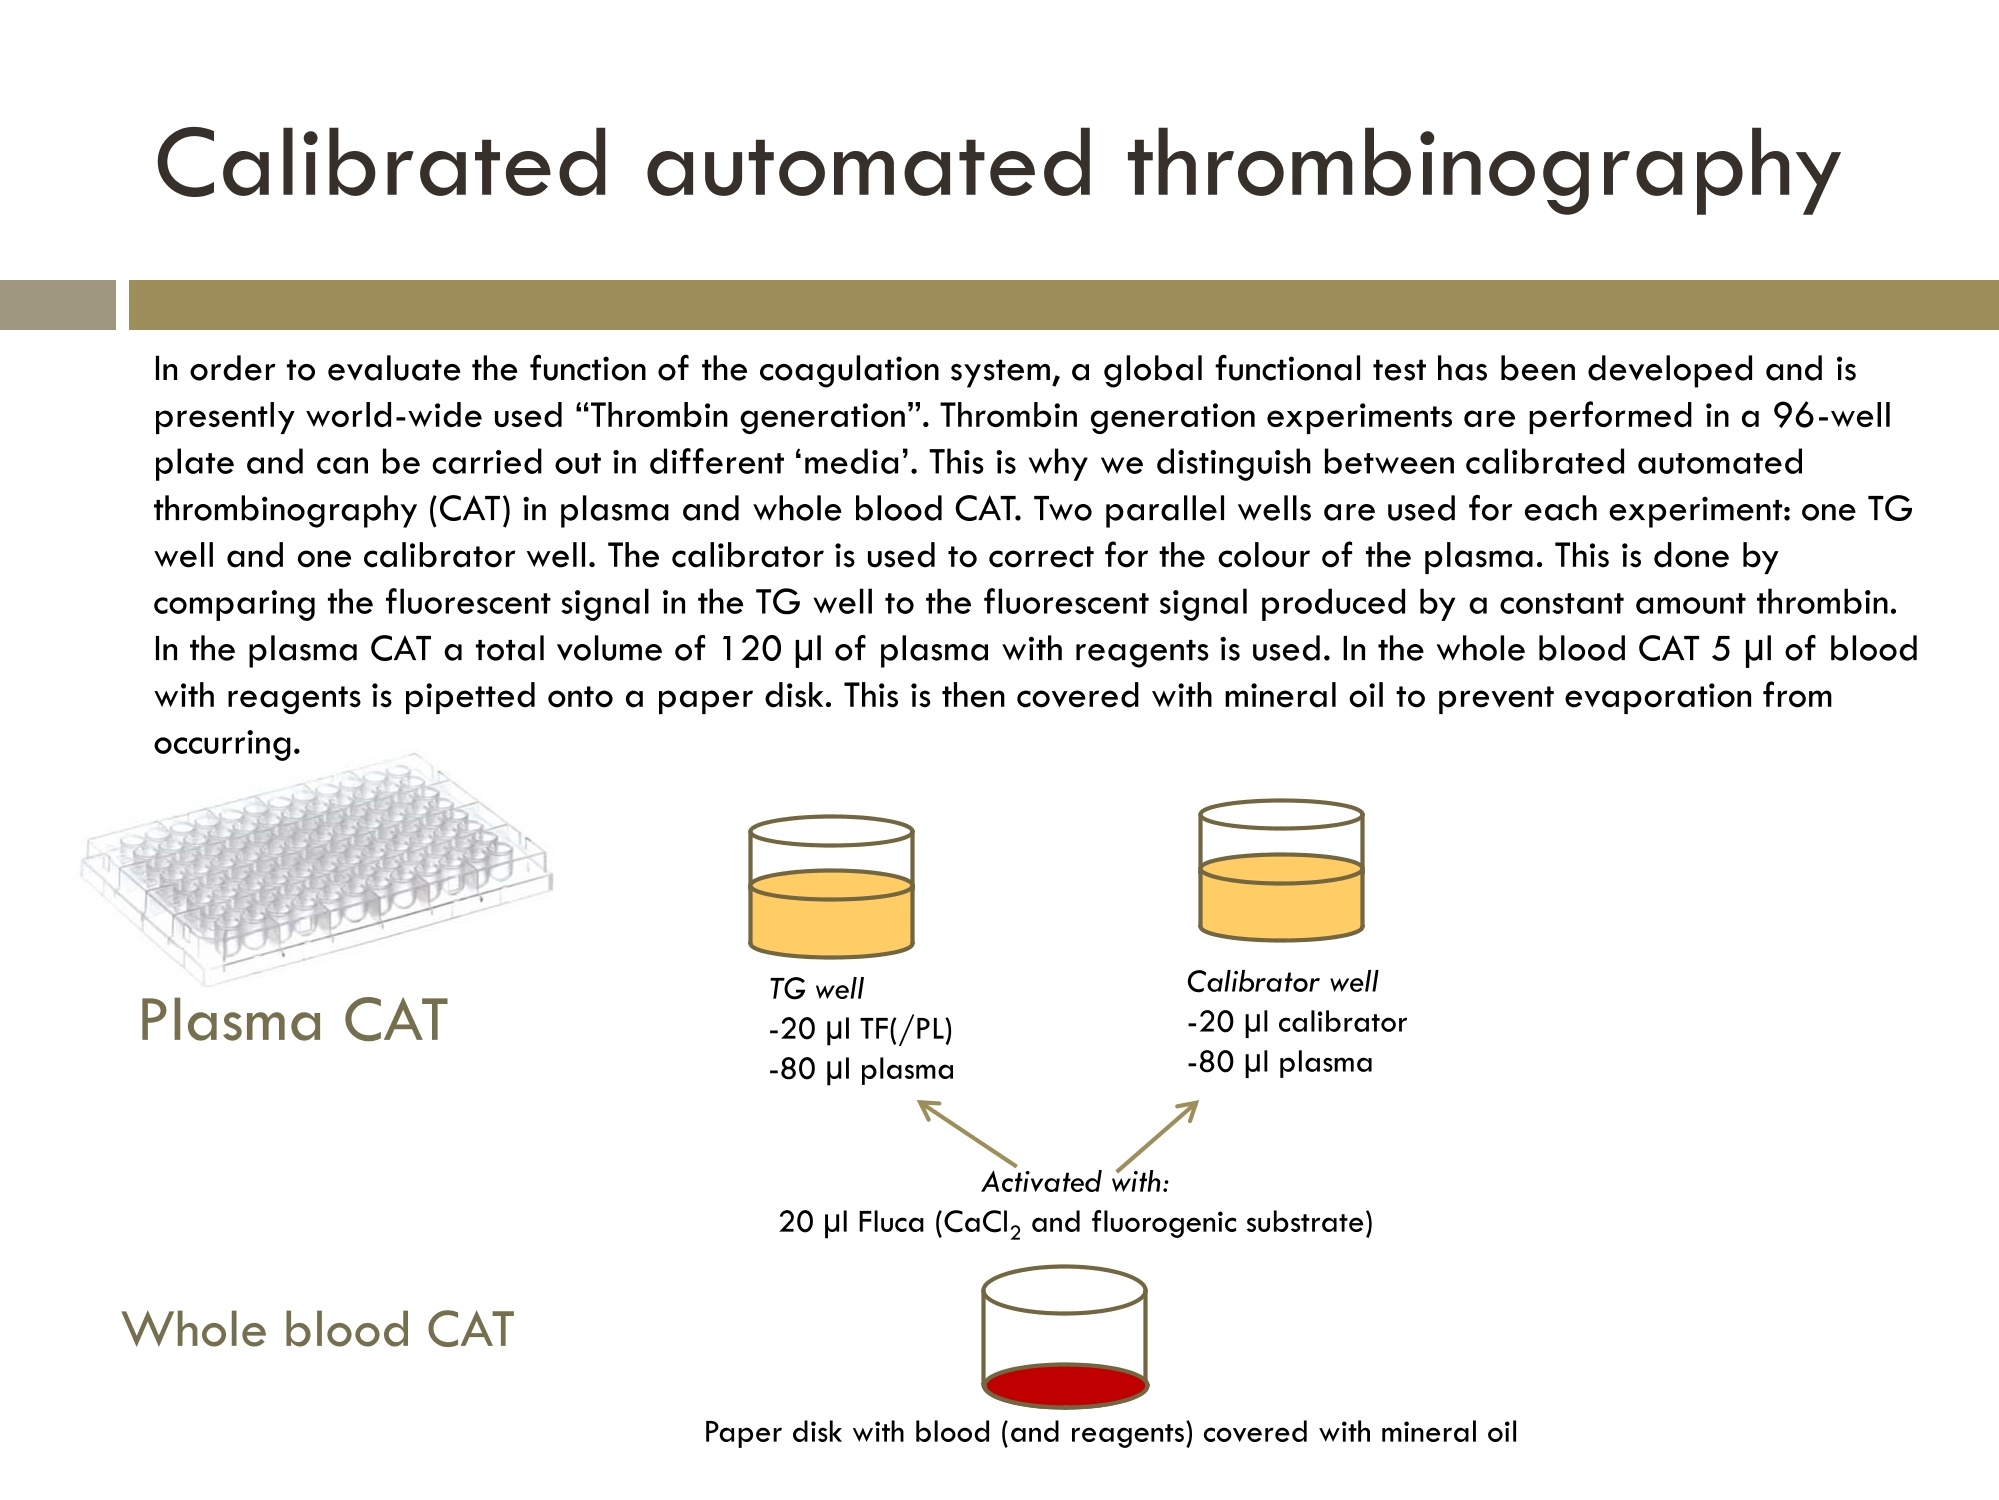
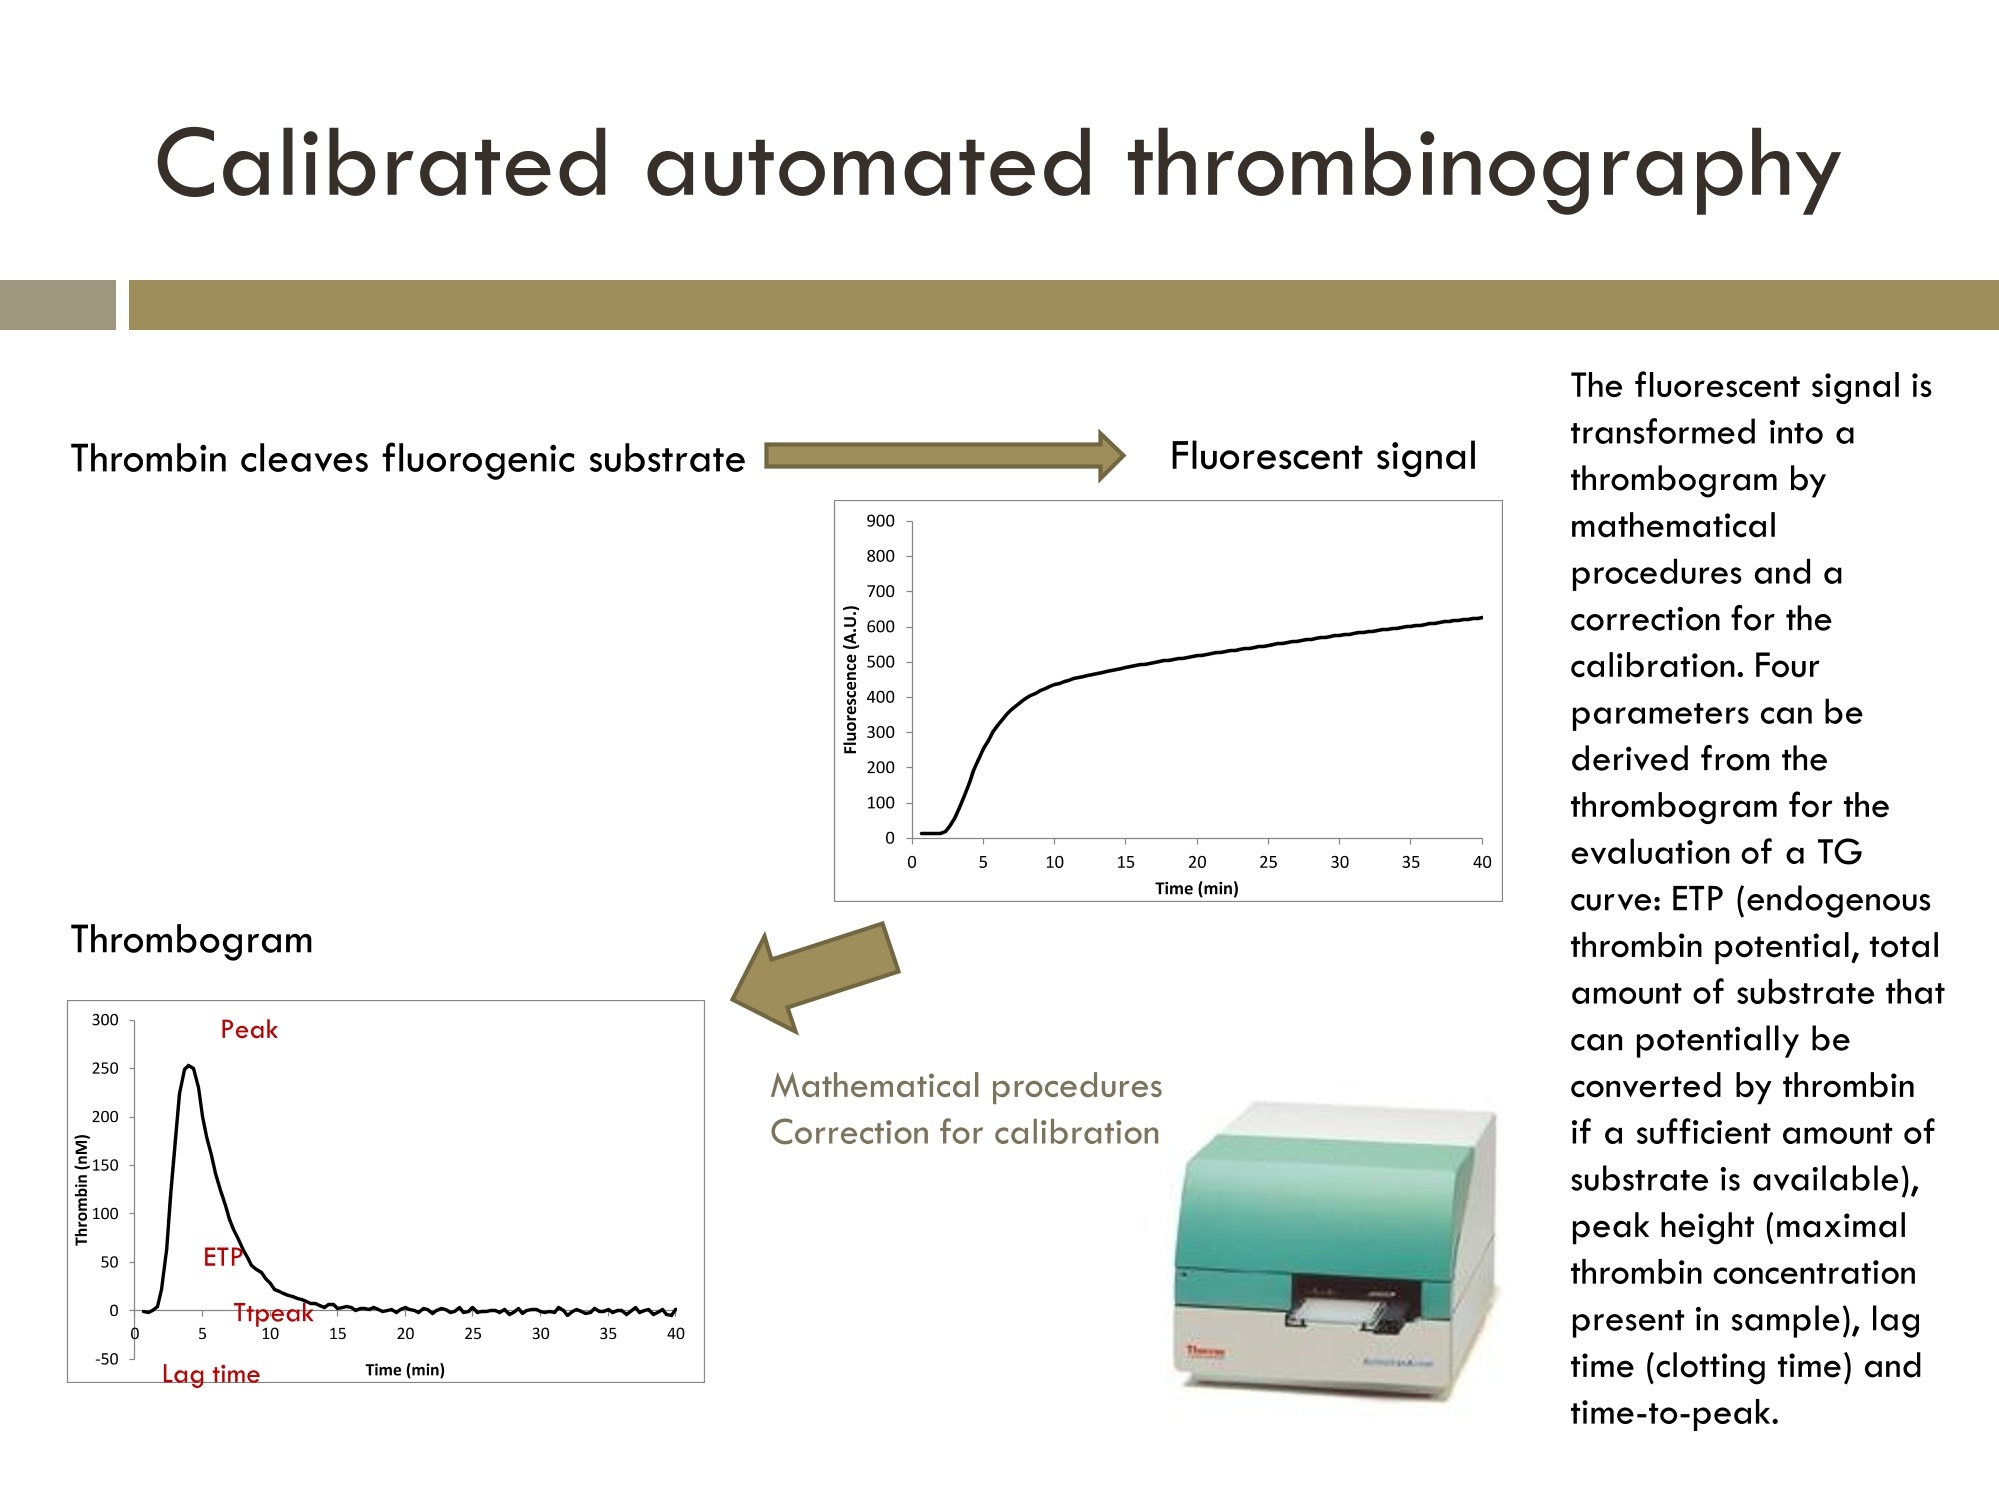
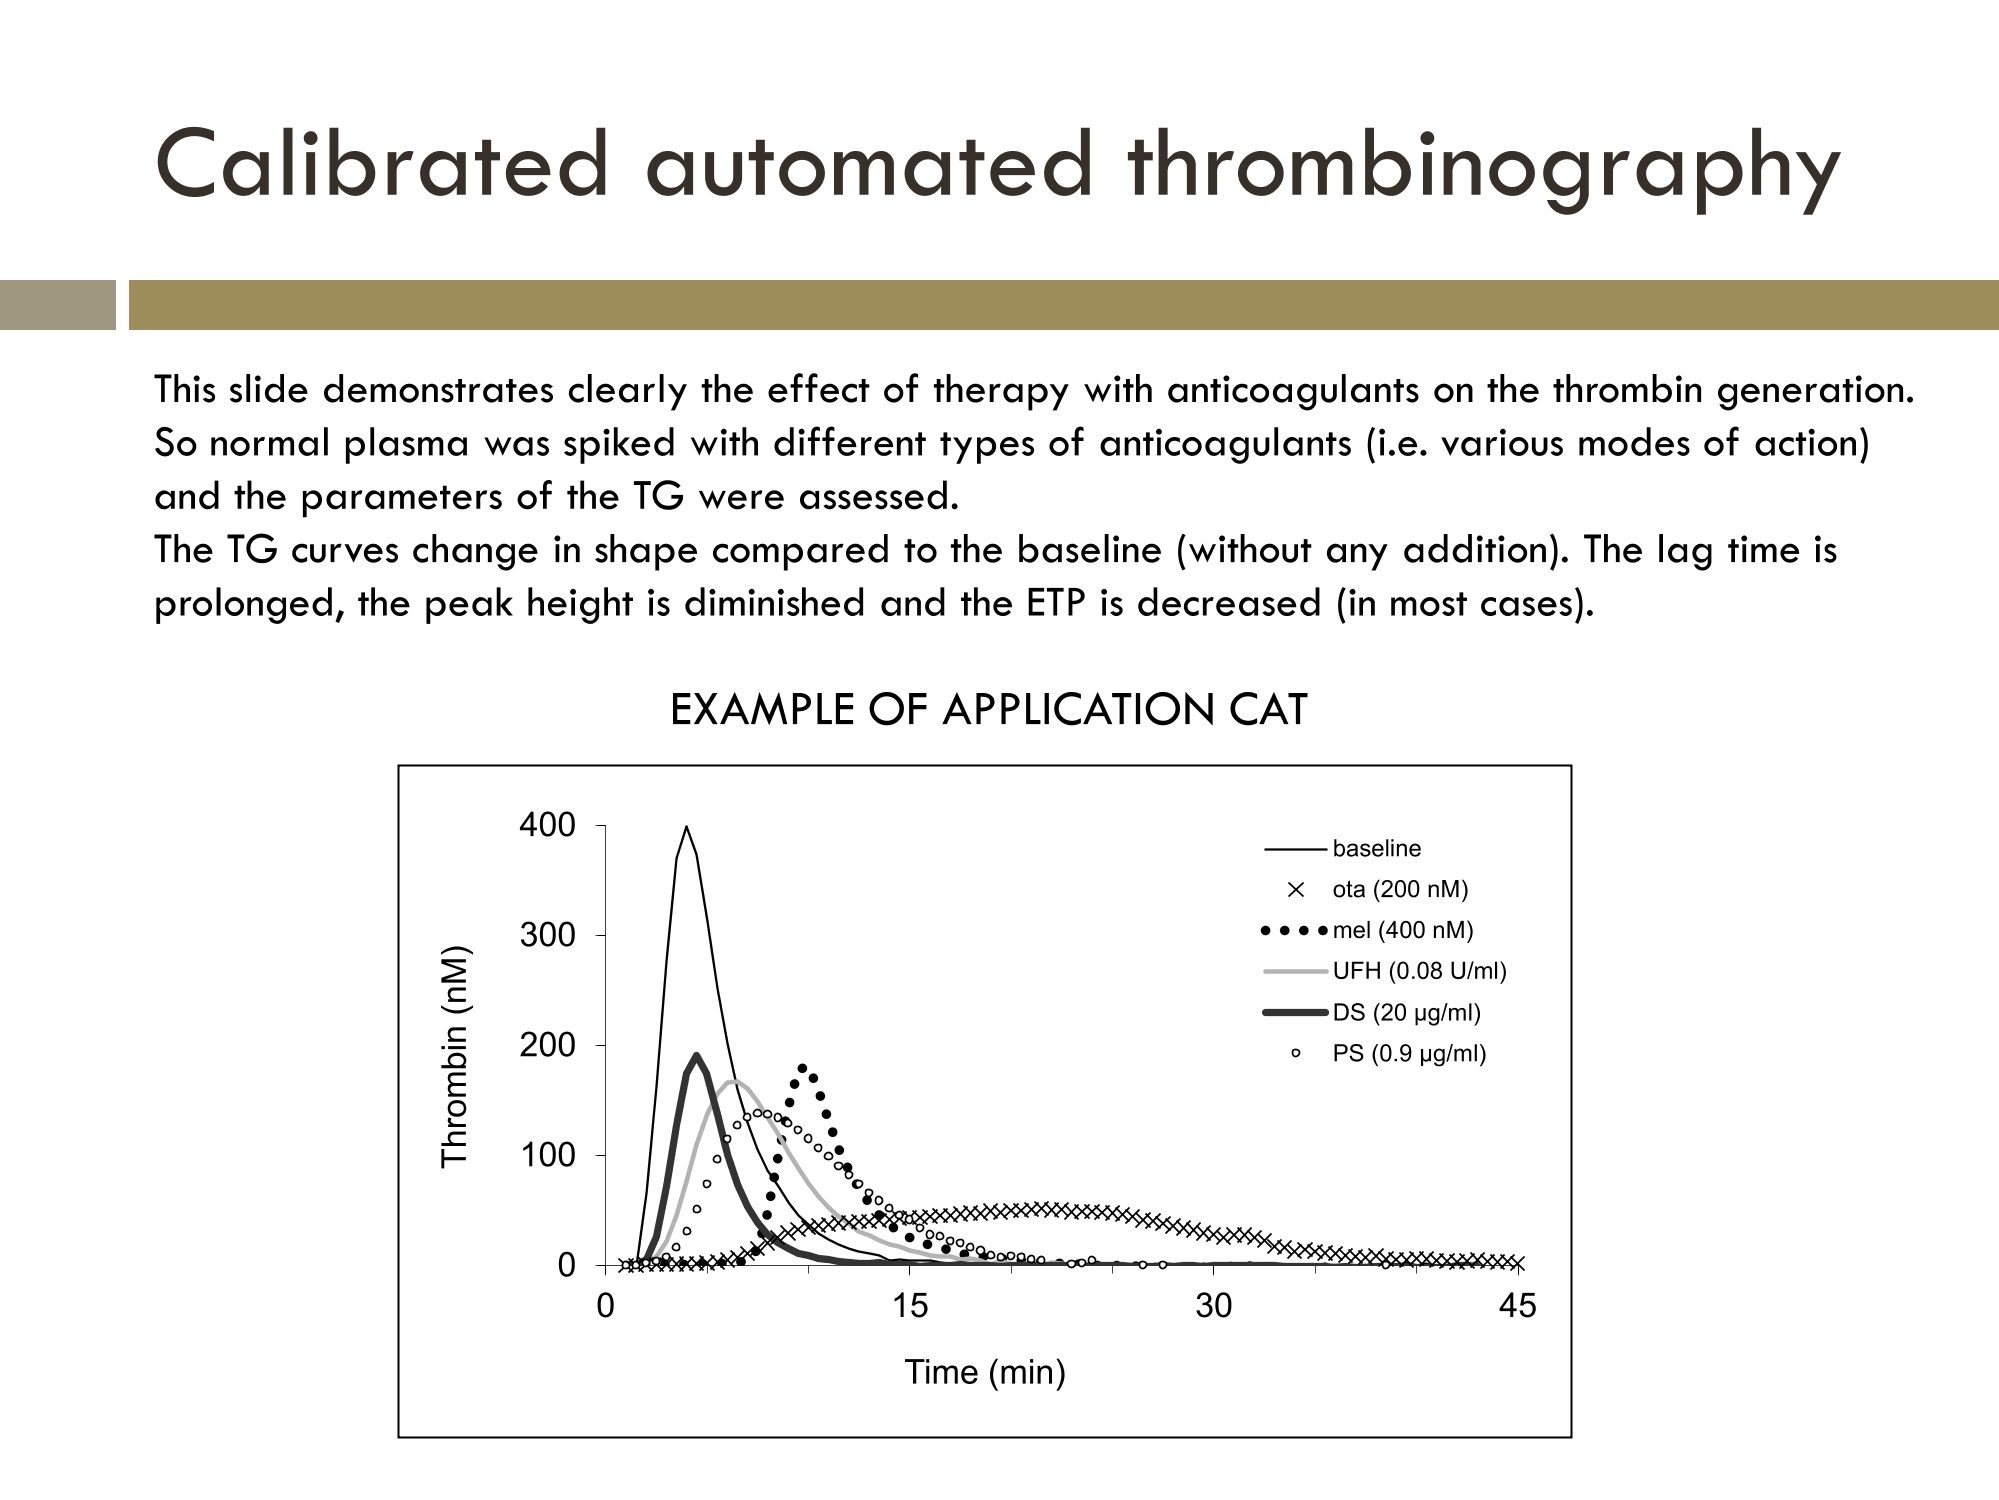
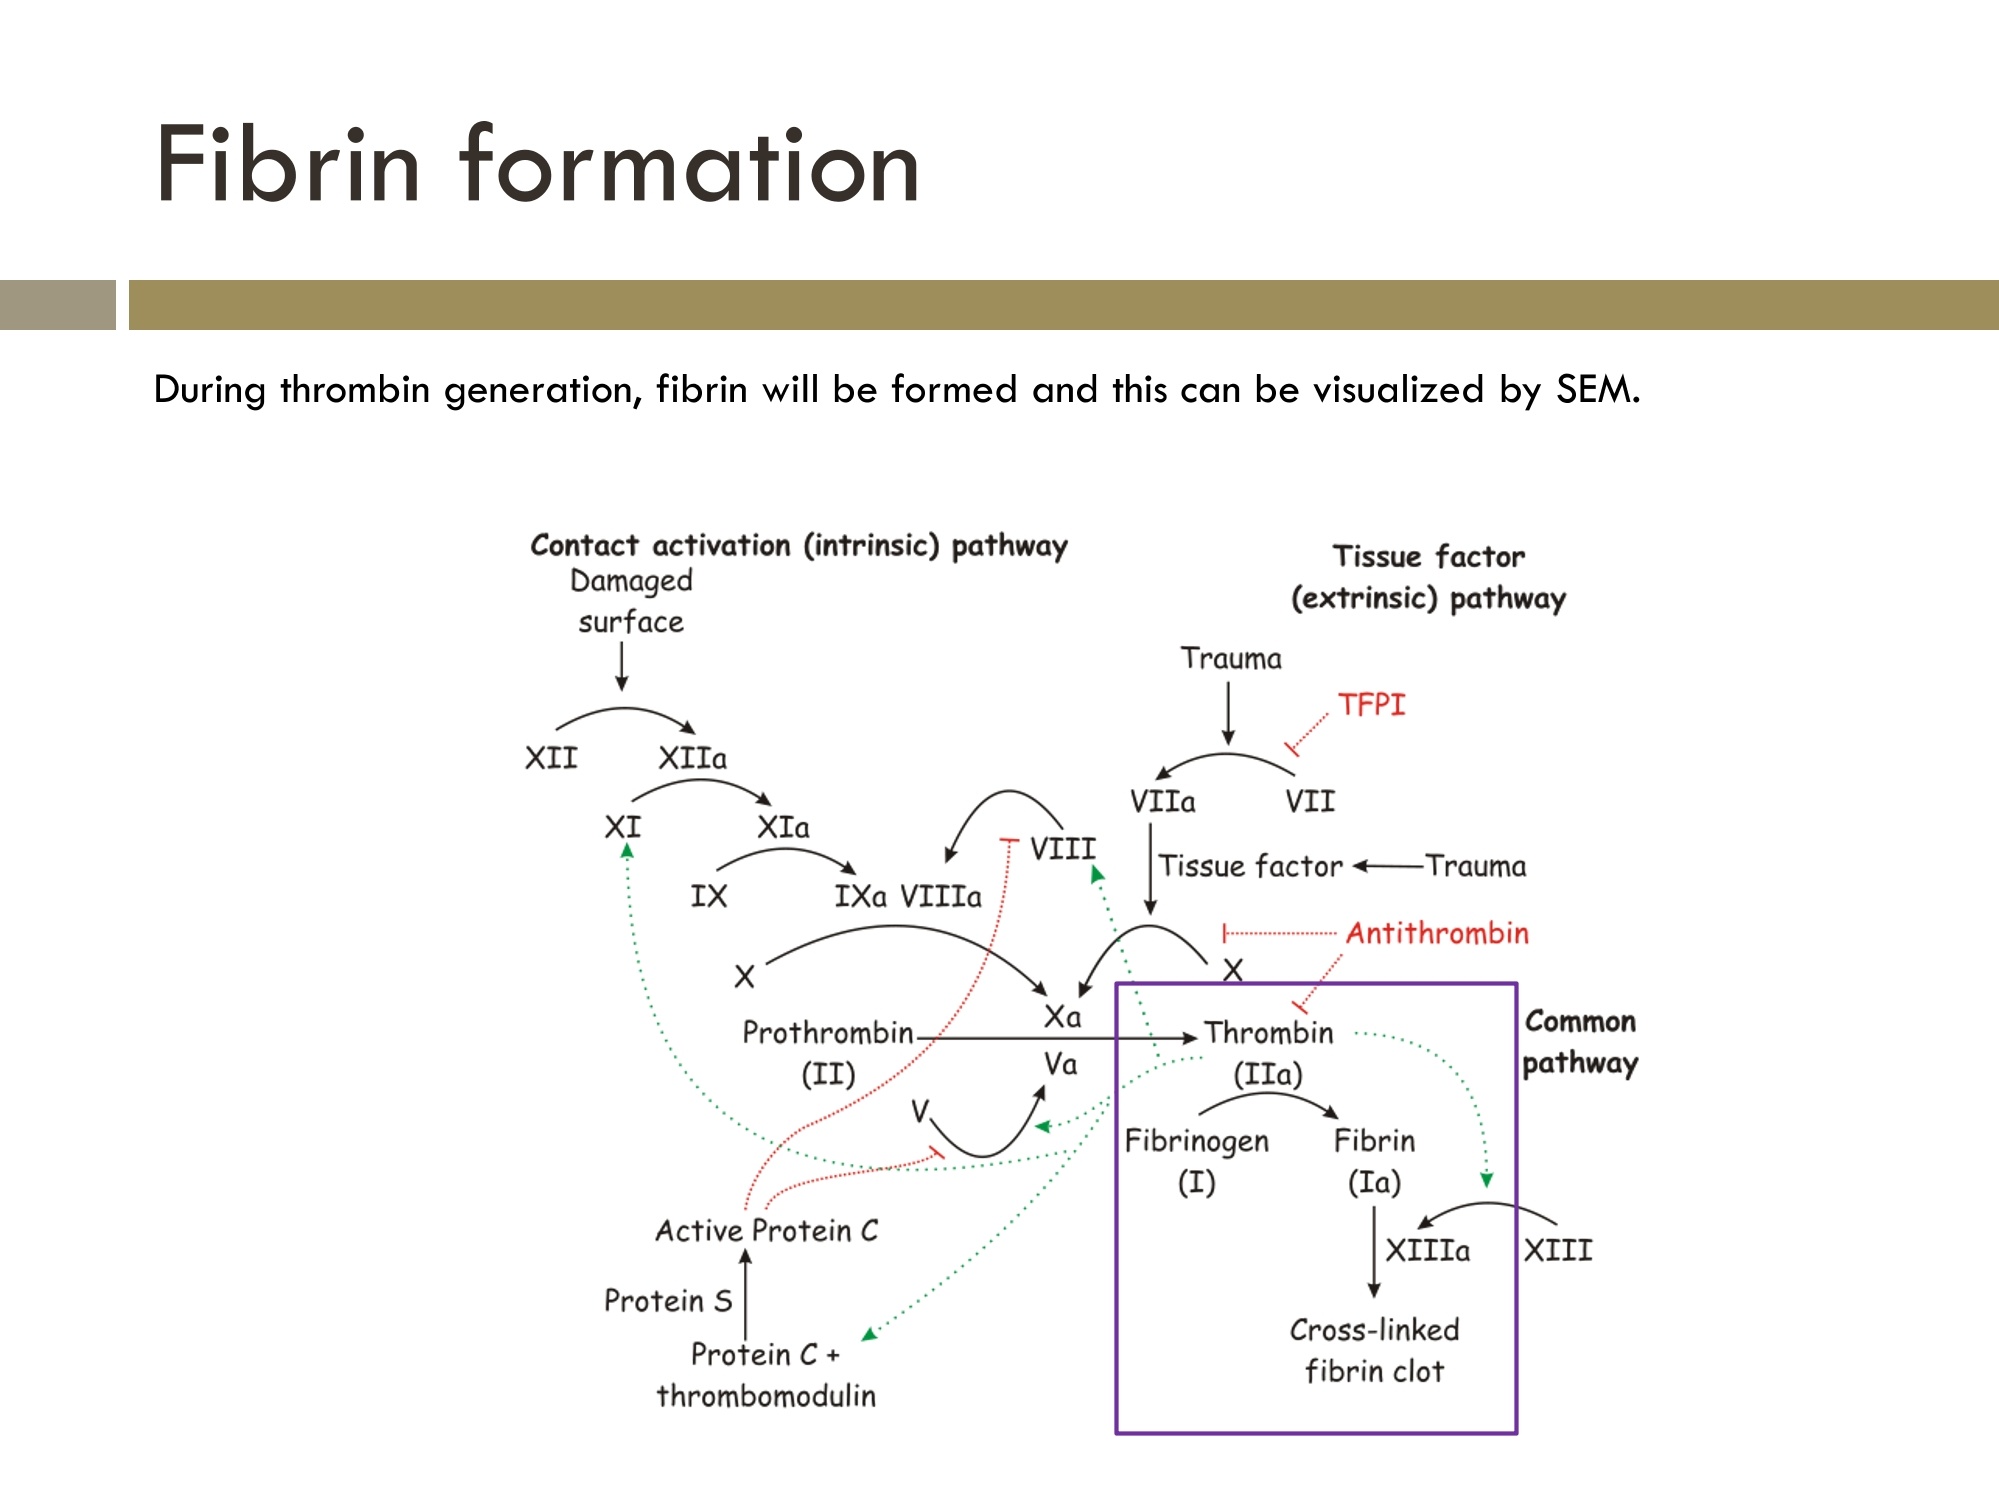
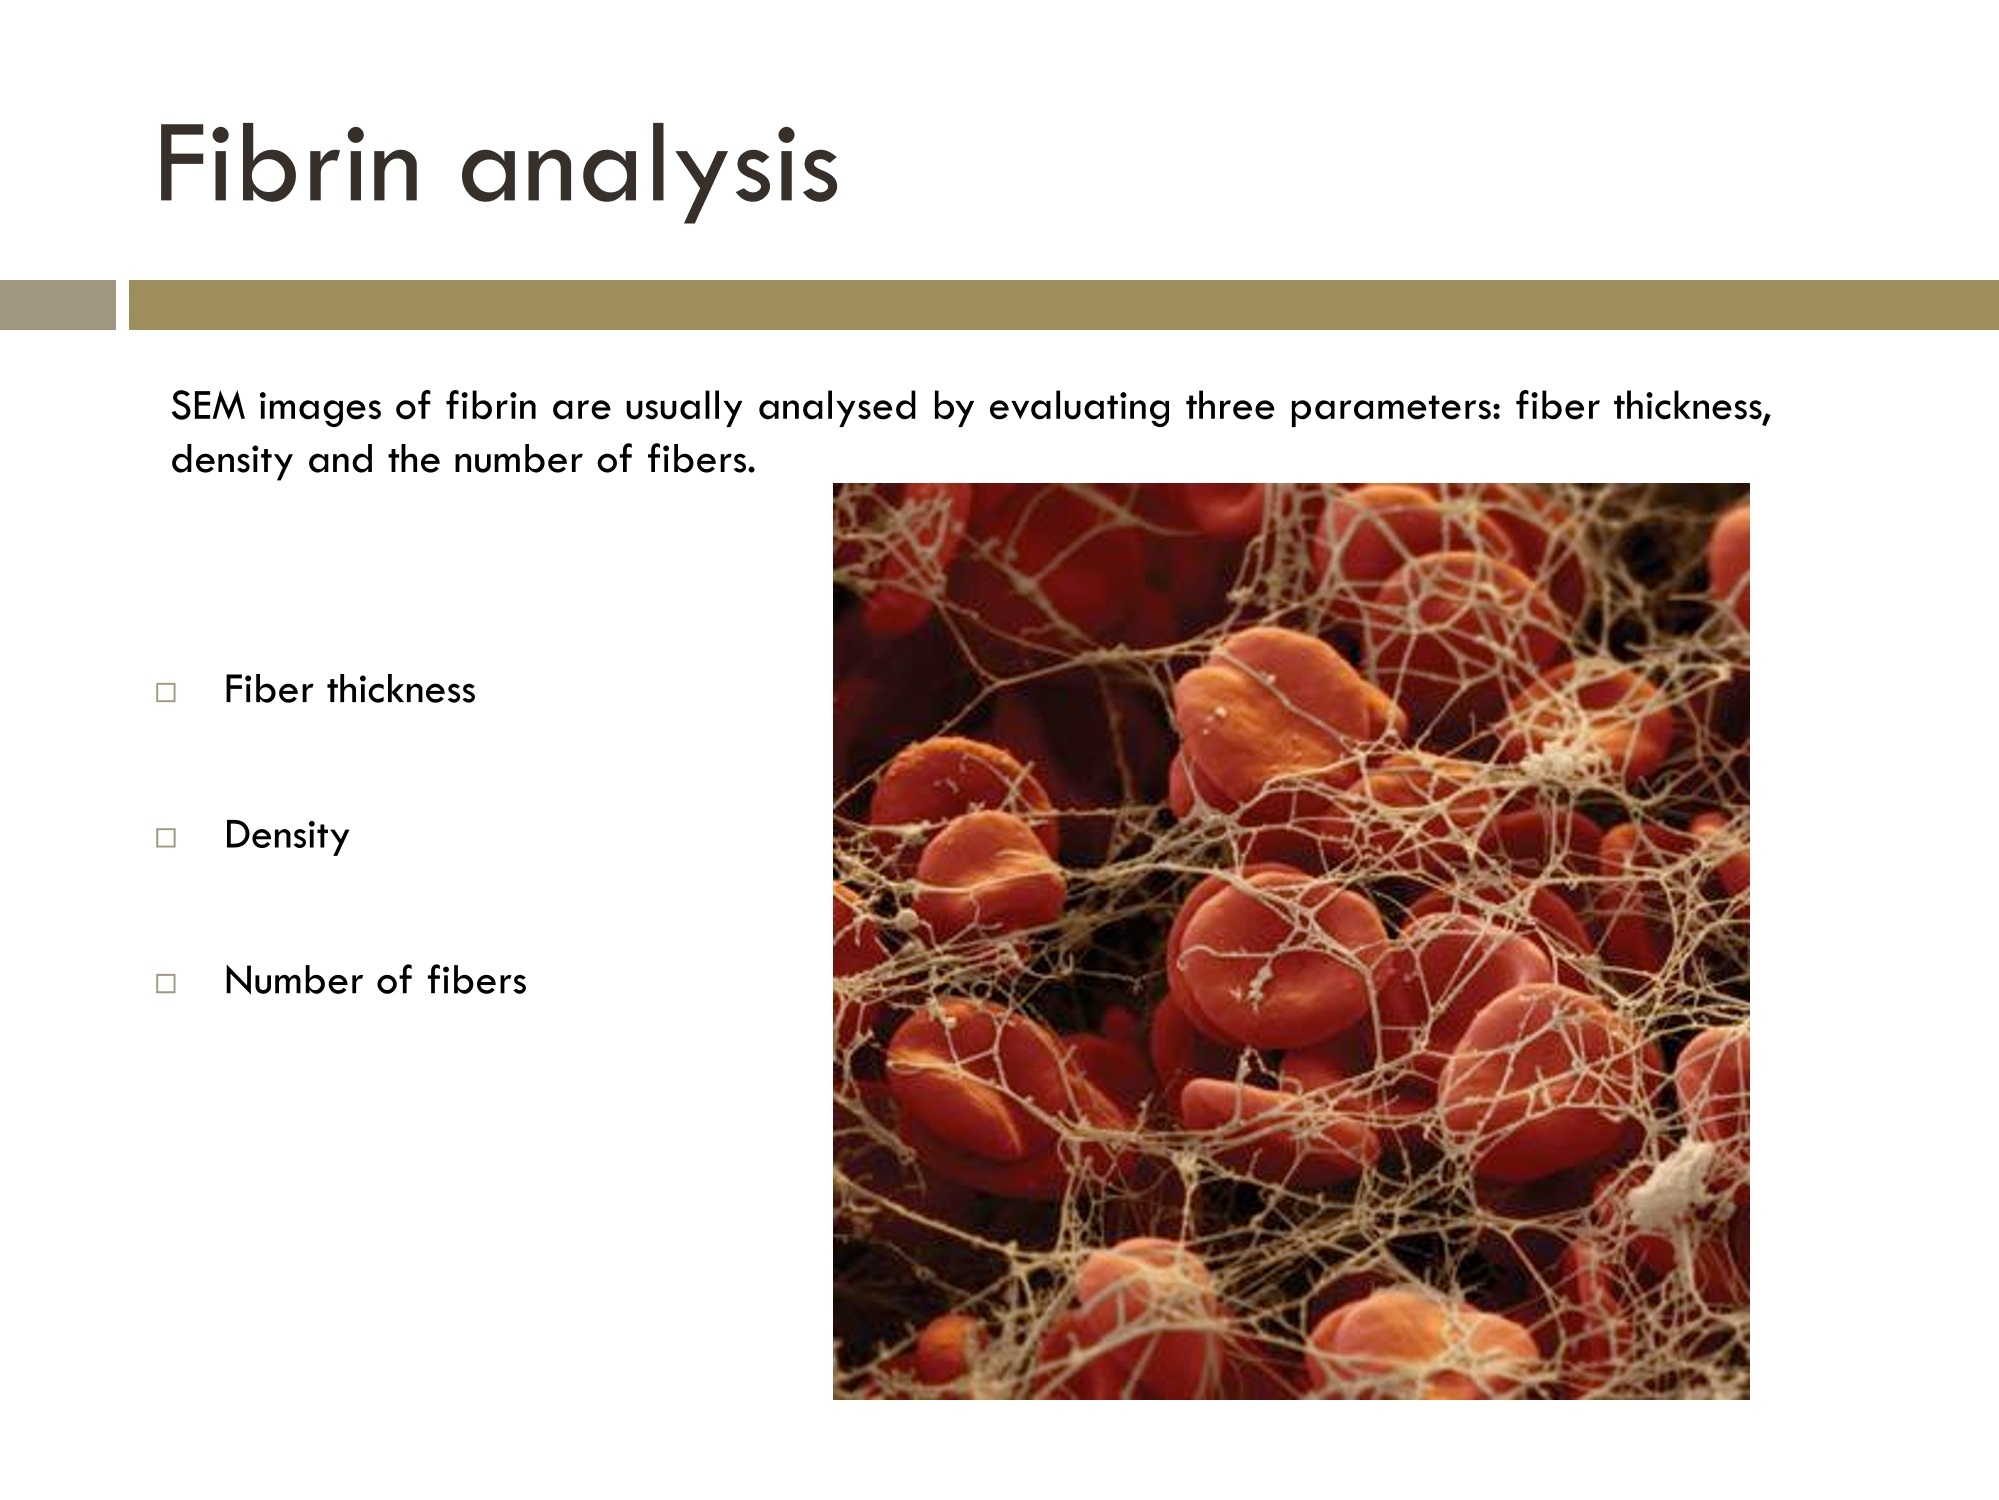
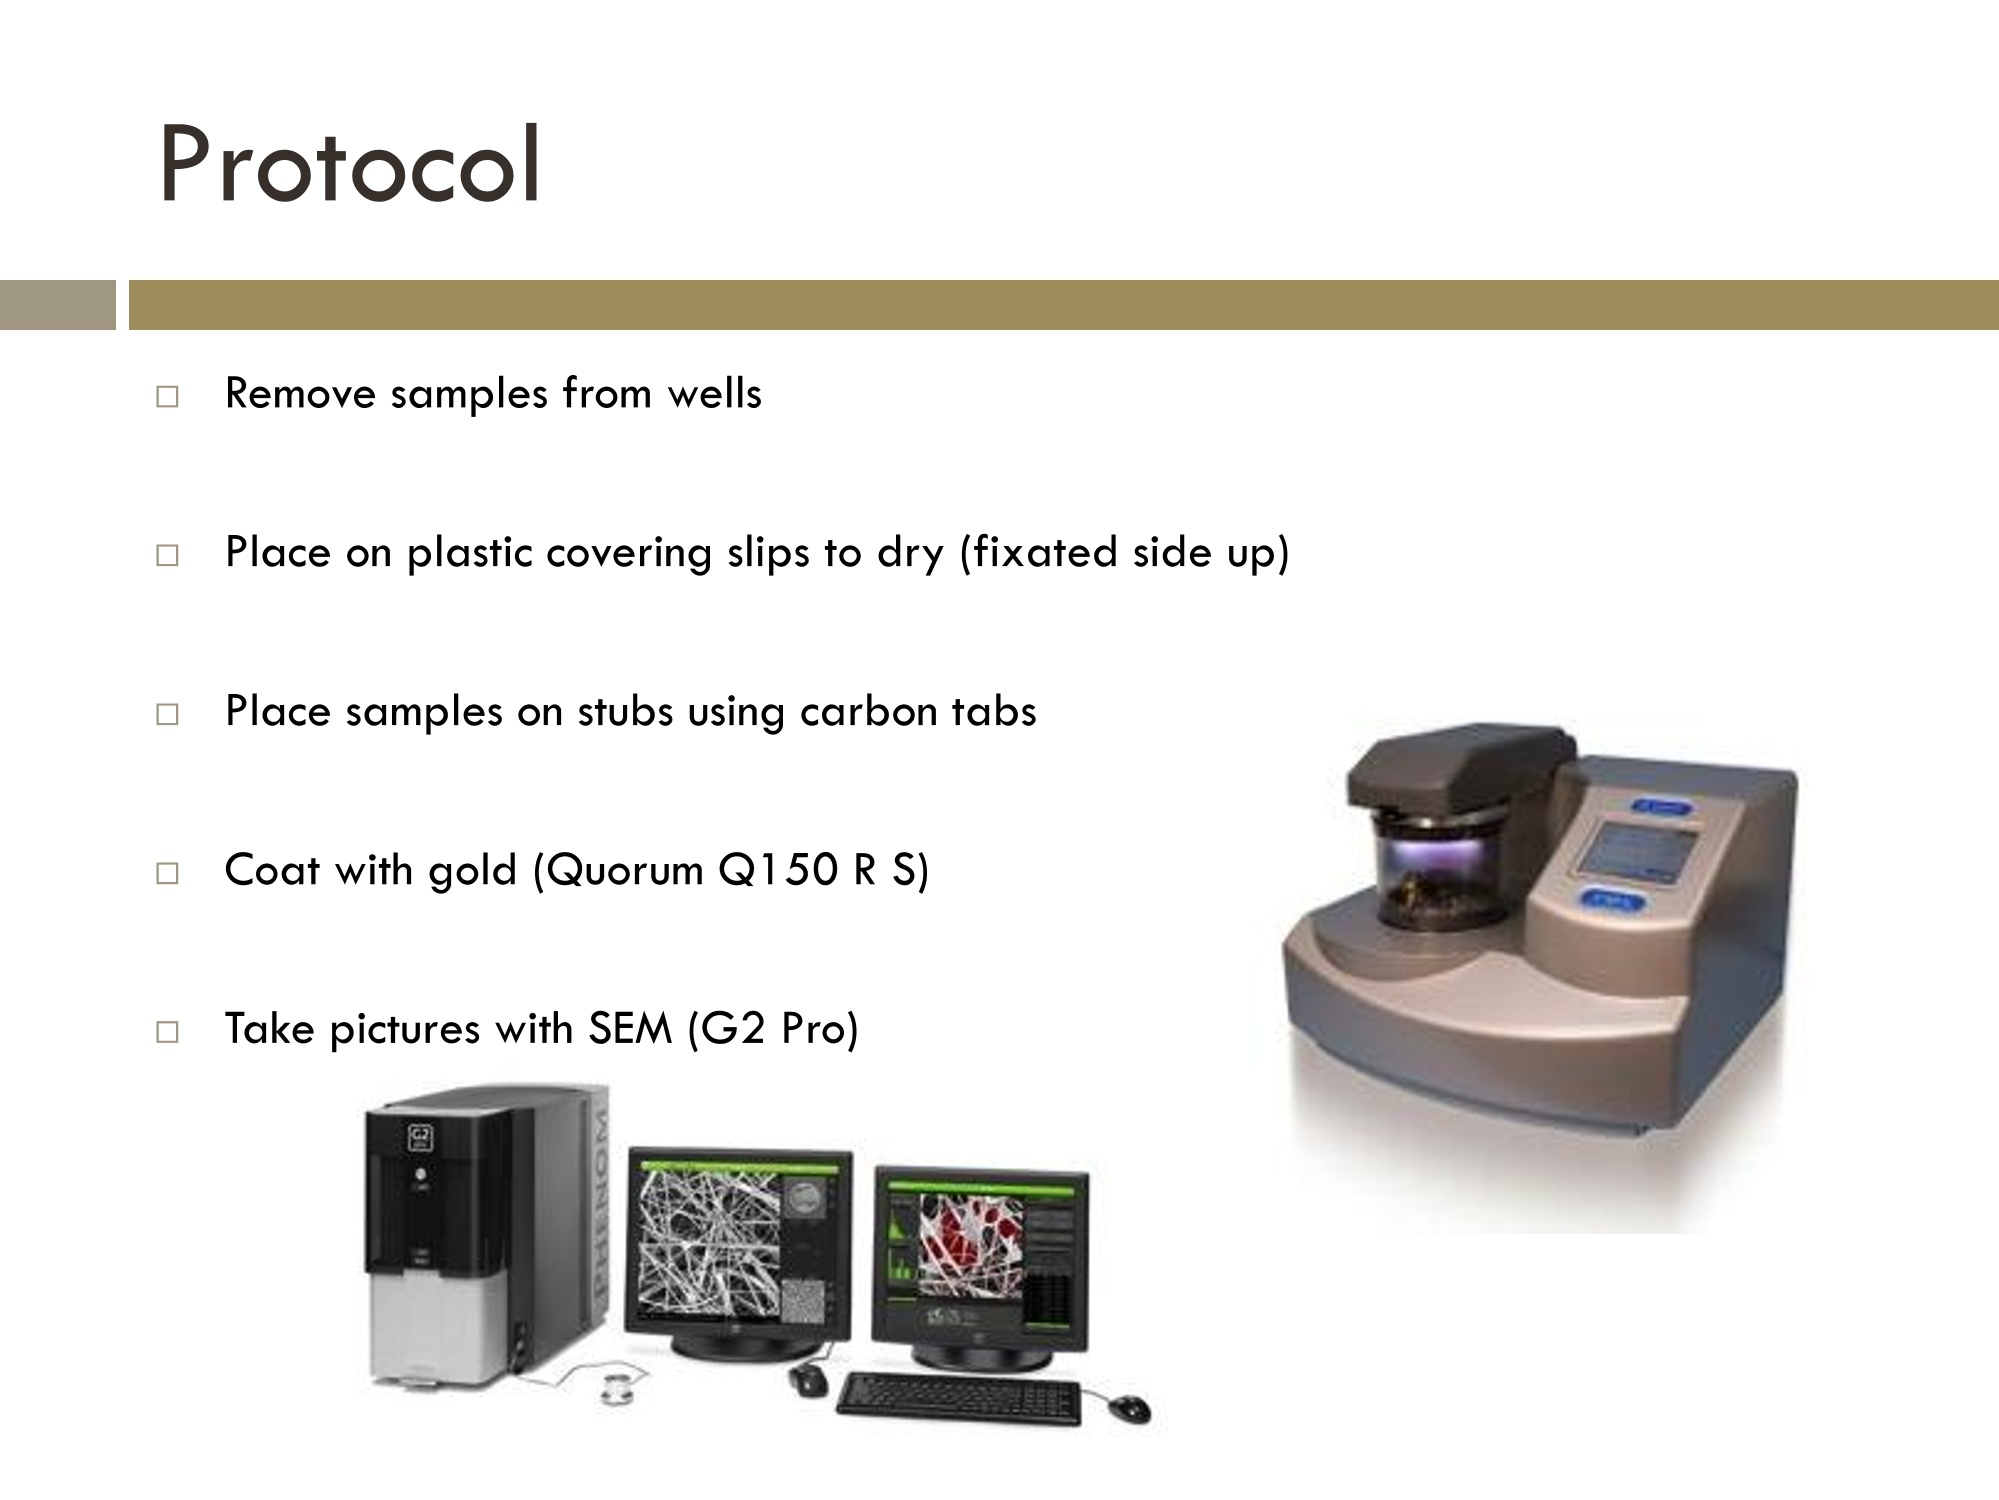
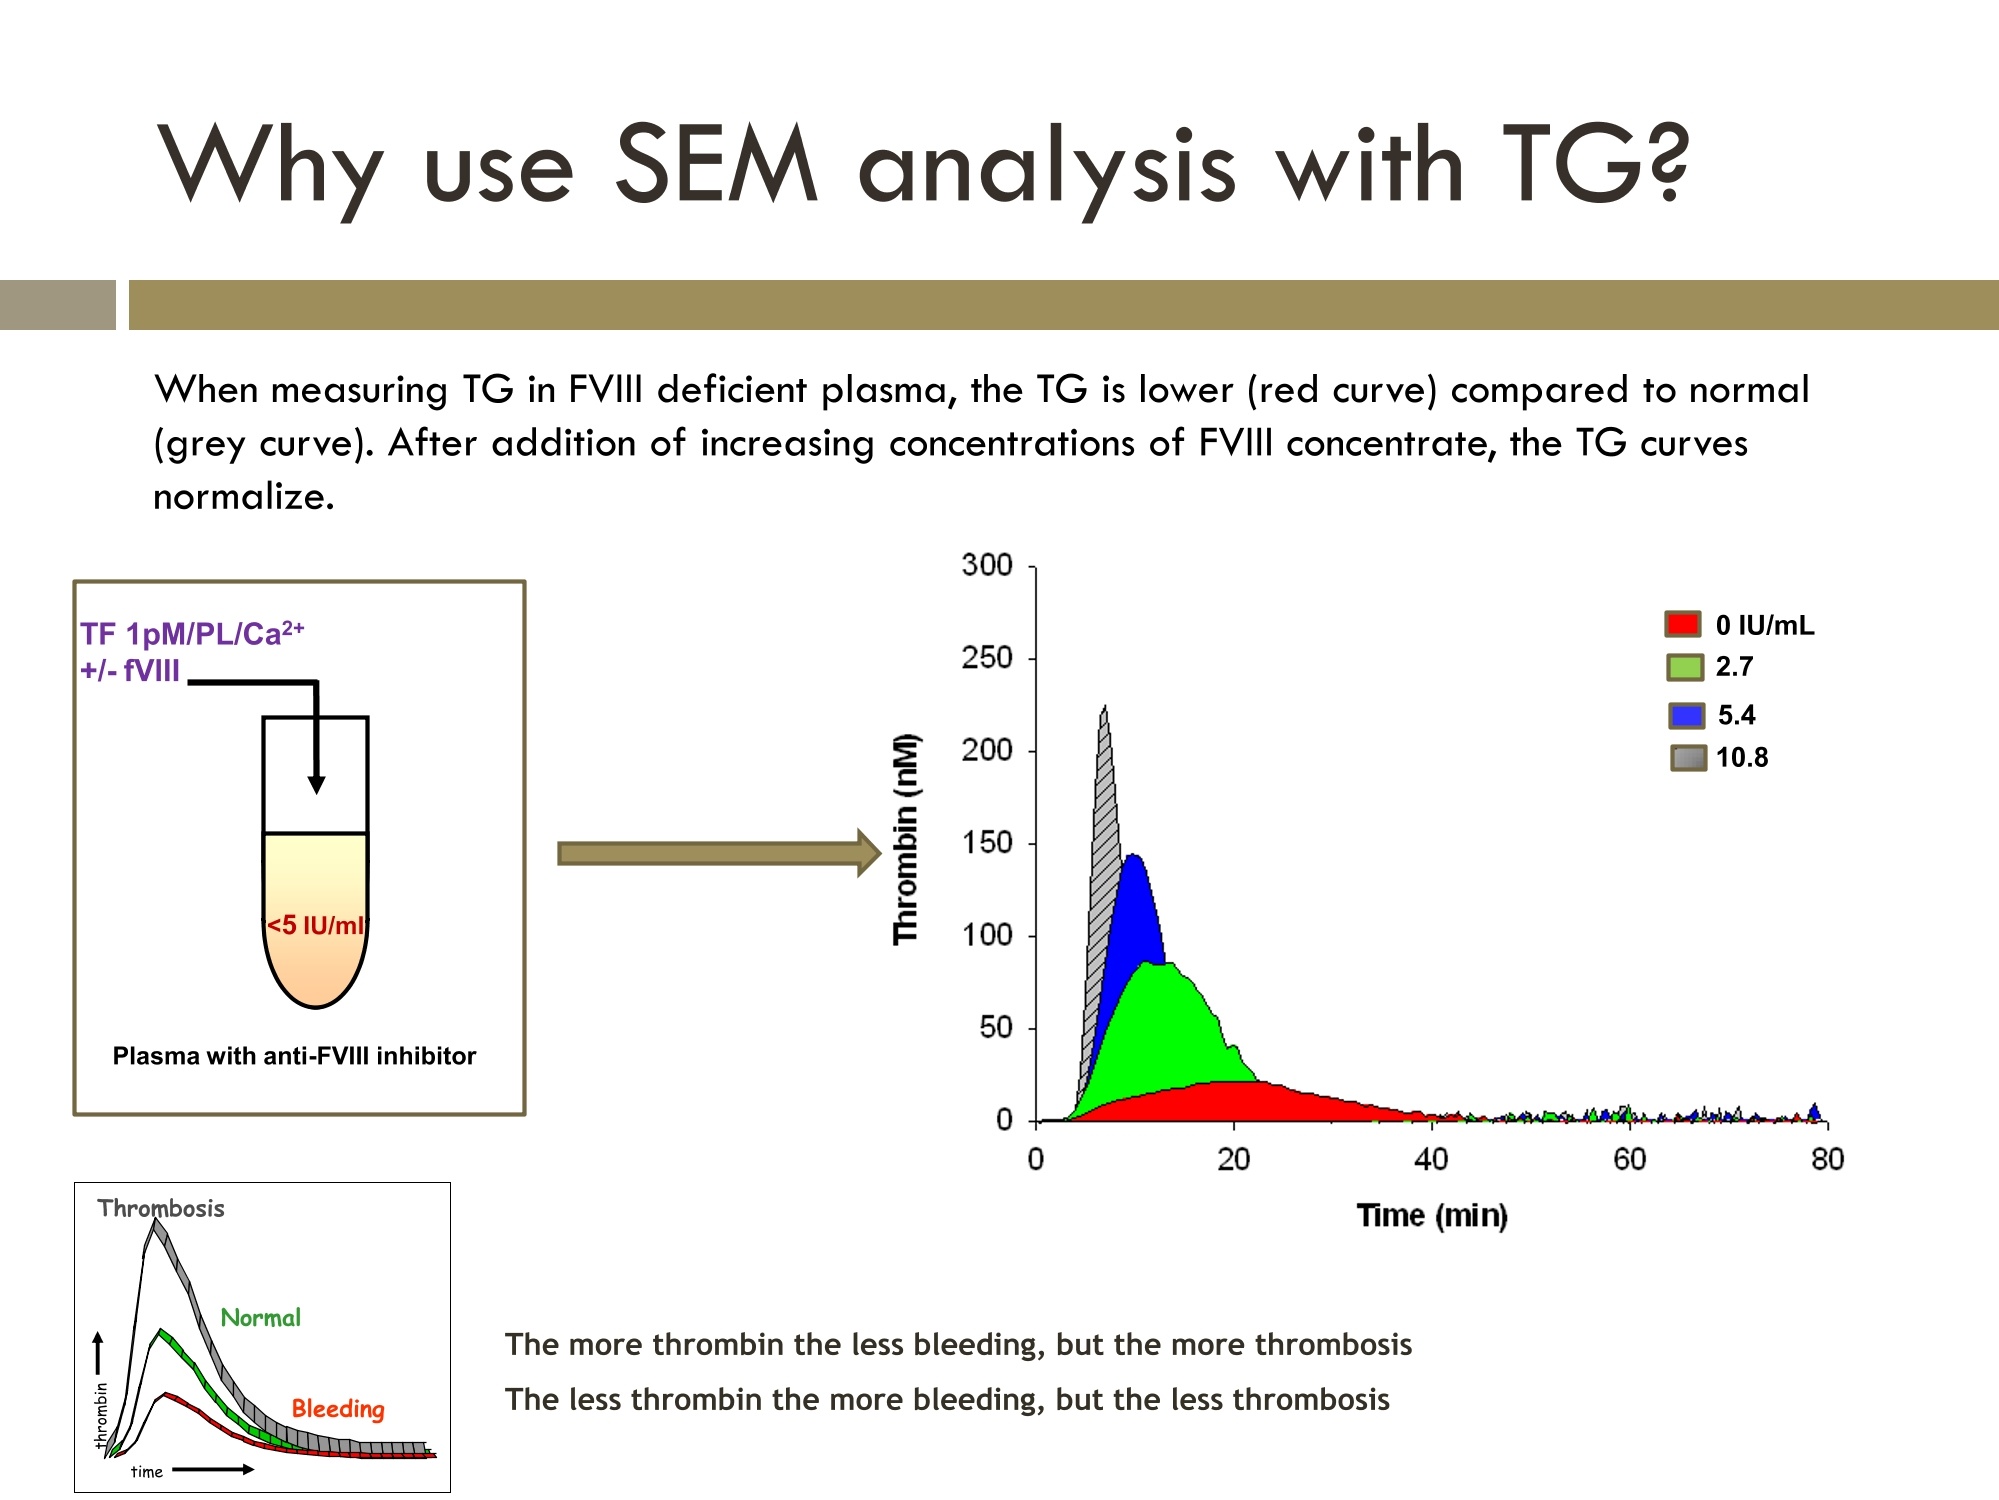
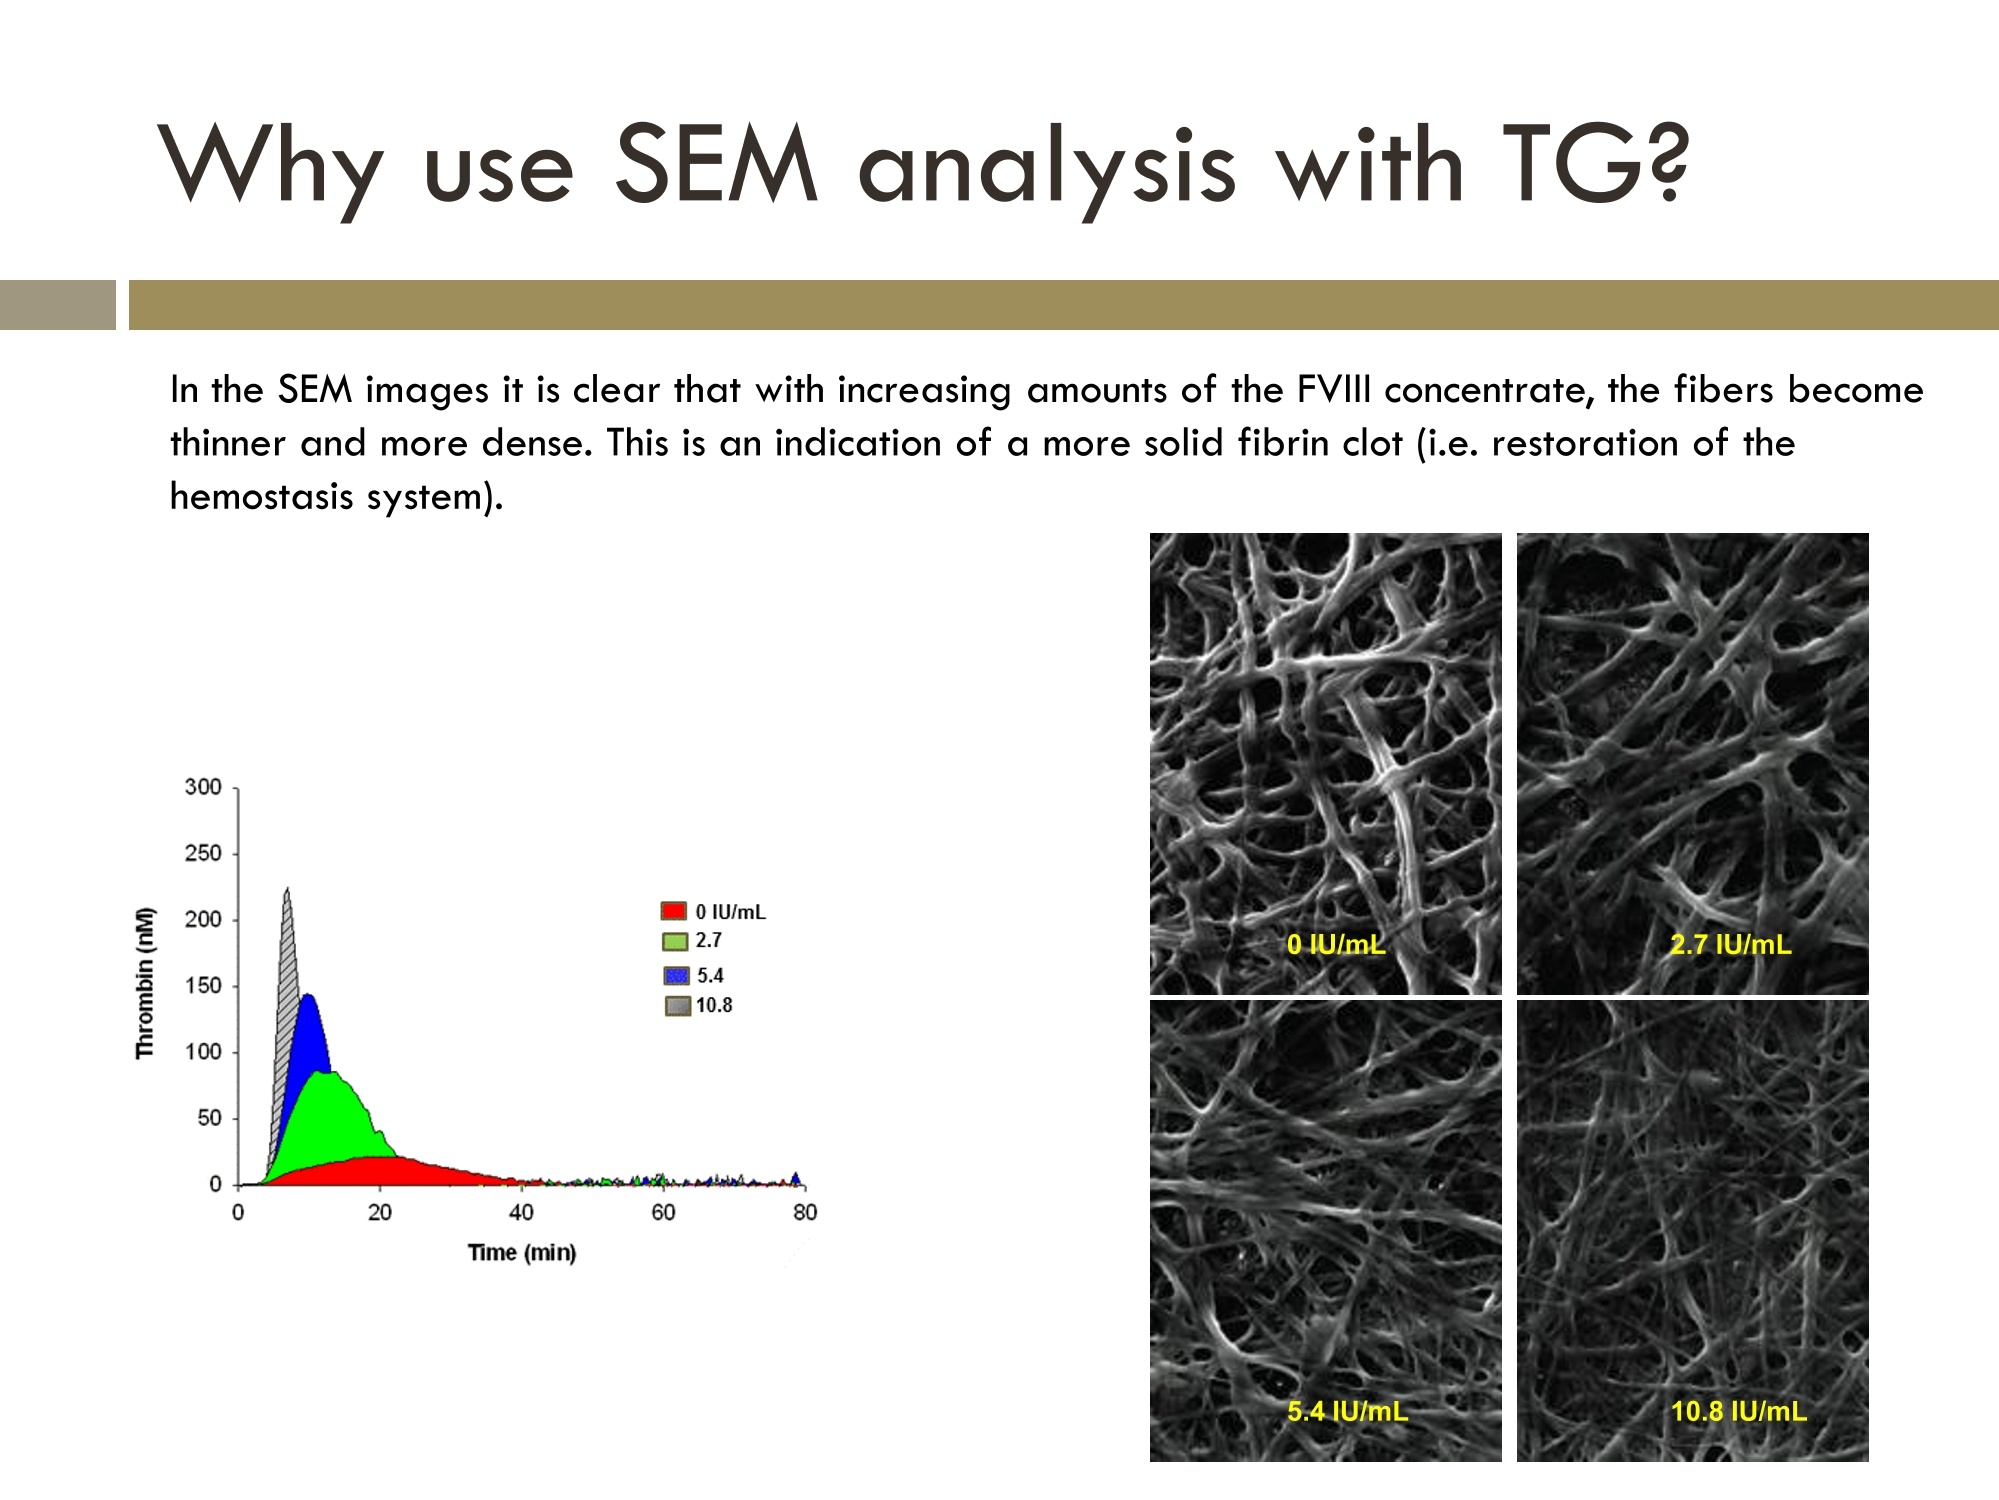
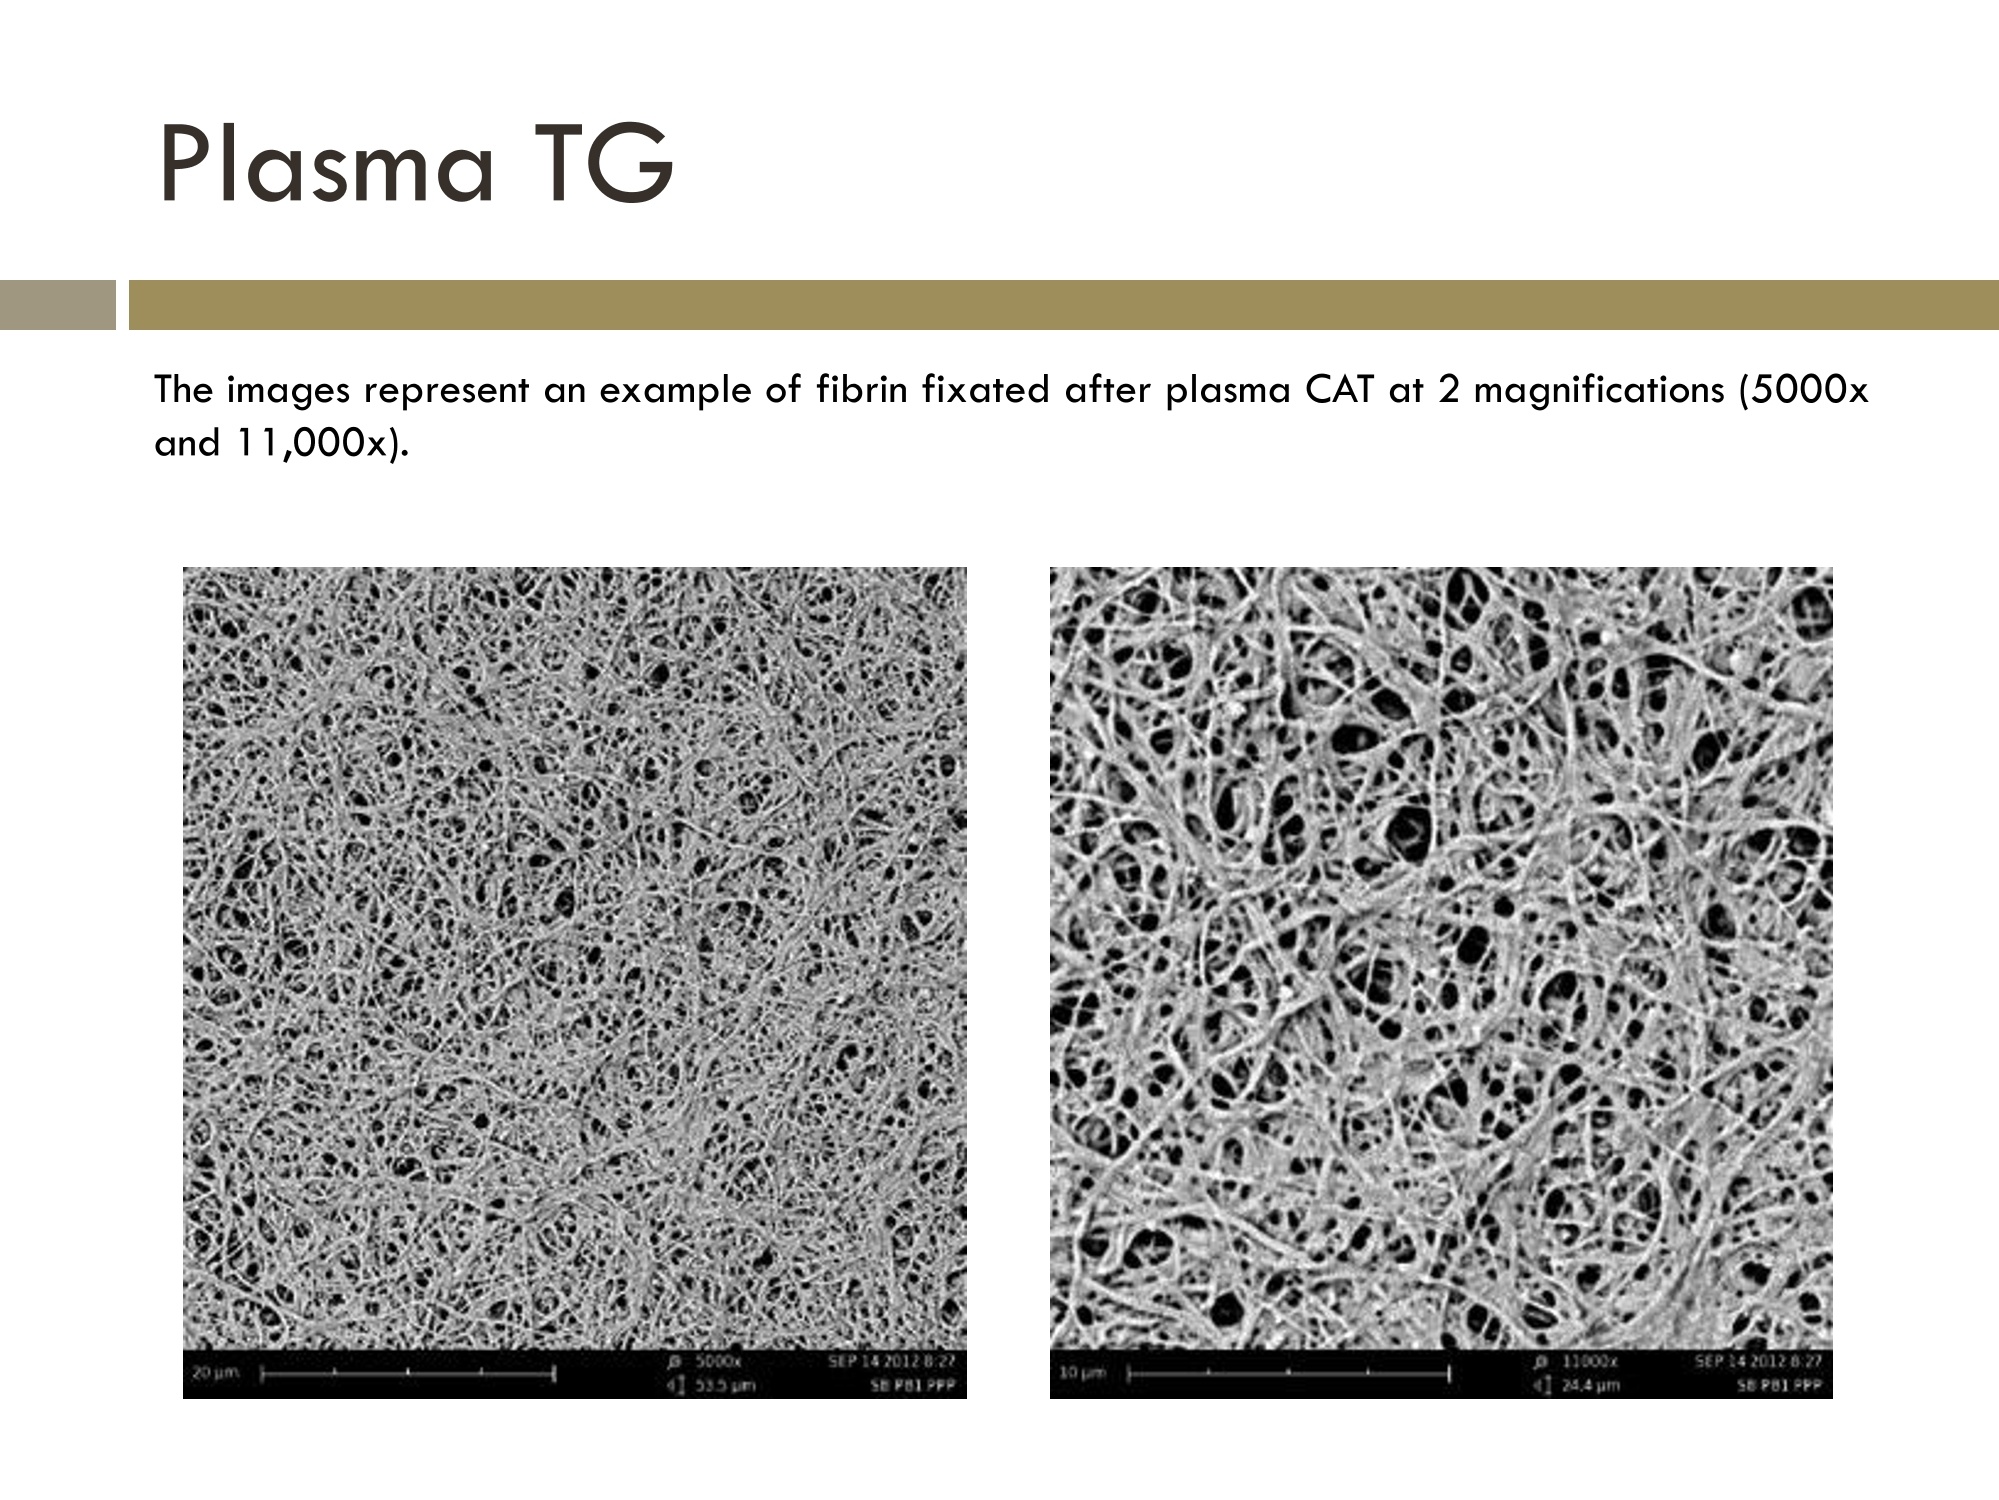
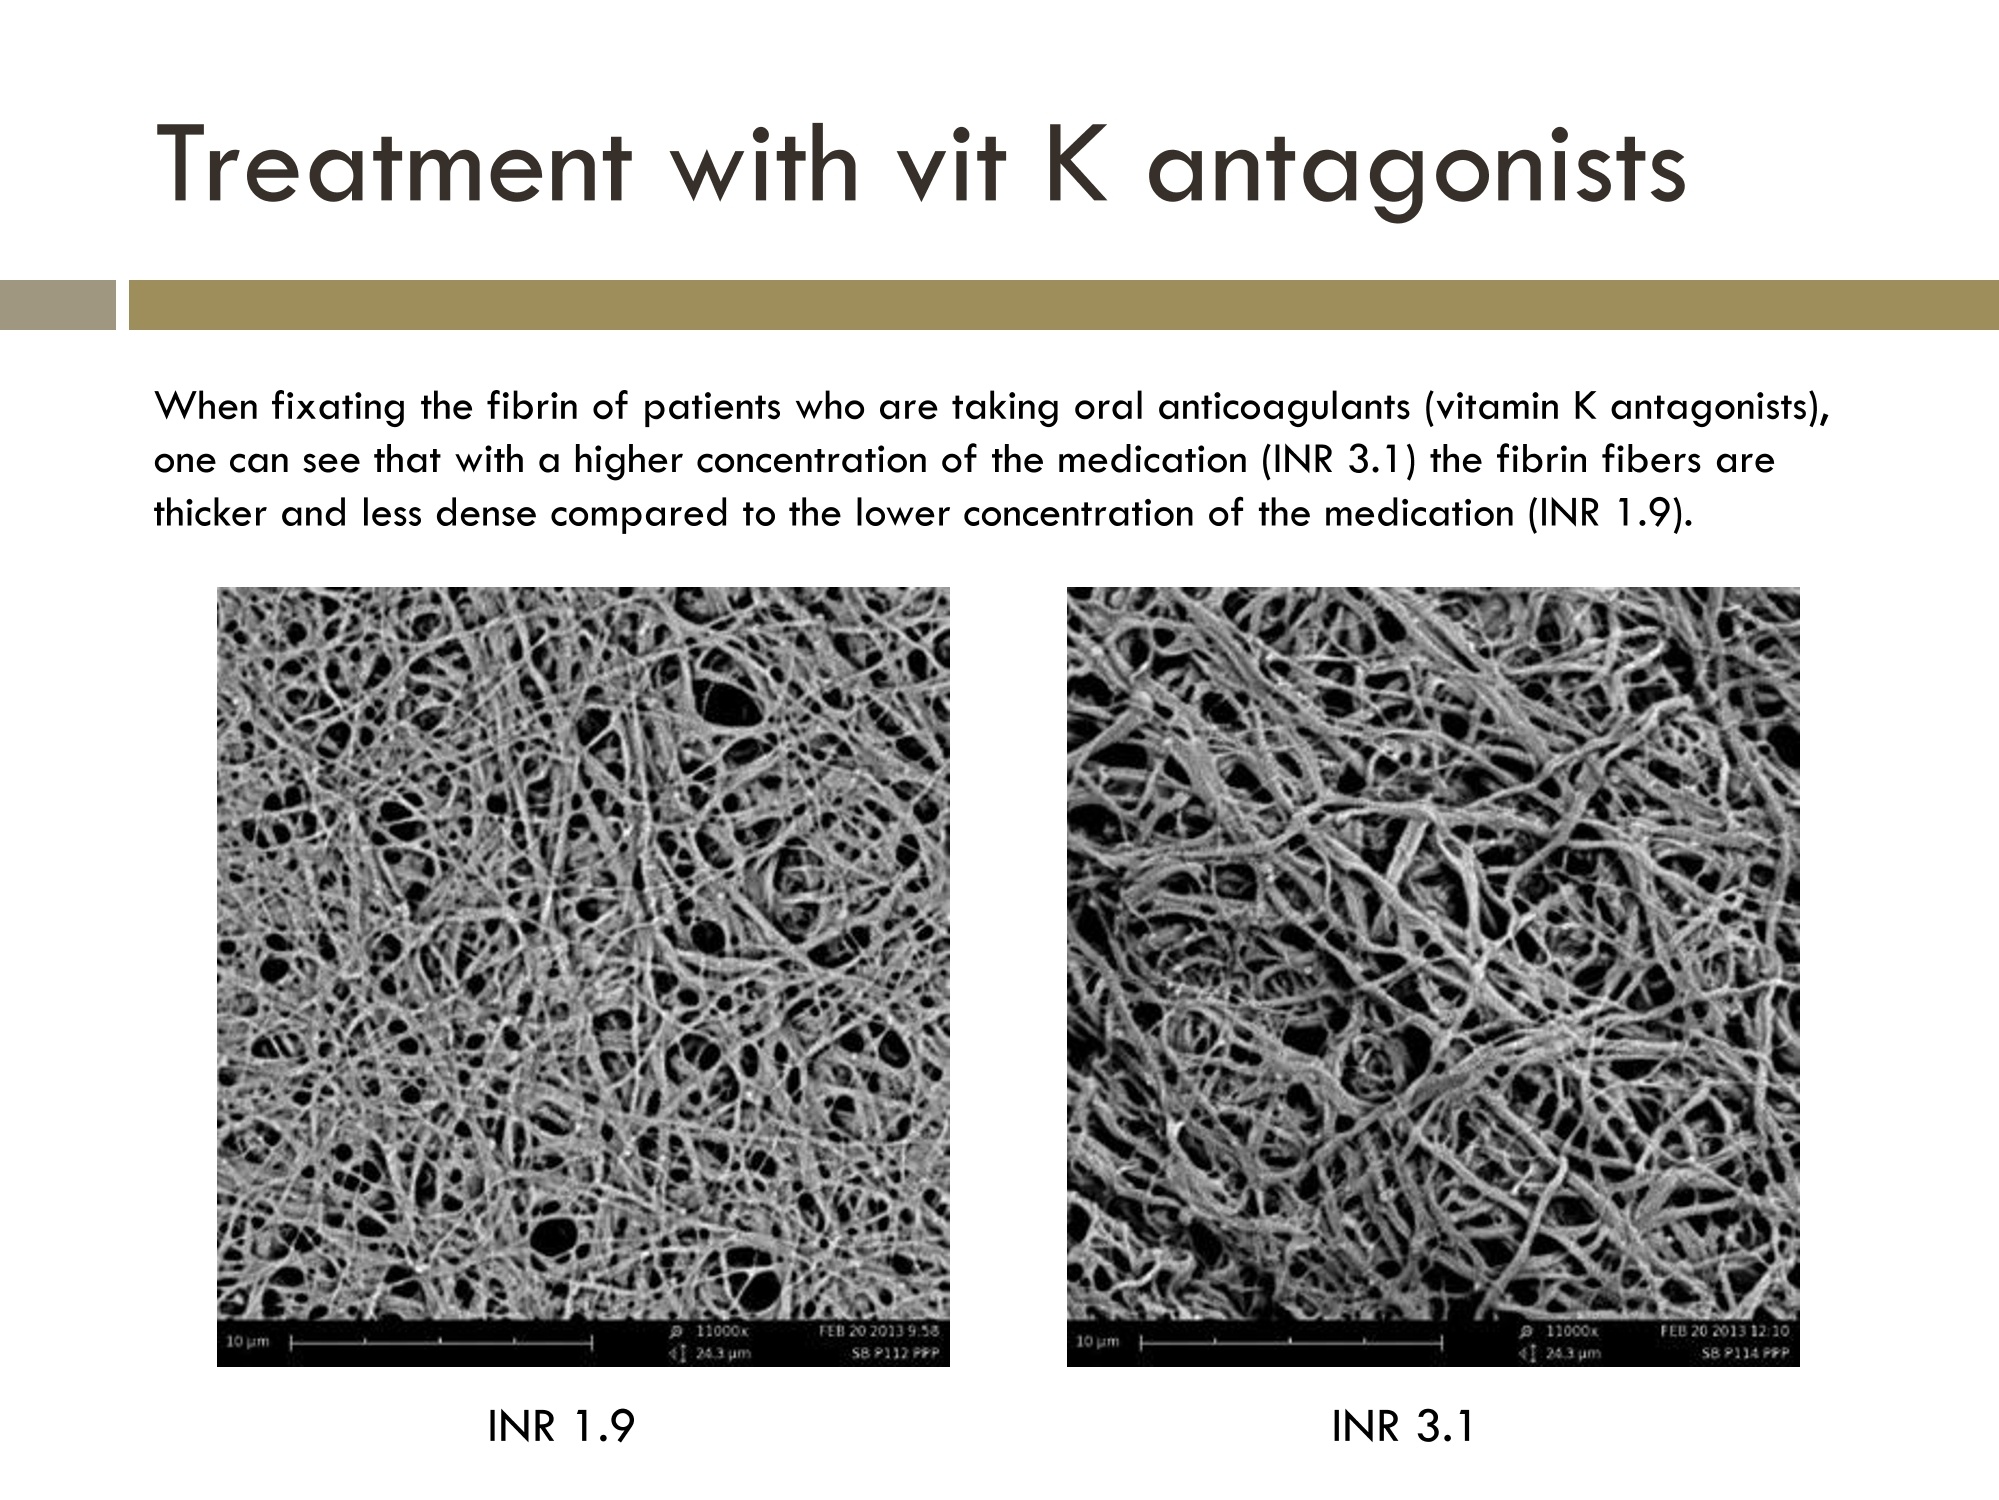
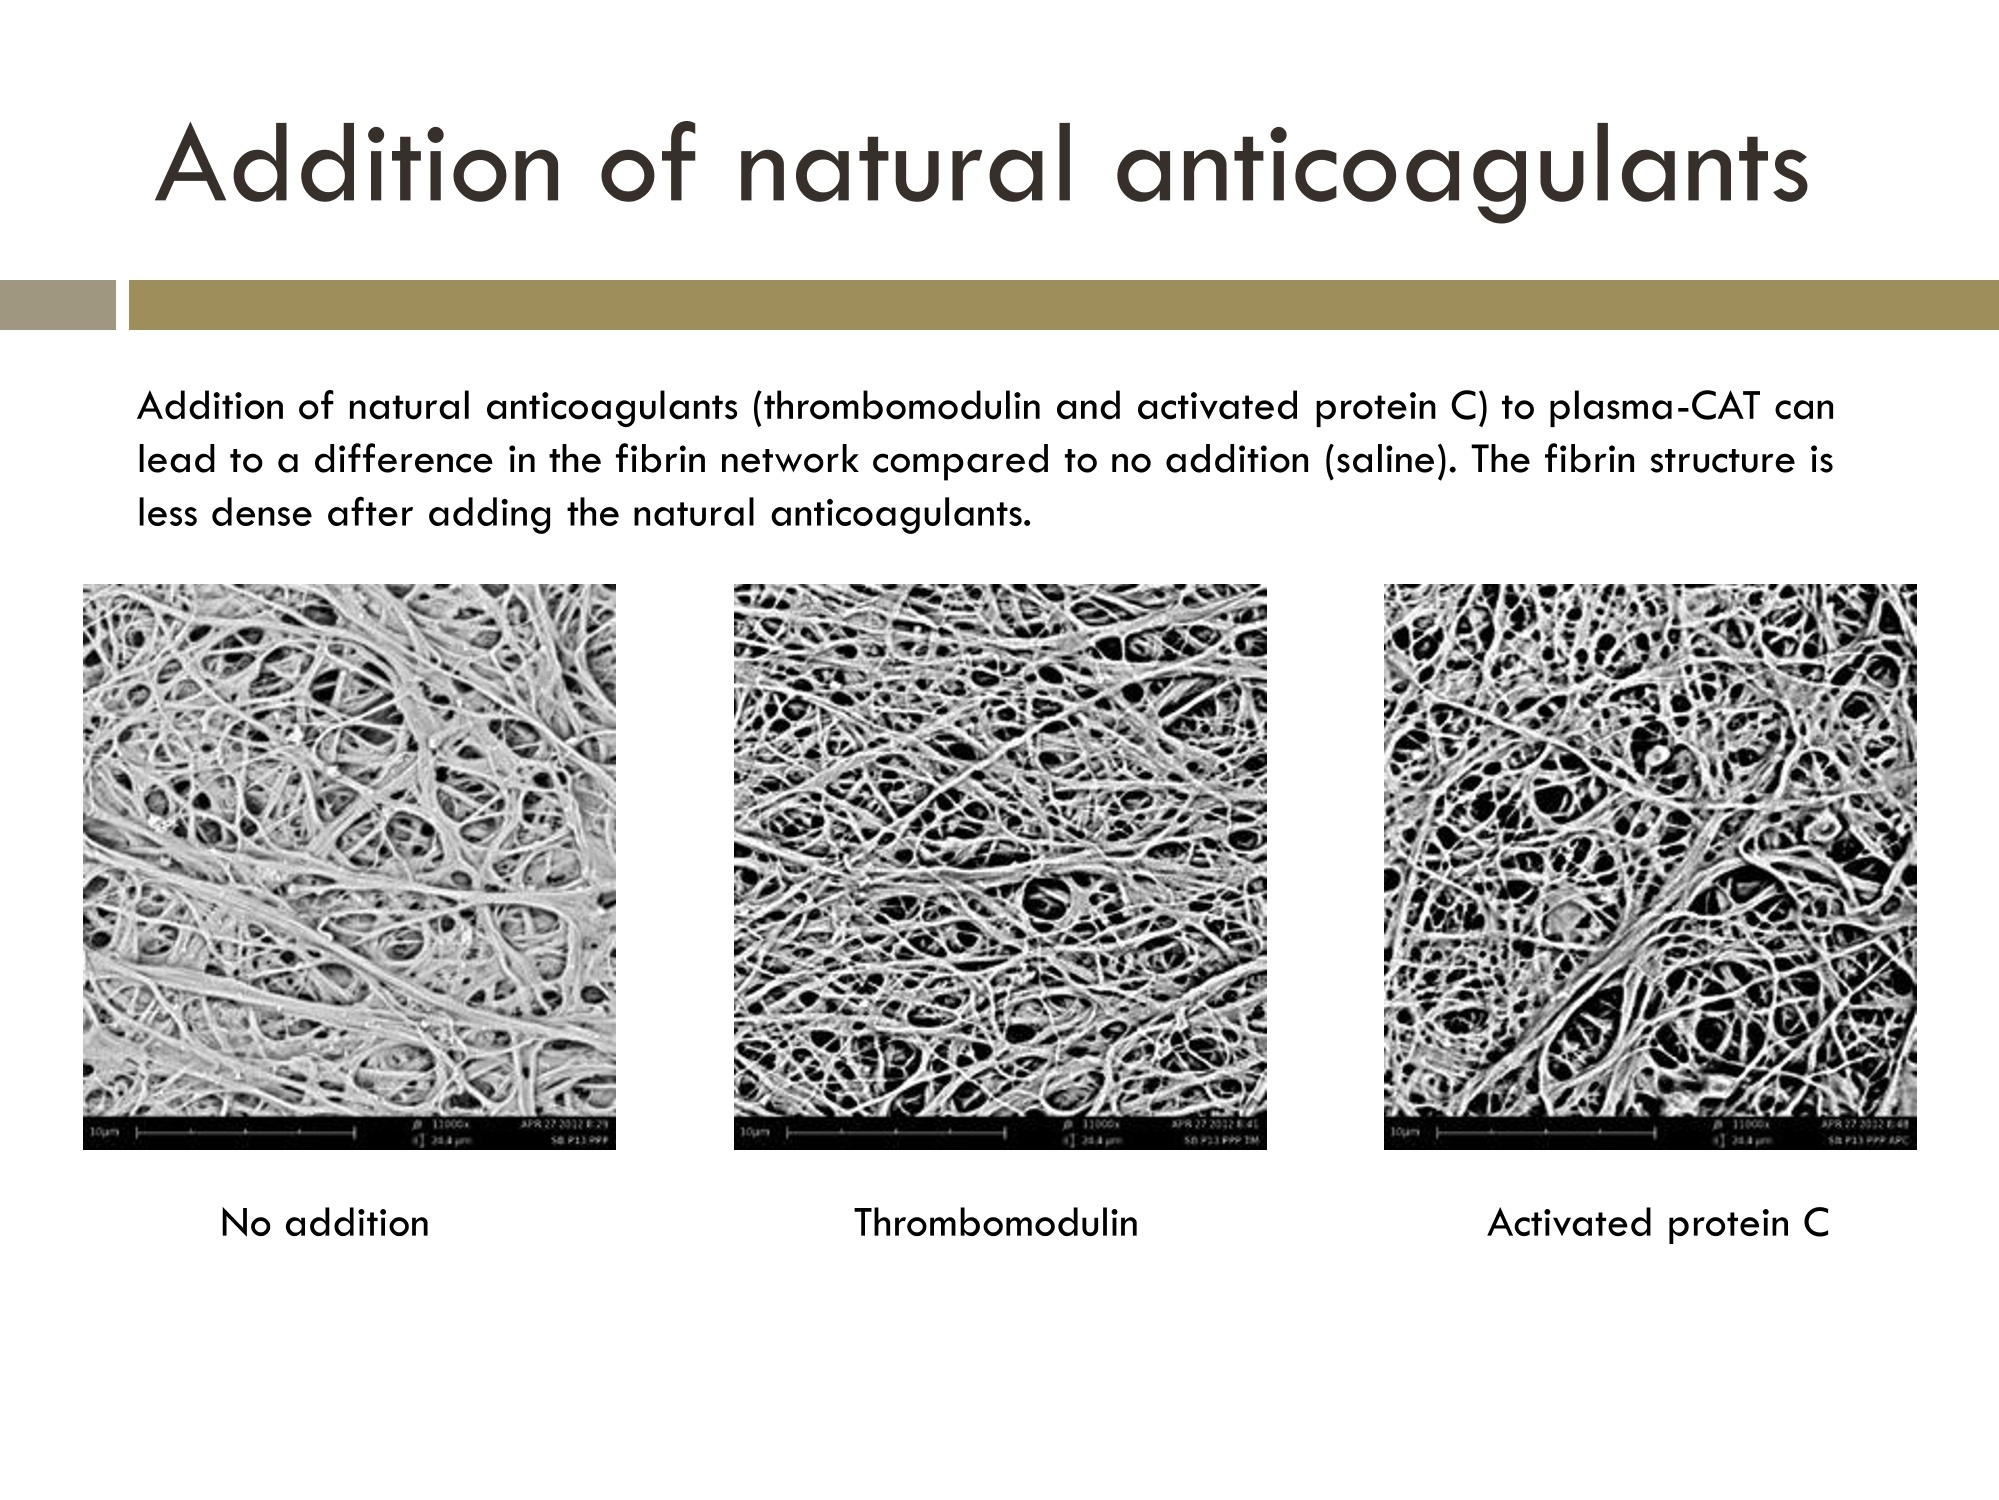
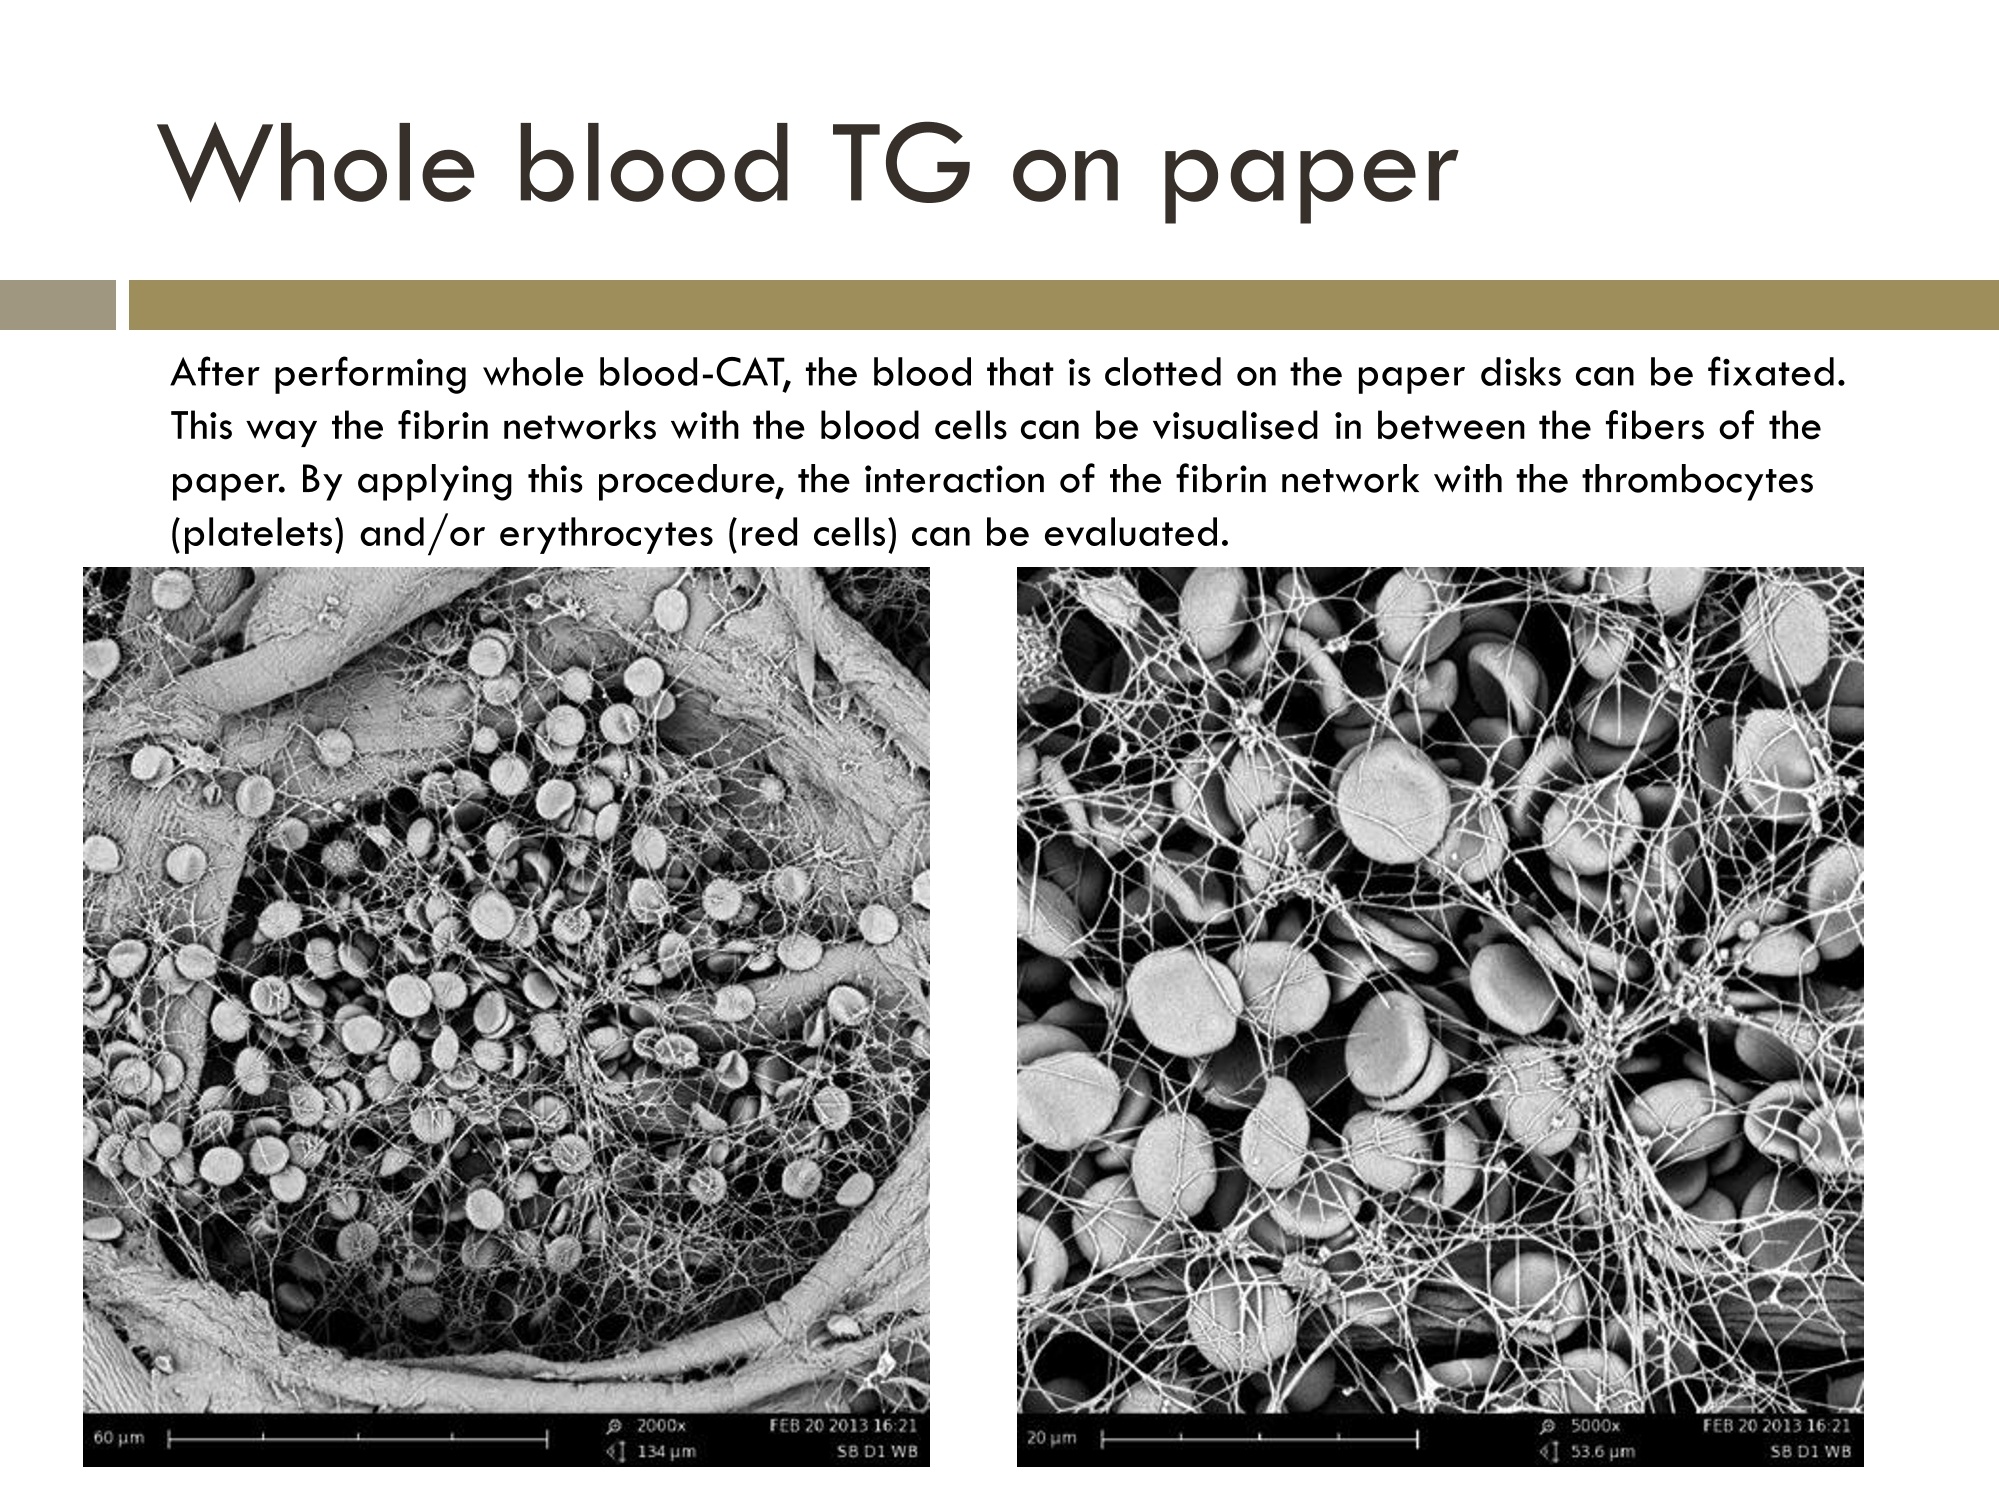
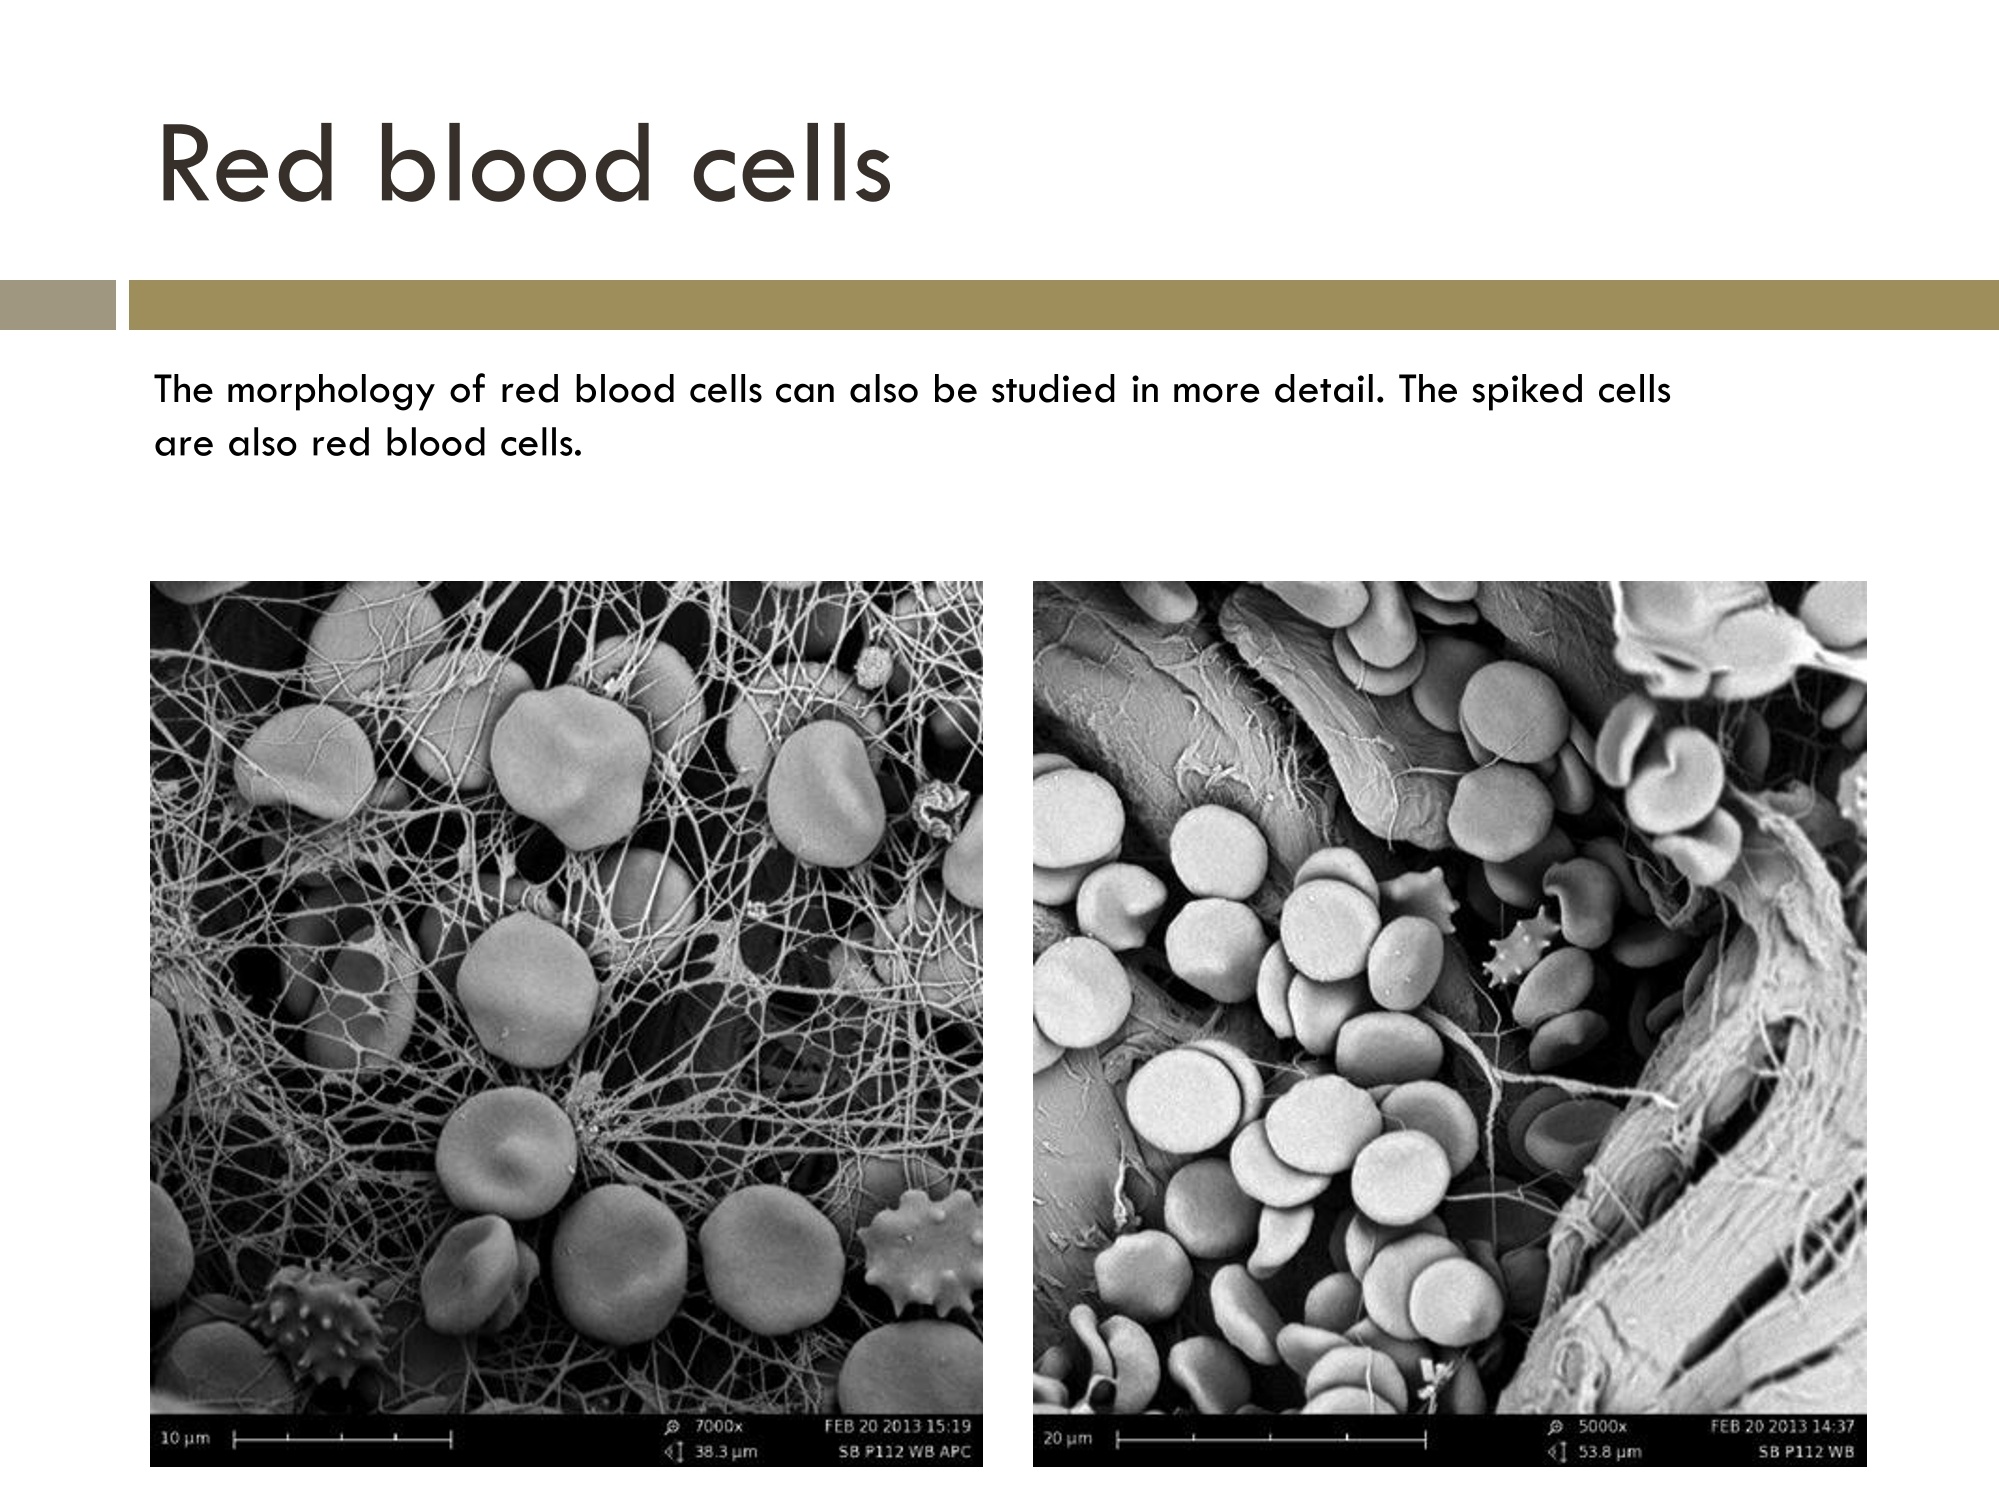
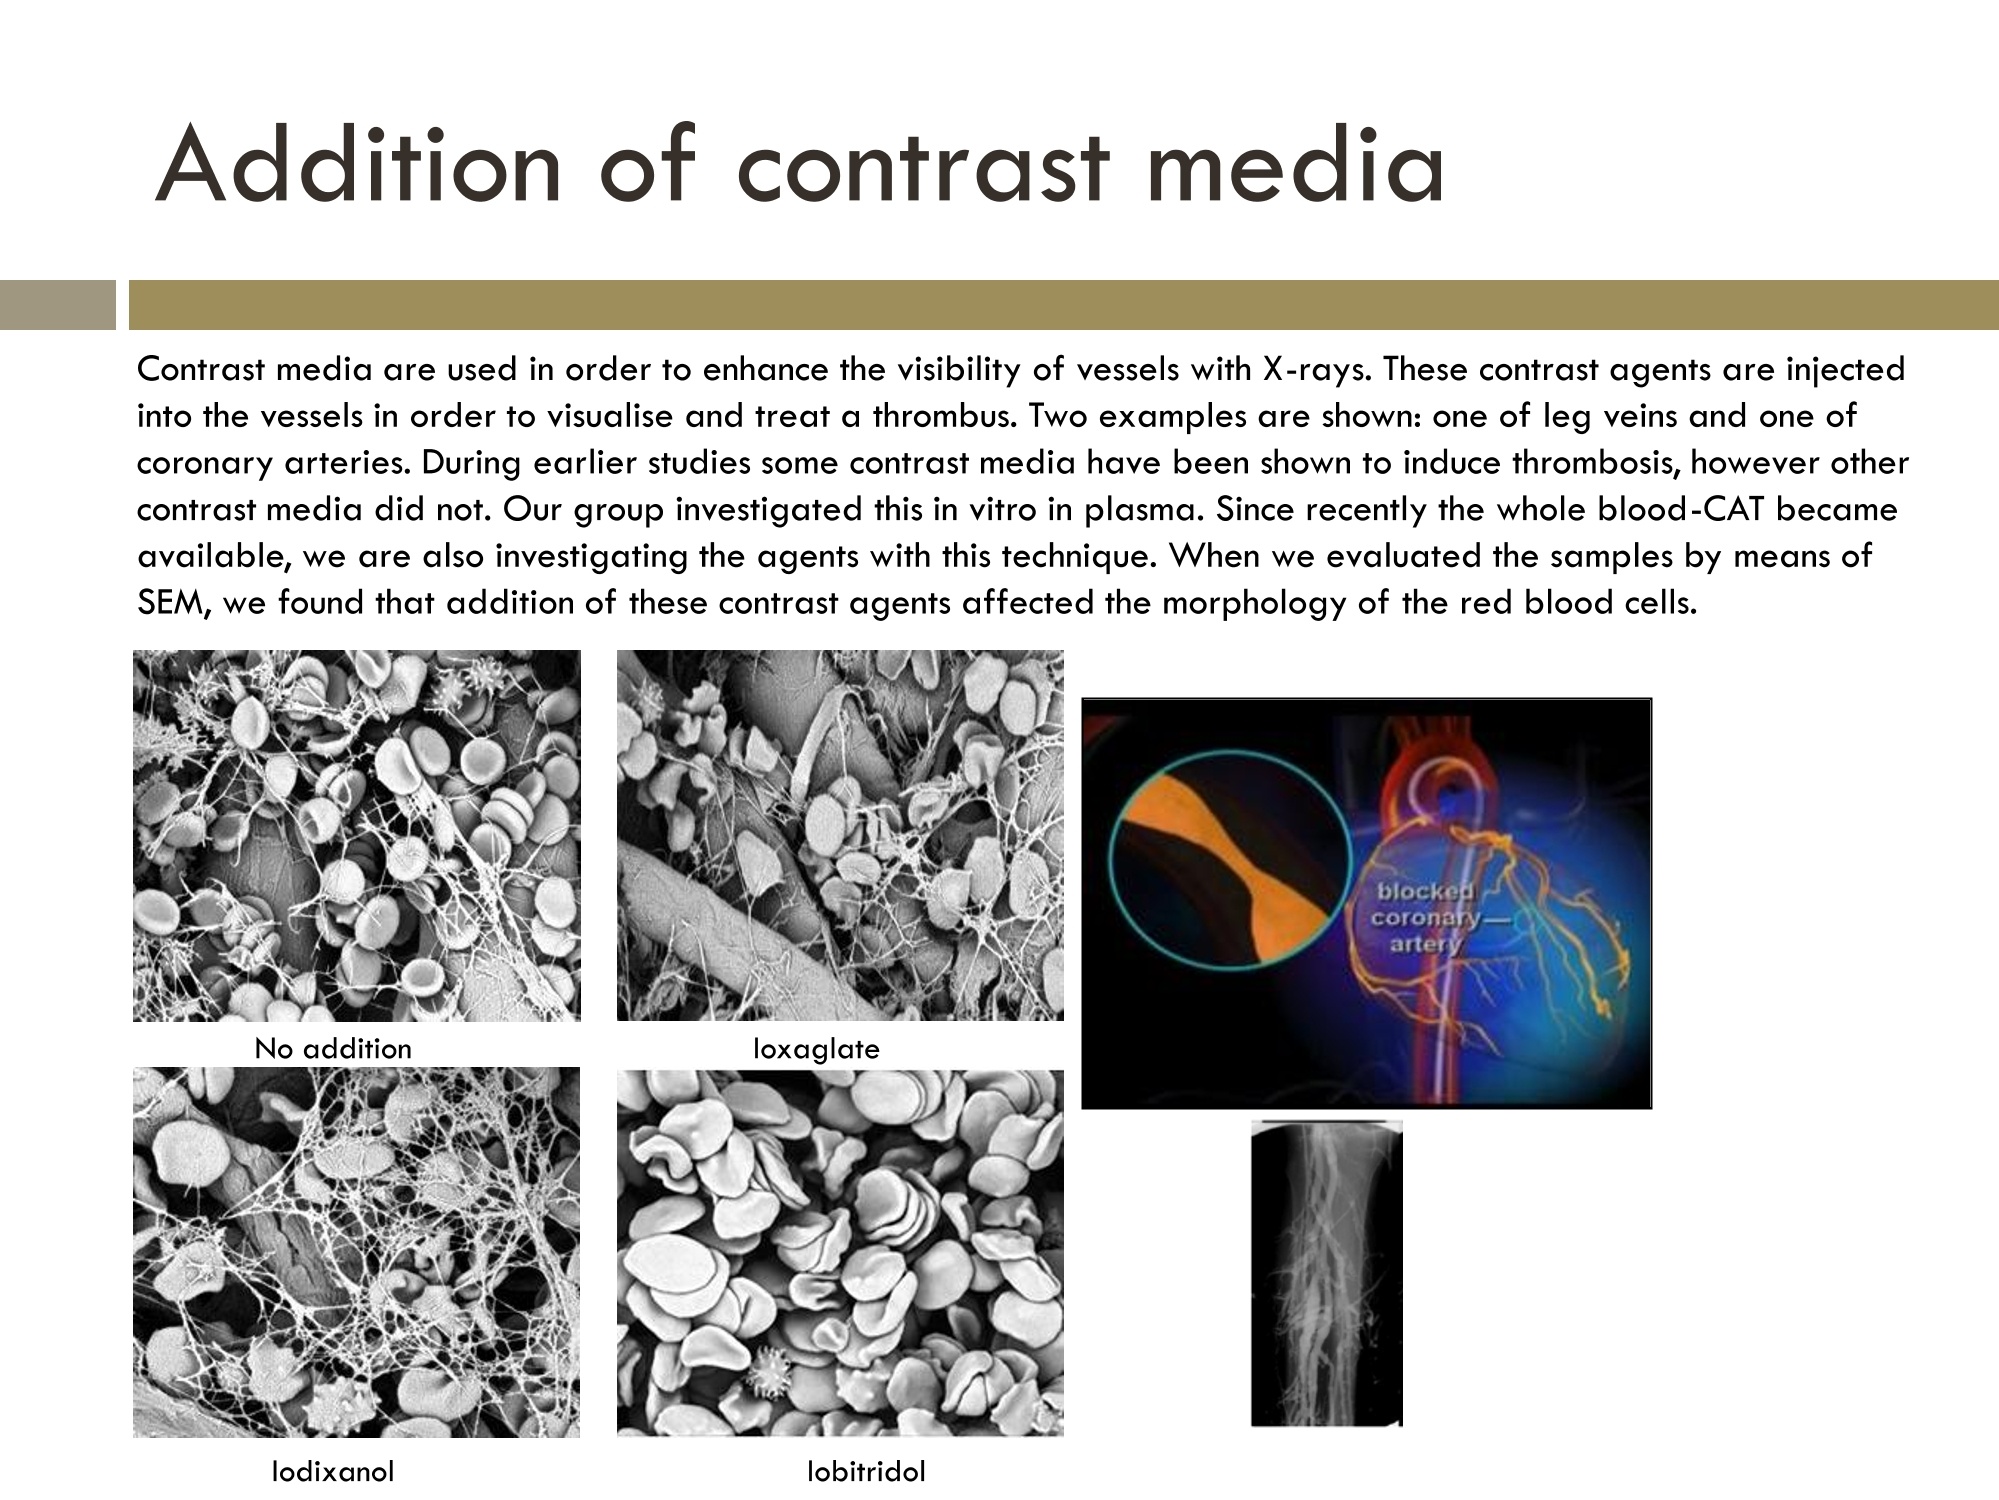
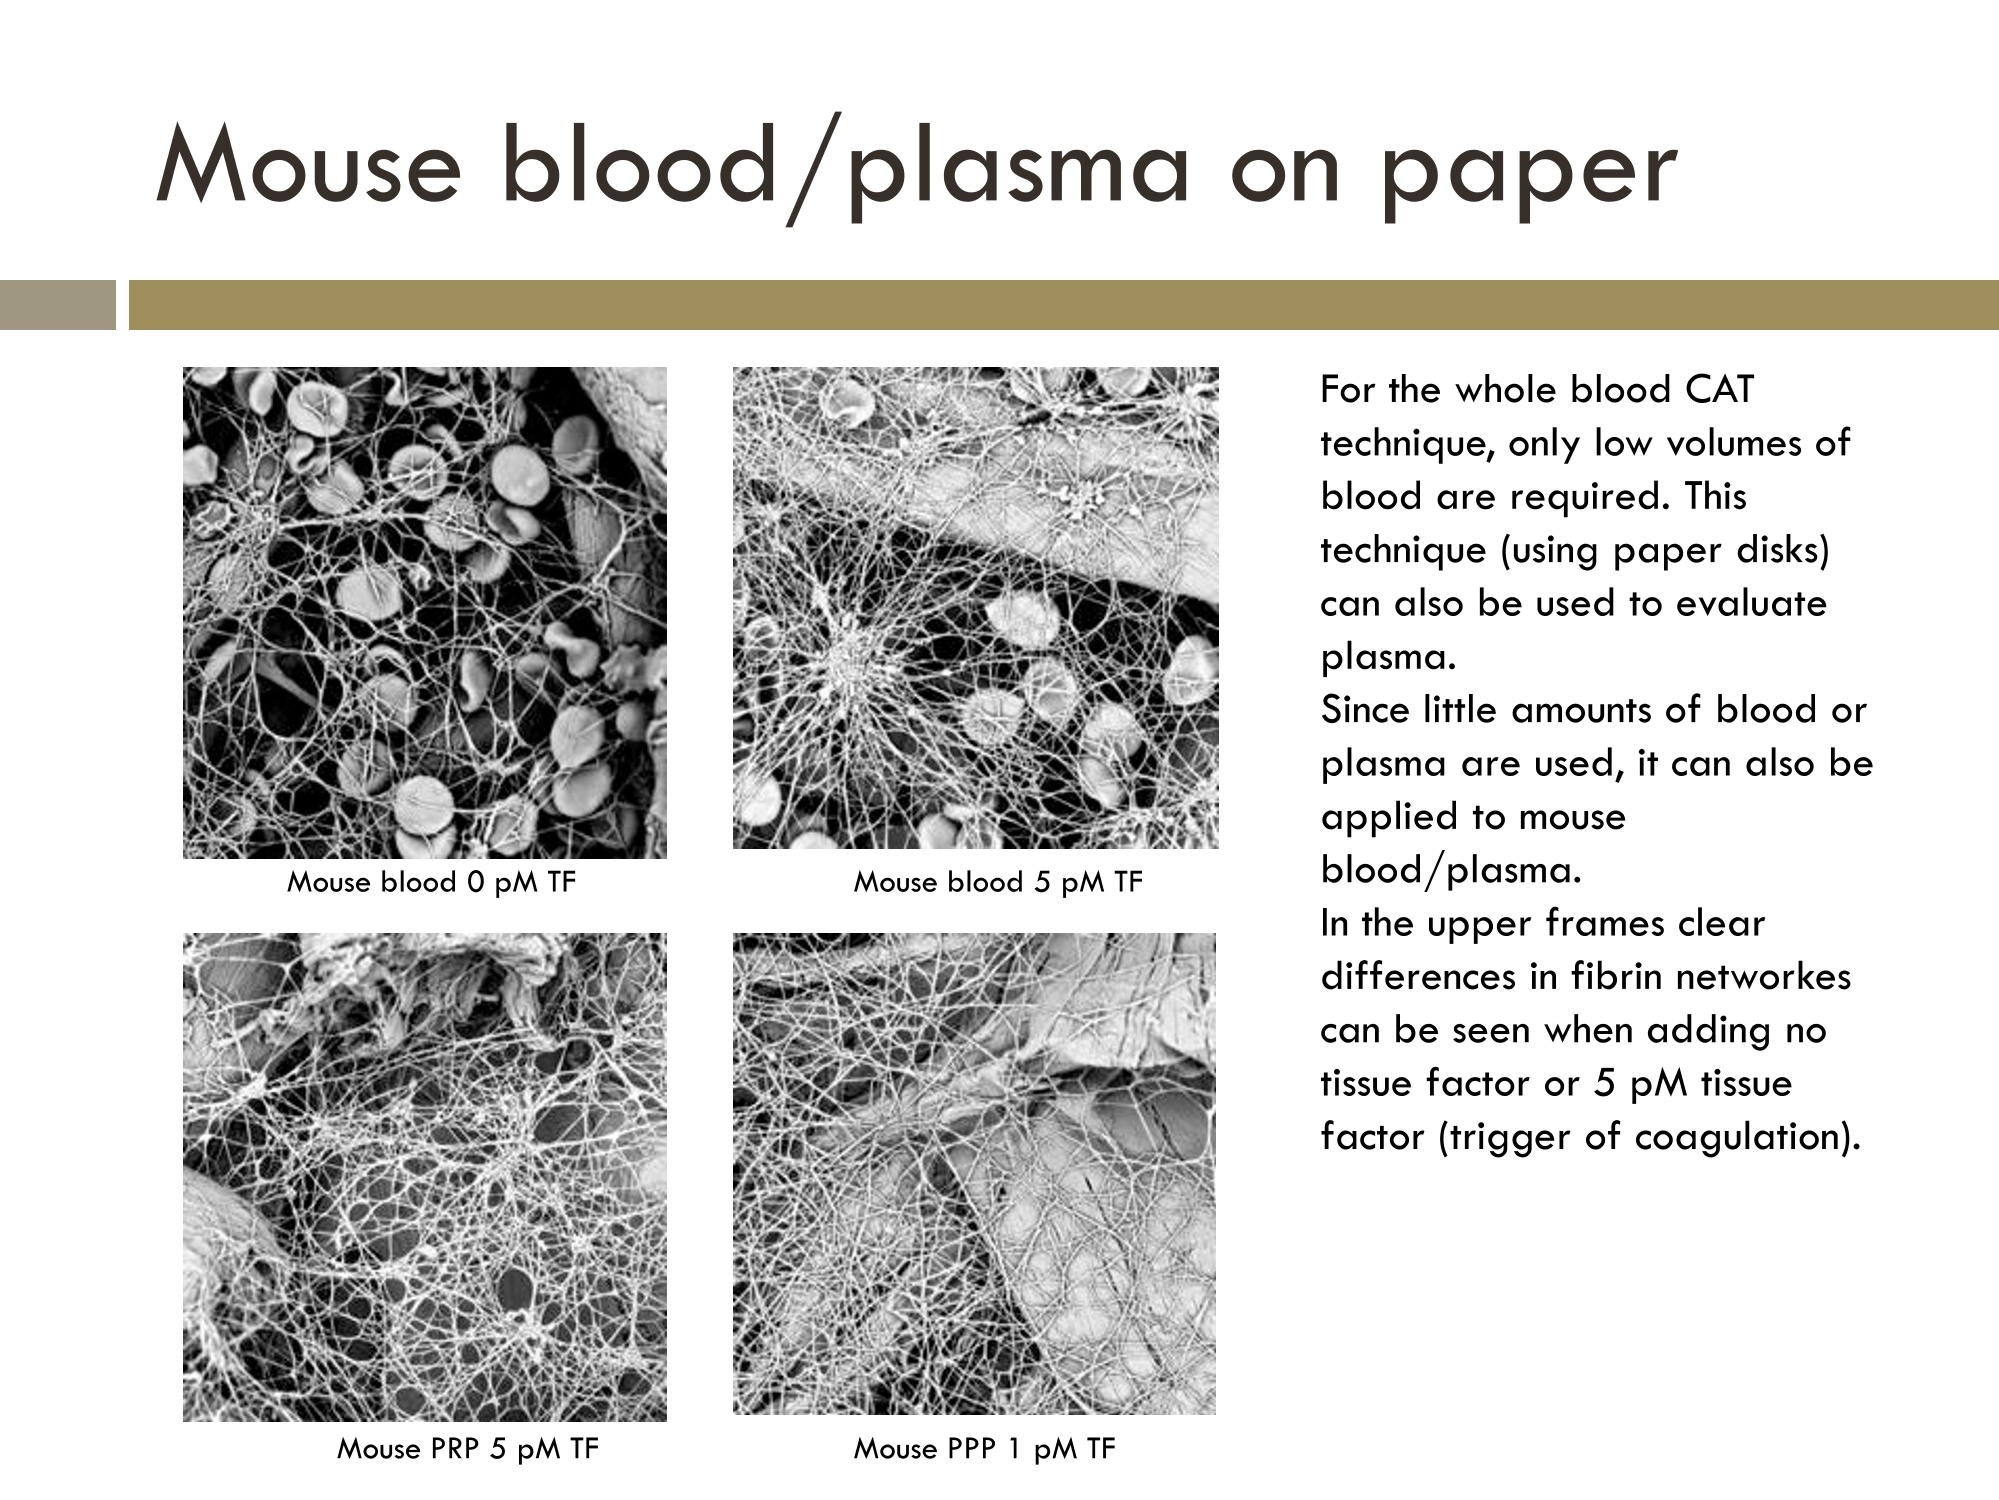
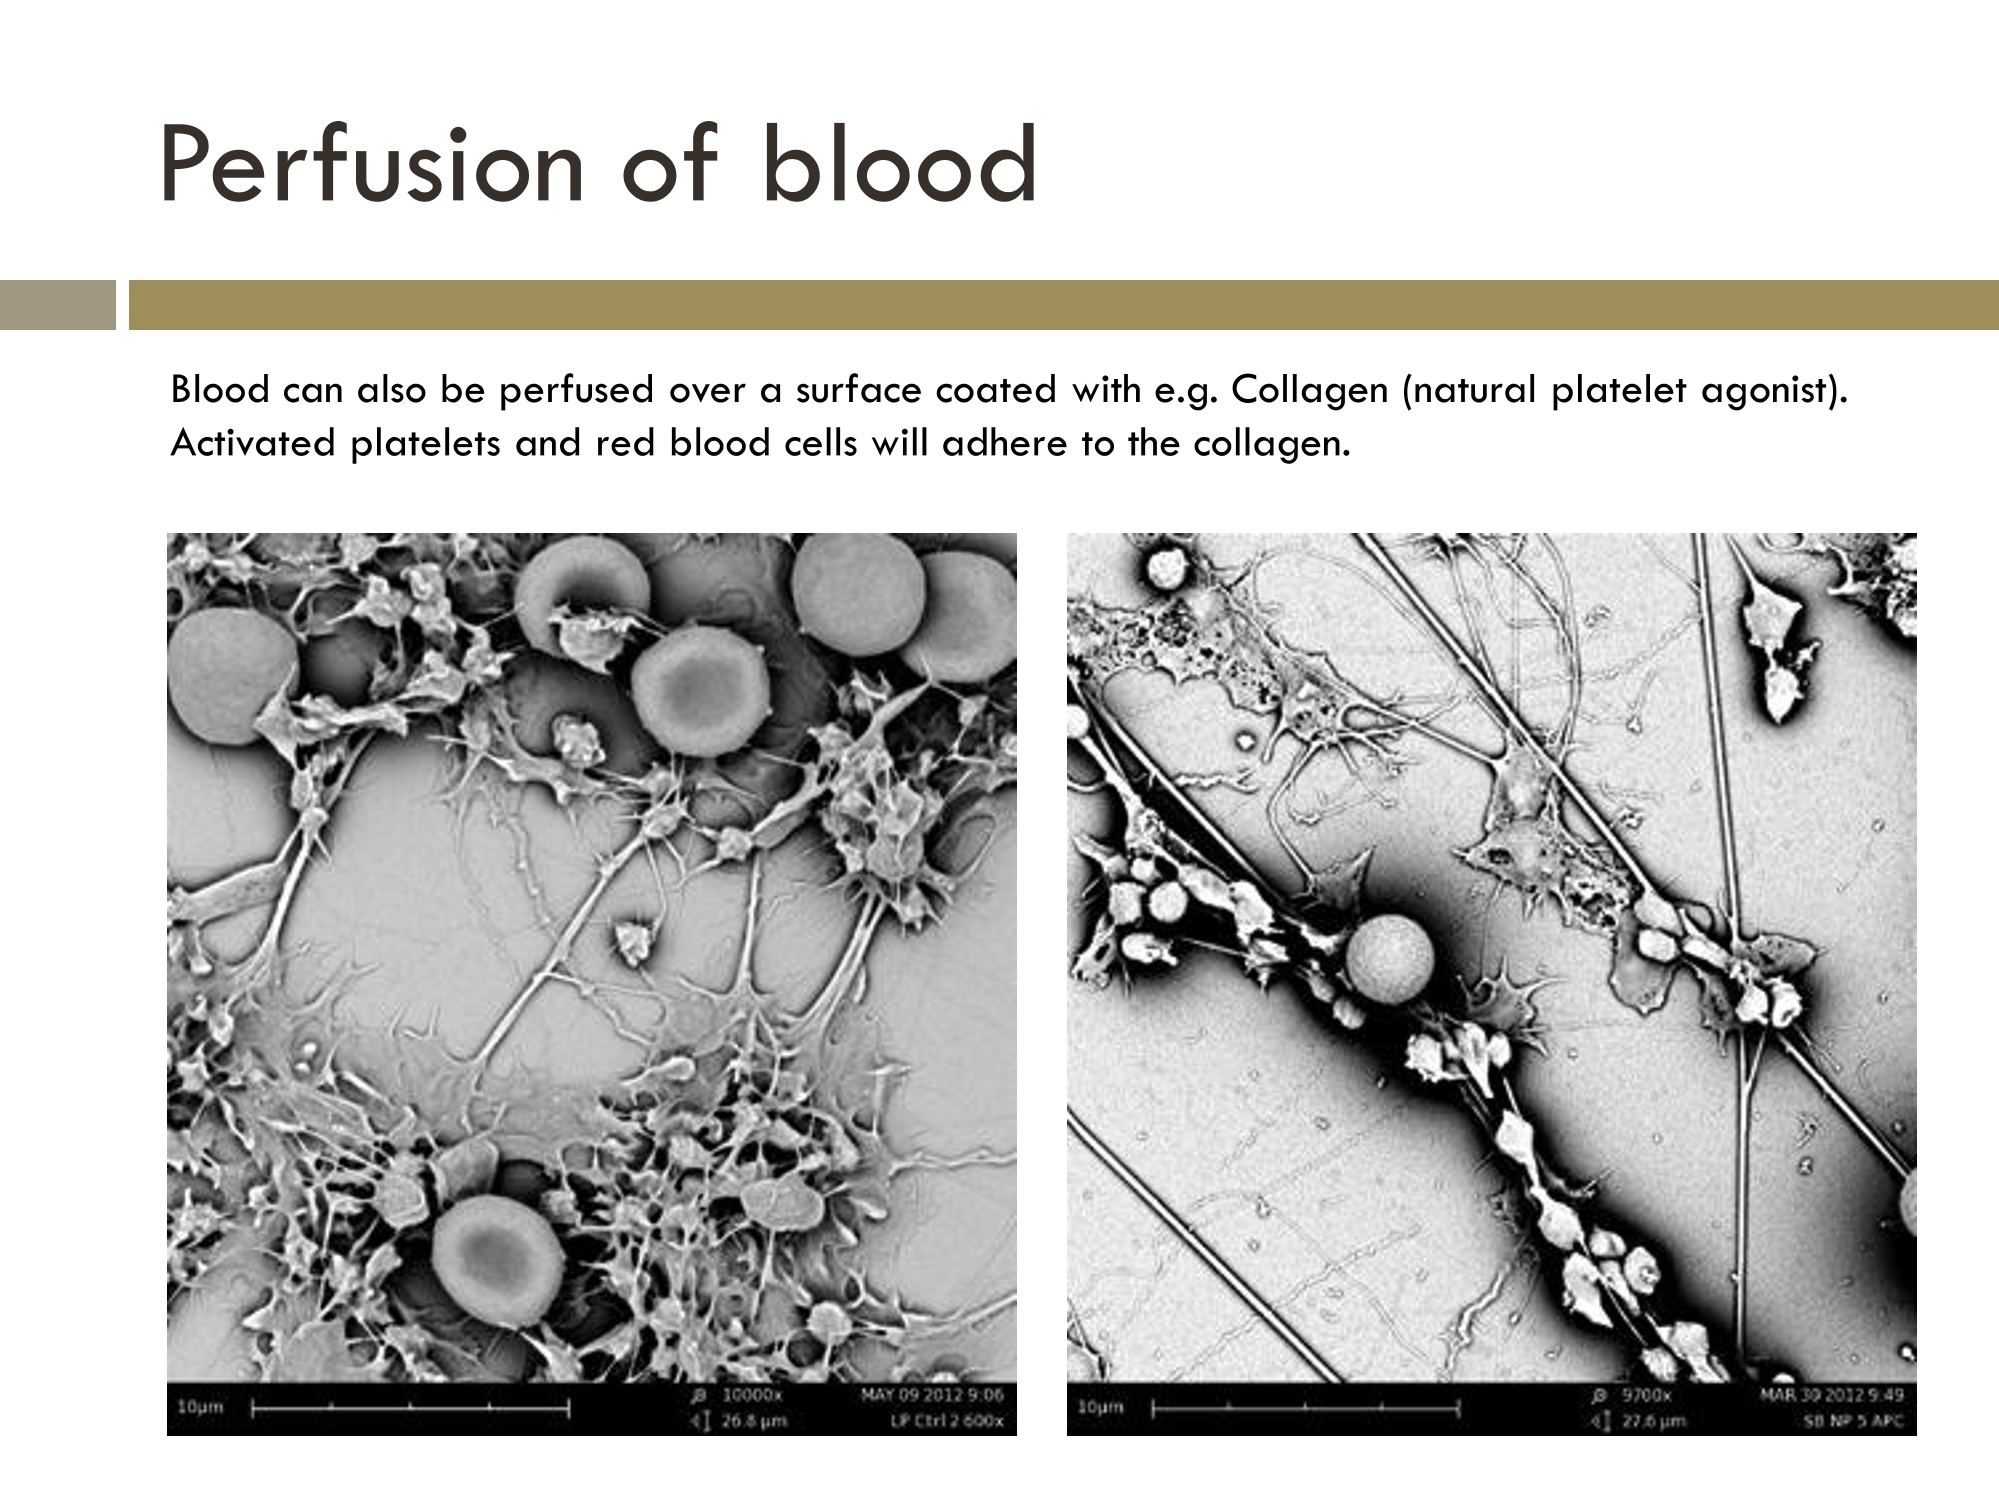
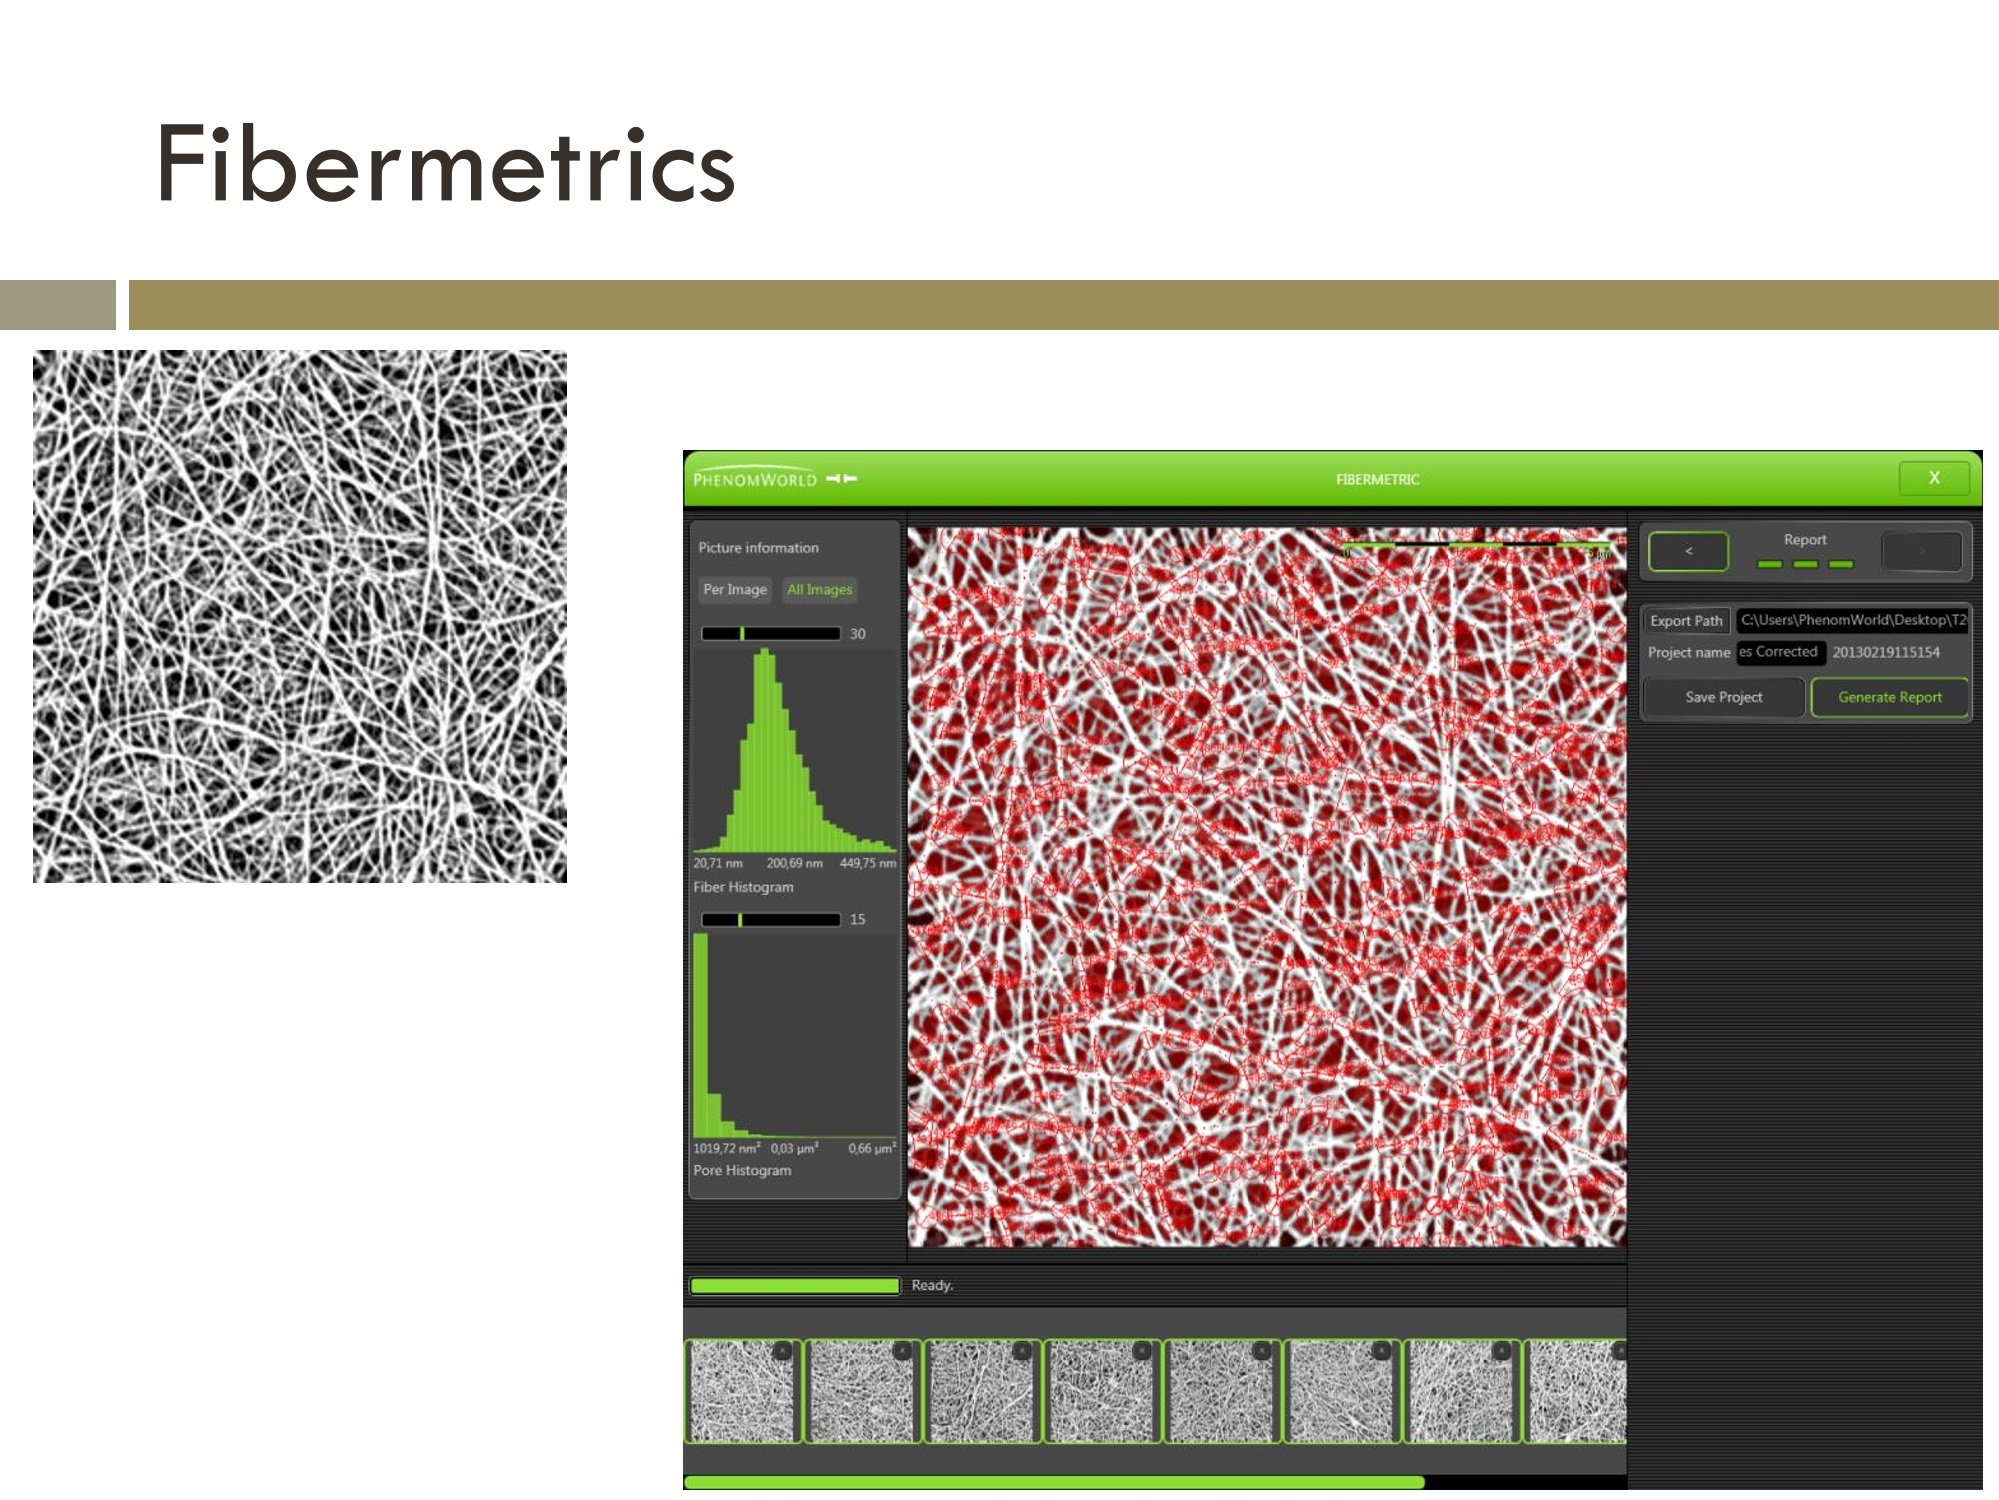
Coagulation Protocol USEE OF THE PHENOMA SEM TOINVESTIGATE FIBRIN Clinicallab Synapse b.v. Blood clot formation If a blood vessel wall breaks, a whole series of reactions is set in motion to accomplish Hemostasis.During hemostasis, three steps occur almost simultaneously: 1) Vascular spasm: smooth muscle contracts 2) Platelet plug formation: platelets adhere 3) Coagulation (blood clotting): fibrin forms a mesh that traps red cells and platelets, forming a clot Following hemostasis, clot retracts. It then dissolves as it is replaced by fibrous tissue that permanentlyprevents blood loss. Blood Clot MedicineNet Inc. Contact activation (intrinsic) pathway Damaged Tissue factor(extrinsic) pathway surface Trauma TFPI XII XIIa VIIa VII XI XIa VIII Tissue factorTrauma IX IXa VIIIa Antithrombin Xa Prothrombin . Thrombin Common (II) Va (IIa) pathway Fibrinogen Fibrin (I) (Ia) Active Protein C XIIIa XIII Protein S Protein C+ .Cross-linkedfibrin clot thrombomodulin Sample preparation Both whole blood and plasma can be used in order to perform thrombin generation testing. Onceyou draw blood, you can centrifuge it in order to prepare plasma. Dependening on the speed atwhich this is done, platelet poor plasma (PPP) or platelet rich plasma (PRP) can be prepared. Platelet poor plasma (PPP): Coagulation factors Platelet rich plasma (PRP): Coagulation factors and platelets Whole blood (WB): Coagulation factors, platelets and red/white blood cells Calibrated automated thrombinography In order to evaluate the function of the coagulation system, a global functional test has been developed and ispresently world-wide used “Thrombin generation”. Thrombin generation experiments are performed in a 96-wellplate and can be carried out in different ‘media’. This is why we distinguish between calibrated automatedthrombinography (CAT) in plasma and whole blood CAT. Two parallel wells are used for each experiment: one TGwell and one calibrator well. The calibrator is used to correct for the colour of the plasma. This is done bycomparing the fluorescent signal in the TG well to the fluorescent signal produced by a constant amount thrombin.In the plasma CAT a total volume of 120 ul of plasma with reagents is used. In the whole blood CAT 5 ul of bloodwith reagents is pipetted onto a paper disk. This is then covered with mineral oil to prevent evaporation fromoccurring. Plasma CAT Whole blood CAT Calibrated automated thrombinography The fluorescent signal is Thrombin cleaves fluorogenic substrate Thrombogram transformed into athrombogram bymathematicalprocedures and acorrection for thecalibration. Fourparameters can bederived from thethrombogram for theevaluation of a TGcurve: ETP (endogenousthrombin potential, totalamount of substrate thatcan potentially beconverted by thrombinif a sufficient amount ofsubstrate is available),peak height (maximalthrombin concentrationpresent in sample), lagtime (clotting time) and time-to-peak. Calibrated automated thrombinography This slide demonstrates clearly the effect of therapy with anticoagulants on the thrombin generation.So normal plasma was spiked with different types of anticoagulants (i.e. various modes of action)and the parameters of the TG were assessed. The TG curves change in shape compared to the baseline (without any addition). The lag time isprolonged, the peak height is diminished and the ETP is decreased (in most cases). EXAMPLE OF APPLICATION CAT Fibrin formation During thrombin generation, fibrin will be formed and this can be visualized by SEM. Fibrin analysis SEM images of fibrin are usually analysed by evaluating three parameters: fiber thickness,density and the number of fibers. Fiber thickness Density Number of fibers 2Was人iddp TG in flat bottom 96-well plate Fixate clots in 2.5% glutaraldehyde (grade l) in PBS (pH 7.2) → 1h at RT, overnight at 4°CWash with PBS (5x) Fixate with Os (1%) in sodium cacodylate (200 mM, pH 7.4) → 1h at RT Dehydrate in ethanol (3 min) 30%,50%,70%,90%,100%(3x) Dehydrate in hexamethyldisilazane (HMDS) HMDS/ethanol (100%) 1:1 (3 min), HMDS (10 min) As PBS buffer we use Sorensen’s PBS (0.2 M, pH 7.2) OsO4 is used as a secondary fixation and also serves as a staining Samples are first dehydrated in ethanol 30%, 50%,70%, 90%(1x) and 3x in 100% After this the samples are also dehydrated in hexamethydisilazane (HMDS). First in a 1:1dilution of HMDS with 100% ethanol and then in pure HMDS Remove samples from wells Examples Bleeding E& Thrombosis Bleeding and thrombosis are life-threatening complications of the hemostatic system. Thrombingeneration is significantly diminished in the former while it is elevated markedly in the latterirrespective of the underlying cause (congenital or acquired). Bleeding (congenital deficiency of clotting factors such as FVIII in hemophilia A and FIX inhemophilia B and others, in all types of surgery, etc) Thrombosis (increase of plasma level of clotting factors, oral contraceptives, mutatant proteinssuch as FV Leiden, etc) Therapy (vitamin K antagonists, heparins, ...) Haemophilia A Genetic disorder (X-chromosome) Low levels of fVill Bleeding tendency Treatment with fVIlI concentrate Why useeSSEManalysis. with TG? When measuring TG in FVIII deficient plasma, the TG is lower (red curve) compared to normal(grey curve). After addition of increasing concentrations of FVIII concentrate, the TG curvesnormalize. The more thrombin the less bleeding, but the more thrombosisThe less thrombin the more bleeding, but the less thrombosis Why useeSSEMCanalysiswith TG? In the SEM images it is clear that with increasing amounts of the FVIII concentrate, the fibers becomethinner and more dense. This is an indication of a more solid fibrin clot (i.e. restoration of thehemostasis system). Time (min) The images represent an example of fibrin fixated after plasma CAT at 2 magnifications (5000xand 11,000x). Treatment with vit K antagonists When fixating the fibrin of patients who are taking oral anticoagulants (vitamin K antagonists),one can see that with a higher concentration of the medication (INR 3.1) the fibrin fibers arethicker and less dense compared to the lower concentration of the medication (INR 1.9). Addition of natural anticoagulants (thrombomodulin and activated protein C) to plasma-CAT canlend tansifference in the fibrin network compared to no addition (saline). The tibrin structure isless dense after adding the natural anticoagulants. No addition Thrombomodulin Activated protein C Whole blood TGon paper After performing whole blood-CAT, the blood that is clotted on the paper disks can be fixated.This way the fibrin networks with the blood cells can be visualised in between the fibers of thepaper. By applying this procedure, the interaction of the fibrin network with the thrombocytes(platelets) and/or erythrocytes (red cells) can be evaluated. 134pm SBD1WB Reedblood cells The morphology of red blood cells can also be studied in more detail. The spiked cellsare also red blood cells. Addition of contrast media Contrast media are used in order to enhance the visibility of vessels with X-rays. These contrast agents are injectedinto the vessels in order to visualise and treat a thrombus. Two examples are shown: one of leg veins and one ofcoronary arteries. During earlier studies some contrast media have been shown to induce thrombosis, however othercontrast media did not. Our group investigated this in vitro in plasma. Since recently the whole blood-CAT becameavailable, we are also investigating the agents with this technique. When we evaluated the samples by means ofSEM, we found that addition of these contrast agents affected the morphology of the red blood cells. No addition loxaglate lodixanol lobitridol Mouse blood 0 pM TF Mouse blood 5 pM TF For the whole blood CATtechnique, only low volumes ofblood are required. Thistechnique (using paper disks)can also be used to evaluateplasma. Since little amounts of blood orplasma are used, it can also beapplied to mouse blood/plasma. In the upper frames cleardifferences in fibrin networkescan be seen when adding notissue factor or 5 pM tissuefactor (trigger of coagulation). Perfusion of blood Blood can also be perfused over a surface coated with e.g. Collagen (natural platelet agonist).Activated platelets and red blood cells will adhere to the collagen. In order to analyse the fibrin images, the fibermetrics software can be used. This determines thefiber thickness and the size of the pores between the fibers.Several pictures should be taken andanalysed in order to reach significant results. Fibermetrics 口 Fiber thickness Pore size Saartje Bloemenh february: Paper disk with blood (and reagents) covered with mineral oil
确定


还剩26页未读,是否继续阅读?

产品配置单
复纳科学仪器(上海)有限公司为您提供《飞纳台式扫描电镜在血液细胞领域的应用》,该方案主要用于全血/血清/血浆中--检测,参考标准--,《飞纳台式扫描电镜在血液细胞领域的应用》用到的仪器有飞纳台式扫描电子显微镜专业版Pro、飞纳台式扫描电子显微镜标准版 Pure、飞纳台式扫描电镜
推荐专场
相关方案
更多
该厂商其他方案
更多