


1. AFAM is a state-of-the-art SPM technique that can be used to map variations in surface hardness of soft as well as very hard samples where other techniques, such as Phase Imaging or Force Modulation, fail.
2. In AFAM mode, the resonance response from the cantilever is measured when the cantilever tip is in contact with the sample surface. By adjusting the force of contact the influence of adhesion force can be almost excluded or approached to zero.
3. With AFAM it’s possible to perform numerical calculations of hardness and Young’s module, as this unique opportunity is included in our software as an option based on the theory of Prof. Walter Arnold.
4. The contrast of AFAM images is much sharper comparing with one obtained in Phase Imaging or Force Modulation mode.
5. AFAM can be operated in air as well as in liquid environment (i.e. in droplet).
6. AFAM is a non-destructive technique.
方案详情

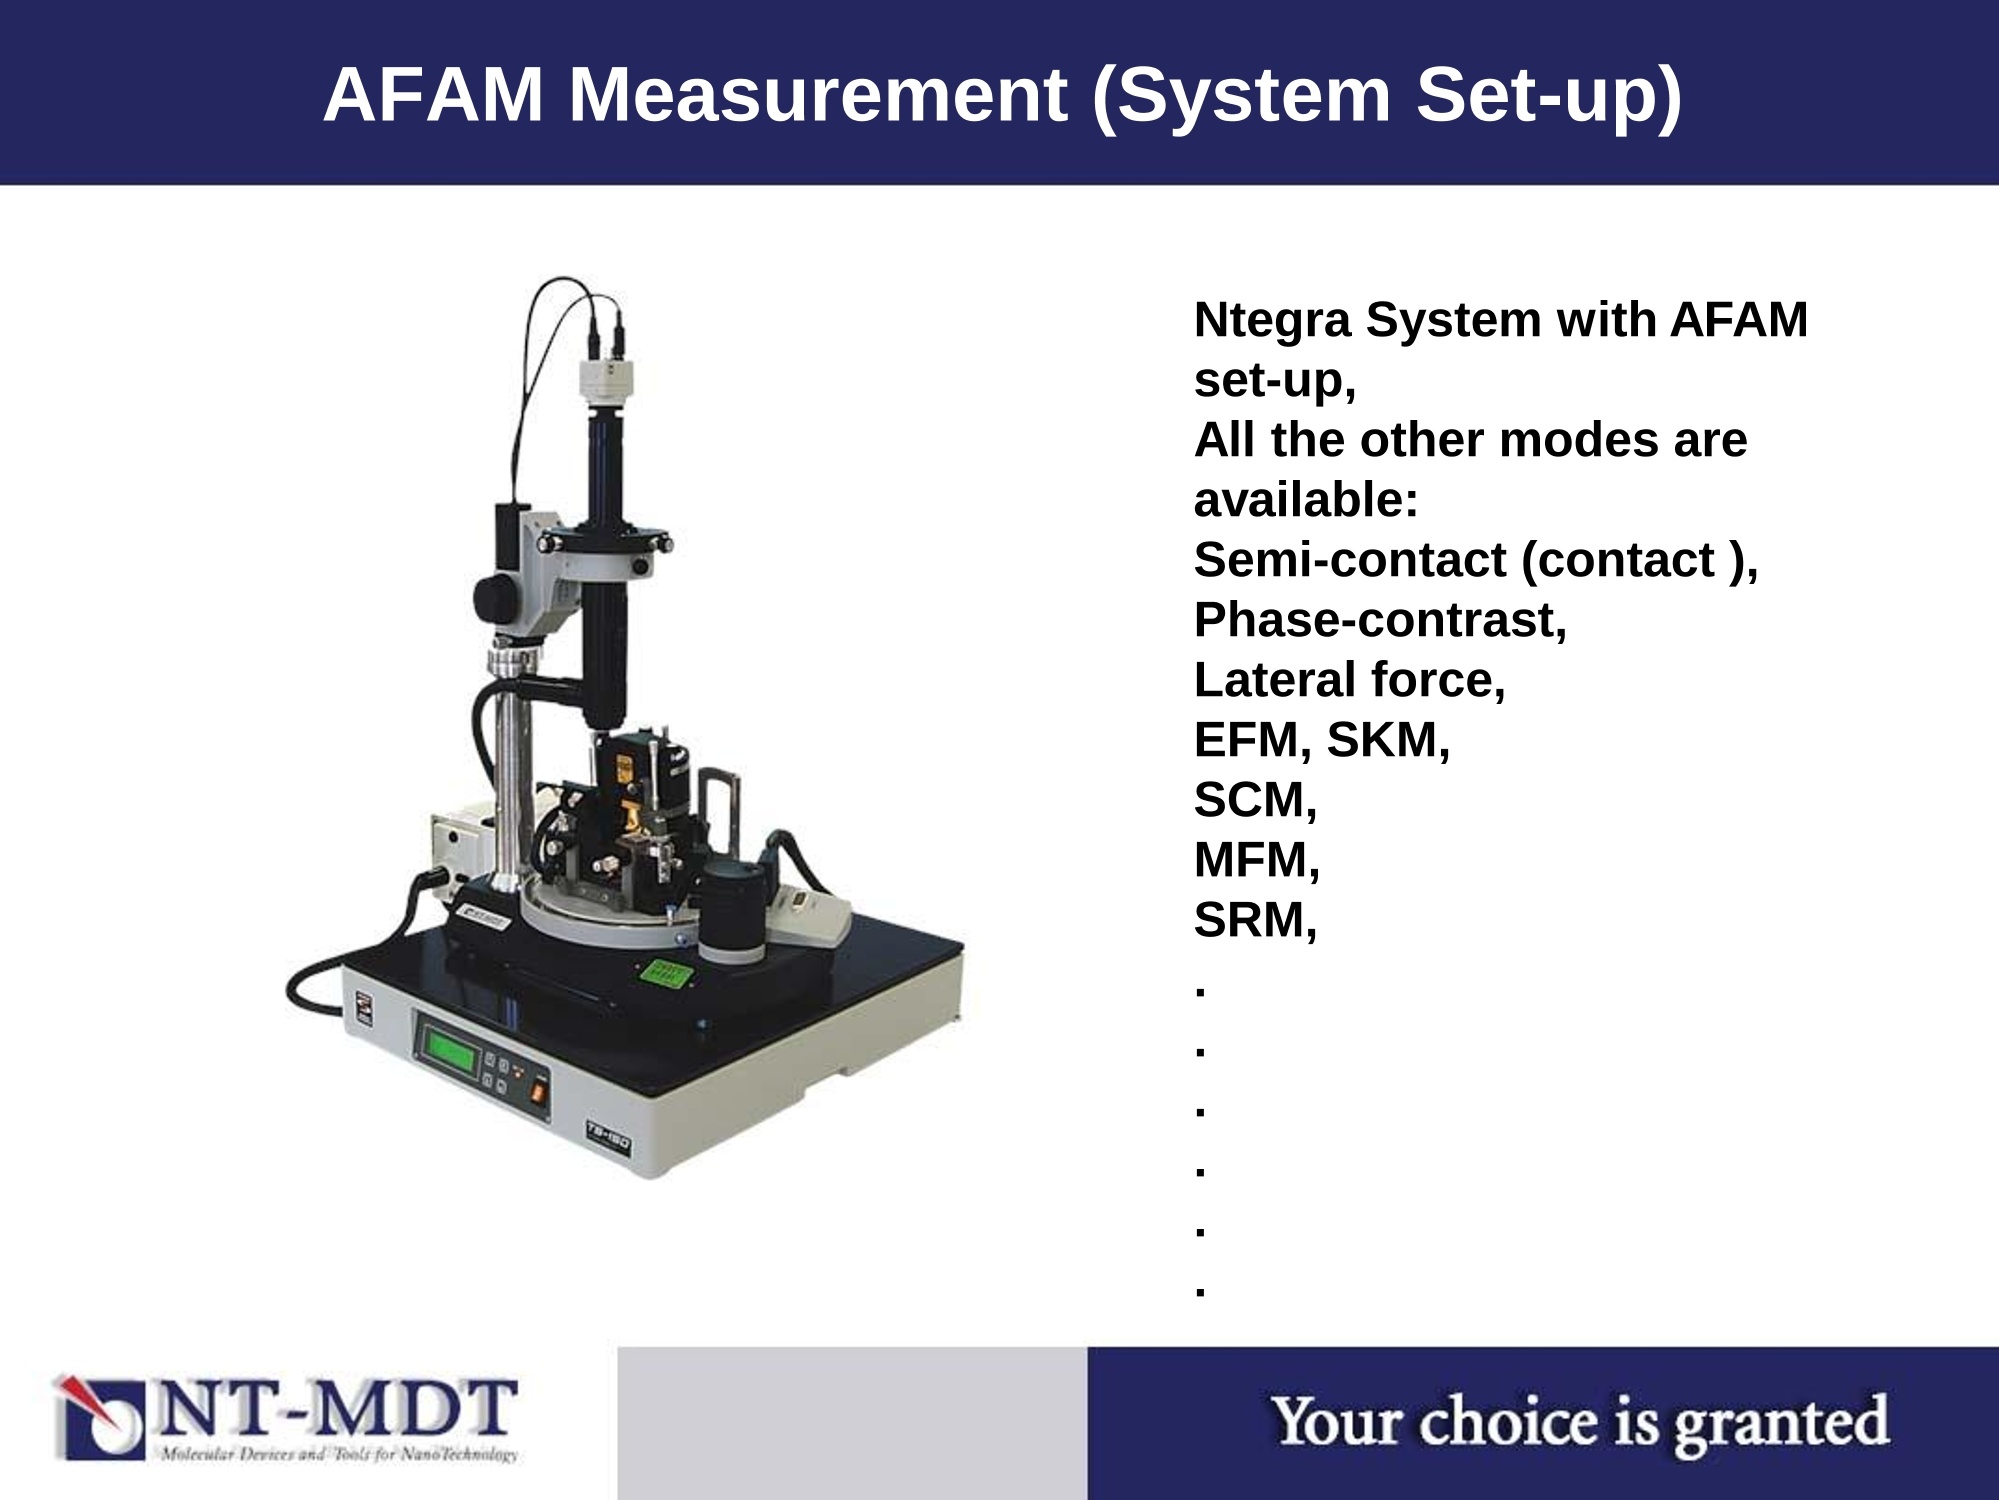
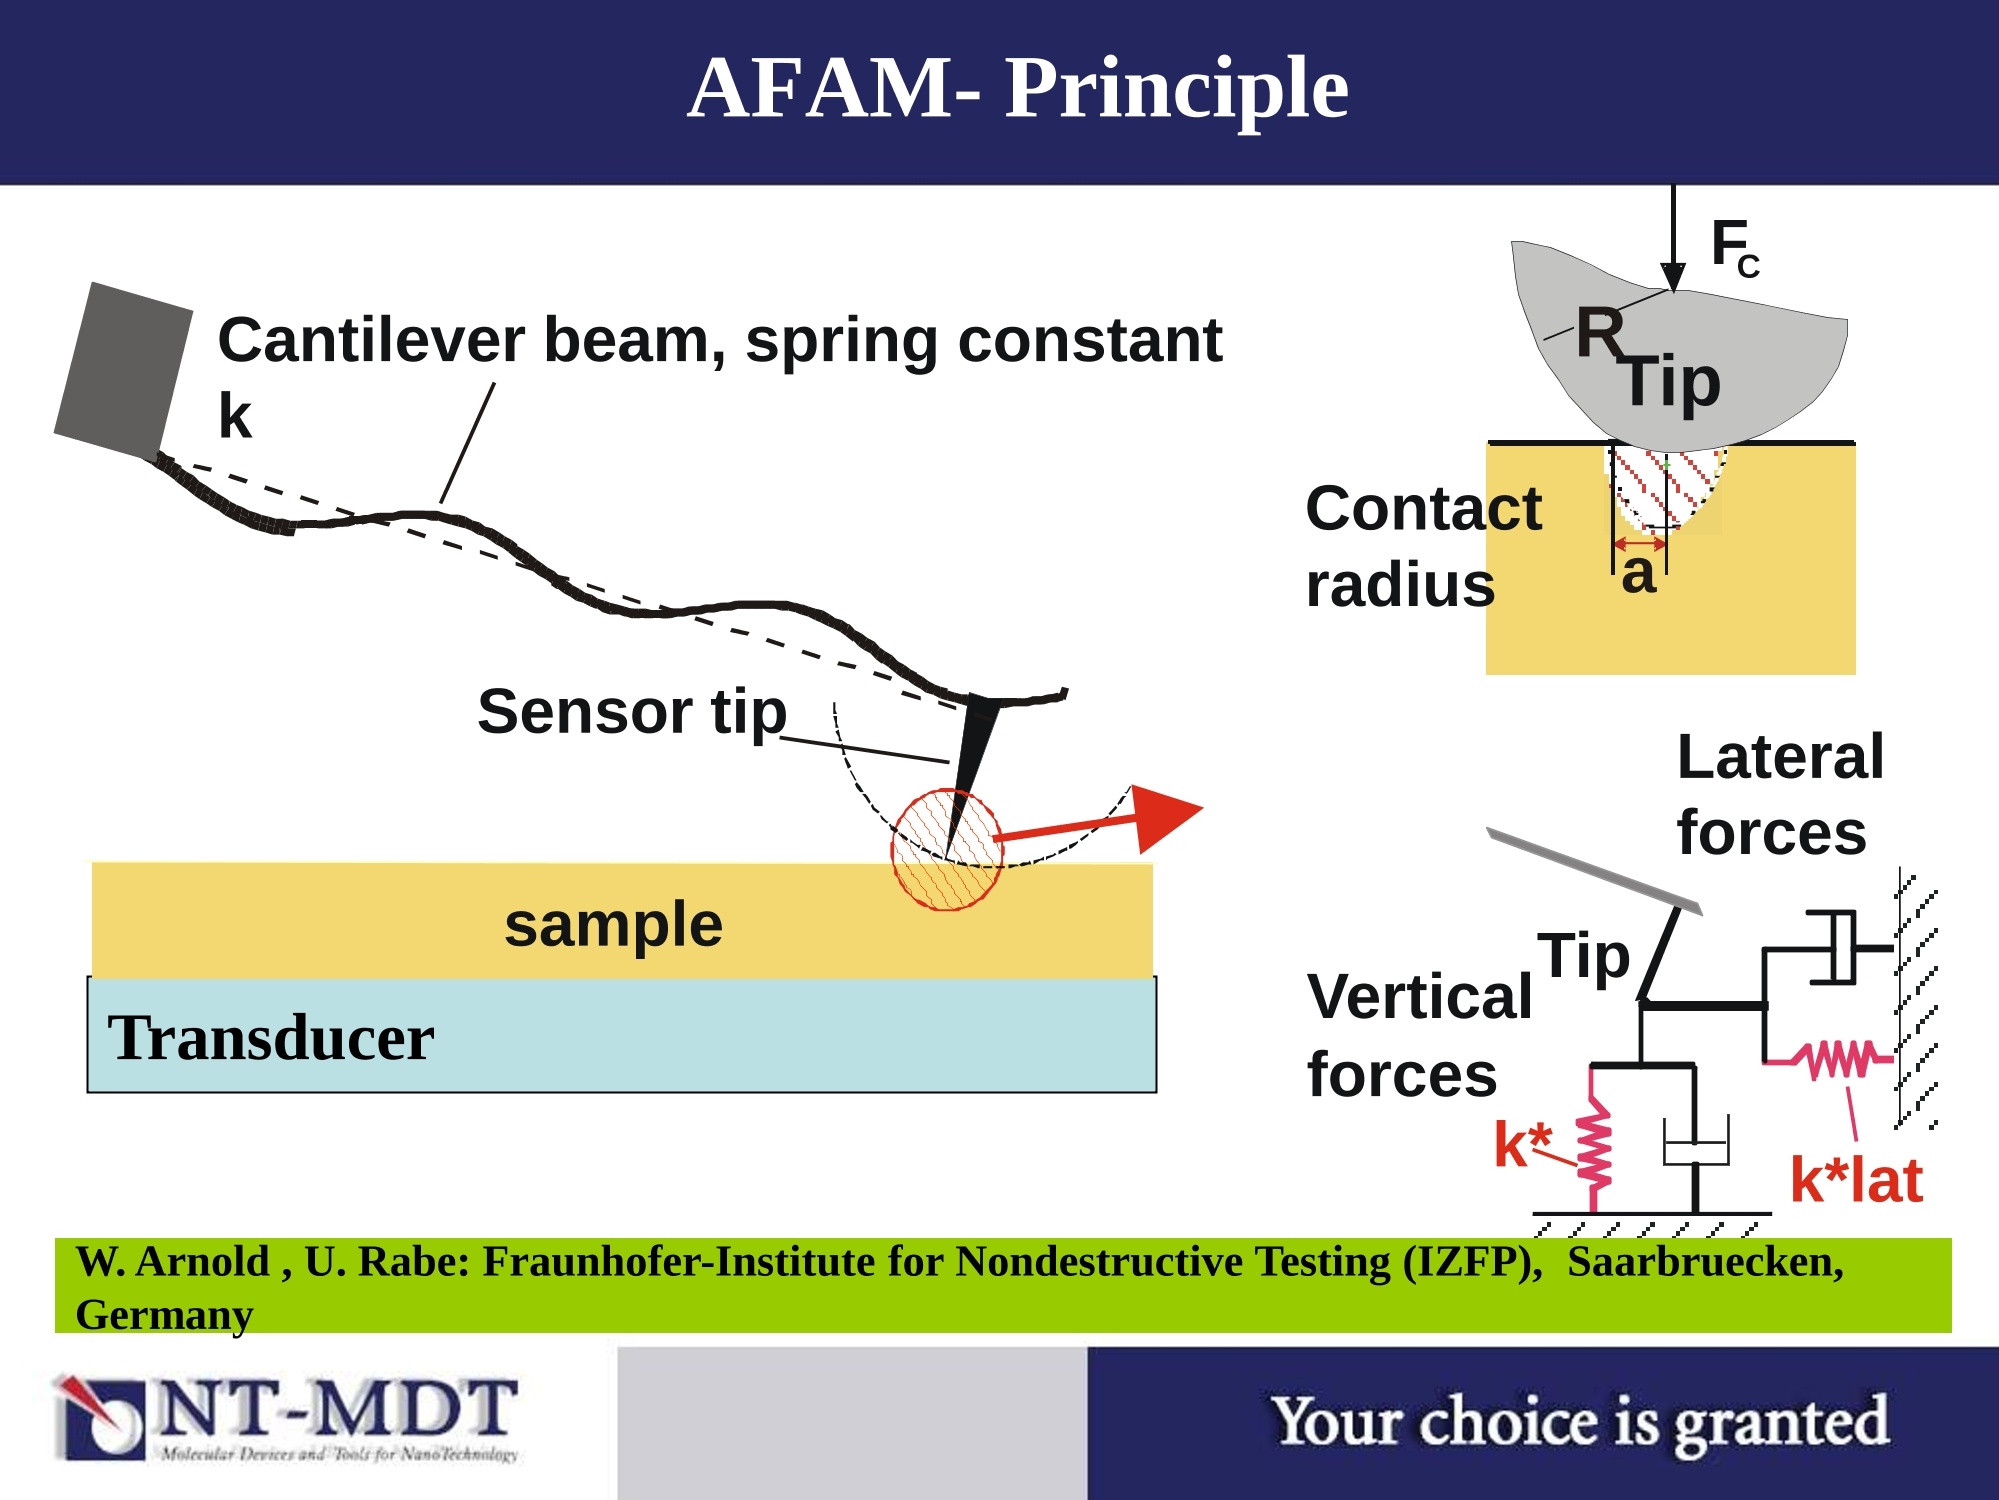
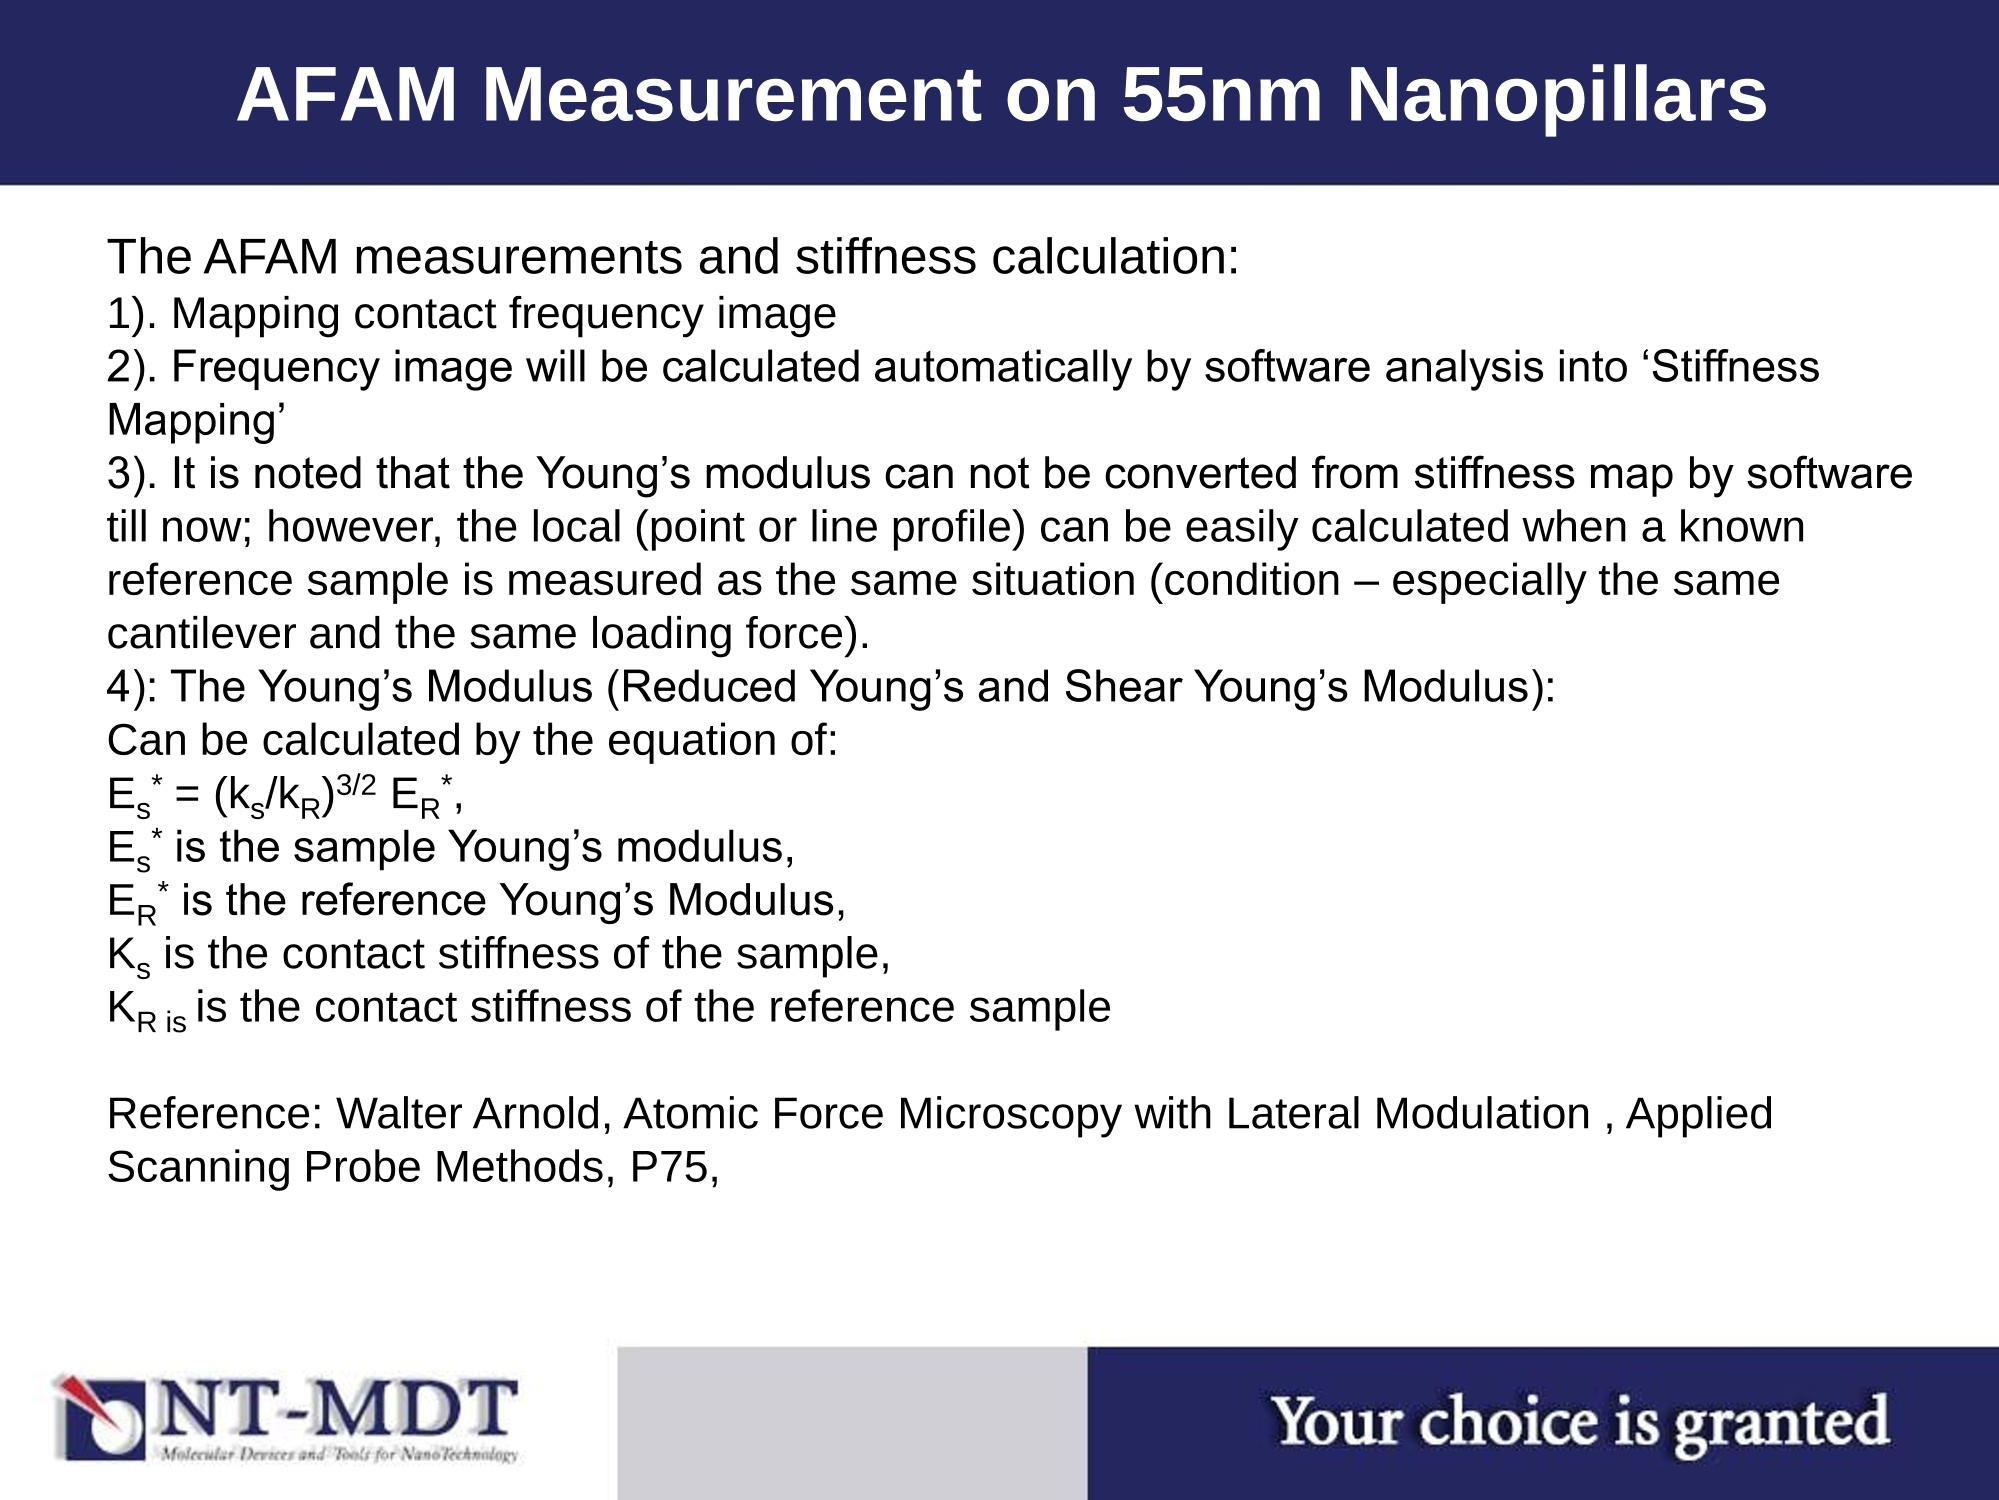
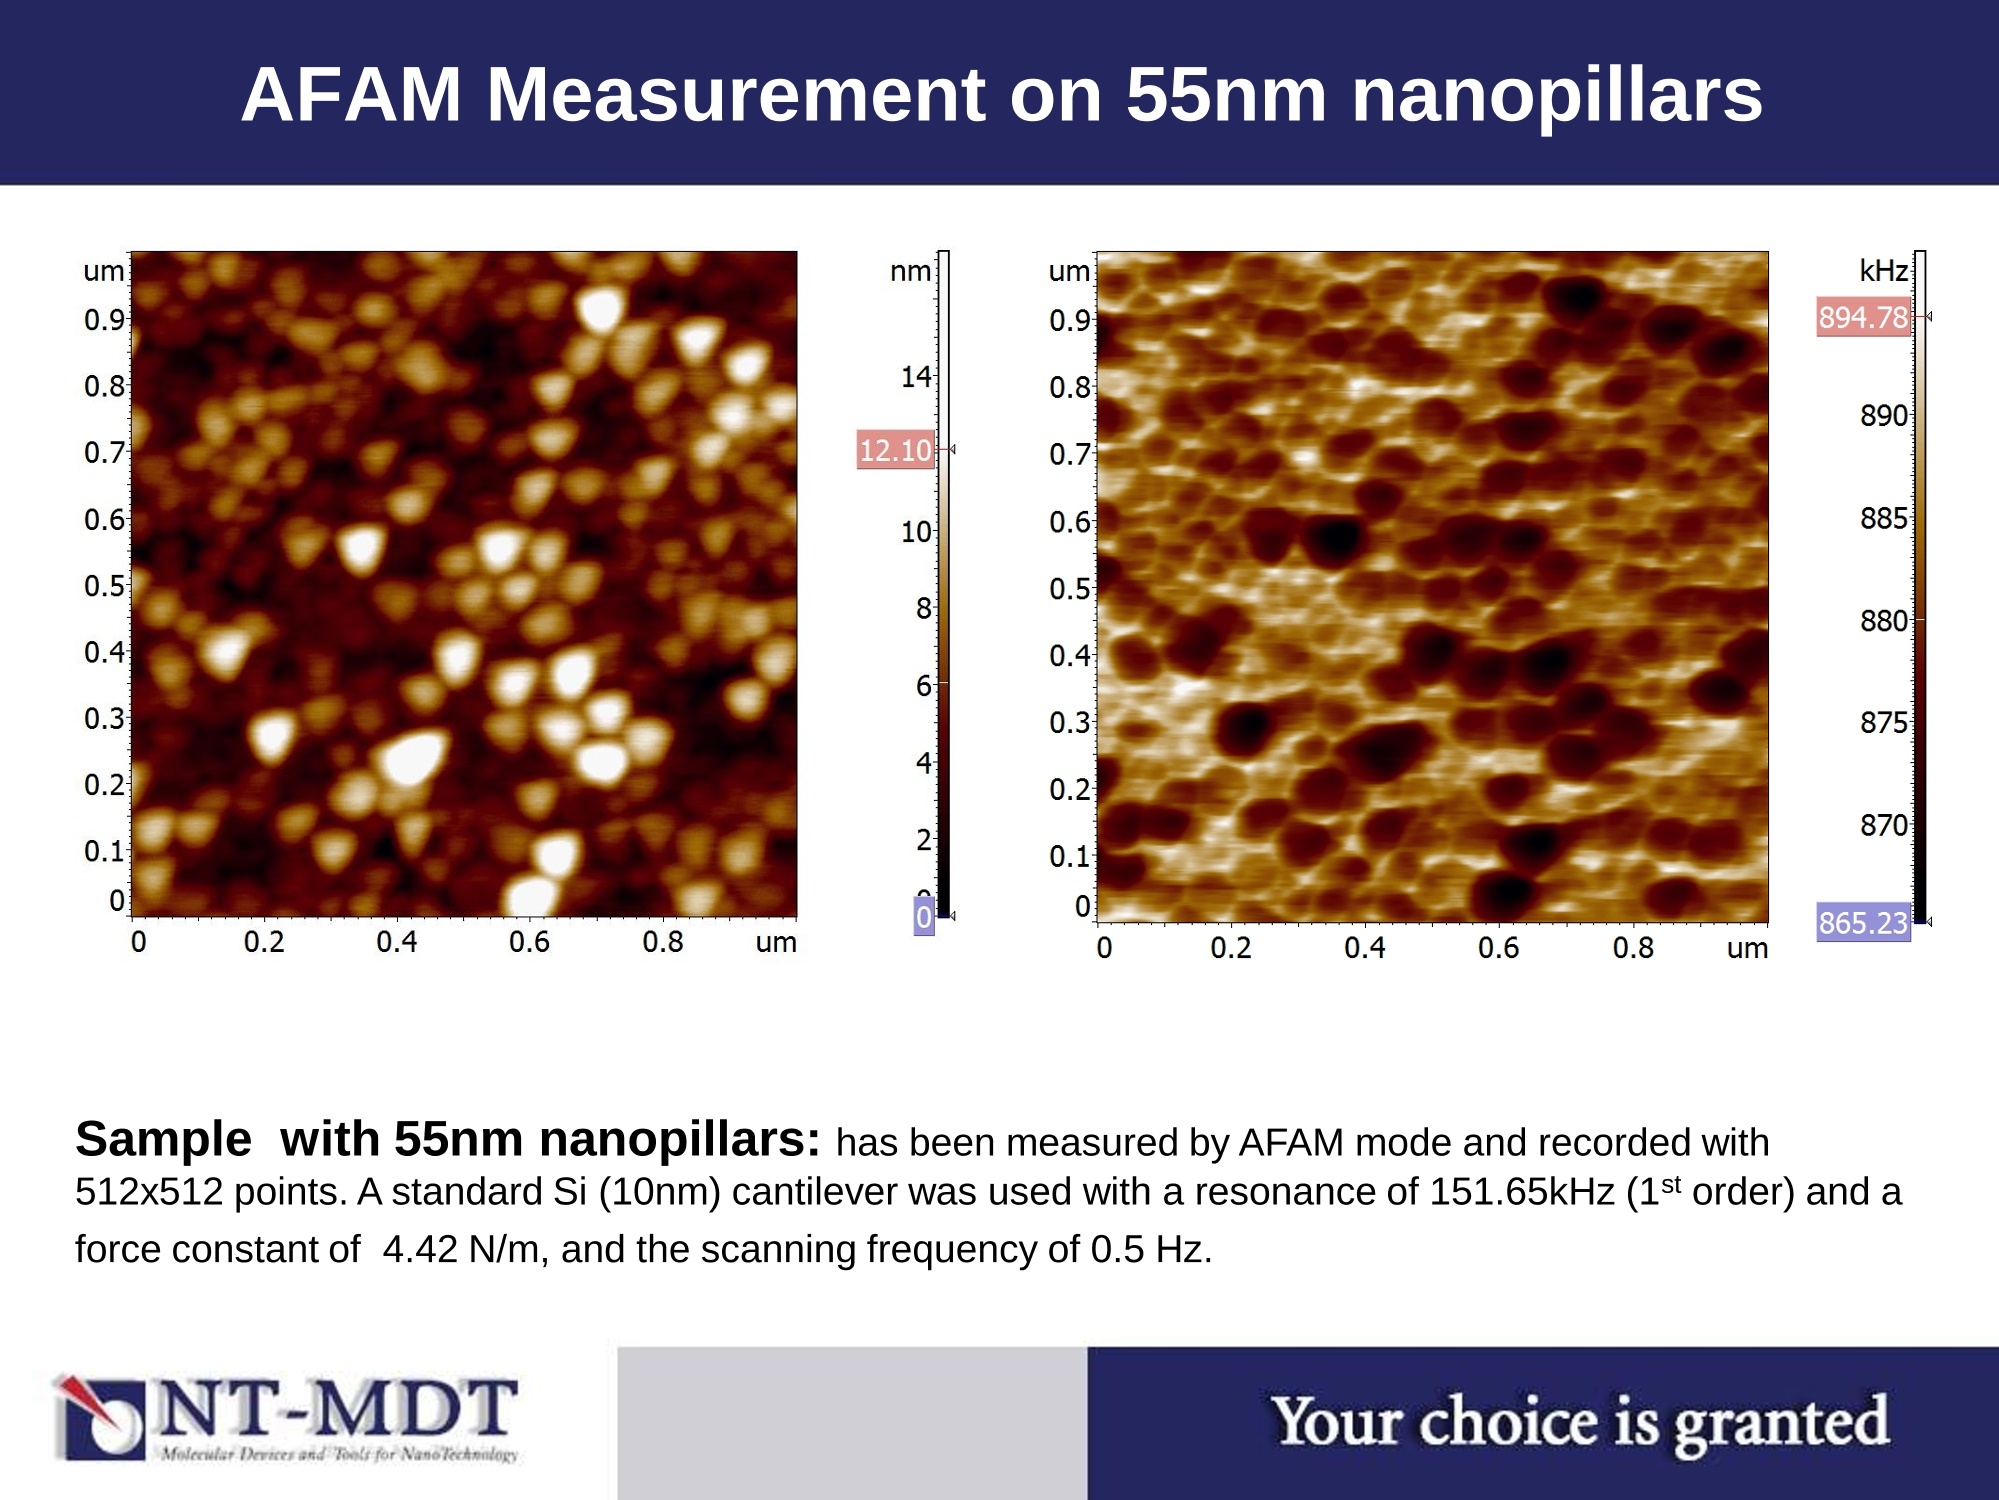
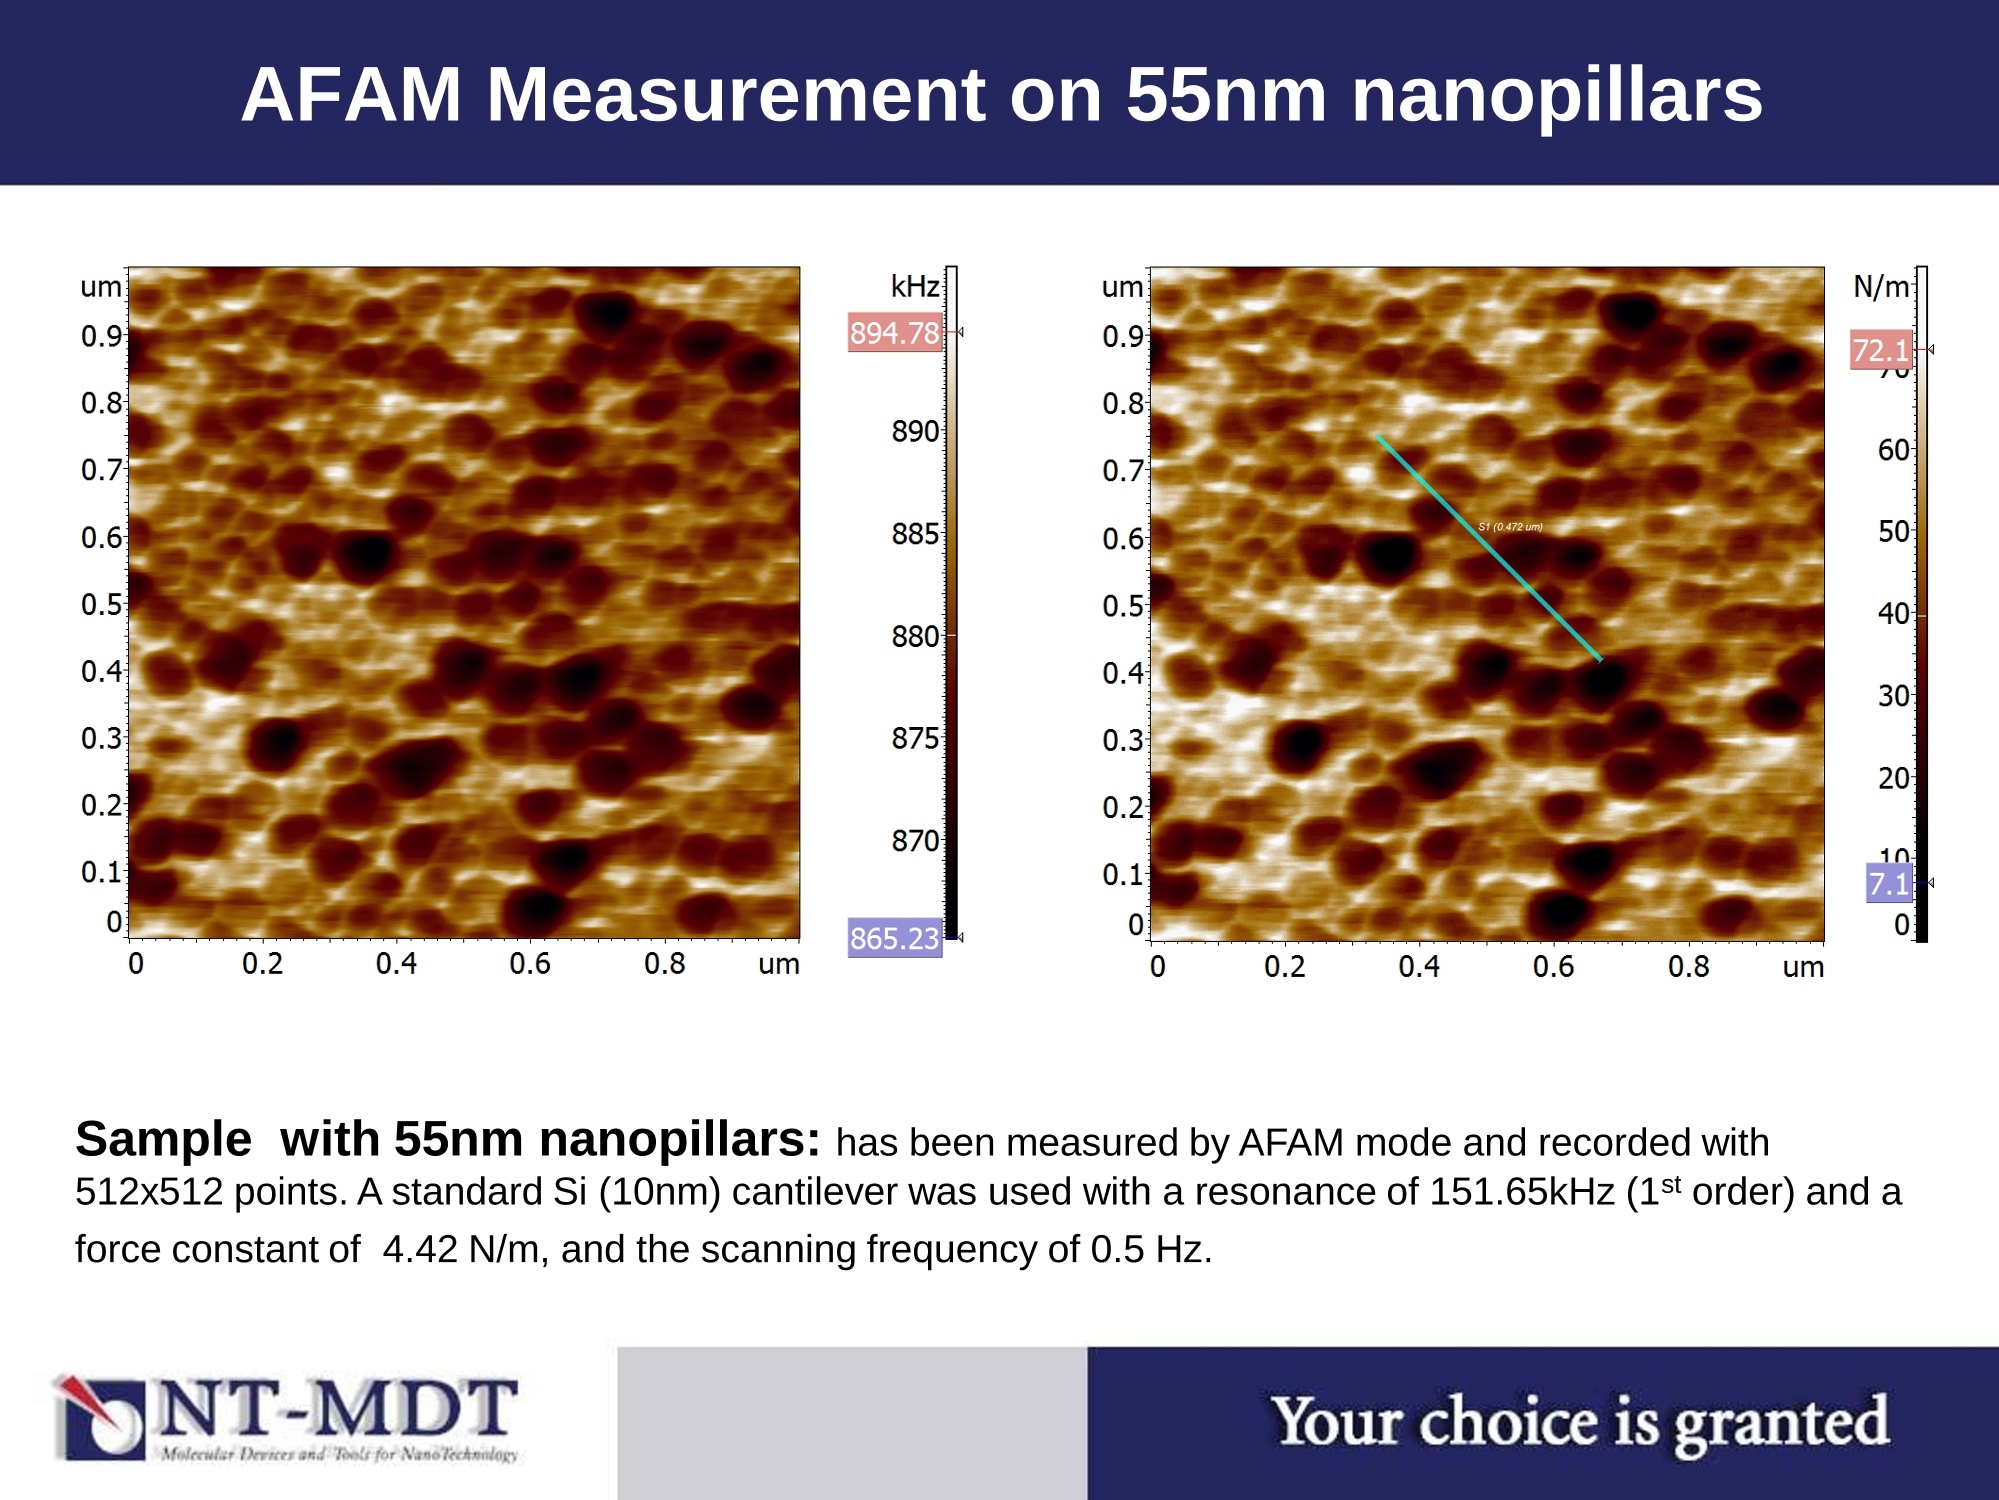
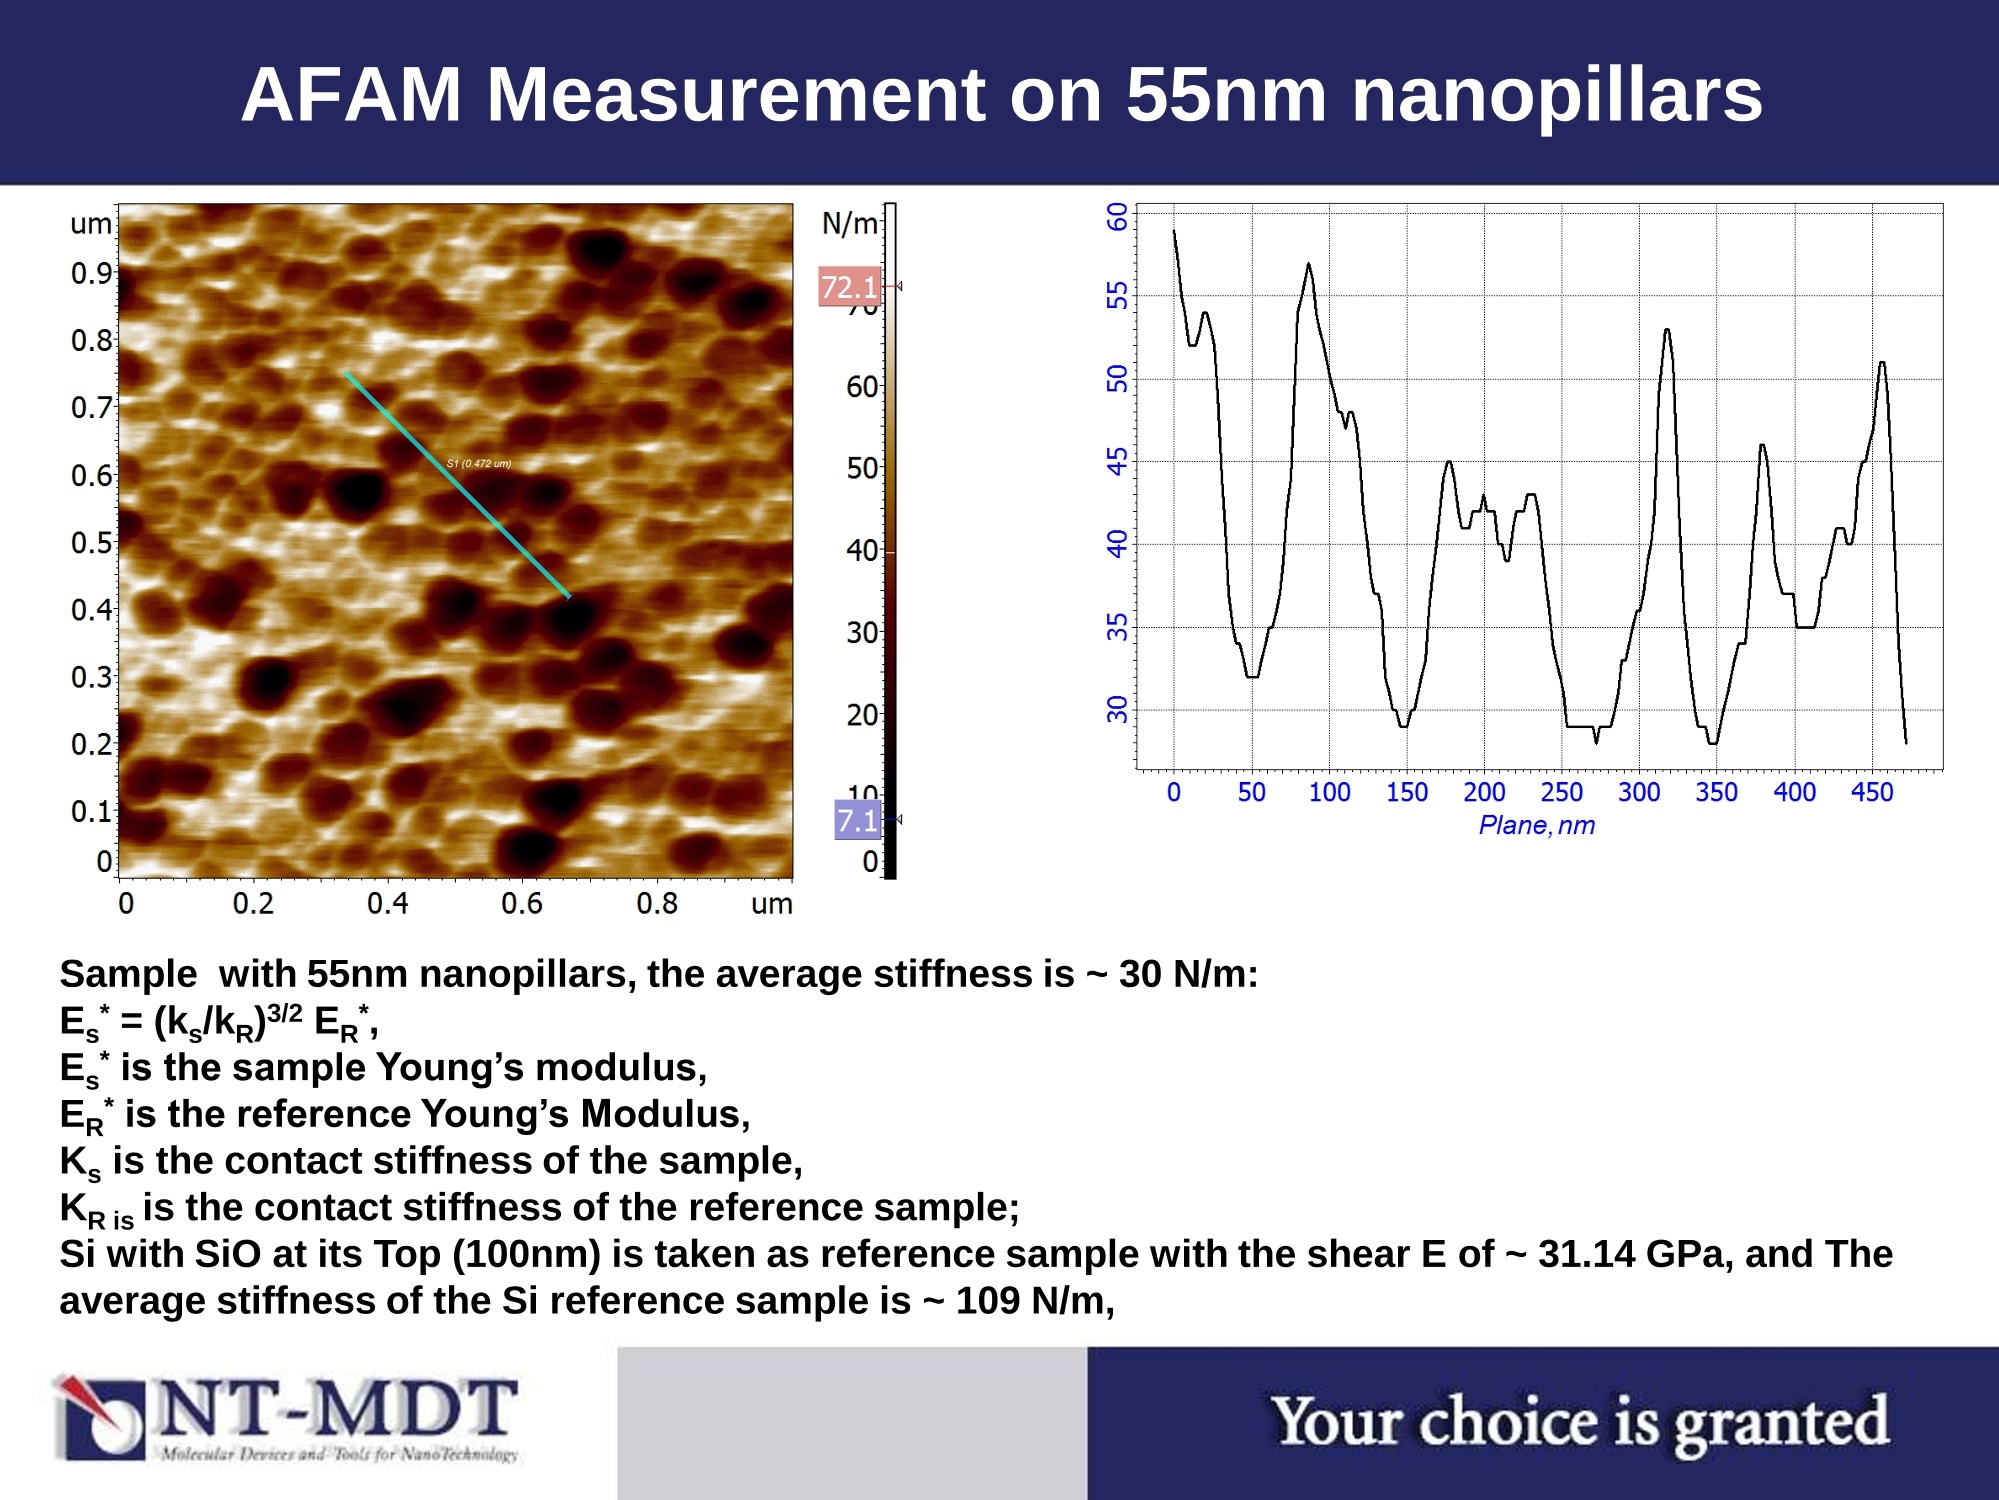
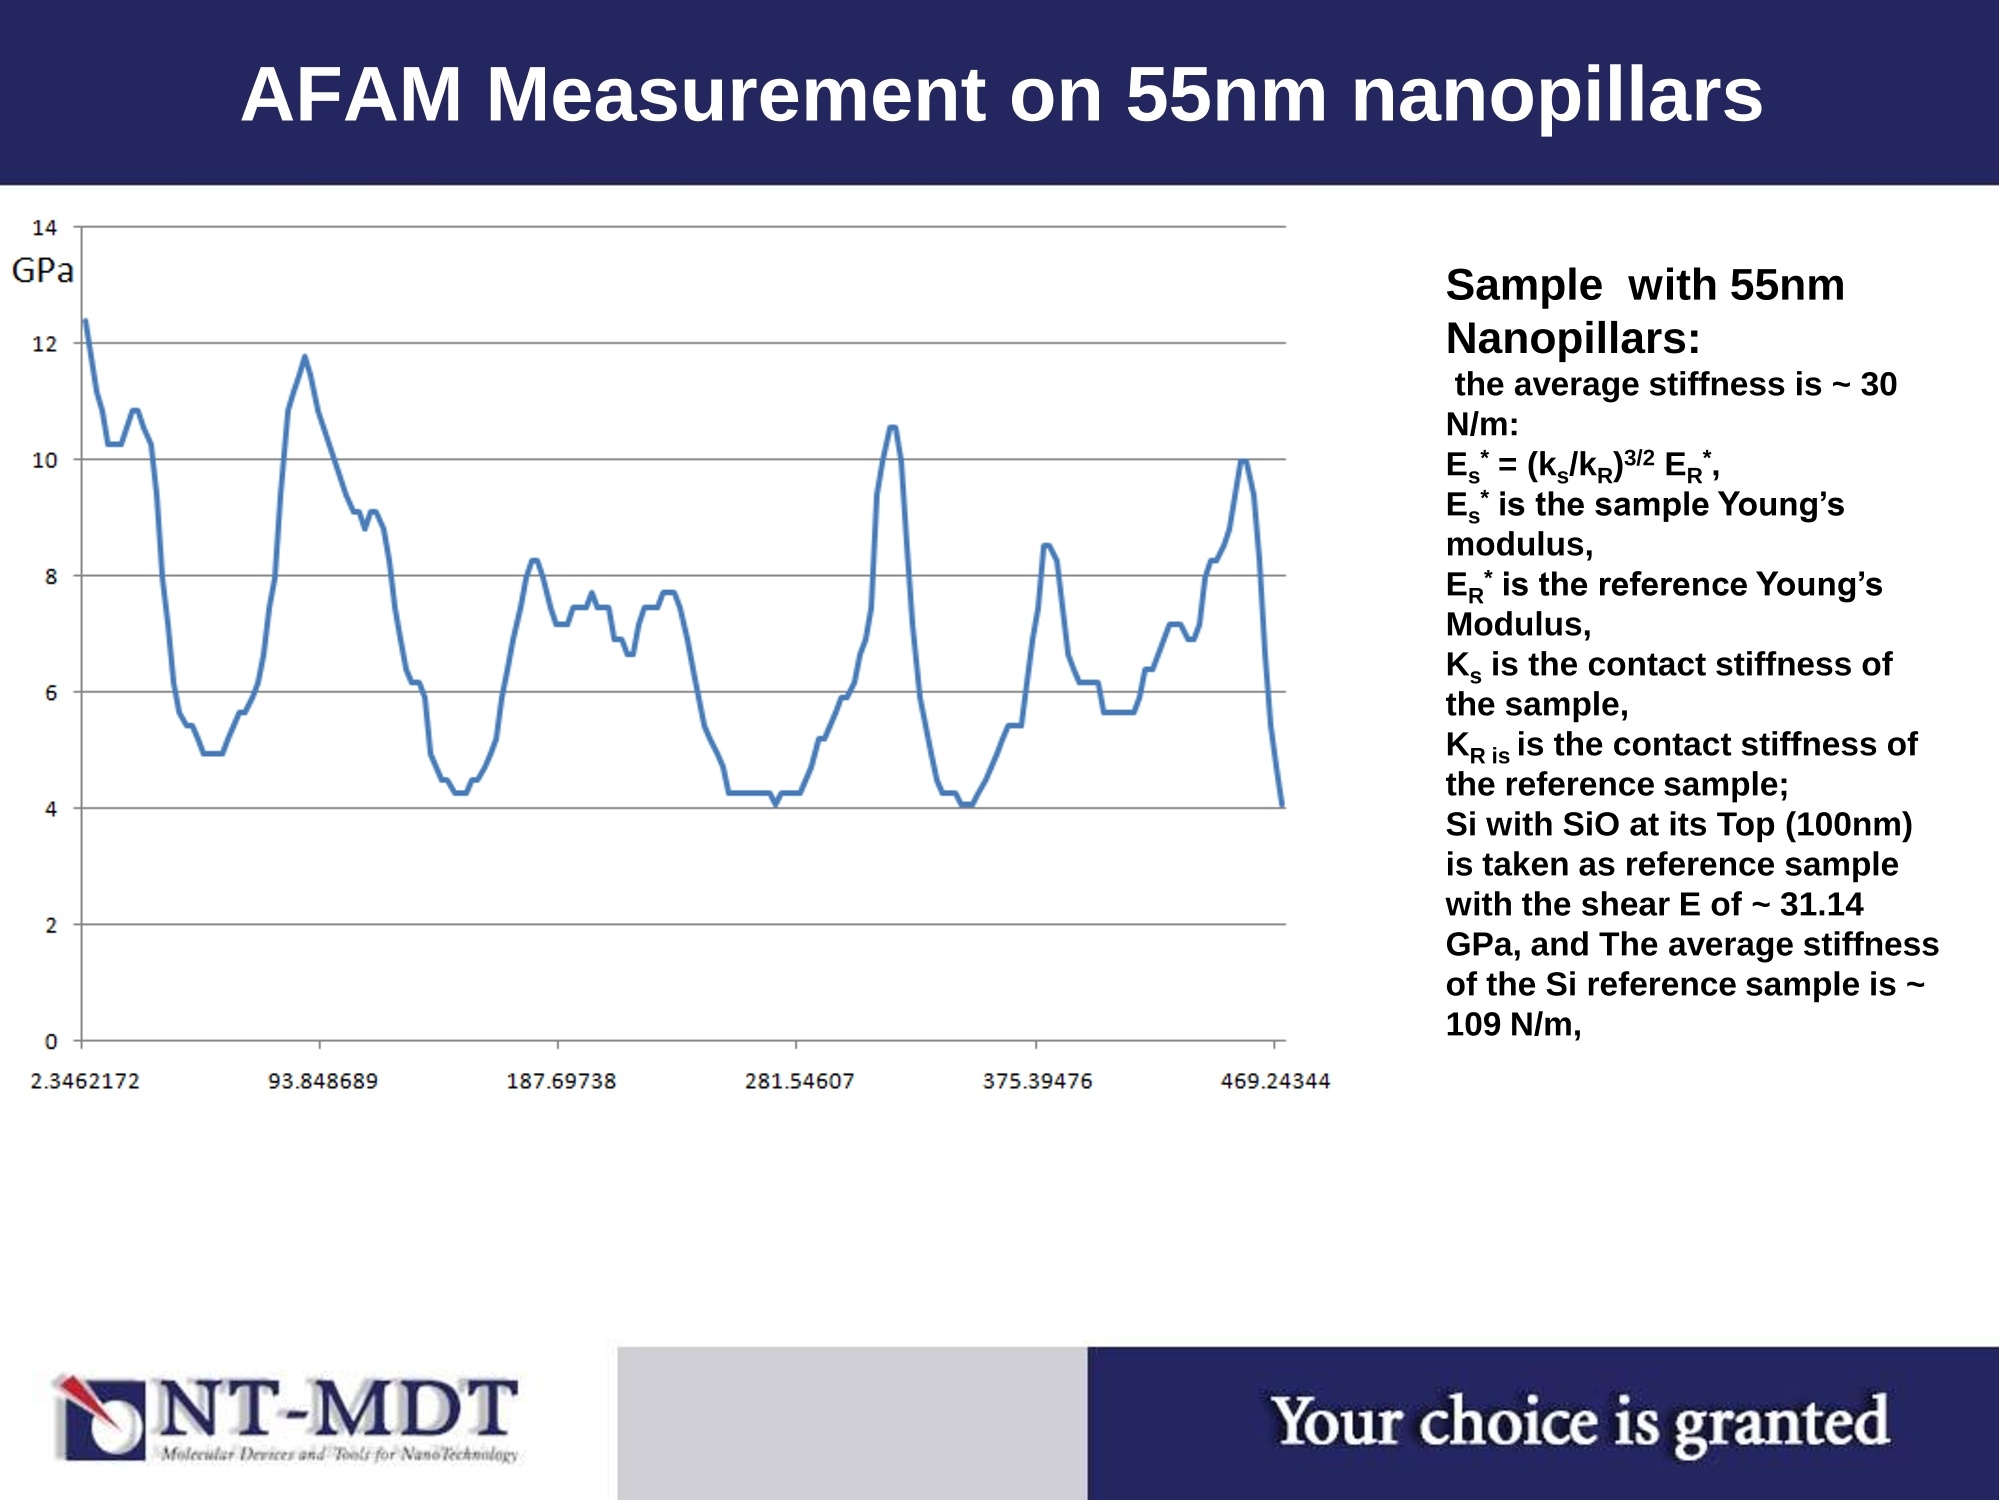
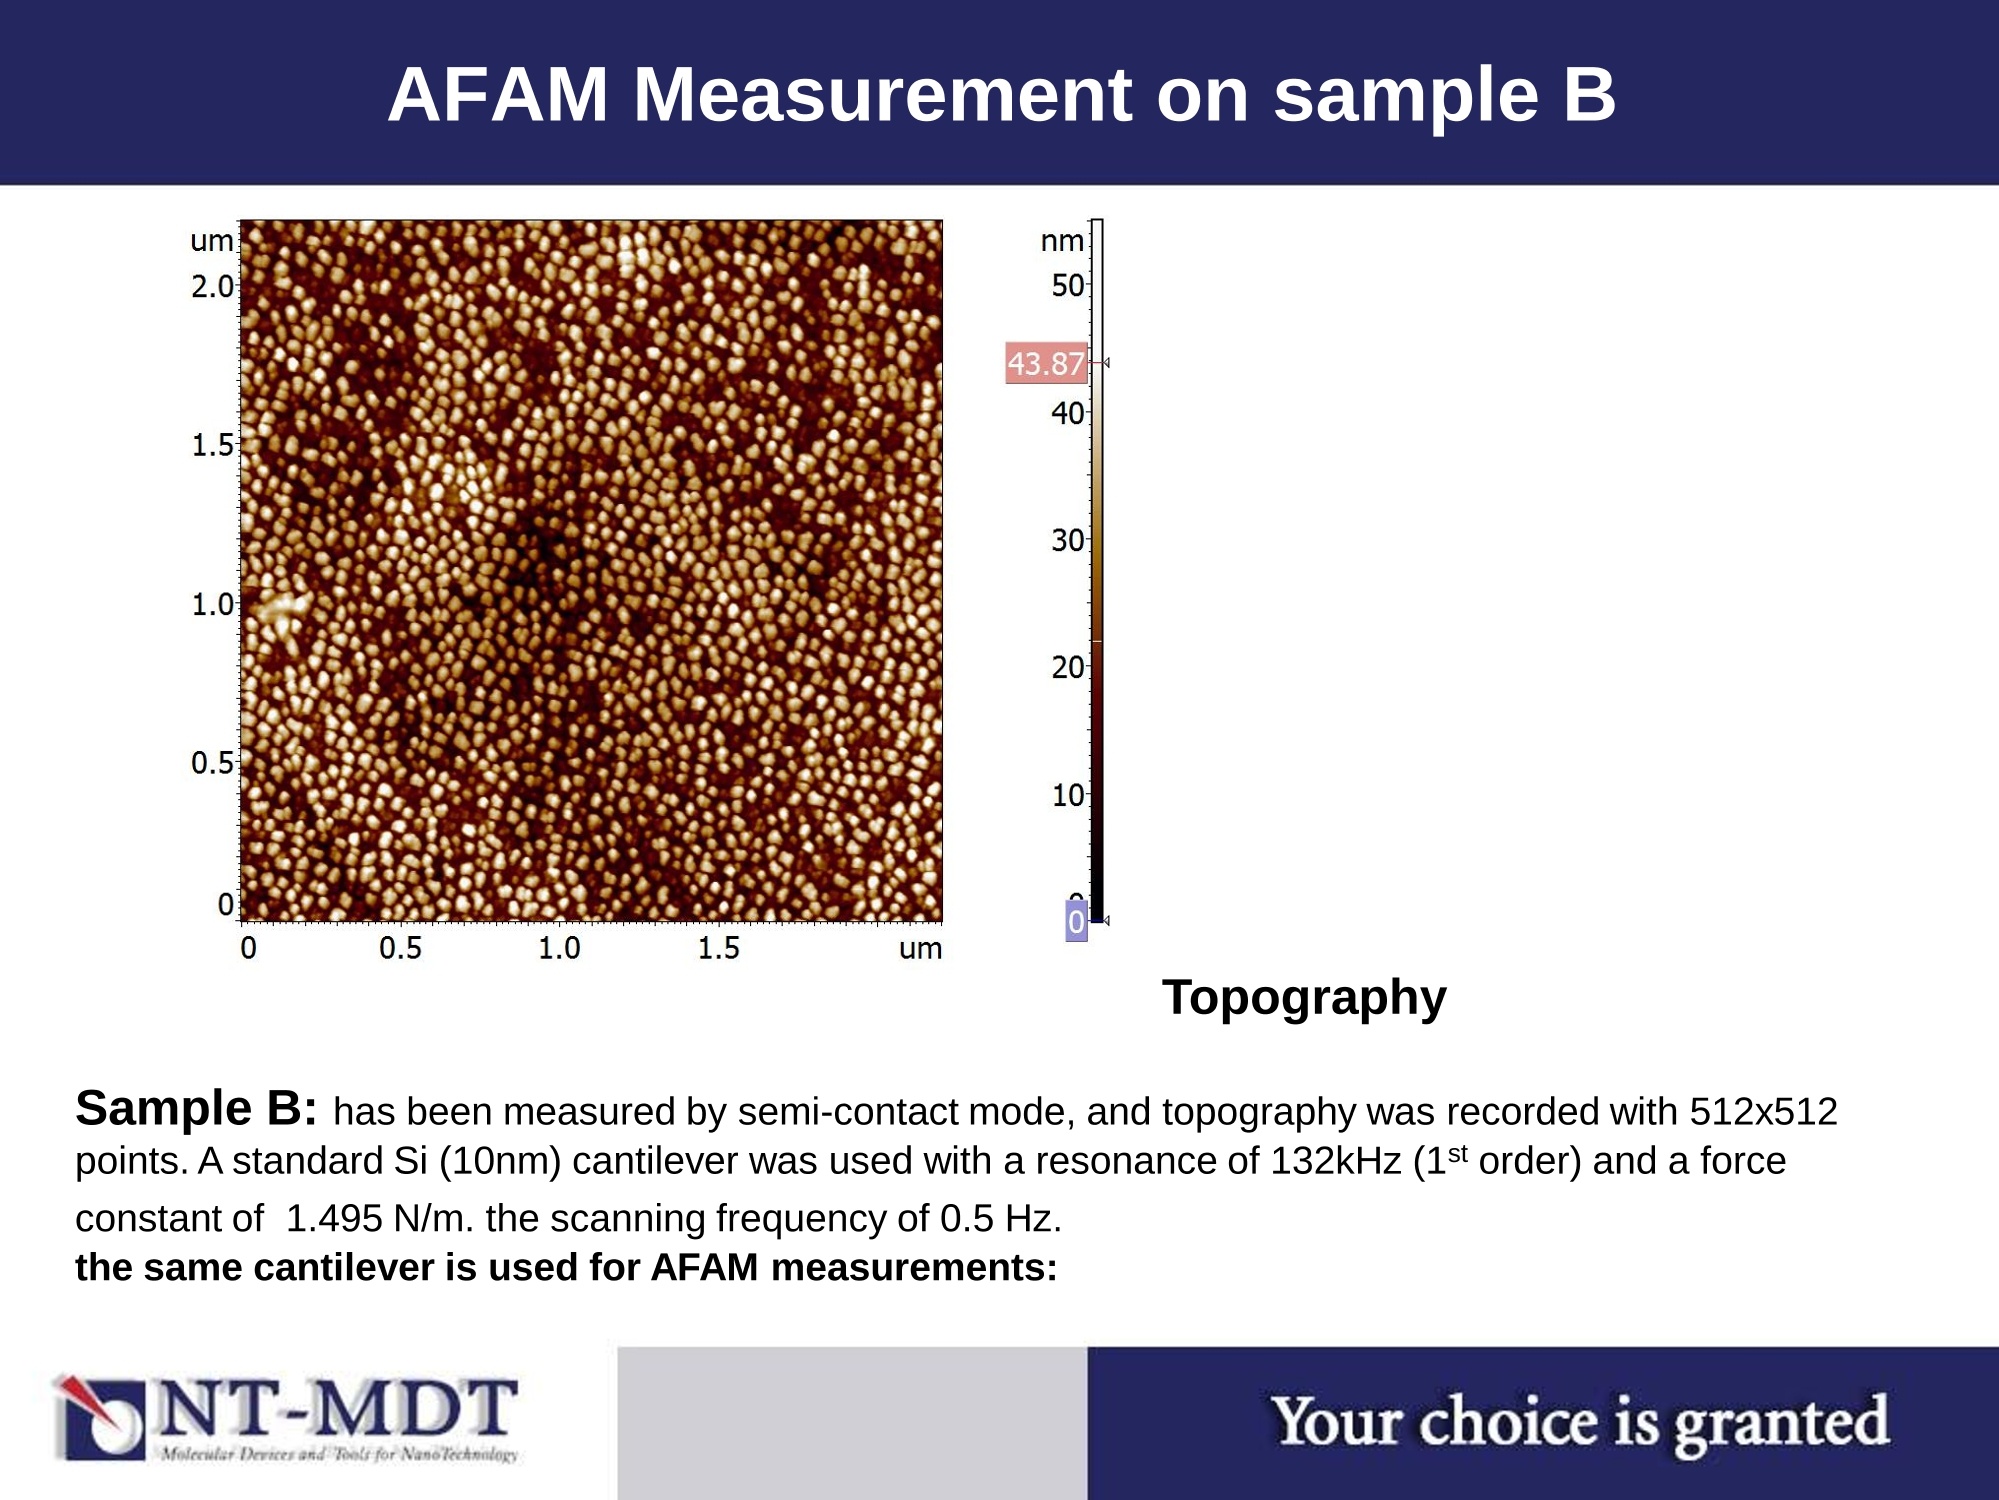
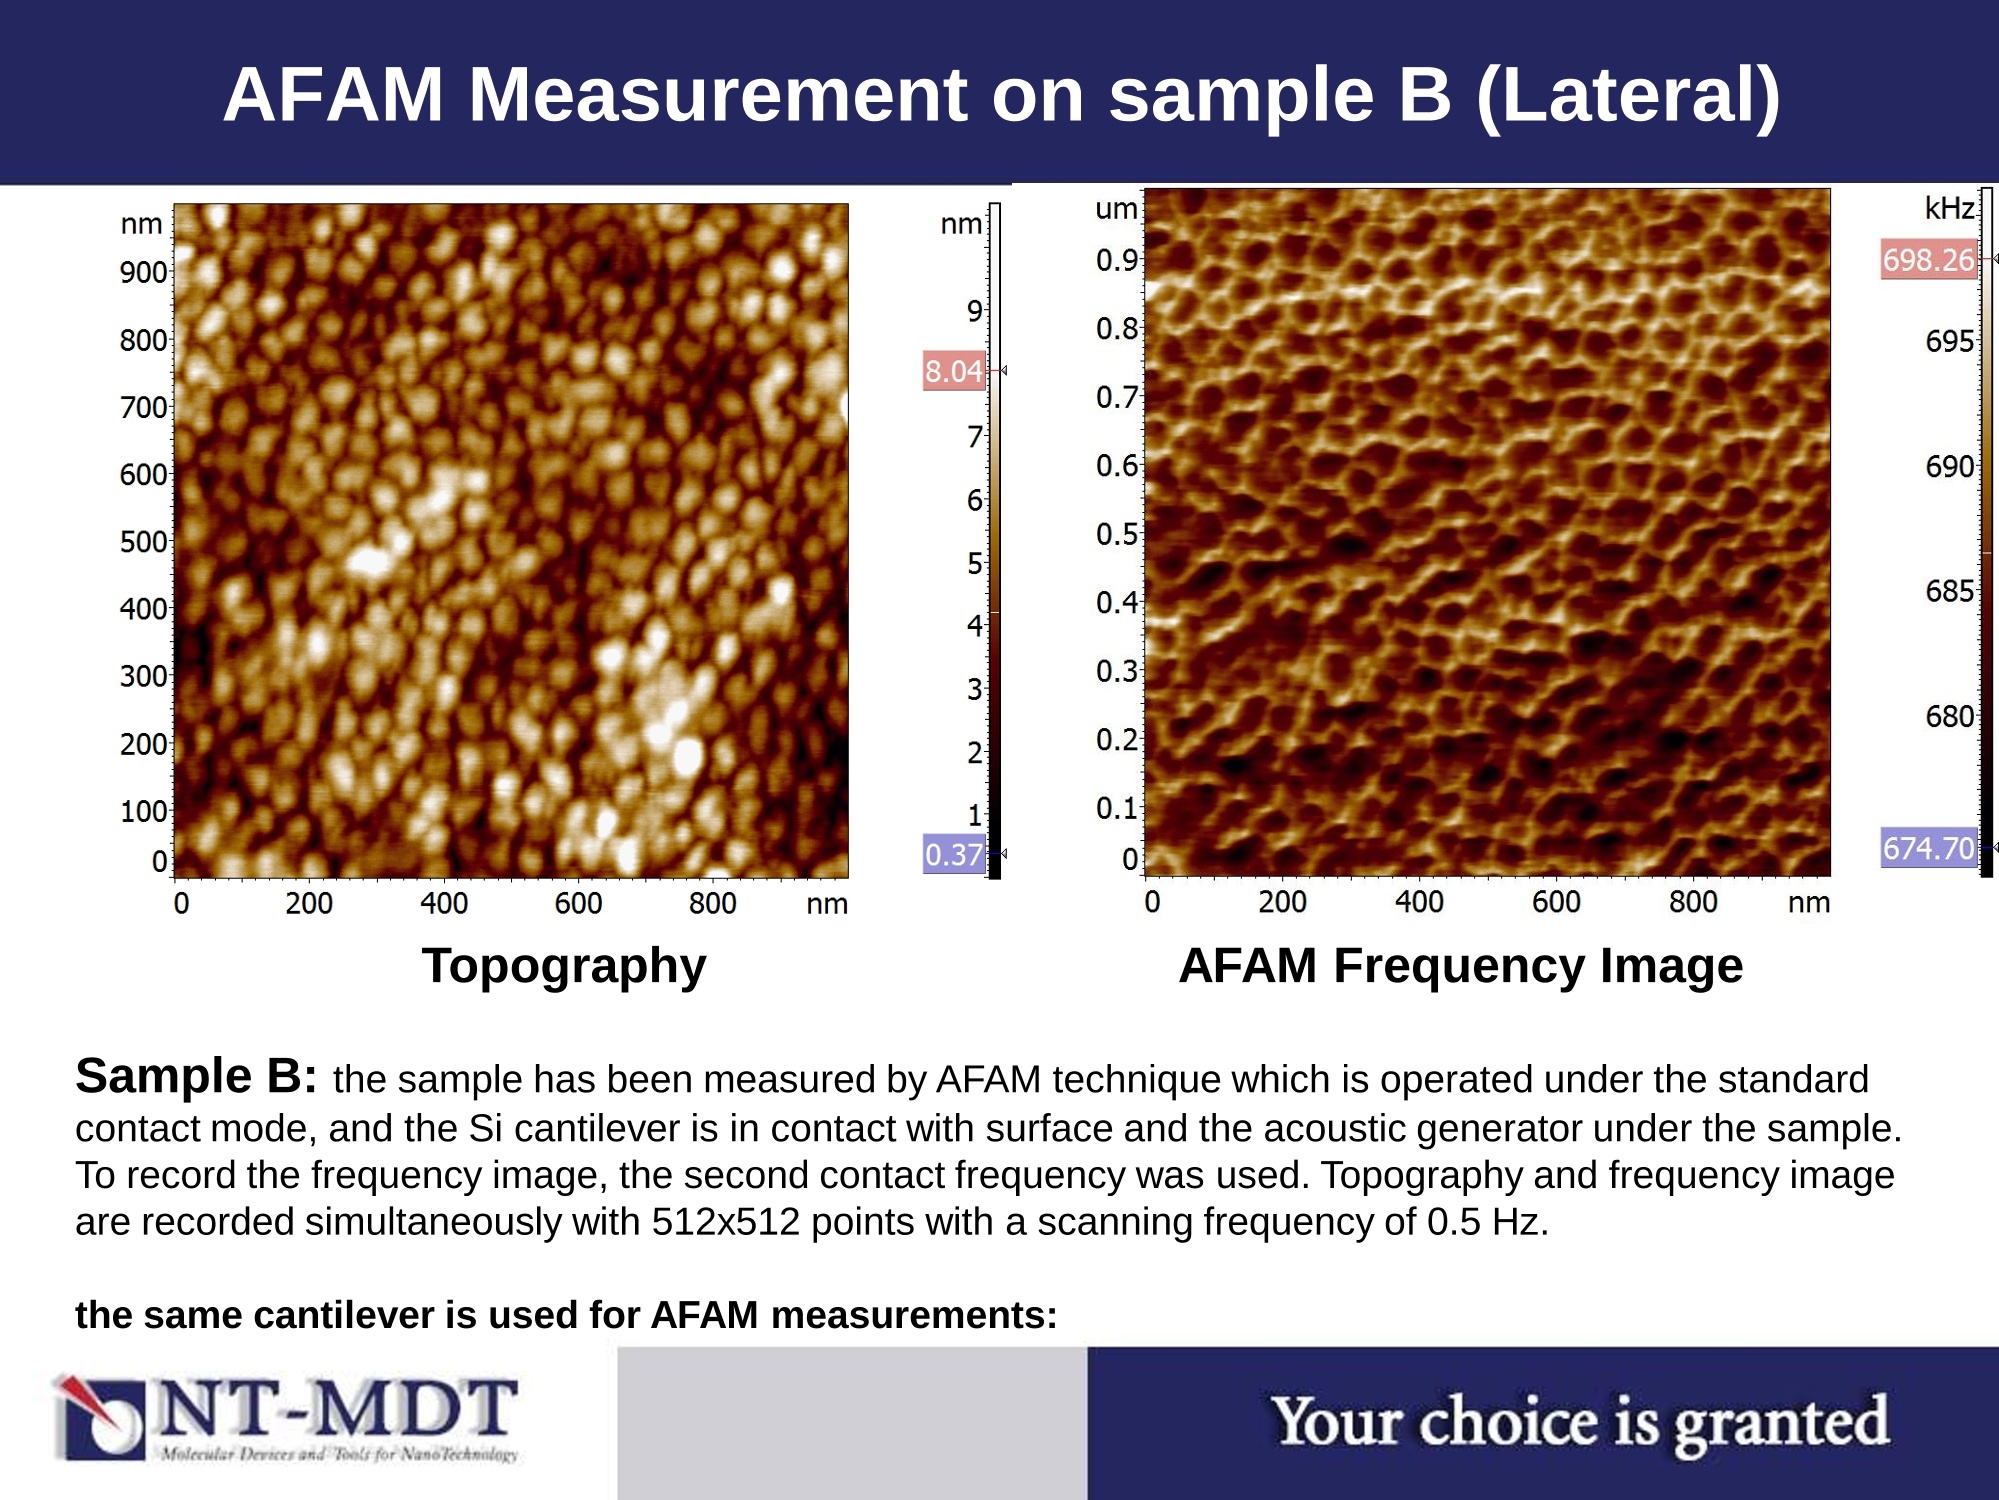
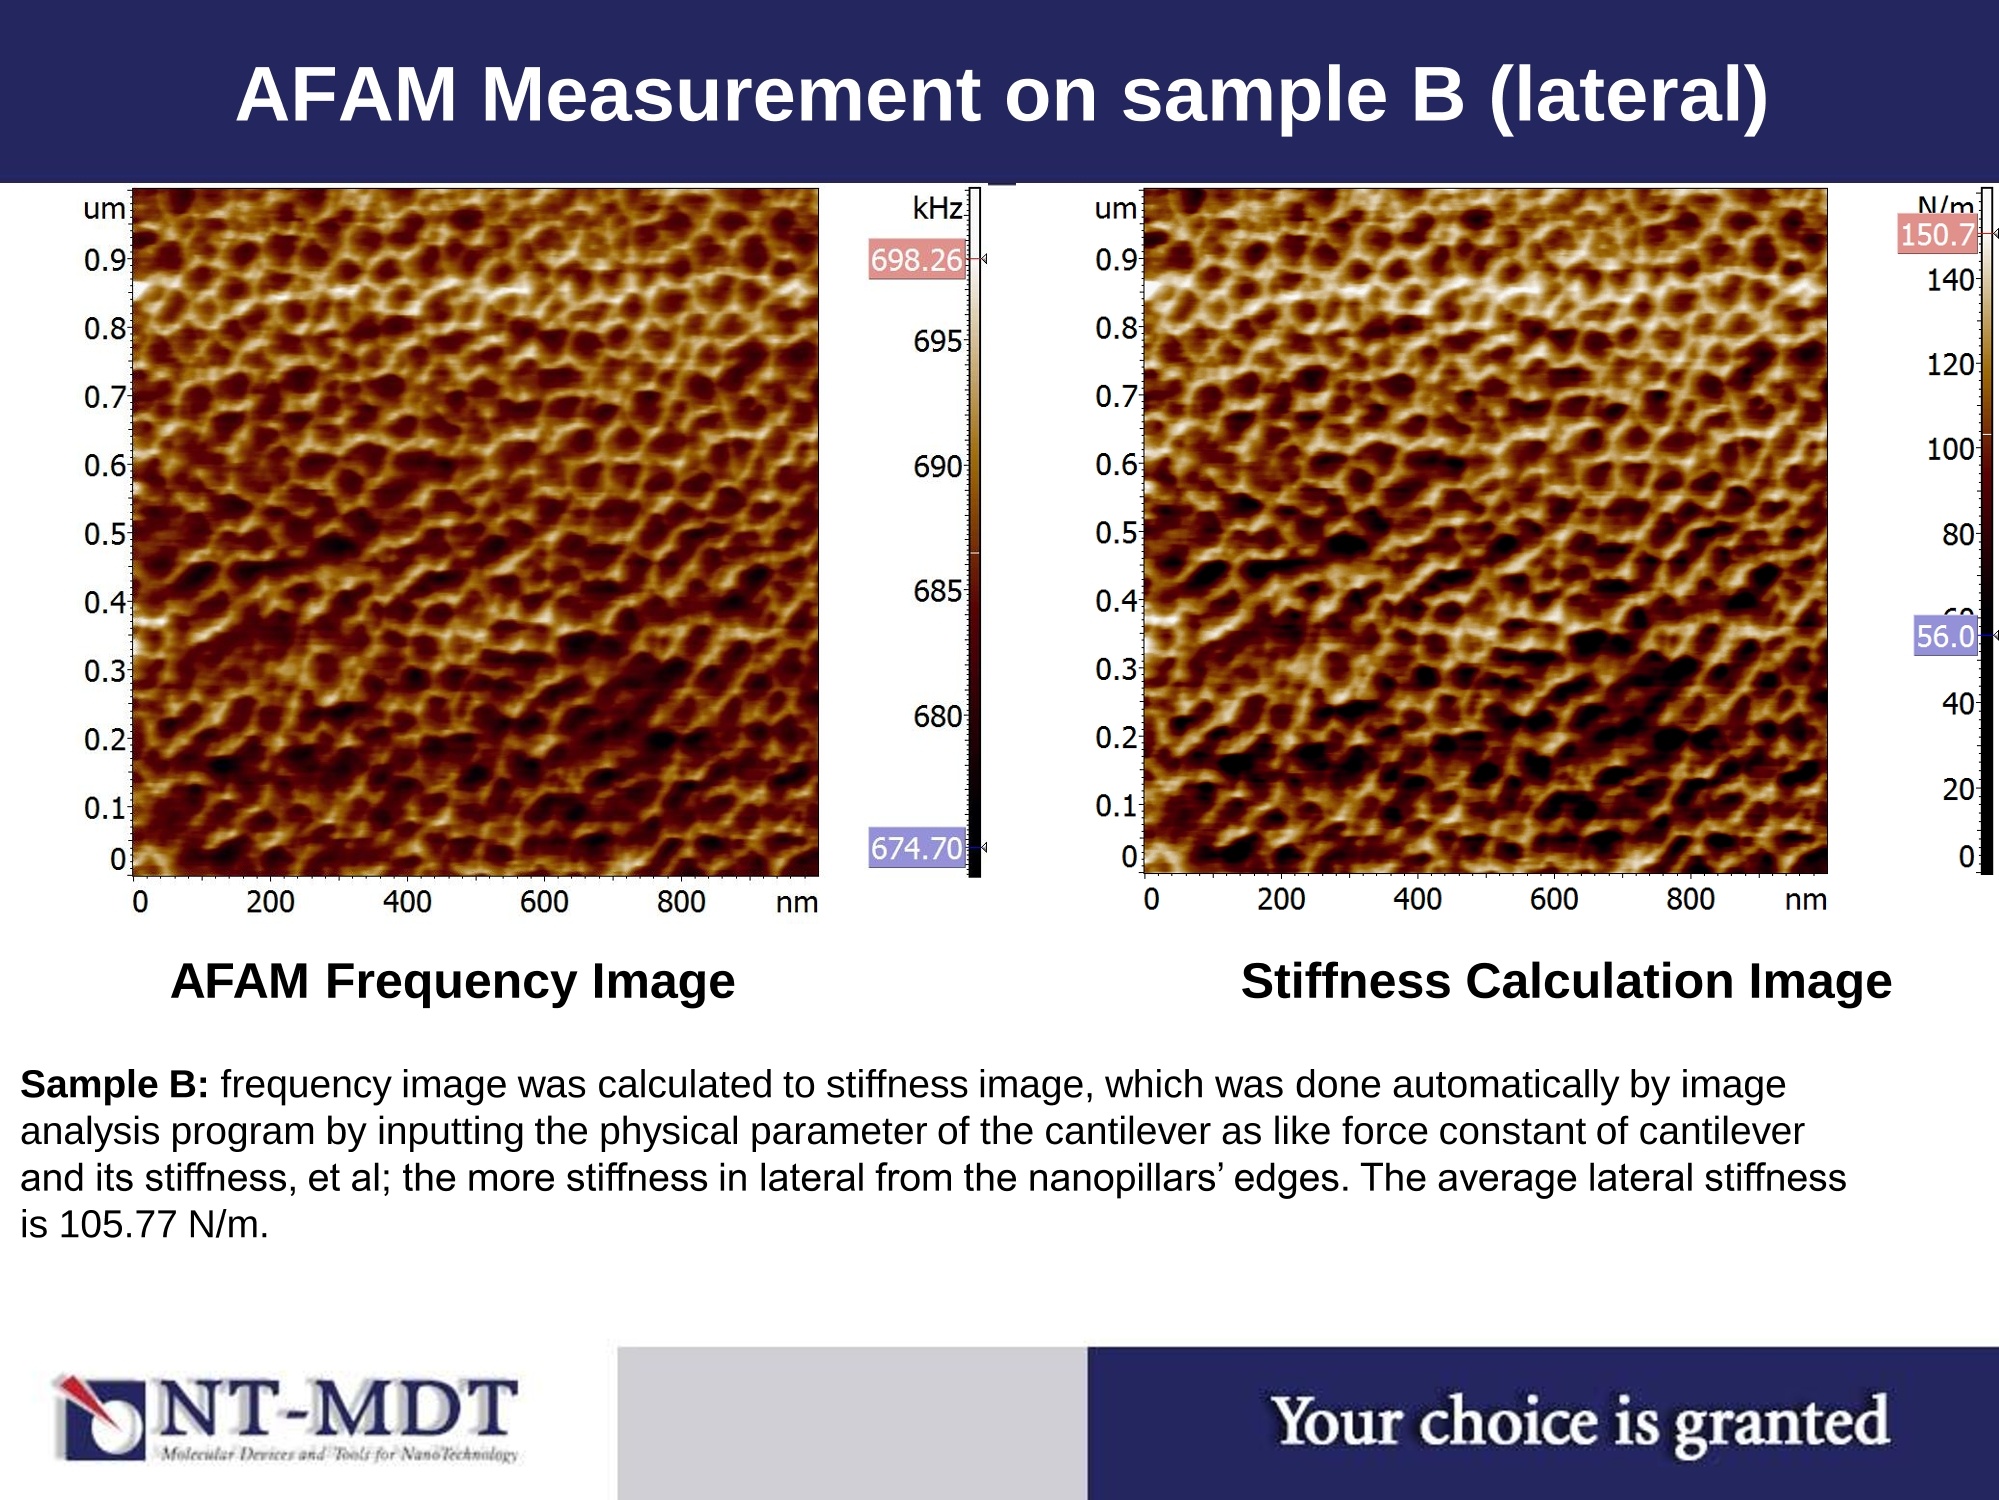
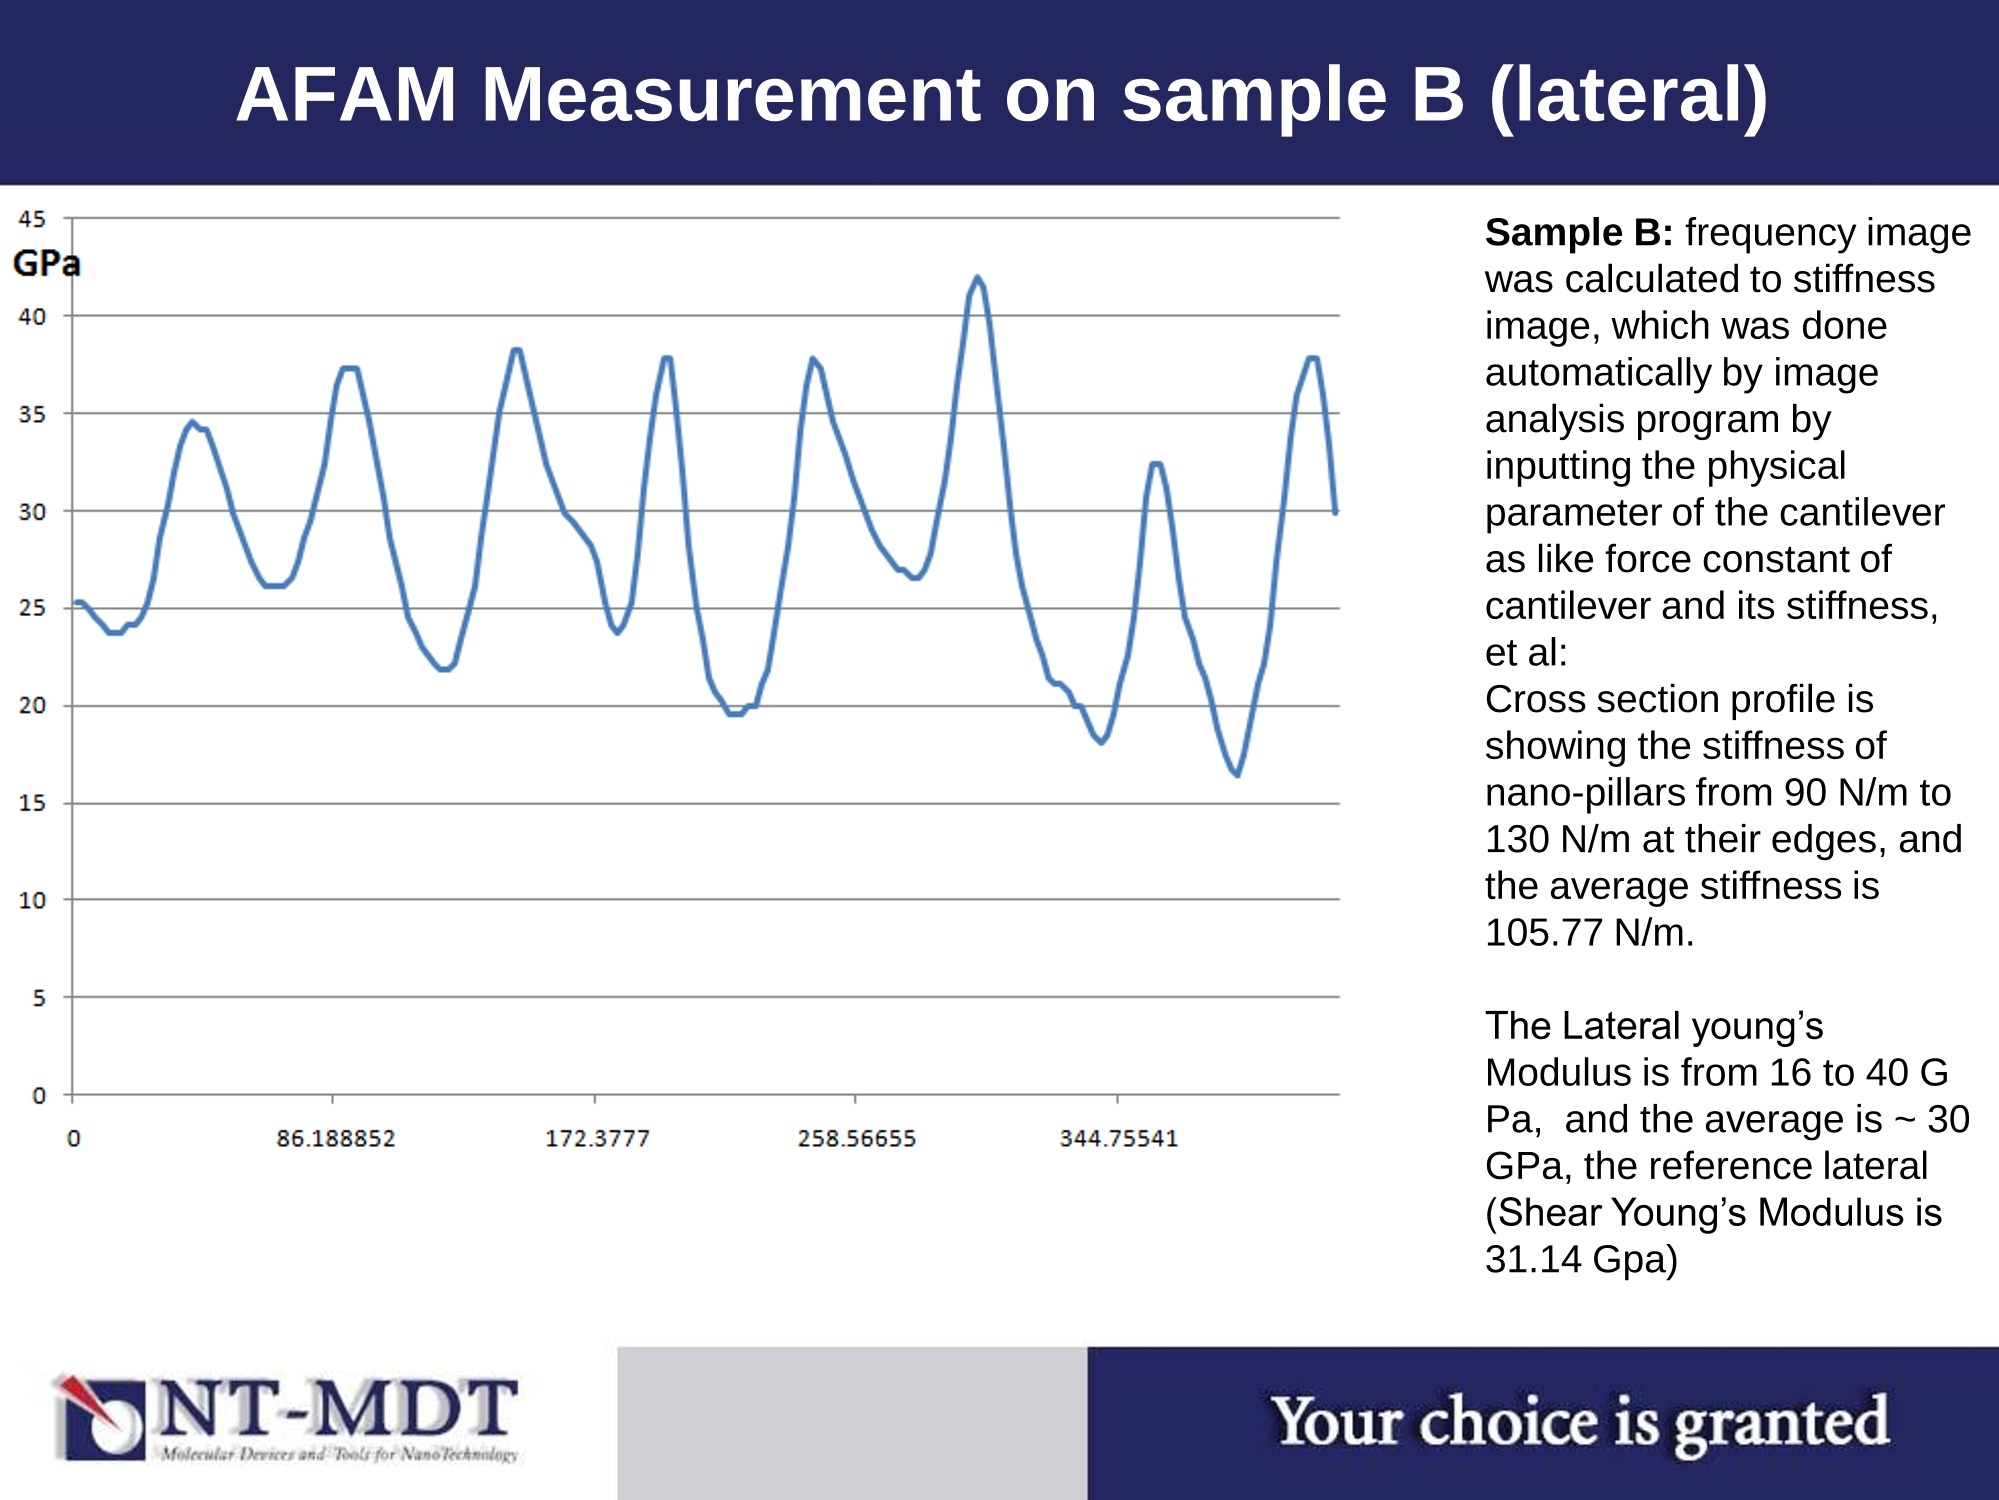
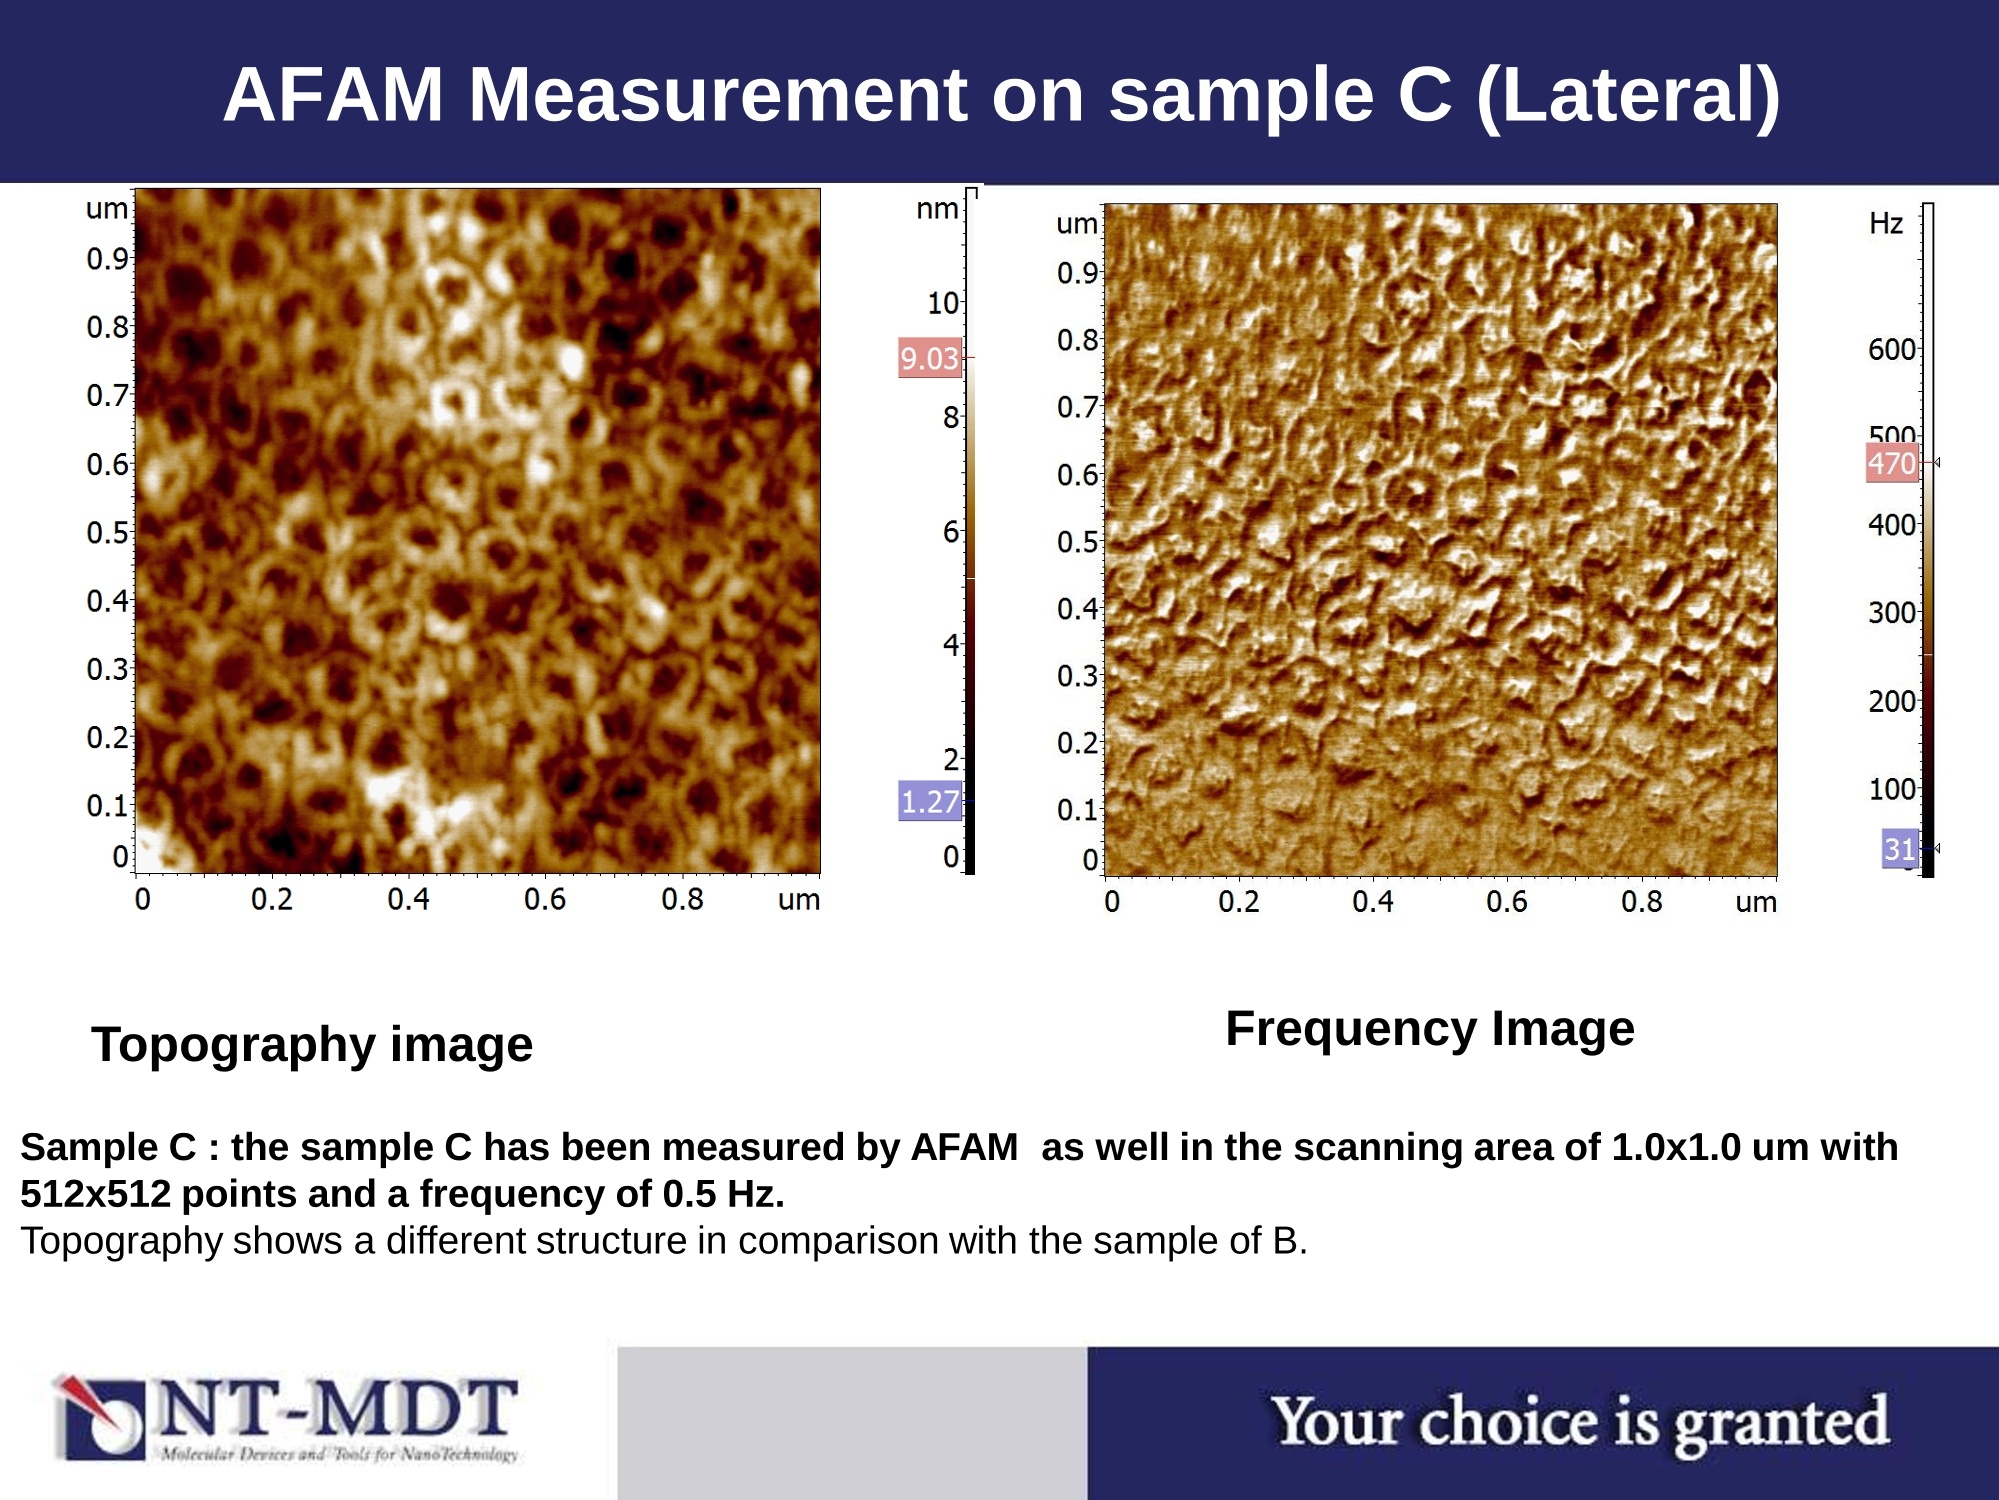
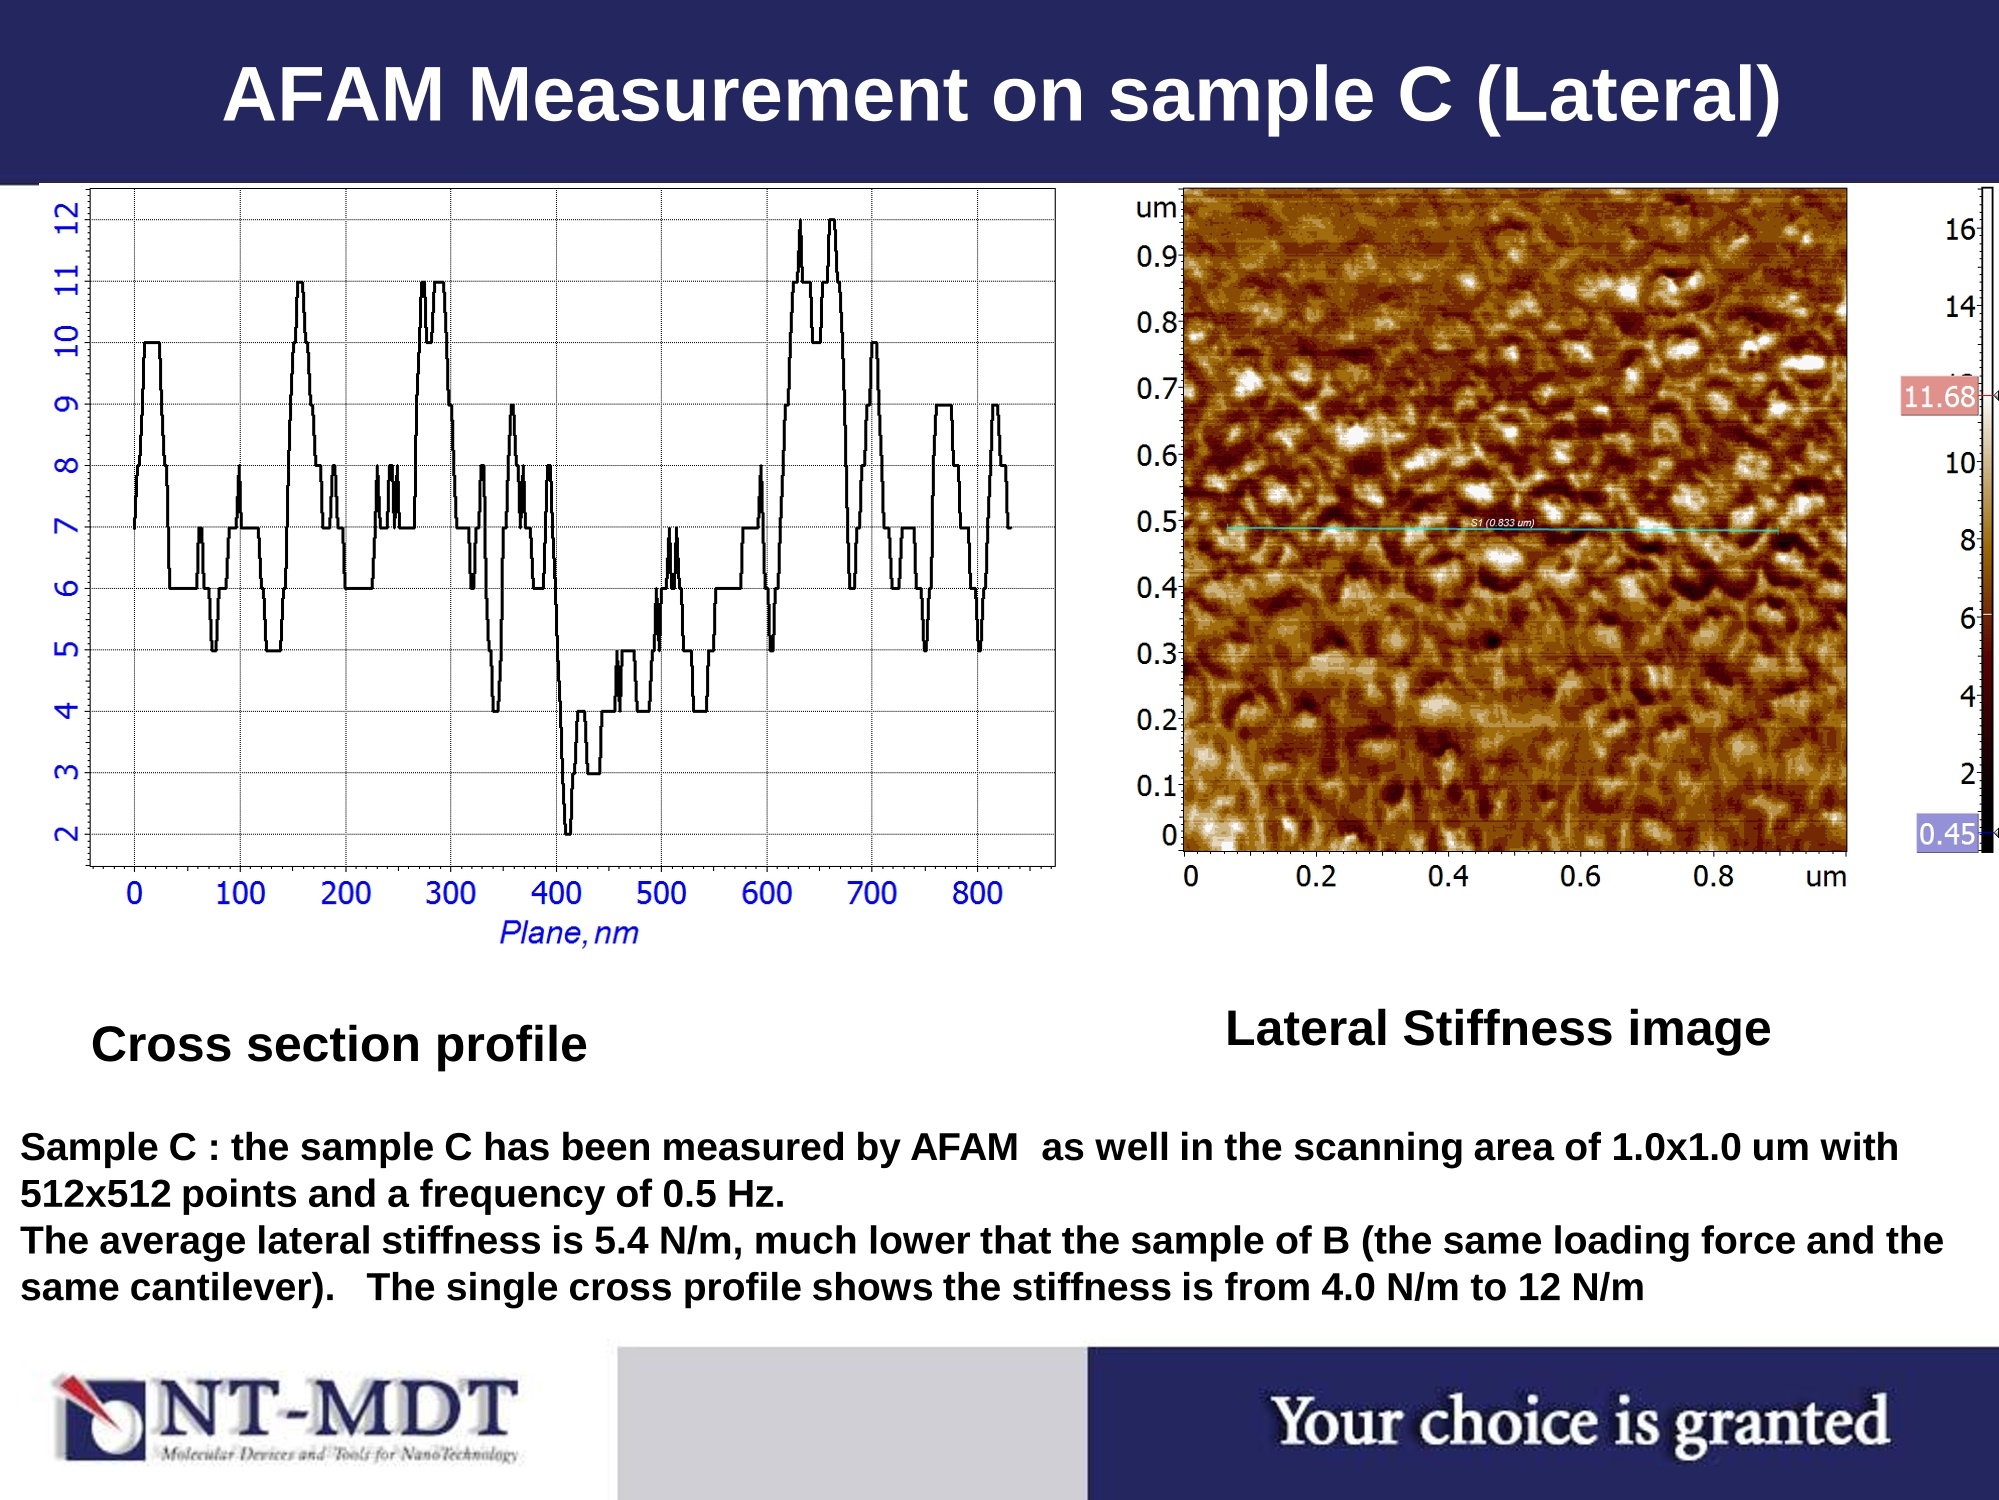
AFAM-Principle AFAM Measurement on 55nm nanopillars NT-MDTModrtwlar Dreices and ool for Nano TecAsology AFAM MeasurementsOn Nanopillars (LateralStiffness) Your choice is granted AFAM Measurement (System Set-up) Ntegra System with AFAMset-up, All the other modes areavailable: Semi-contact (contact),Phase-contrast. Lateral force, EFM,SKM, SCM. MFM. SRM. 06 Cantilever beam, spring constant R k Tip Contactradius Sensor tip Lateraltorces sample Tip Vertical ransducer forces k* k*lat W.Arnold,U. Rabe: Fraunhofer-Institute for Nondestructive Testing (IZFP), Saarbruecken, Germany AFAM Measurement on 55nm Nanopillars The AFAM measurements and stiffness calculation: 1). Mapping contact frequency image 2). Frequency image will be calculated automatically by software analysis into‘StiffnessMapping' 3). It is noted that the Young's modulus can not be converted from stiffness map by softwaretill now; however, the local (point or line profile) can be easily calculated when a knownreference sample is measured as the same situation (condition - especially the samecantilever and the same loading force). 4): The Young’s Modulus (Reduced Young’s and Shear Young’s Modulus): Can be calculated by the equation of: E," is the sample Young’s modulus, Ep* is the reference Young’s Modulus, K, is the contact stiffness of the sample, KR is is the contact stiffness of the reference sample Reference: Walter Arnold, Atomic Force Microscopy with Lateral Modulation ,AppliedScanning Probe Methods, P75, AFAM Measurement on 55nm nanopillars Sample with 55nm nanopillars: has been measured by AFAM mode and recorded with512x512 points. A standard Si (10nm) cantilever was used with a resonance of 151.65kHz (1st order) and aforce constant of 4.42 N/m, and the scanning frequency of 0.5 Hz. AFAM Measurement on 55nm nanopillars um: kHz N/m0.9 894.7872.10.8 0.8890600.7: 0.7 0.6 885 0 . 6 S1 (0.472 um)500.51 0.5 408800.4 0.4 300.3 875 0.3200.21 0.2218700.1 0.1 10 8 0 65.2300 0.2 0.4 0.6 0.8 um 0.2 0.4 0.6 0.8 um Sample with 55nm nanopillars: has been measured by AFAM mode and recorded with512x512 points. A standard Si (10nm) cantilever was used with a resonance of 151.65kHz (1st order) and aforce constant of 4.42 N/m, and the scanning frequency of 0.5 Hz. N/m72.10.8600.7S0.61(0.472um)500.540:导0.4300.320:0.210050100150200 2503003504004500.17.1Plane,nm0 0 0.2 0.4 0.6 0.8 um Sample with 55nm nanopillars, the average stiffness is ~ 30 N/m: E*=(k,/kp)3/2 ER, E* is the sample Young's modulus, ER* is the reference Young’s Modulus, K, is the contact stiffness of the sample, KR is is the contact stiffness of the reference sample; Si with SiO at its Top (100nm) is taken as reference sample with the shear E of ~ 31.14 GPa, and Theaverage stiffness of the Si reference sample is ~ 109 N/m, AFAM Measurement on 55nm nanopillars 2.3462172 93.848689 187.69738 281.54607 375.39476 469.24344 Sample with 55nmNanopillars: the average stiffness is ~ 30N/m: Es=(k,/kR)32ER,E, is the sample Young’smodulus. ER* is the reference Young’sModulus, K, is the contact stiffness ofthe sample, KR is is the contact stiffness ofthe reference sample; Si with Sio at its Top (100nm)is taken as reference sample with the shear E of~ 31.14 GPa, and The average stiffnessof the Si reference sample is ~109 N/m. 50 40 30 20 10- Topography Sample B: has been measured by semi-contact mode, and topography was recorded with 512x512points. A standard Si(10nm) cantilever was used with a resonance of 132kHz (1st order) and a forceconstant of 1.495 N/m. the scanning frequency of 0.5 Hz. the same cantilever is used for AFAM measurements: AFAM Measurement on sample B (Lateral) kHz. 698.26 695 690 685 680 674.70 Topography AFAM Frequency Image Sample B: the sample has been measured by AFAM technique which is operated under the standardcontact mode, and the Si cantilever is in contact with surface and the acoustic generator under the sample.To record the frequency image, the second contact frequency was used. Topography and frequency imageare recorded simultaneously with 512x512 points with a scanning frequency of 0.5 Hz. the same cantilever is used for AFAM measurements: AFAM Measurement on sample B (lateral) kHz N/m150.7 695 698.26674.70 140 1201 690 685 680 201 0 AFAM Frequency Image Stiffness Calculation Image Sample B: frequency image was calculated to stiffness image, which was done automatically by imageanalysis program by inputting the physical parameter of the cantilever as like force constant of cantileverand its stiffness, et al; the more stiffness in lateral from the nanopillars'edges. The average lateral stiffness is 105.77 N/m. AFAM Measurement on sample B (lateral) 140 1201 100 801 60 44.8 201 Stiffness Calculation Image Sample B: frequency image was calculated to stiffness image, which was done automatically by imageanalysis program by inputting the physical parameter of the cantilever as like force constant of cantileverand its stiffness, et al: Cross section profile is showing the stiffness of nano-pillars from 90 N/m to 130 N/m at their edges, andthe average stiffness is 105.77 N/m. AFAM Measurement on sample B (lateral) Sample B: frequency imagewas calculated to stiffnessimage, which was doneautomatically by imageanalysis program byinputting the physicalparameter of the cantileveras like force constant ofcantilever and its stiffness.et al: Cross section profile isshowing the stiffness ofnano-pillars from 90 N/m to130 N/m at their edges, andthe average stiffness is105.77 N/m. The Lateral young'sModulus is from 16 to 40 GPa, and the average is~ 30GPa, the reference lateral(Shear Young’s Modulus is31.14 Gpa) nm Hz 10 9.03 600 8 5001 470t 6 4001 3001 4 2001 2 1.27 100 0 31 Topographyimage Frequency Image Sample C : the sample C has been measured by AFAM as well in the scanning area of 1.0x1.0 um with512x512 points and a frequency of 0.5 Hz. Topography shows a different structure in comparison with the sample of B. AFAM Measurement on sample C (Lateral) 11.68+ 10 81 6 41 21 0.45 Plane,nm Cross section profile Lateral Stiffness image Sample C : the sample C has been measured by AFAM as well in the scanning area of 1.0x1.0 um with512x512 points and a frequency of 0.5 Hz. The average lateral stiffness is 5.4 N/m, much lower that the sample of B (the same loading force and thesame cantilever). The single cross profile shows the stiffness is from 4.0 N/m to 12 N/m Your choice is granted
确定


还剩13页未读,是否继续阅读?

产品配置单
俄罗斯NT-MDT公司上海代表处(恩特-梦迪特服务和物流有限公司)为您提供《AFAM样品横向刚性测试结果》,该方案主要用于其他中--检测,参考标准--,《AFAM样品横向刚性测试结果》用到的仪器有原子力声学显微镜AFAM
推荐专场
相关方案
更多