方案详情
文
LAUDA TecInfo Constant Temperature Equipment No. 9
Accurate Temperature Control When Determining Vapour Pressure Curves
The vapour pressure of liquids plays a significant role in technology. Technical processes and process components can be improved using vapour pressure data. The more accurately the vapour pressure can be determined, the better it is possible to optimise processes and gain a deeper physical understanding of the procedures. In the faculty of applied chemistry at the Georg-Simon-Ohm University in Nuremberg, a measuring set-up has been developed, which allows dynamic measurement of the vapour pressures of various liquids. For accurate readings, precise temperature control during measuring is decisive.
方案详情

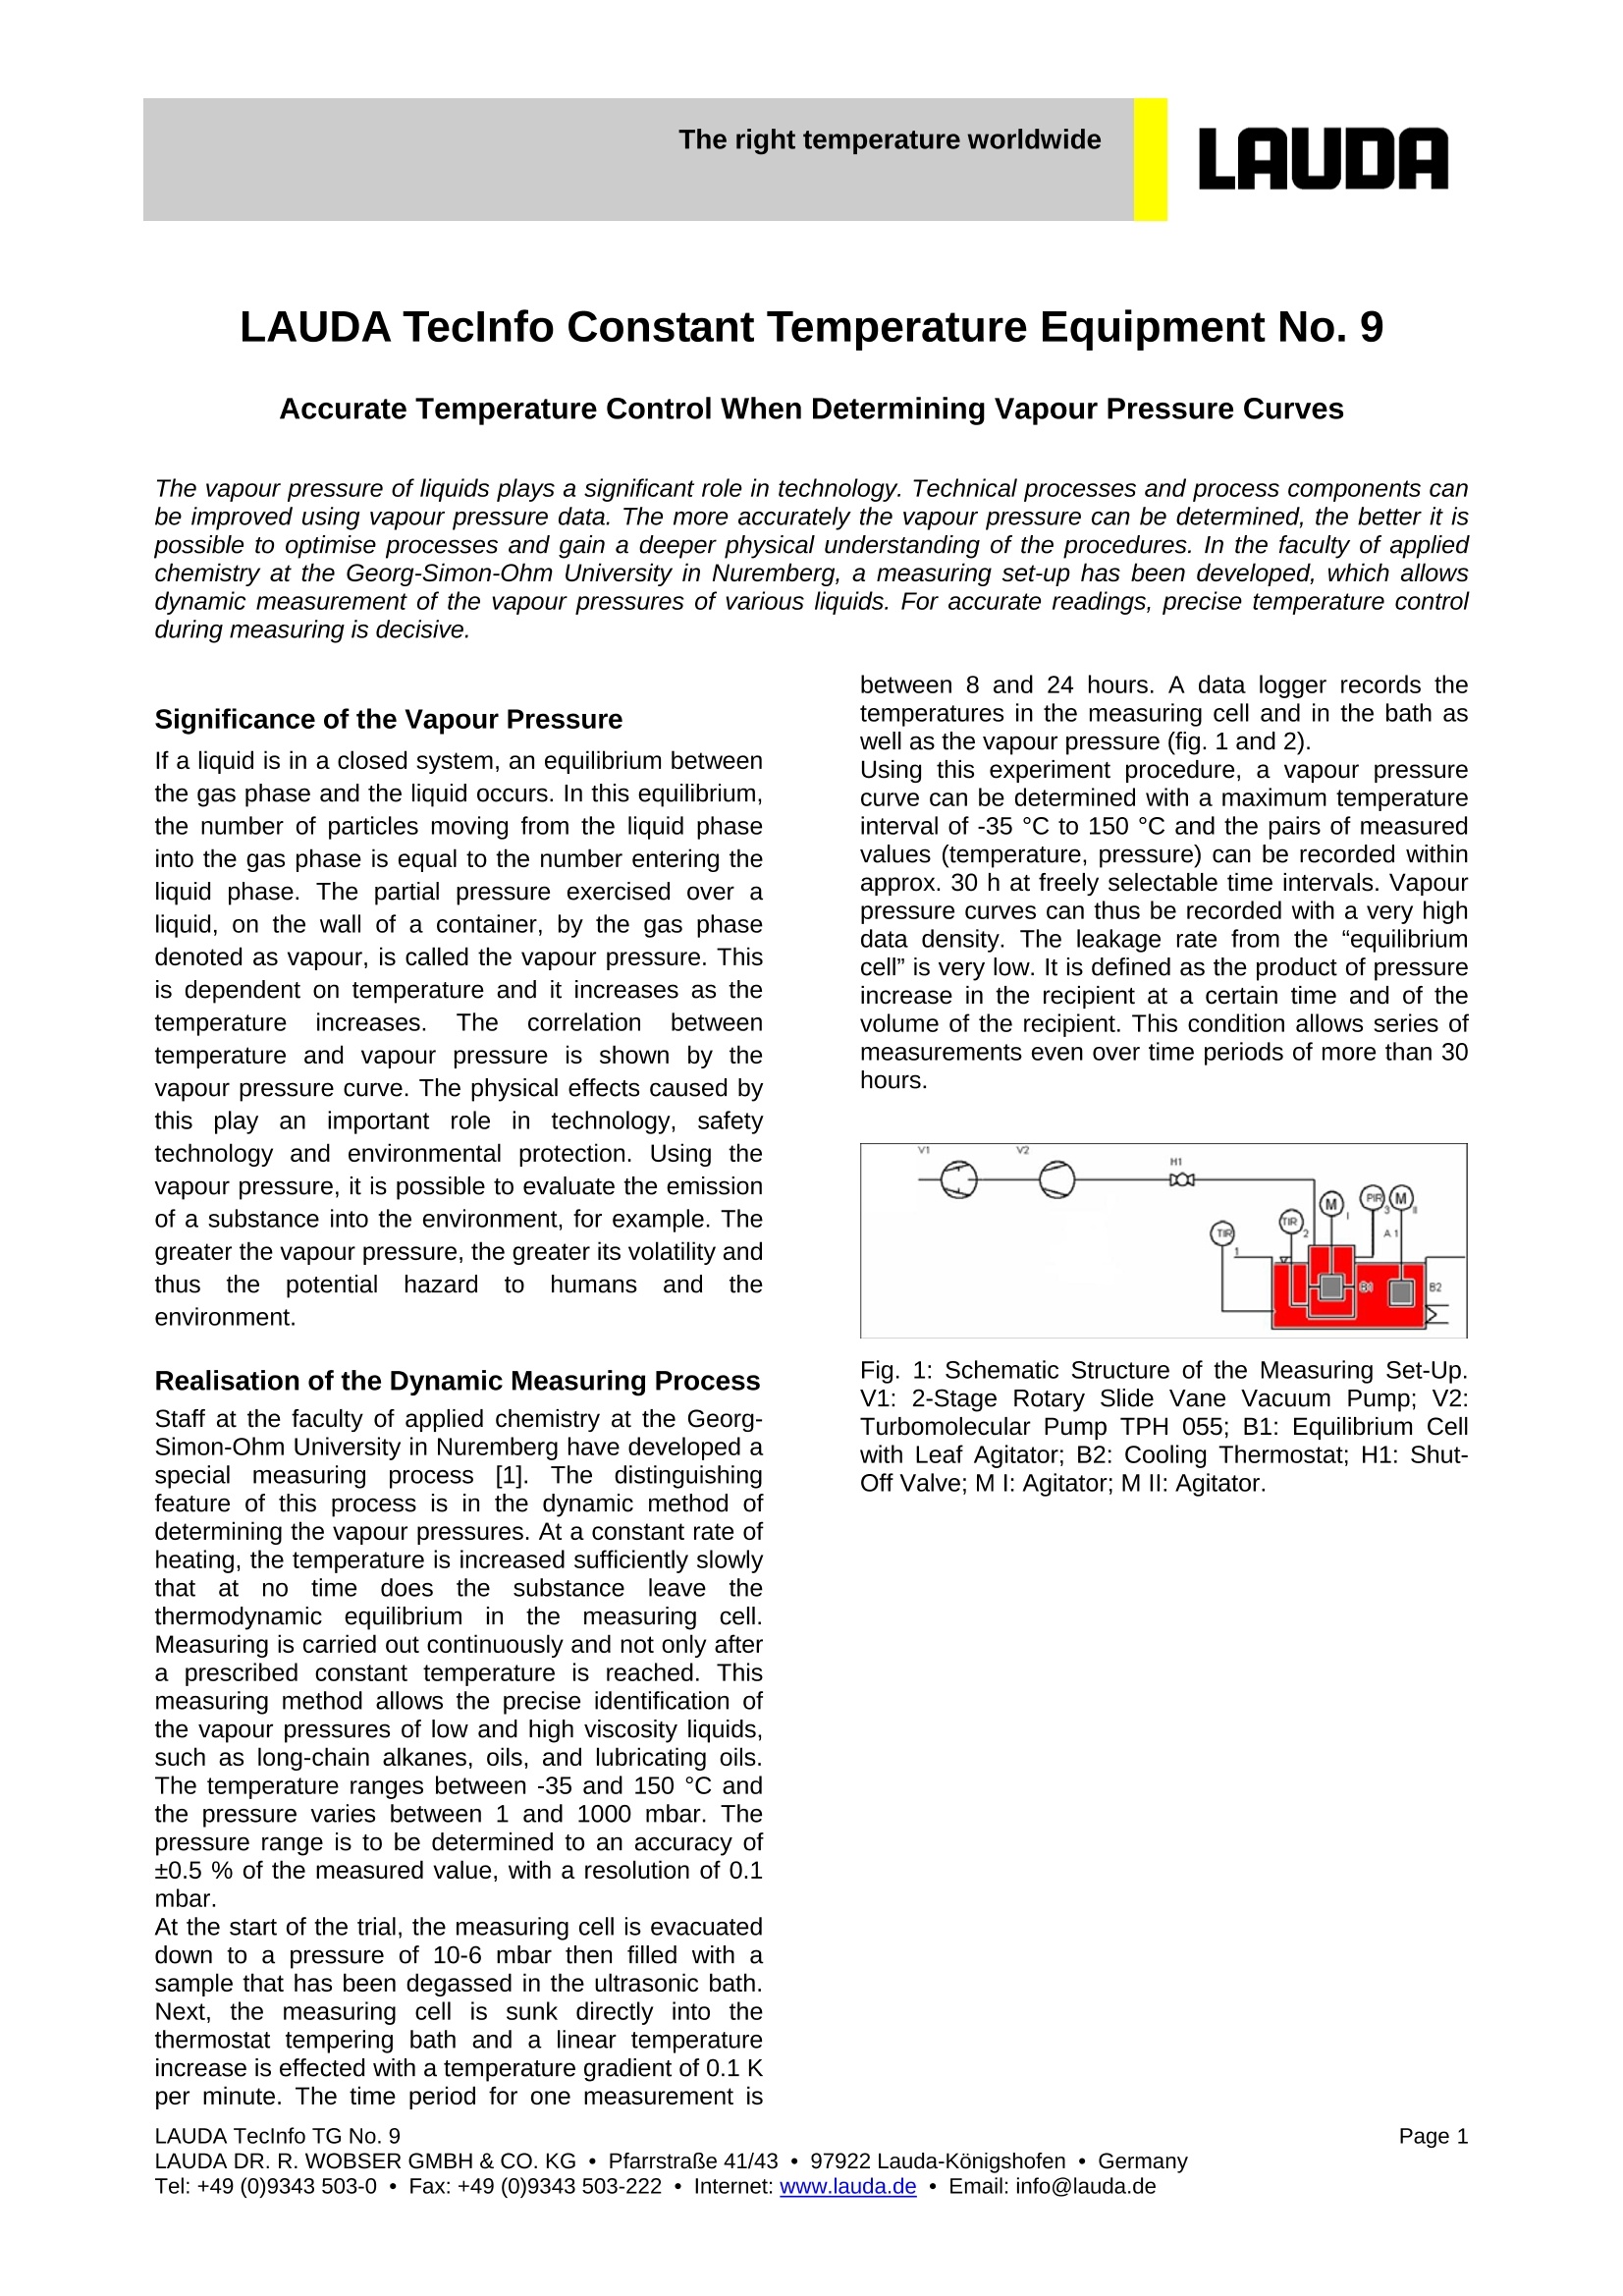
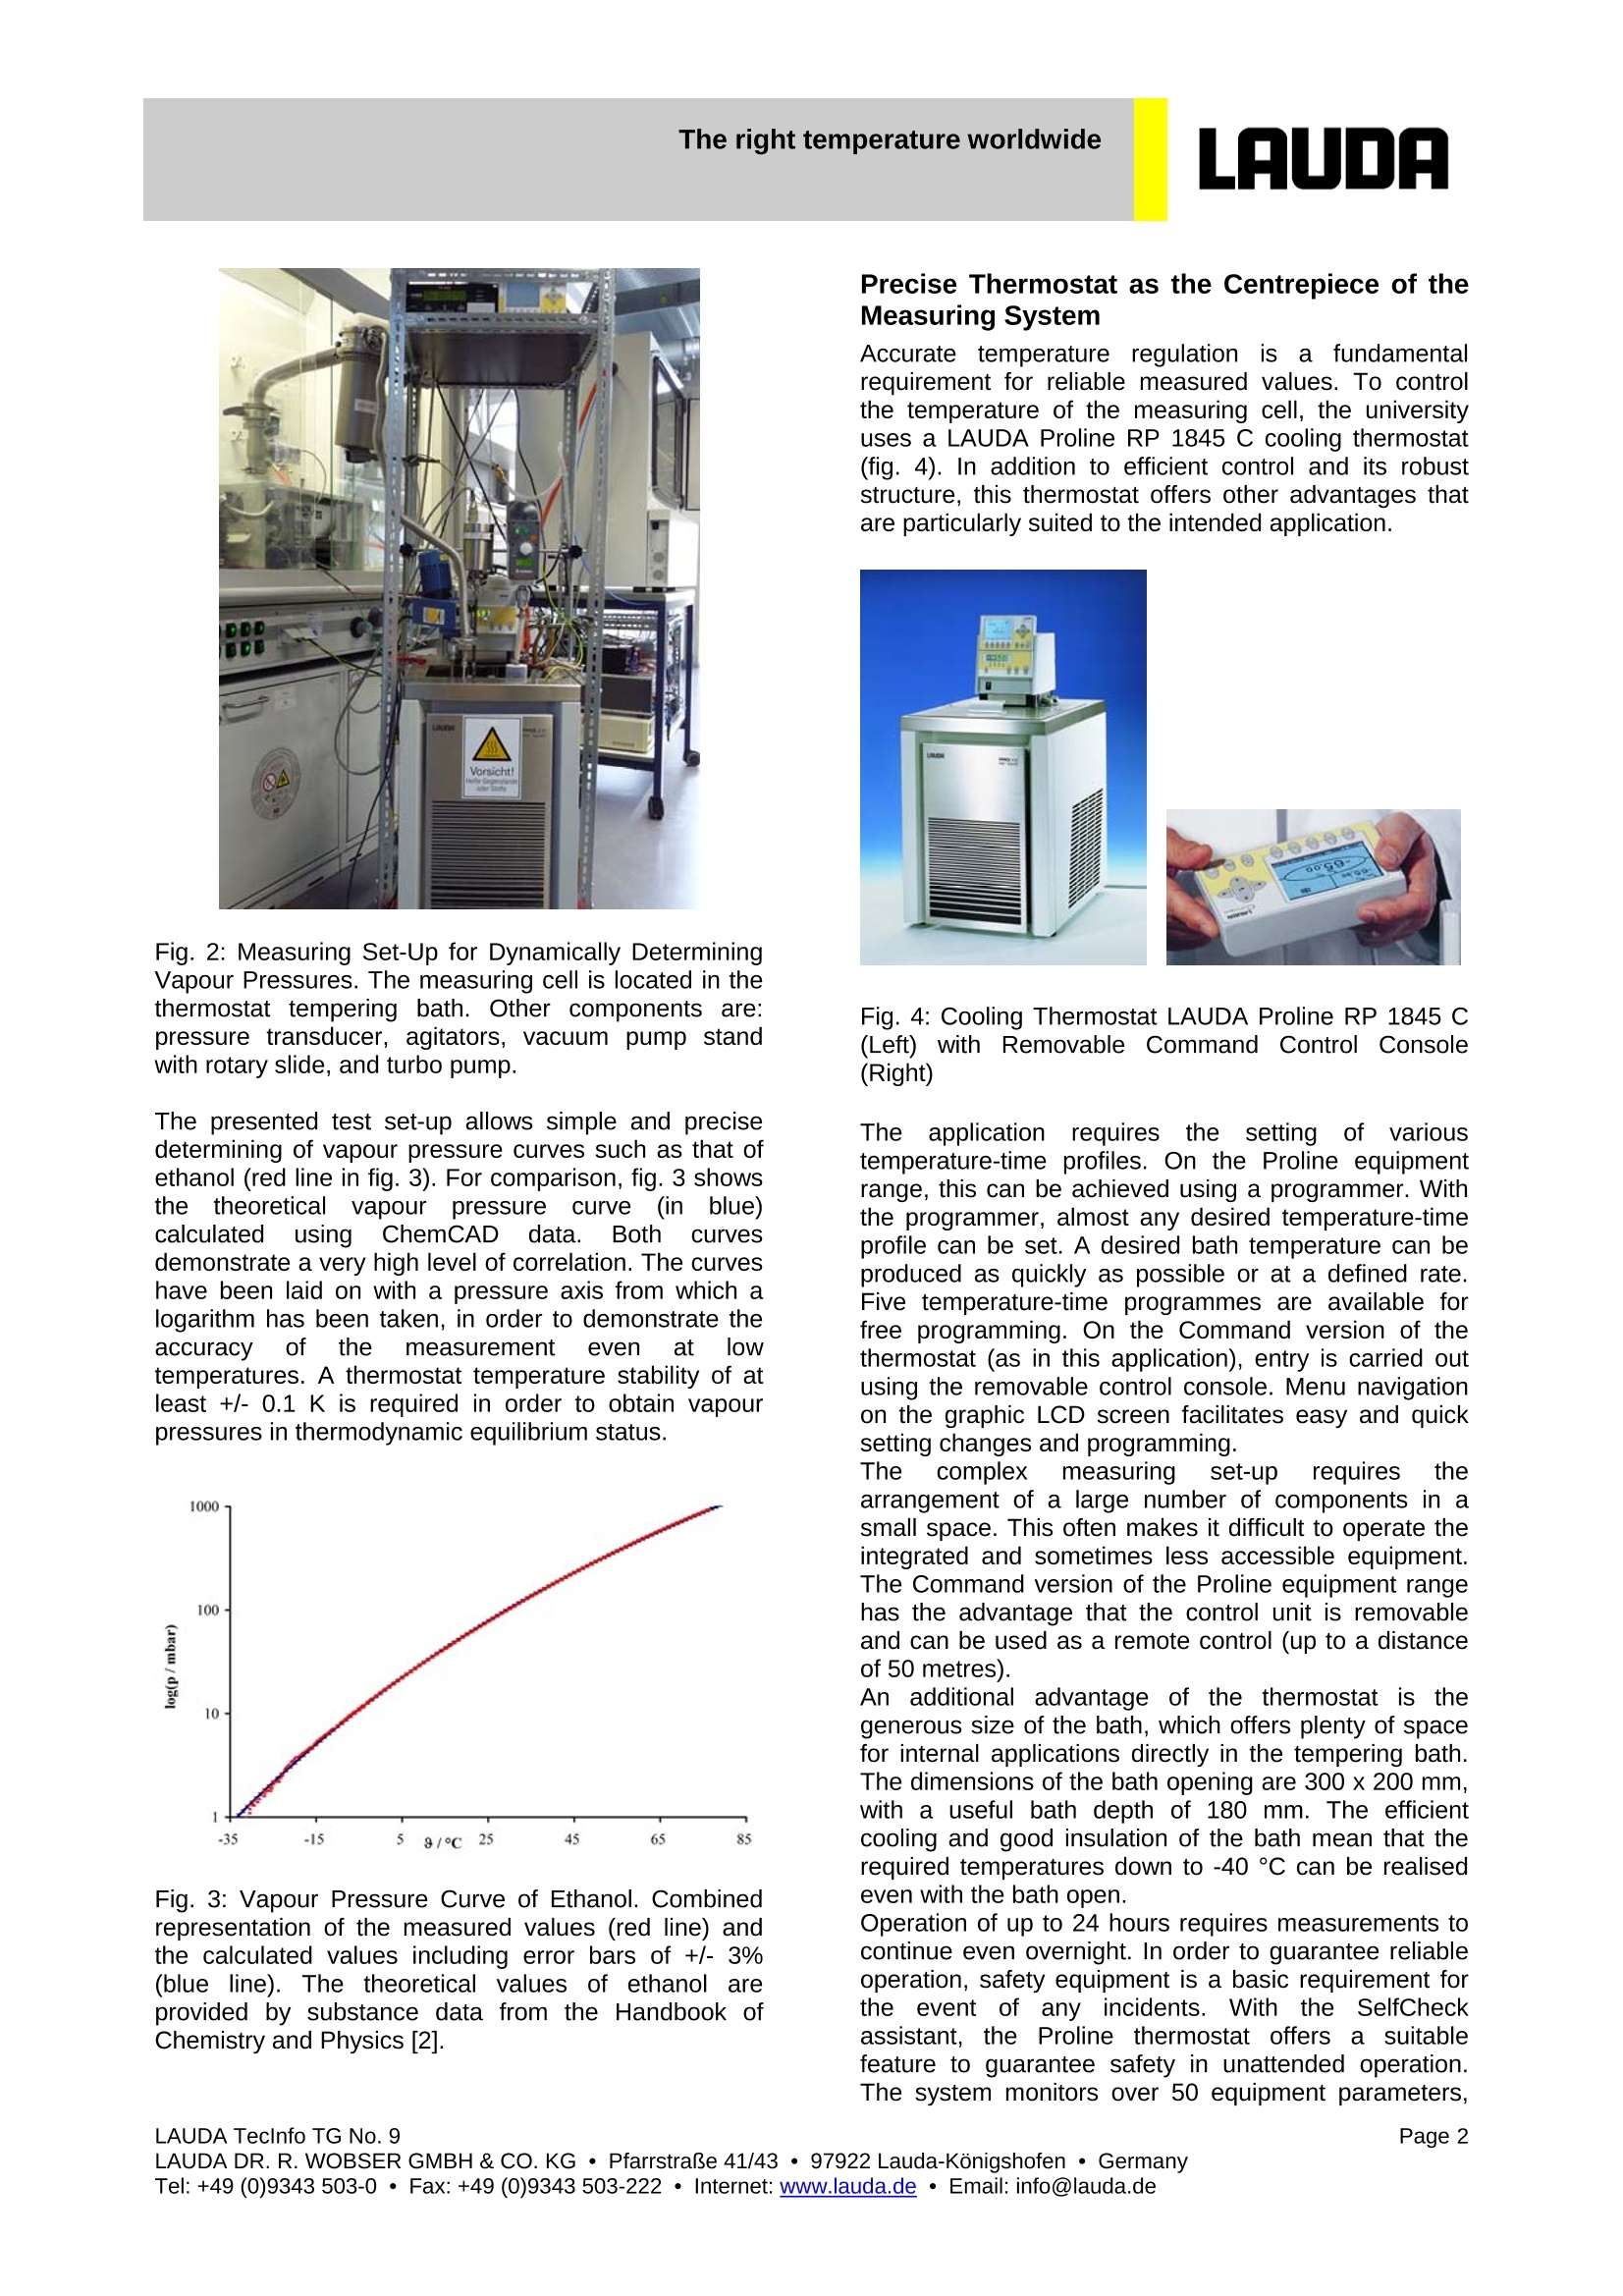
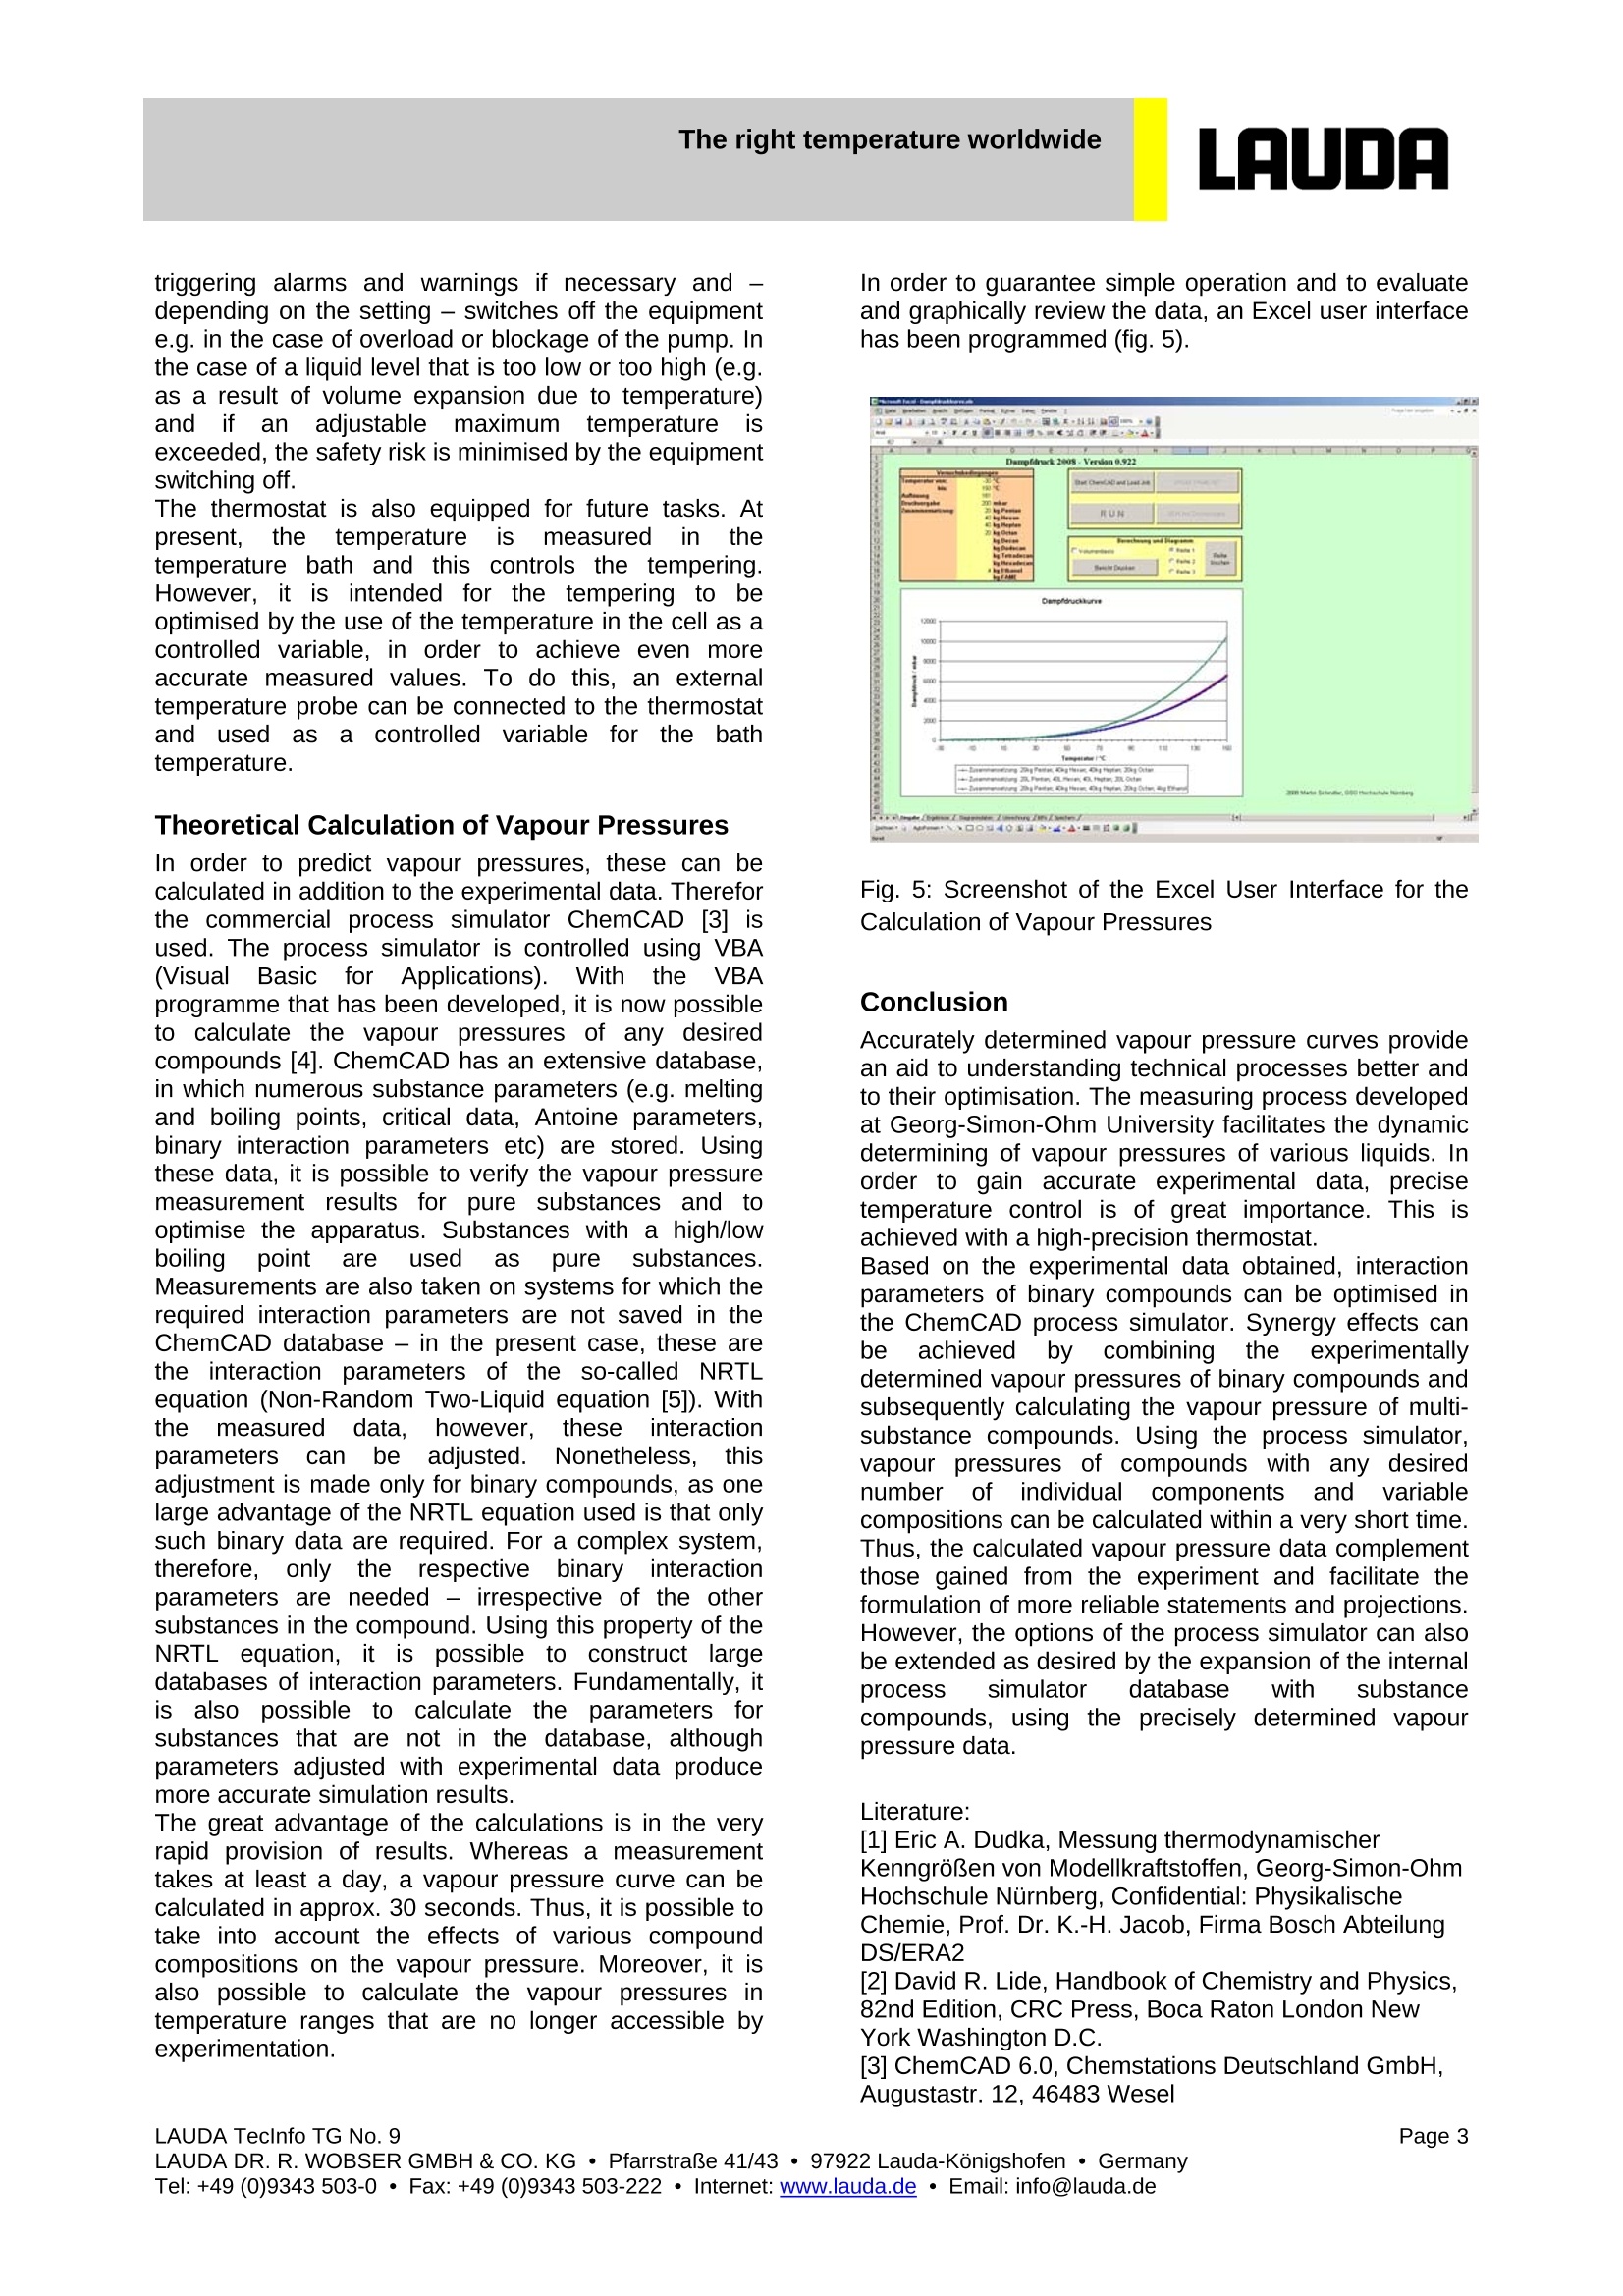
The right temperature worldwideLAUDA LAUDAThe right temperature worldwide LAUDA Teclnfo Constant Temperature Equipment No. 9 Accurate Temperature Control When Determining Vapour Pressure Curves The vapour pressure of liquids plays a significant role in technology. Technical processes and process components canbe improved using vapour pressure data. The more accurately the vapour pressure can be determined, the better it ispossible to optimise processes and gain a deeper physical understanding of the procedures. In the faculty of appliedchemistry at the Georg-Simon-Ohm University in Nuremberg, a measuring set-up has been developed, which allowsdynamic measurement of the vapour pressures of various liquids. For accurate readings, precise temperature controlduring measuring is decisive. Significance of the Vapour Pressure lf a liquid is in a closed system, an equilibrium betweenthe gas phase and the liquid occurs. In this equilibrium,the number of particles moving from the liquid phaseinto the gas phase is equal to the number entering theliquid phase. The partial pressure exercised over aliquid, on the wall of a container, by the gas phasedenoted as vapour, is called the vapour pressure. Thisis dependent on temperature and it increases as thetemperatureincreases. The correlation betweentemperature and vapour pressure is shown by thevapour pressure curve. The physical effects caused bythisi play animportant role in technology, safetytechnologyand environmental protection. Using thevapour pressure, it is possible to evaluate the emissionof a substance into the environment, for example. Thegreater the vapour pressure, the greater its volatility andthus the potential hazard to humans and theenvironment. Realisation of the Dynamic Measuring Process Staff at the faculty of applied chemistry at the Georg-Simon-Ohm University in Nuremberg have developed aspecial measuring process[1]. The distinguishingfeature of this process is in the dynamic method ofdtermining the vapour pressures. At a constant rate ofheating, the temperature is increased sufficiently slowlythat at no time does the substance leave thethermodynamic equilibrium in the measuring cell.Measuring is carried out continuously and not only aftera prescribed constant temperature is reached. Thismeasuring method allows the precise identification ofthe vapour pressures of low and high viscosity liquids,such as long-chain alkanes, oils, and lubricating oils.The temperature ranges between -35 and 150°C andthe pressure varies between 1 and 1000 mbar. Thepressure range is to be determined to an accuracy of±0.5 % of the measured value, with a resolution of 0.1mbar. At the start of the trial, the measuring cell is evacuateddown to a pressure of 10-6 mbar then filled with asample that has been degassed in the ultrasonic bath.Next, the measuring cell is sunk directly into thethermostat tempering bath and a linear temperatureincrease is effected with a temperature gradient of 0.1 Kper minute. The time period for one measurement is between 8 and 24 hours. A data logger records thetemperatures in the measuring cell and in the bath aswell as the vapour pressure (fig. 1and 2). Using this experiment procedure, a vapour pressurecurve can be determined with a maximum temperatureinterval of -35 °℃ to 150°C and the pairs of measuredvalues (temperature, pressure) can be recorded withinapprox. 30 h at freely selectable time intervals. Vapourpressure curves can thus be recorded with a very highdata density. The leakage rate from the “equilibriumcell" is very low. It is defined as the product of pressureincrease in the recipient at a certain time and of thevolume of the recipient. This condition allows series ofmeasurements even over time periods of more than 30hours. Fig. 1: Schematic Structure of the Measuring Set-Up.V1: 2-Stage Rotary Slide Vane Vacuum Pump; V2:Turbomolecular Pump TPH 055; B1: Equilibrium Cellwith Leaf Agitator; B2: Cooling Thermostat; H1: Shut-Off Valve; MI: Agitator; M II: Agitator. Fig. 2: Measuring Set-Up for Dynamically DeterminingVapour Pressures. The measuring cell is located in thethermostat tempering bath. Other components are:pressure transducer, agitators, vacuum pump standwith rotary slide, and turbo pump. The presented test set-up allows simple and precisedetermining of vapour pressure curves such as that ofethanol (red line in fig. 3). For comparison, fig. 3 showsthetheoreticalal vapour pressure curve(inblue)calculatedusing CChheenmCADdata. EBothcurvesdemonstrate a very high level of correlation. The curveshave been laid on with a pressure axis from which alogarithm has been taken, in order to demonstrate theaccuracy of the measurementeven at lowtemperatures. A thermostat temperature stability of atleast +/-0.1 K is required in order to obtain vapourpressures in thermodynamic equilibrium status. Fig. 3: Vapour Pressure Curve of Ethanol. Combinedrepresentation of the measured values (red line) andthe calculated values including error bars of +/- 3%(blue line). The theoretical values of ethanol areprovided by substance data from the Handbook ofChemistry and Physics [2]. Precise Thermostat as the Centrepiece of theMeasuring System Accurate temperature regulation1iis afundamentalrequirement for reliable measured values. To controlthe temperature of the measuring cell, the universityuses a LAUDA Proline RP 1845 C cooling thermostat(fig. 4). In addition to efficient control and its robuststructure, this thermostat offers other advantages thatare particularly suited to the intended application. Fig. 4: Cooling Thermostat LAUDA Proline RP 1845 C(Left) withR eRmemovable Command Control Console(Right) TheeapplicationnrequiresltLhe settingg otfvarioustemperature-time profiles. On the Proline equipmentrange, this can be achieved using a programmer. Withthe programmer, almost any desired temperature-timeprofile can be set. A desired bath temperature can beproduced as quickly as possible or at a defined rate.Five temperature-time programmes are available forfree programming. On the Command version of thethermostat (as in this application), entry is carried outusing the removable control console. Menu navigationon the graphic LCD screen facilitates easy and quicksetting changes and programming. The complex measuringset-uprrequires thearrangement of a large number of components in asmall space. This often makes it difficult to operate theintegrated and sometimes less accessible equipment.The Command version of the Proline equipment rangehas the advantage that the control unit is removableand can be used as a remote control (up to a distanceof 50 metres). An additional advantage of the thermostat is thegenerous size of the bath, which offers plenty of spacefor internal applications directly in the tempering bath.The dimensions of the bath opening are 300 x 200 mm,with a useful bath depth of 180 mm. The efficientcooling and good insulation of the bath mean that therequired temperatures down to -40 °C can be realisedeven with the bath open. Operation of up to 24 hours requires measurements tocontinue even overnight. In order to guarantee reliableoperation, safety equipment is a basic requirement forthe event of any incidents. With the SelfCheckassistant, the Proline thermostat offers a suitablefeature to guarantee safety in unattended operation.The system monitors over 50 equipment parameters, ( LAUDA DR. R. WOBSER GMBH & CO. KG · PfarrstraBe 41/4 3 ·97922 Lauda-Konigshofen · Germany ) ( Tel:+49 (0)9343 503-0·Fax: +49 (0)9343 503-222· Internet: w ww.lauda .de·Em ail: inf o @lauda.de ) triggering alarms and warnings if necessary and -depending on the setting - switches off the equipmente.g. in the case of overload or blockage of the pump. Inthe case of a liquid level that is too low or too high (e.g.as a result of volume expansion due to temperature)and ifan adjustablemaximum temperatureisexceeded, the safety risk is minimised by the equipmentswitching off. The thermostat is also equipped for future tasks. Atpresent, tthetemperatureis measured in thetemperature bath and this controls the tempering.However, it is intended for the tempering to beoptimised by the use of the temperature in the cell as acontrolled variable, in order to achieve even moreaccurate measured values. To do this, an externaltemperature probe can be connected to the thermostatandused a controlled variable forthetemperature. Theoretical Calculation of Vapour Pressures In order to predict vapour pressures, these can becalculated in addition to the experimental data. Thereforthe commercial process simulator ChemCAD [3] isused. The process simulator is controlled using VBA(VisualBasicforApplications). With the VBAprogramme that has been developed, it is now possibleto calculate the vapour pressures of any desiredcompounds [4]. ChemCAD has an extensive database,in which numerous substance parameters (e.g. meltingand boiling points, critical data, Antoine parameters,binary interaction parameters etc) are stored. Usingthese data, it is possible to verify the vapour pressuremeasurement results for pure substances and tooptimise the apparatus. Substances with a high/lowboilingpointare used as puresubstances.Measurements are also taken on systems for which therequired interaction parameters are not saved in theChemCAD database - in the present case, these arethe interaction parameters of the so-called NRTLequation (Non-Random Two-Liquid equation [5]). Withthe measureddata,however.theseinteractionparameters can bee adjusted. NNonetheless.thisadjustment is made only for binary compounds, as onelarge advantage of the NRTL equation used is that onlysuch binary data are required. For a complex system,therefore, only therespectivebinaryinteractionparameters are needed - irrespective of the othersubstances in the compound.Using this property of theNRTL equation, it is possible to construct largedatabases of interaction parameters. Fundamentally, itisalsopossible to (calculate the parameters forsubstances that are not in the database, althoughparameters adjusted with experimental data producemore accurate simulation results. The great advantage of the calculations is in the veryrapid provision of results. Whereas a measurementtakes at least a day, a vapour pressure curve can becalculated in approx. 30 seconds. Thus, it is possible totake into account the effects of various compoundcompositions on the vapour pressure. Moreover, it isalso possible to calculate the vapour pressures intemperature ranges that are no longer accessible byexperimentation. In order to guarantee simple operation and to evaluateand graphically review the data, an Excel user interfacehas been programmed (fig.5). Fig. 5: Screenshot of the Excel User Interface for theCalculation of Vapour Pressures Conclusion Accurately determined vapour pressure curves providean aid to understanding technical processes better andto their optimisation. The measuring process developedat Georg-Simon-Ohm University facilitates the dynamicdetermining of vapour pressures of various liquids. Inorder to gain accurate experimental data, precisetemperature control is of great importance..This isachieved with a high-precision thermostat. Based on the experimental data obtained, interactionparameters of binary compounds can be optimised inthe ChemCAD process simulator. Synergy effects canbe achievedbycombiningthe experimentallydetermined vapour pressures of binary compounds andsubsequently calculating the vapour pressure of multi-substance compounds. Using the process simulator,vapour pressures of compounds with anydesirednumber off individual componentsand yvariablecompositions can be calculated within a very short time.Thus, the calculated vapour pressure data complementthose gained from the experiment and facilitate theformulation of more reliable statements and projections.However, the options of the process simulator can alsobe extended as desired by the expansion of the internalprocess simulator database with substancecompounds, using the precisely determined vapourpressure data. Literature: [1] Eric A. Dudka, Messung thermodynamischerKenngroBen von Modellkraftstoffen, Georg-Simon-OhmHochschule Nurnberg, Confidential: PhysikalischeChemie, Prof. Dr. K.-H. Jacob, Firma Bosch AbteilungDS/ERA2 [2] David R. Lide, Handbook of Chemistry and Physics,82nd Edition, CRC Press, Boca Raton London NewYork Washington D.C. [3] ChemCAD 6.0, Chemstations Deutschland GmbH,Augustastr. 12,46483 Wesel ( LAUDA DR. R. WOBSER GMBH & CO. KG· P f arrstraBe 41/4 3 ·97922 Lauda-Konigshof e n·Germany ) ( Tel: +49 (0)9343 503-0·Fax: +49 (0)9343 503-222·Internet: w ww.lauda .de·Em ail: inf o @lauda.de ) The right temperature worldwide [4] Martin A. Schindler, Berechnung thermodynamischer KenngroBen von Modell- kraftstoffen, Georg-Simon-Ohm Hochschule Nurnberg, Confidential: Physikalische Chemie, Prof. Dr. K.-H. Jacob, Firma Bosch Abteilung DS/ERA 2 [5] John M. Prausnitz; H. Renon; AlChE Journal 14 (1968),135-144,“Local Composition in Thermodynamic Excess Functions for Liquid Mixtures" Page LAUDA Teclnfo TG No. LAUDA DR. R. WOBSER GMBH & CO. KG · PfarrstraBe Lauda-Konigshofen·GermanyTel:+()Fax: +()Internet: www.lauda.de·Email: info@lauda.de LAUDA Teclnfo TG No. Page
确定

还剩2页未读,是否继续阅读?
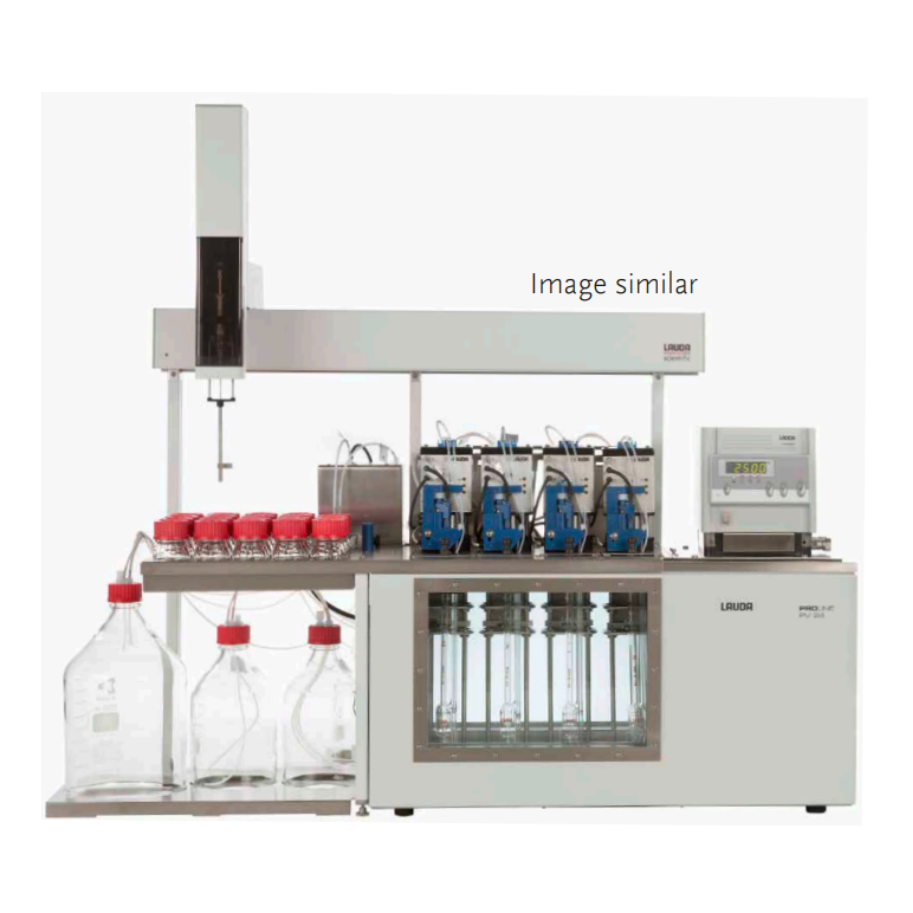
劳达贸易(上海)有限公司为您提供《粘度计应用实例9》,该方案主要用于其他中--检测,参考标准--,《粘度计应用实例9》用到的仪器有LAUDA Automatic Viscometer 全自动运动粘度计
推荐专场
相关方案
更多
该厂商其他方案
更多

