


方案详情
文
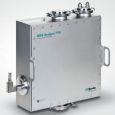
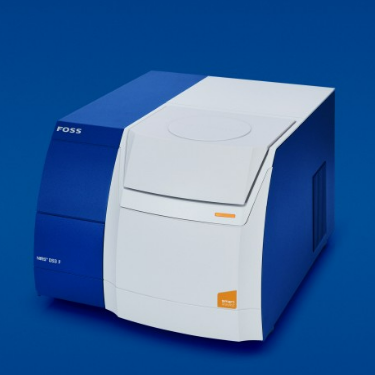
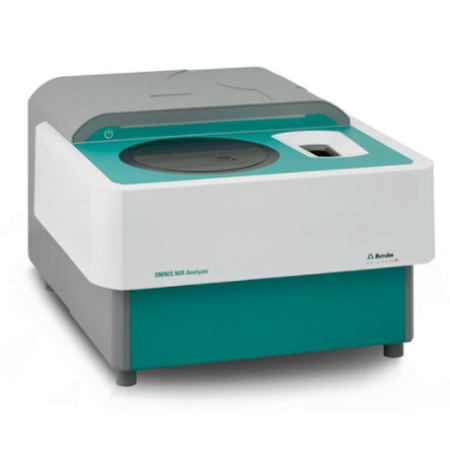
2013年,Metrohm收购Foss NIRSystems Inc.公司,以Metrohm-NIRSystems作为近红外产品品牌开始进军光谱领域,在工业领域开始与Foss公司进行全球战略合作。Metrohm-NIRSystems为客户提供实验室型、旁线以及在线近红外解决方案。 XDS系列近红外产品是新一代的光栅型扫描近红外分析仪,采用基于偏移技术数字全息光栅系统,其对应的NIIST可追溯的标准和方法保证了每台仪器的光度计,波长和带宽等重要技术参数的高度一致,保证了仪器之间定标模型无缝转移并且可实现网络控制操作。基于XDS近红外分析技术,Metrohm-NIRSystems开发了一系列新一代的过程分析仪,用于制药和化工领域的实时分析。样品无需破损、测试精确等优点都在加工过程、搅拌器、干燥器、反应器等不同阶段的检测中得到了体现。XDS近红外在线分析仪典型的应用案例包括炼油厂、石化企业、聚合过程、原料药的溶媒保护等的反应监测和终点判断,以及压缩聚合物薄膜或包衣的分析。
方案详情

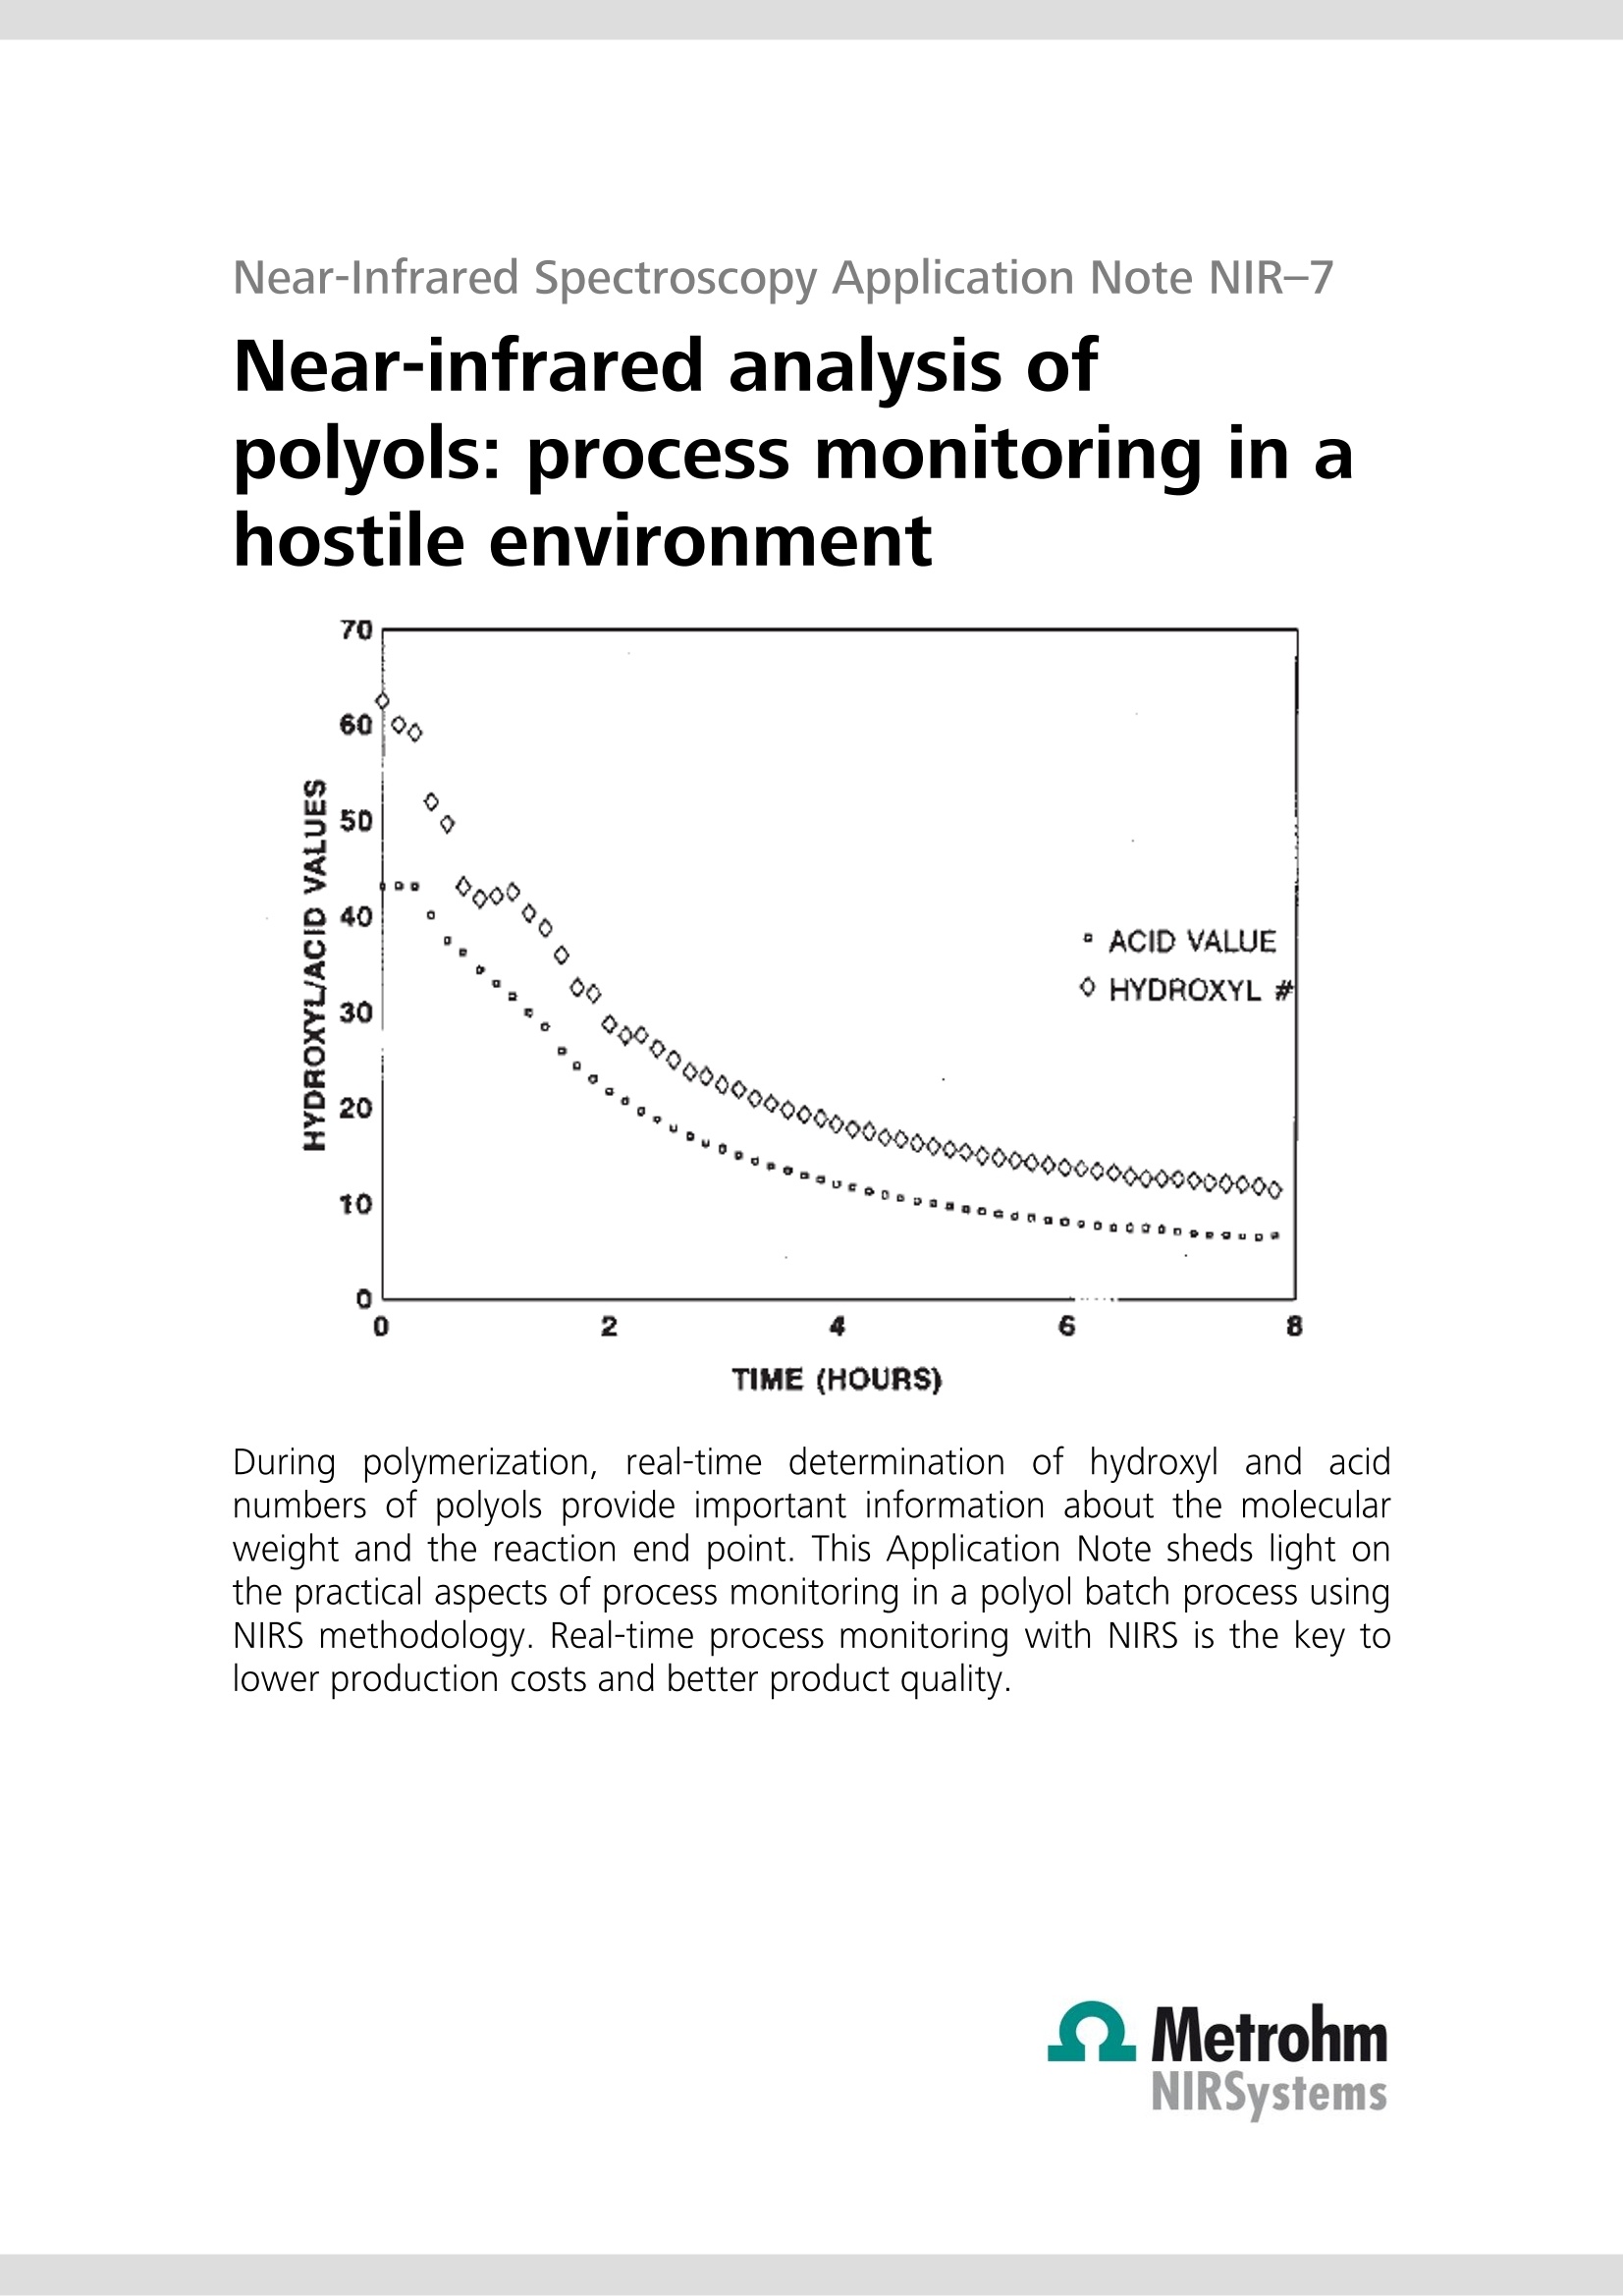
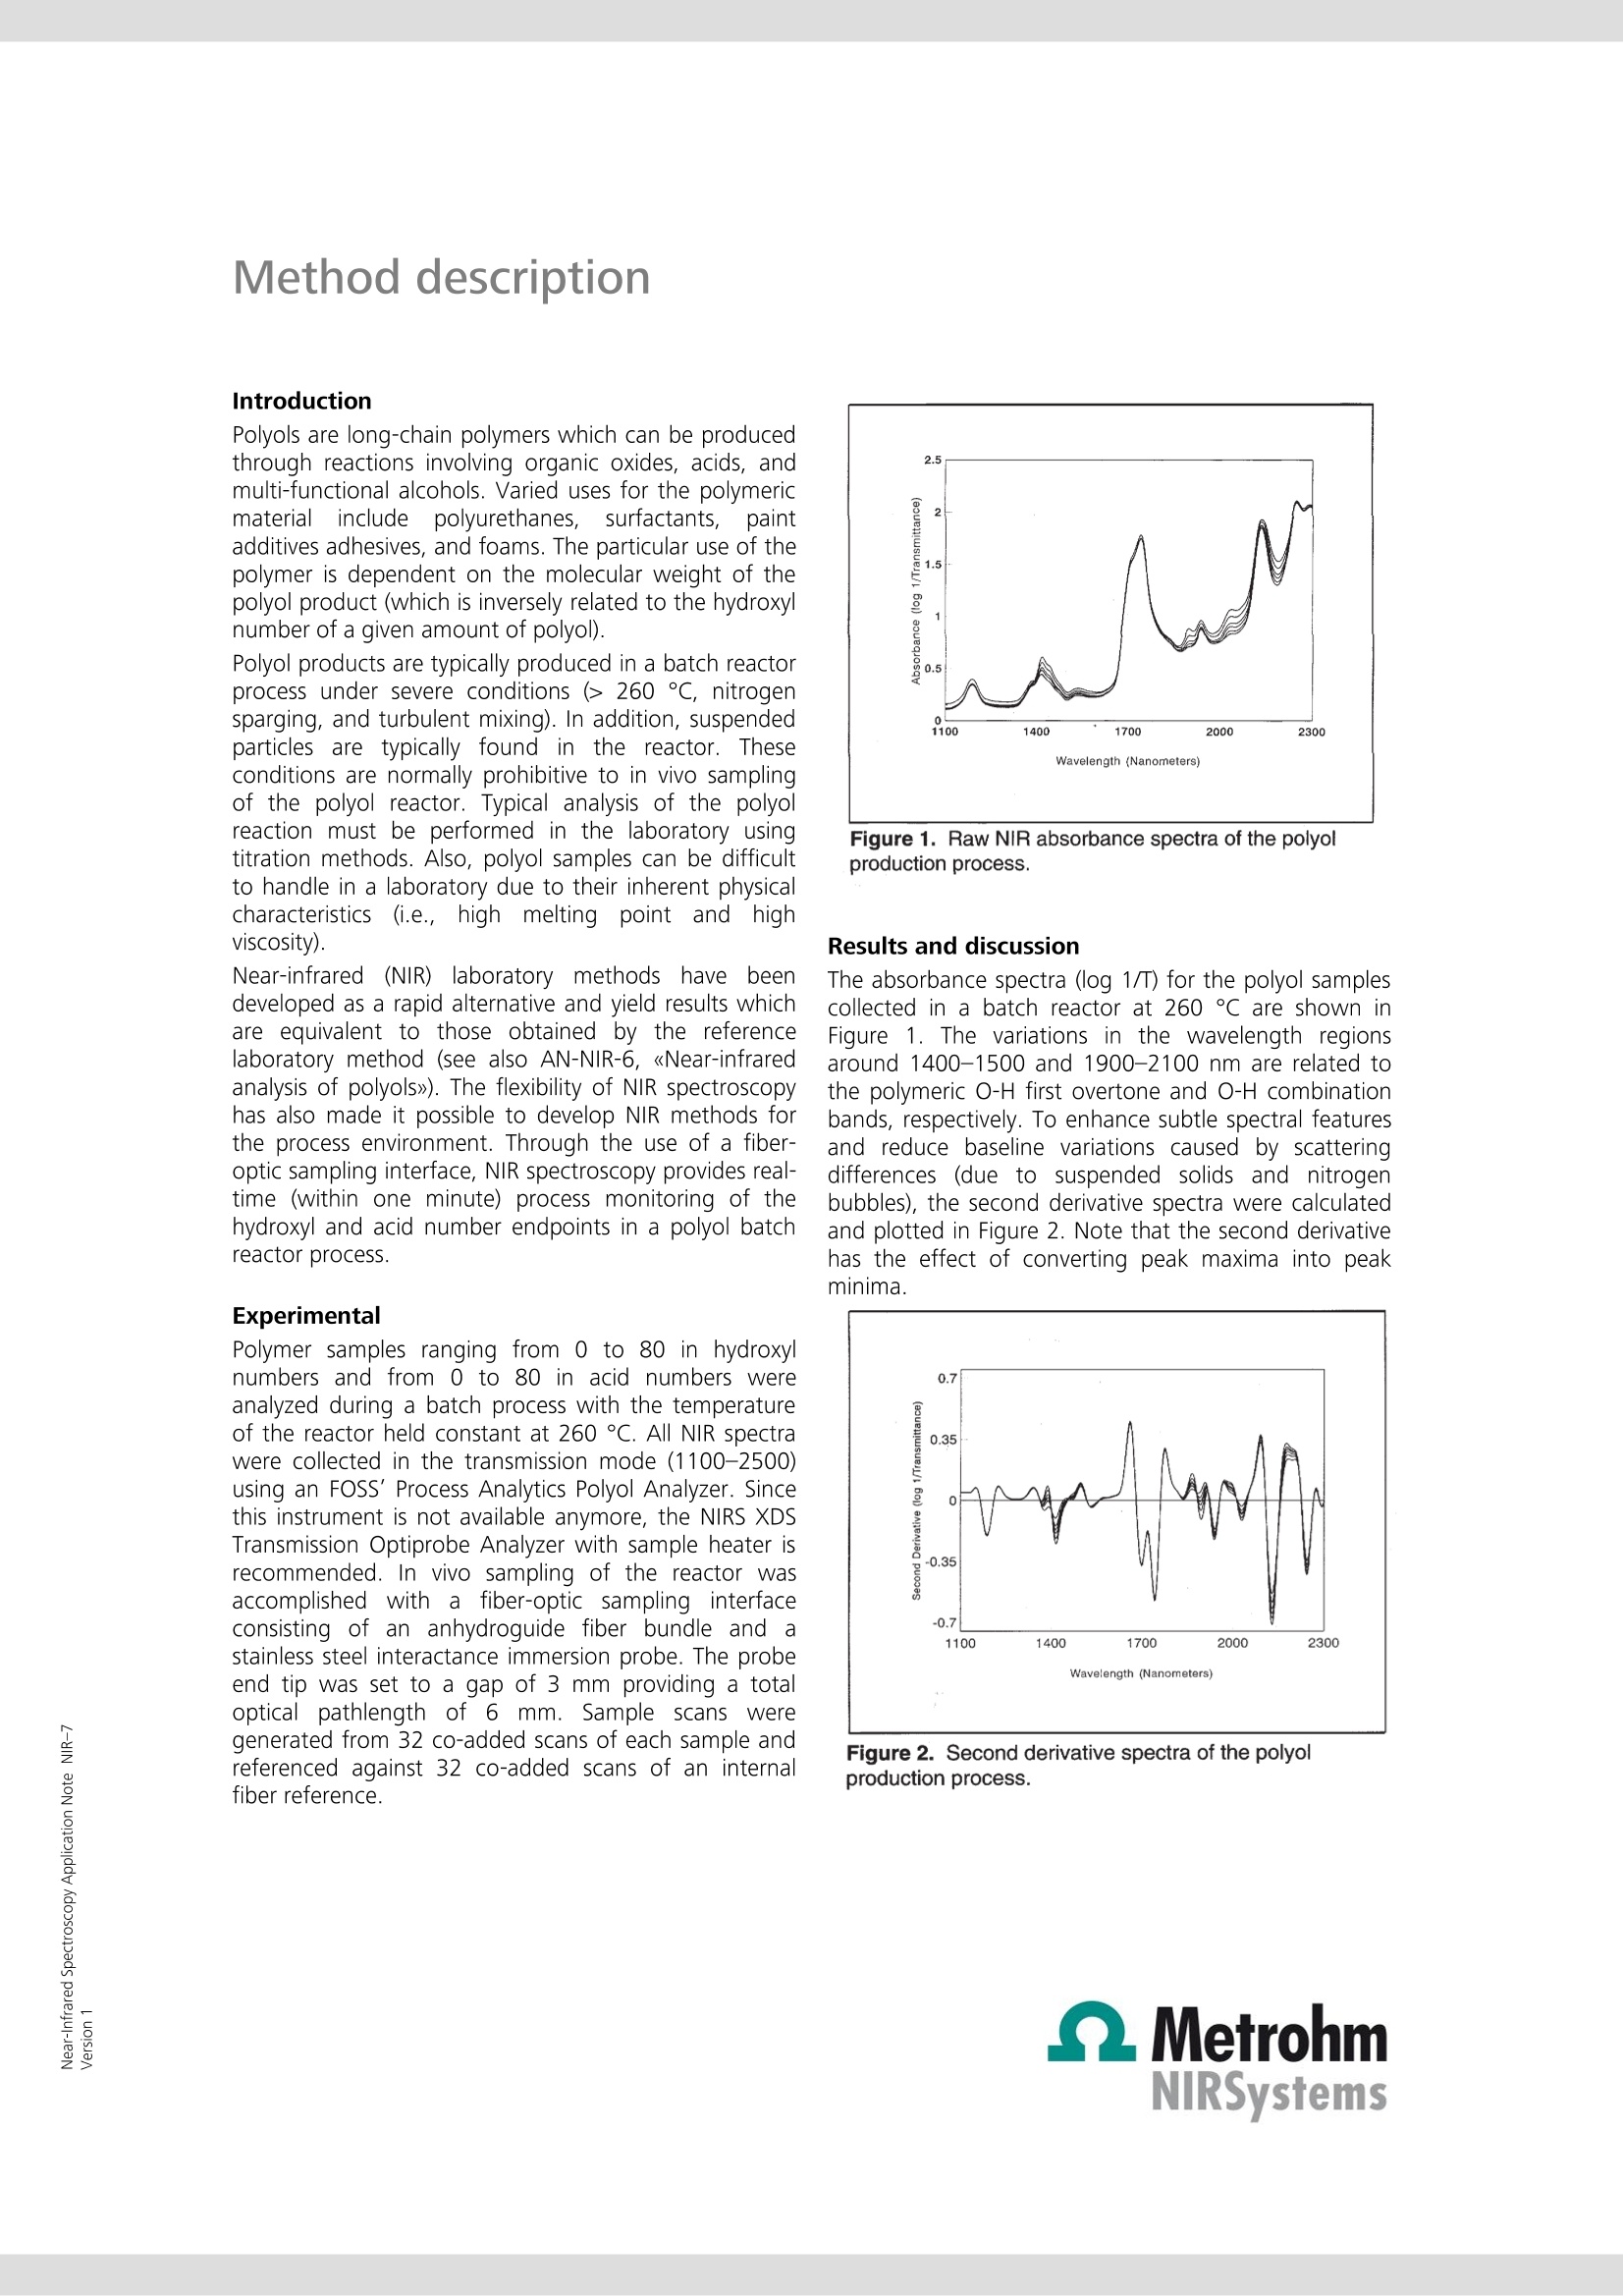
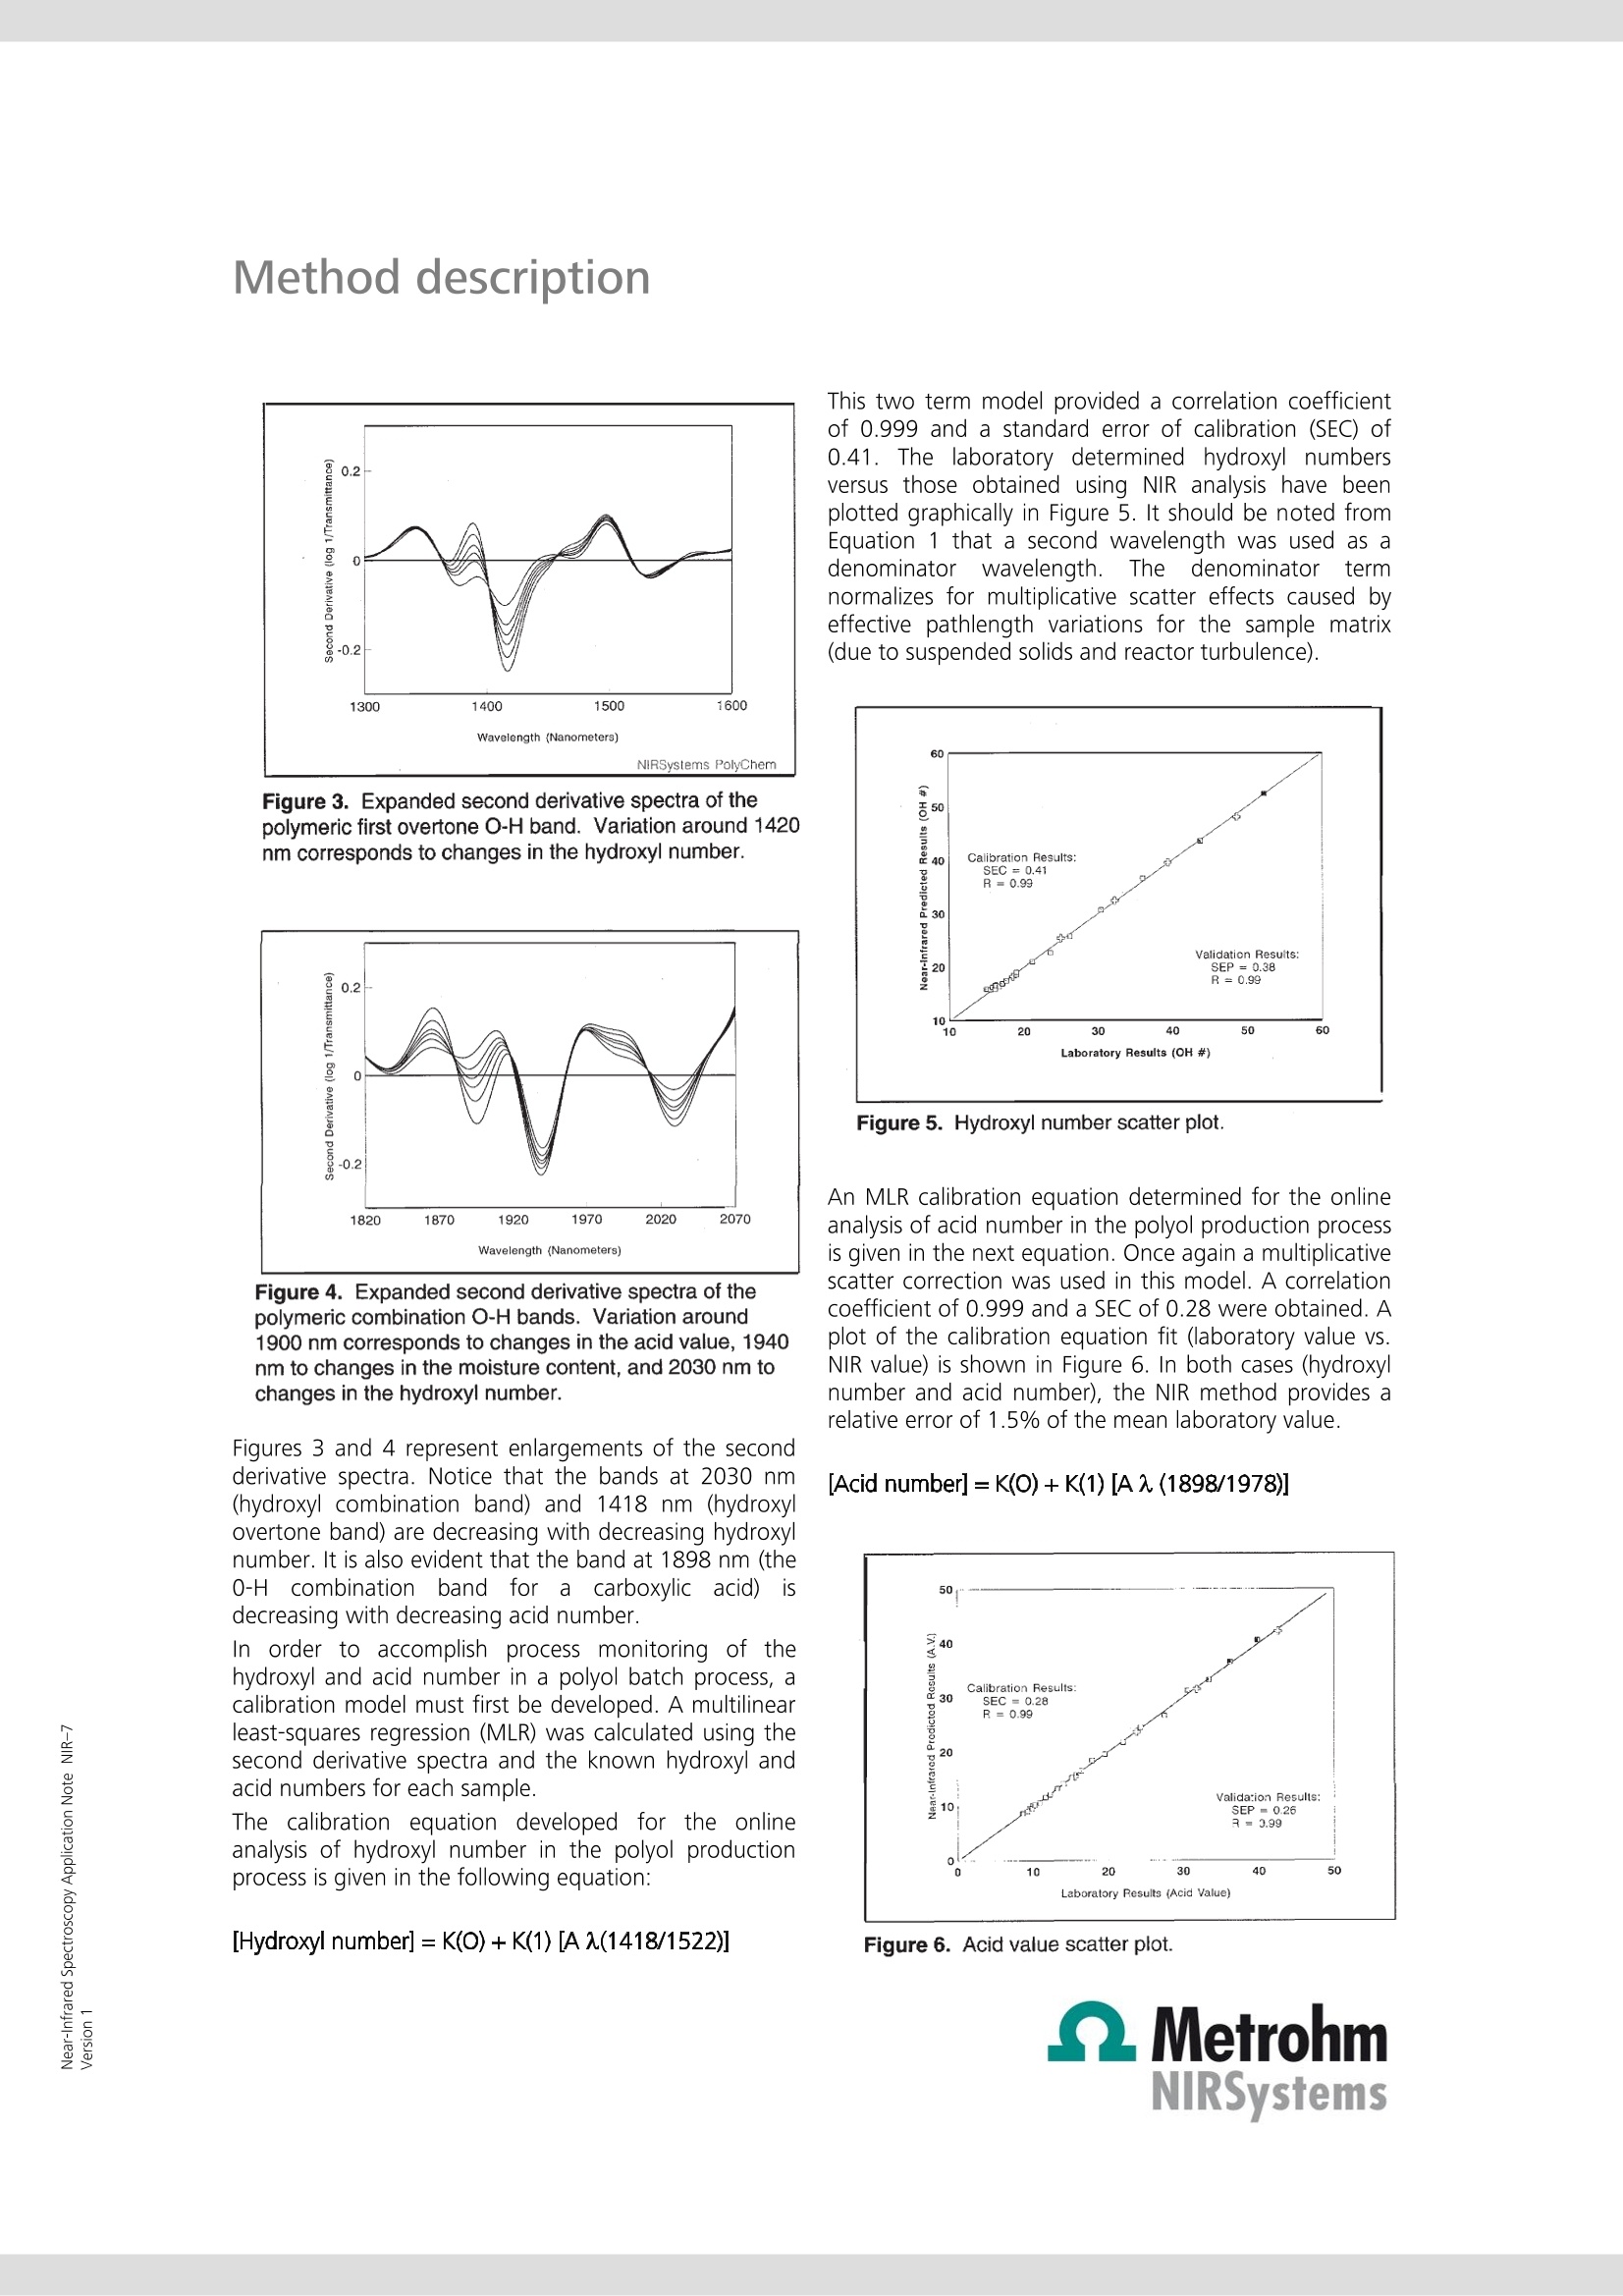
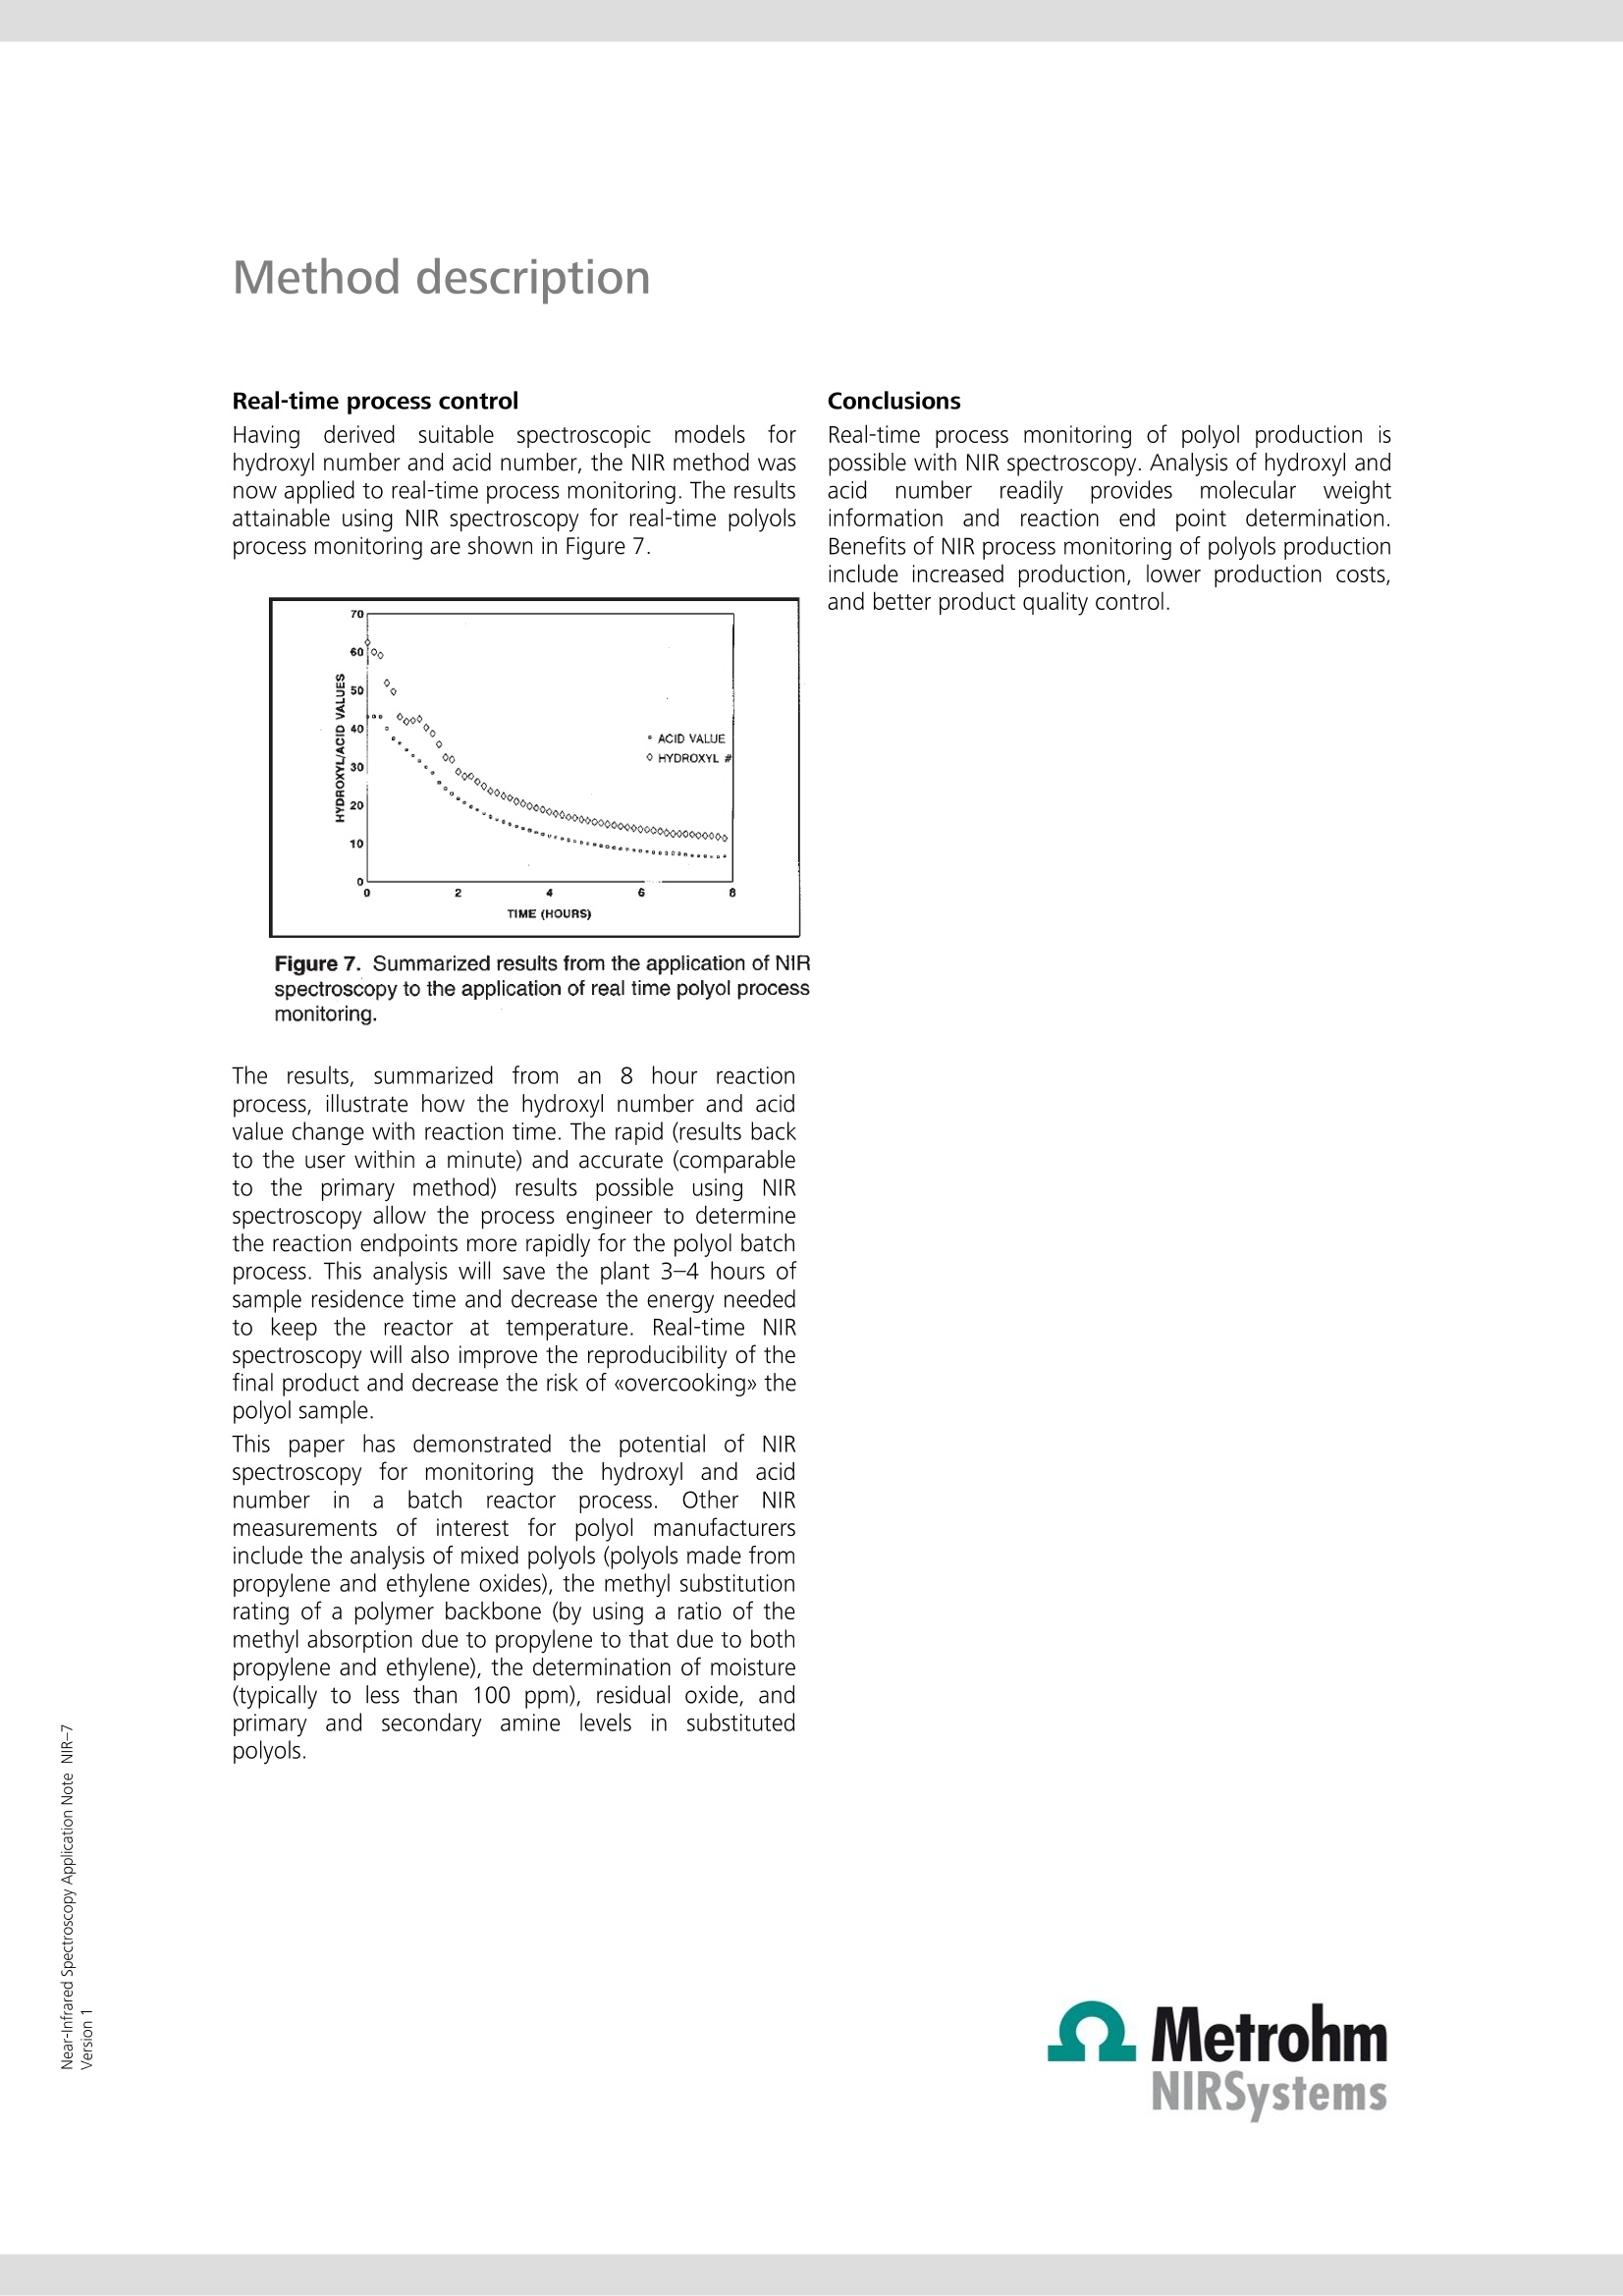
Near-Infrared Spectroscopy Application Note NIR-7 Near-infrared analysis ofpolyols: process monitoring in ahostile environment TIME (HOURS) During polymerization, real-time determination of hydroxyl and acidnumbers of polyols provide important information about the molecularweight and the reaction end point. This Application Note sheds light onthe practical aspects of process monitoring in a polyol batch process usingNIRS methodology. Real-time process monitoring with NIRS is the key tolower production costs and better product quality. Introduction Polyols are long-chain polymers which can be producedthrough reactions involving organic oxides, acids, andmulti-functional alcohols. Varied uses for the polymericmaterialiirnclude polyurethanes, surfactants, paintadditives adhesives, and foams. The particular use of thepolymer is dependent on the molecular weight of thepolyol product (which is inversely related to the hydroxylnumber of a given amount of polyol). Polyol products are typically produced in a batch reactorprocess under severe conditions (> 260 ℃, nitrogensparging, and turbulent mixing). In addition, suspendedparticles are typically found in the reactor. Theseconditions are normally prohibitive to in vivo samplingof the polyol reactor. Typical analysis of the polyolreaction must be performed in the laboratory usingtitration methods. Also, polyol samples can be difficultto handle in a laboratory due to their inherent physicalcharacteristics(i.e.,high rmelting point andhhighviscosity). Near-infrared(NIR) laboratory methods have beendeveloped as a rapid alternative and yield results whichare equivalent to those obtained by the referencelaboratory method (see also AN-NIR-6, 《Near-infraredanalysis of polyols》). The flexibility of NIR spectroscopyhas also made it possible to develop NIR methods forthe process environment. Through the use of a fiber-optic sampling interface, NIR spectroscopy provides real-time (within one minute) process monitoring of thehydroxyl and acid number endpoints in a polyol batchreactor process. Experimental Polymer samples ranging from 0 to 80 in hydroxylnumbers and from 0 to 80 in acid numbers wereanalyzed during a batch process with the temperatureof the reactor held constant at 260 C. All NIR spectrawere collected in the transmission mode (1100-2500)using an FOSS’ Process Analytics Polyol Analyzer. Sincethis instrument is not available anymore, the NIRS XDSTransmission Optiprobe Analyzer with sample heater isrecommended. In vivo sampling of the reactor wasaccomplished with a fiber-optic sampling interfaceisisting of an anhydroguide filerr bundle and astainless steel interactance immersion probe. The probeend tip was set to a gap of 3 mm providing a totalopticalpathlength of 6 mm. Sample scans weregenerated from 32 co-added scans of each sample andreferenced against 32 co-added scans of an internalfiber reference. Figure 1. Raw NIR absorbance spectra of the polyolproduction process. Results and discussion The absorbance spectra (log 1/T) for the polyol samplescollected in a batch reactor at 260C are shown inFigure 1. The variations in the wavelength regionsaround 1400-1500 and 1900-2100 nm are related tothe polymeric O-H first overtone and O-H combinationbands, respectively. To enhance subtle spectral featuresand reduce baseline variations caused by scatteringdifferences (due to suspended solids and nitrogenbubbles), the second derivative spectra were calculatedand plotted in Figure 2. Note that the second derivativehas the effect of converting peak maxima into peakminima. Figure 2. Second derivative spectra of the polyolproduction process. Figure 3. Expanded second derivative spectra of thepolymeric first overtone O-H band. Variation around 1420nm corresponds to changes in the hydroxyl number. Figure 4. Expanded second derivative spectra of thepolymeric combination O-H bands. Variation around1900 nm corresponds to changes in the acid value, 1940nm to changes in the moisture content, and 2030 nm tochanges in the hydroxyl number. Figures 3 and 4 represent enlargements of the secondderivative spectra. Notice that the bands at 2030 nm(hydroxyl combination band) and 1418 nm (hydroxylovertone band) are decreasing with decreasing hydroxylnumber. It is also evident that the band at 1898 nm (the0-Hcombination band for a carboxylicacid) isdecreasing with decreasing acid number. In order to accomplish process monitoring of thehydroxyl and acid number in a polyol batch process, acalibration model must first be developed. A multilinearleast-squares regression (MLR) was calculated using thesecond derivative spectra and the known hydroxyl andacid numbers for each sample. The calibration equation developed for the onlineanalysis of hydroxyl number in the polyol productionprocess is given in the following equation: [Hydroxyl number]= K(O)+K(1)[AA(1418/1522)] This two term model provided a correlation coefficientof 0.999 and a standard error of calibration (SEC) of0.41. The laboratory determined hydroxyl numbersversus those obtained using NIR analysis have beenplotted graphically in Figure 5. It should be noted fromEquation 1 that a second wavelength was used as adenominator wavelengthh..TThedenominatorttermnormalizes for multiplicative scatter effects caused byeffective pathlength variations for the sample matrix(due to suspended solids and reactor turbulence). Figure 5. Hydroxyl number scatter plot. An MLR calibration equation determined for the onlineanalysis of acid number in the polyol production processis given in the next equation. Once again a multiplicativescatter correction was used in this model. A correlationcoefficient of 0.999 and a SEC of 0.28 were obtained. Aplot of the calibration equation fit (laboratory value vs.NIR value) is shown in Figure 6. In both cases (hydroxylnumber and acid number), the NIR method provides arelative error of 1.5% of the mean laboratory value. [Acid number]=K(0)+K(1)[A (1898/1978)] Figure 6. Acid value scatter plot. Real-time process control Having derived suitable spectroscopic models forhydroxyl number and acid number, the NIR method wasnow applied to real-time process monitoring. The resultsattainable using NIR spectroscopy for real-time polyolsprocess monitoring are shown in Figure 7. Figure 7. Summarized results from the application of NIRspectroscopy to the application of real time polyol processmonitoring. The results, summarized from an 8 hour reactionprocess, illustrate how the hydroxyl number and acidvalue change with reaction time. The rapid (results backto the user within a minute) and accurate (comparableto the primary method) results possible using NIRspectroscopy allow the process engineer to determinethe reaction endpoints more rapidly for the polyol batchprocess. This analysis will save the plant 3-4 hours ofsample residence time and decrease the energy neededto keep the reactor at temperature. Real-time NIRspectroscopy will also improve the reproducibility of thefinal product and decrease the risk of 《overcooking》 thepolyol sample. This paper has demonstrated the potential of NIRspectroscopy for monitoring the hydroxyl and acidnumberrininaabatch reactor process. Other NIRmeasurements of interest for polyol manufacturersinclude the analysis of mixed polyols (polyols made frompropylene and ethylene oxides), the methyl substitutionrating of a polymer backbone (by using a ratio of themethyl absorption due to propylene to that due to bothpropylene and ethylene), the determination of moisture(typically to less than 100 ppm), residual oxide, andprimaryyand secondary amine levels in substitutedpolyols. Conclusions Real-time process monitoring of polyol production ispossible with NIR spectroscopy. Analysis of hydroxyl andacid numberrreadilyyprovidesmoleculararweightinformation and reaction end point determination.Benefits of NIR process monitoring of polyols productioninclude increased production, lower production costs,and better product quality control.
确定
还剩2页未读,是否继续阅读?

产品配置单

瑞士万通中国有限公司为您提供《采用近红外技术监控艰苦环境下聚合物合成及成型过程》,该方案主要用于其他中--检测,参考标准--,《采用近红外技术监控艰苦环境下聚合物合成及成型过程》用到的仪器有瑞士万通DS2500 近红外光谱分析仪、瑞士万通PRO 近红外在线分析仪
推荐专场
相关方案
更多
该厂商其他方案
更多