


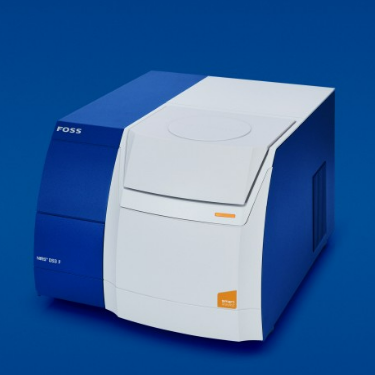
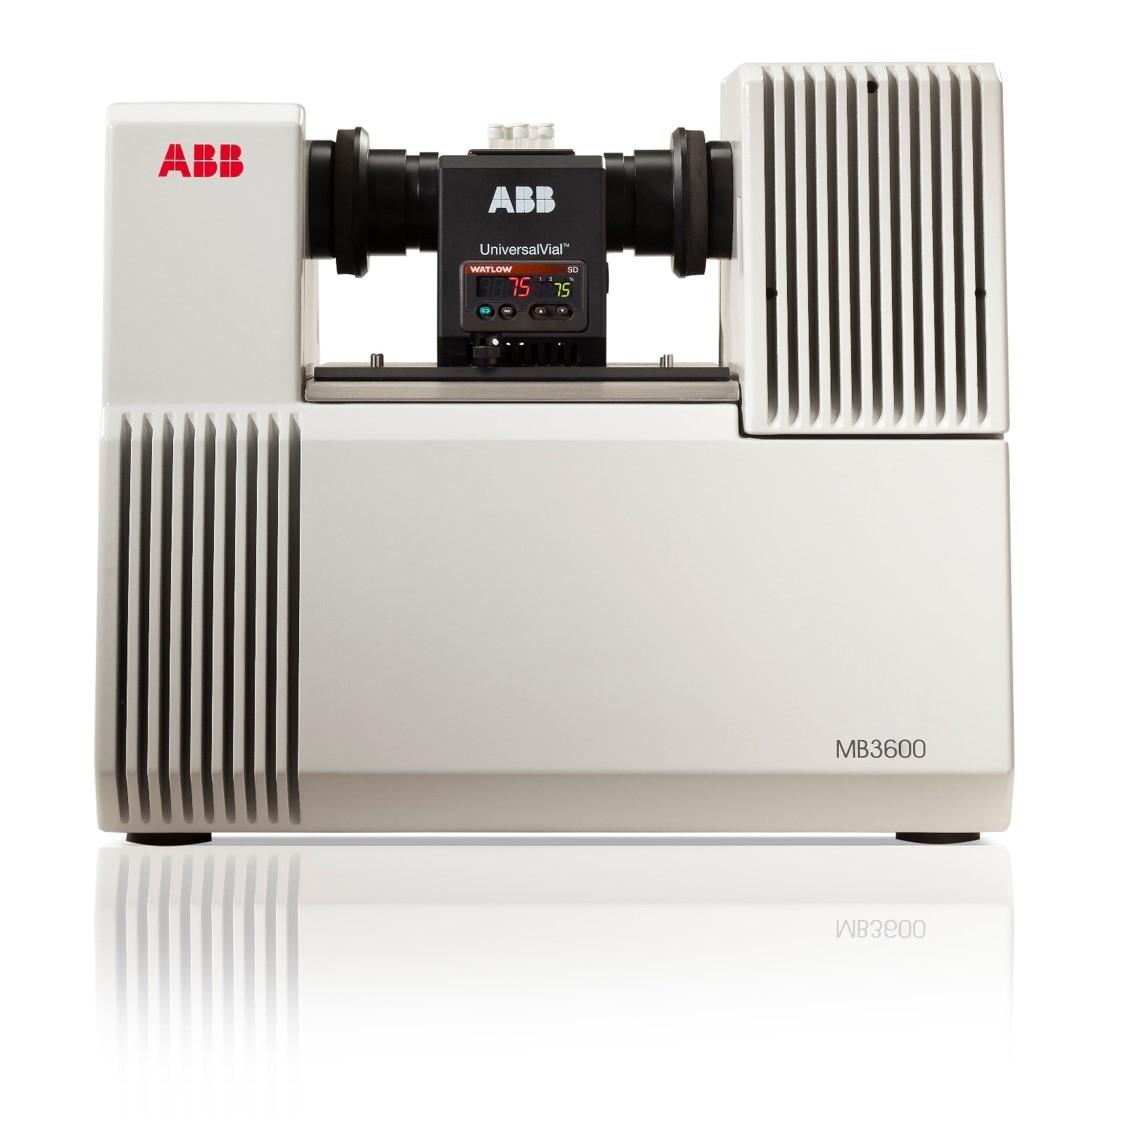
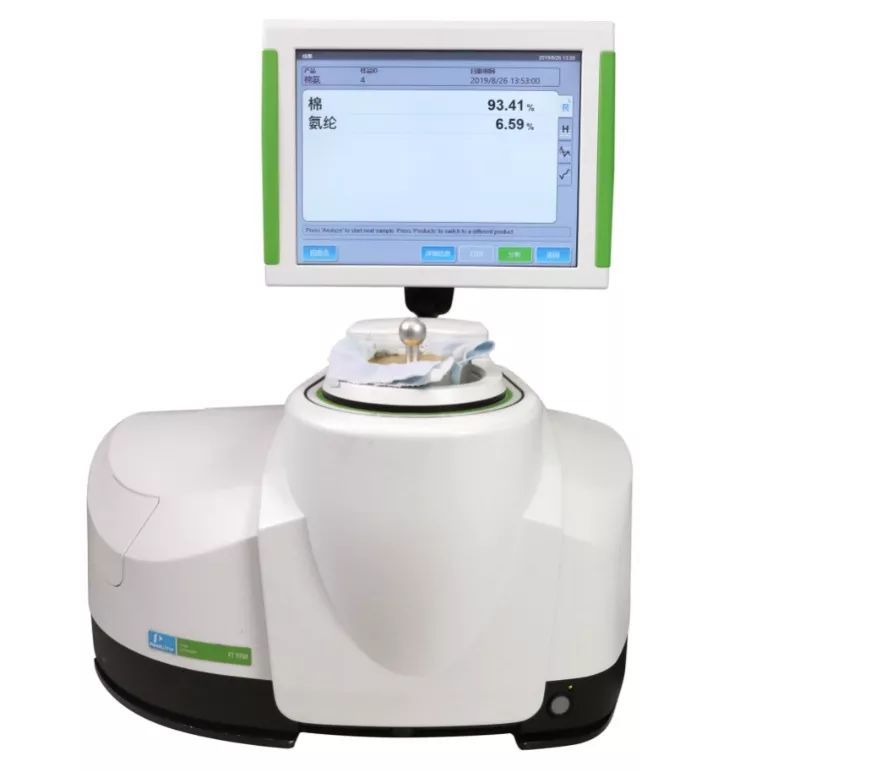
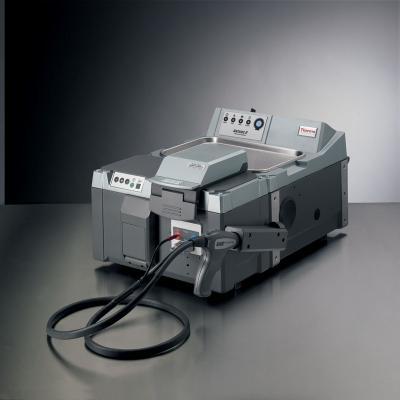
2013年,Metrohm收购Foss NIRSystems Inc.公司,以Metrohm-NIRSystems作为近红外产品品牌开始进军光谱领域,在工业领域开始与Foss公司进行全球战略合作。Metrohm-NIRSystems为客户提供实验室型、旁线以及在线近红外解决方案。 XDS系列近红外产品是新一代的光栅型扫描近红外分析仪,采用基于偏移技术数字全息光栅系统,其对应的NIIST可追溯的标准和方法保证了每台仪器的光度计,波长和带宽等重要技术参数的高度一致,保证了仪器之间定标模型无缝转移并且可实现网络控制操作。基于XDS近红外分析技术,Metrohm-NIRSystems开发了一系列新一代的过程分析仪,用于制药和化工领域的实时分析。样品无需破损、测试精确等优点都在加工过程、搅拌器、干燥器、反应器等不同阶段的检测中得到了体现。XDS近红外在线分析仪典型的应用案例包括炼油厂、石化企业、聚合过程、原料药的溶媒保护等的反应监测和终点判断,以及压缩聚合物薄膜或包衣的分析。
方案详情

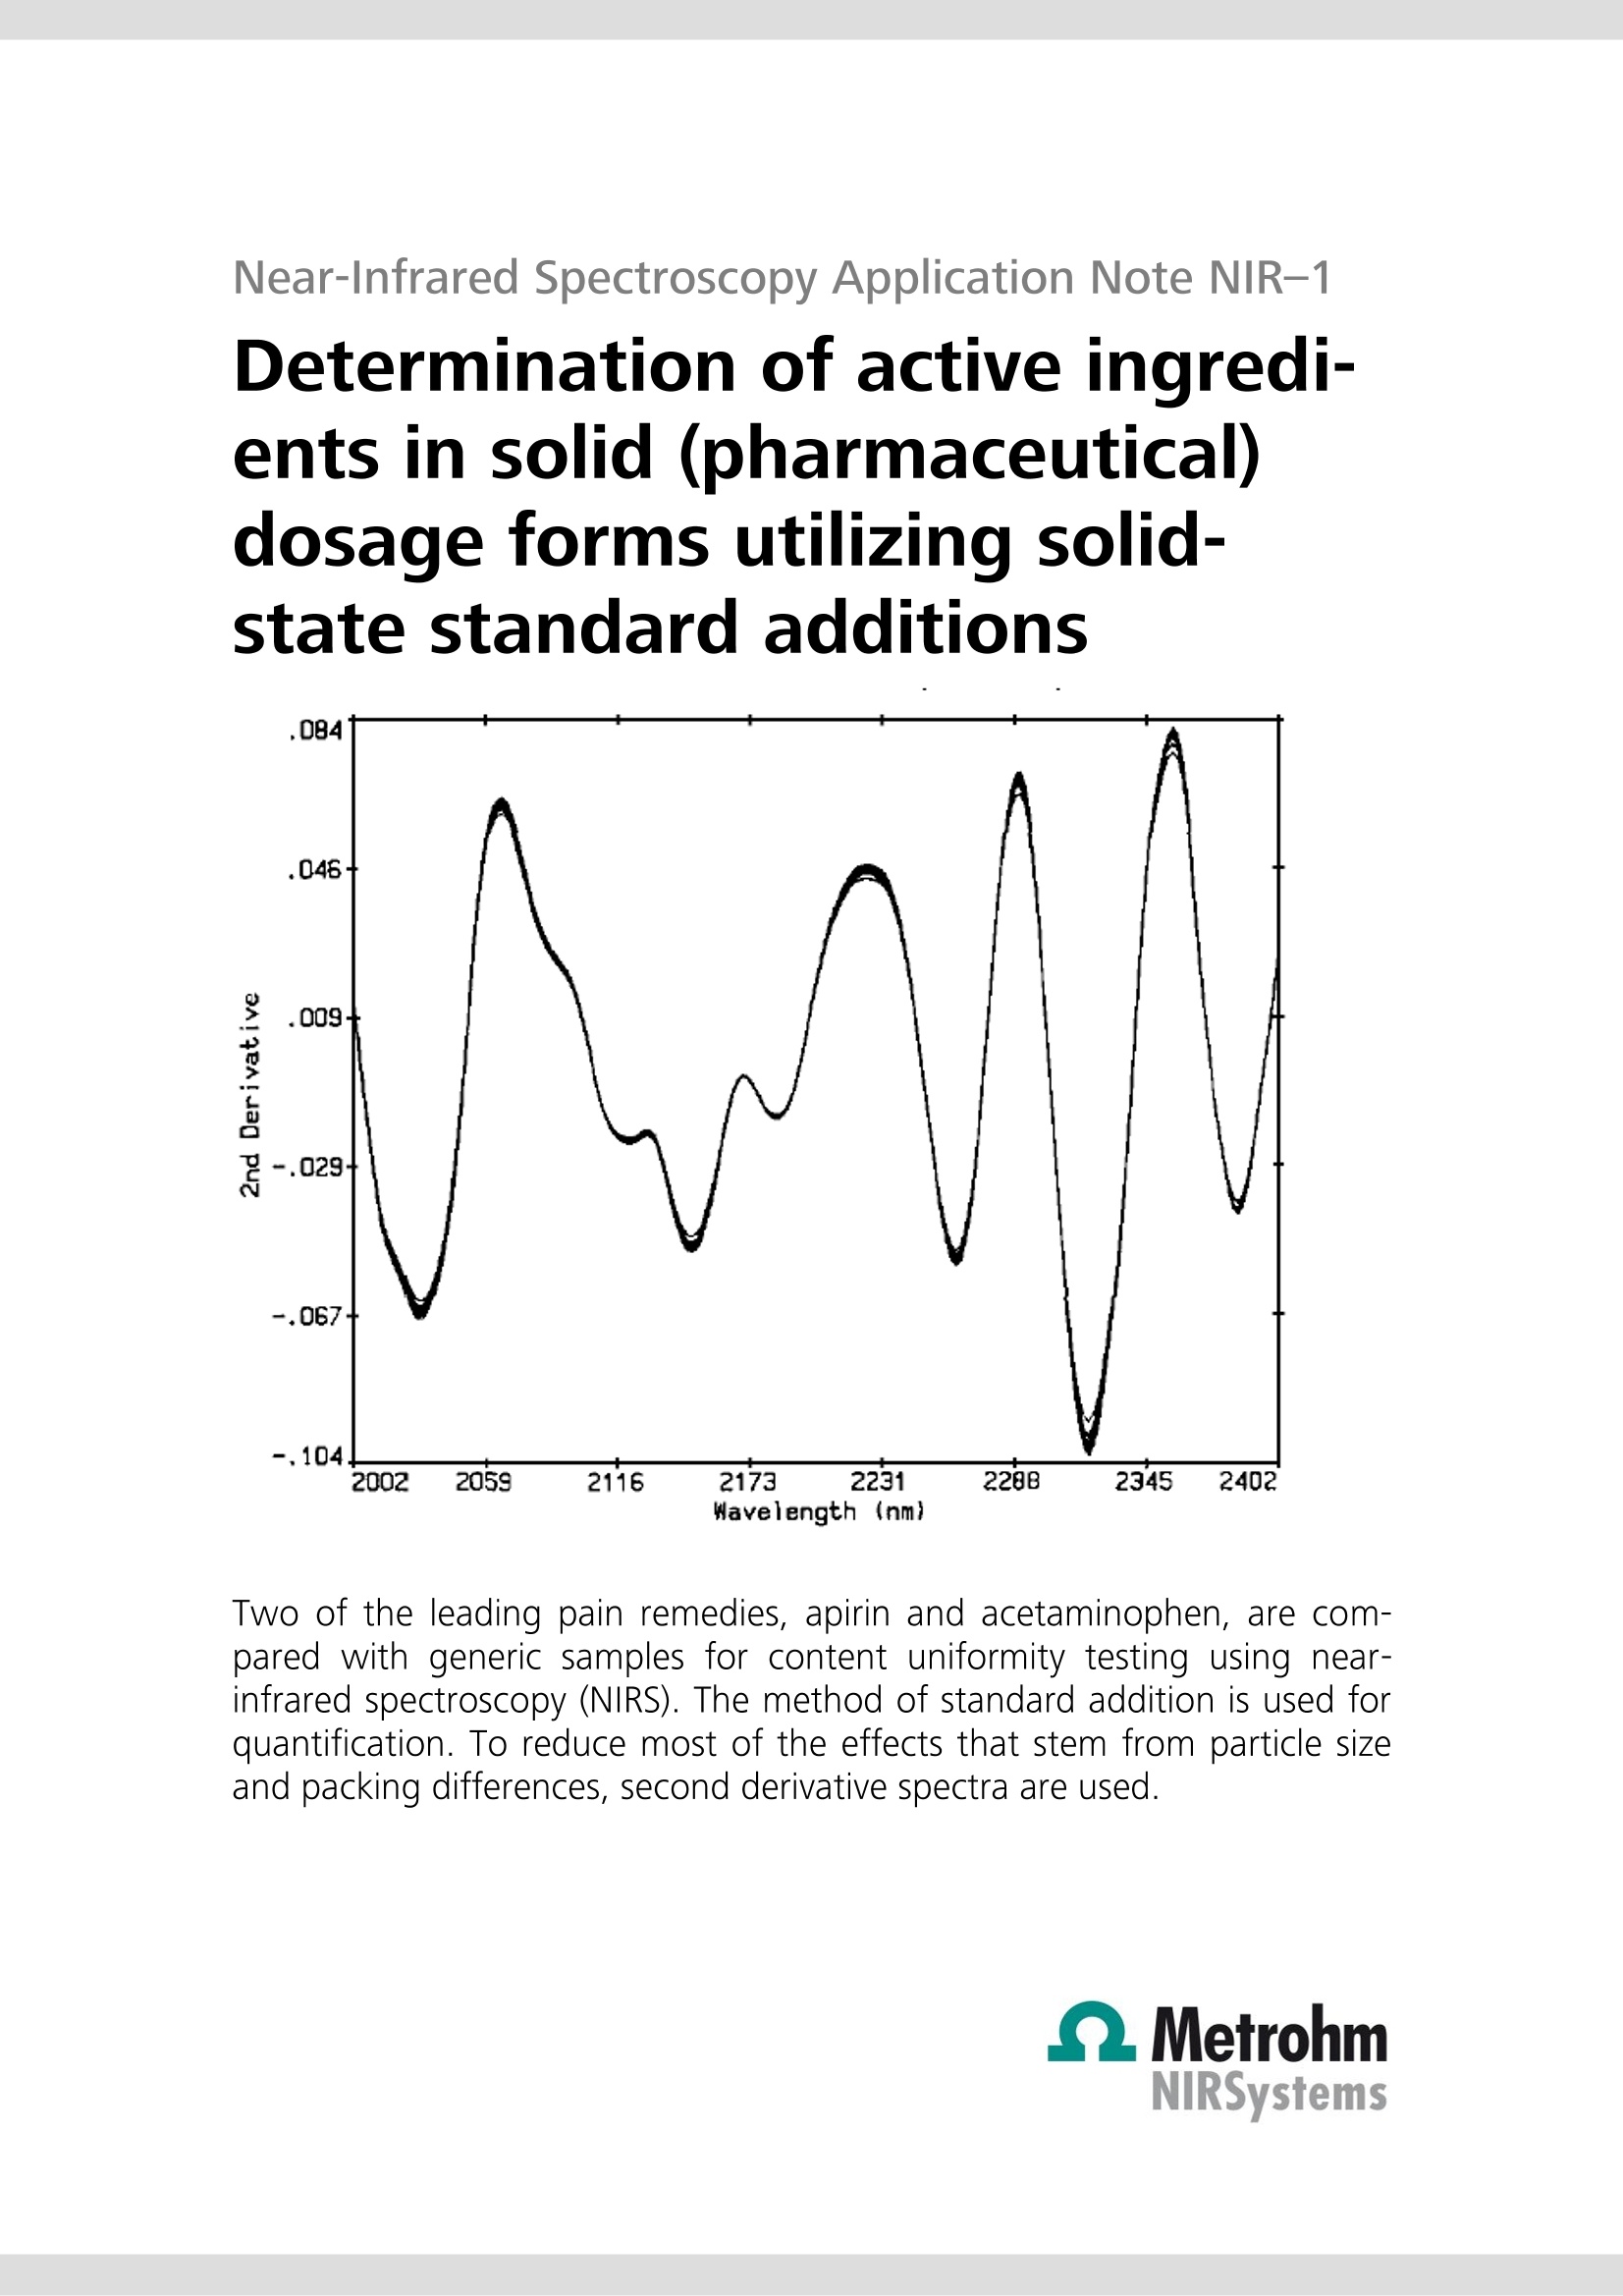
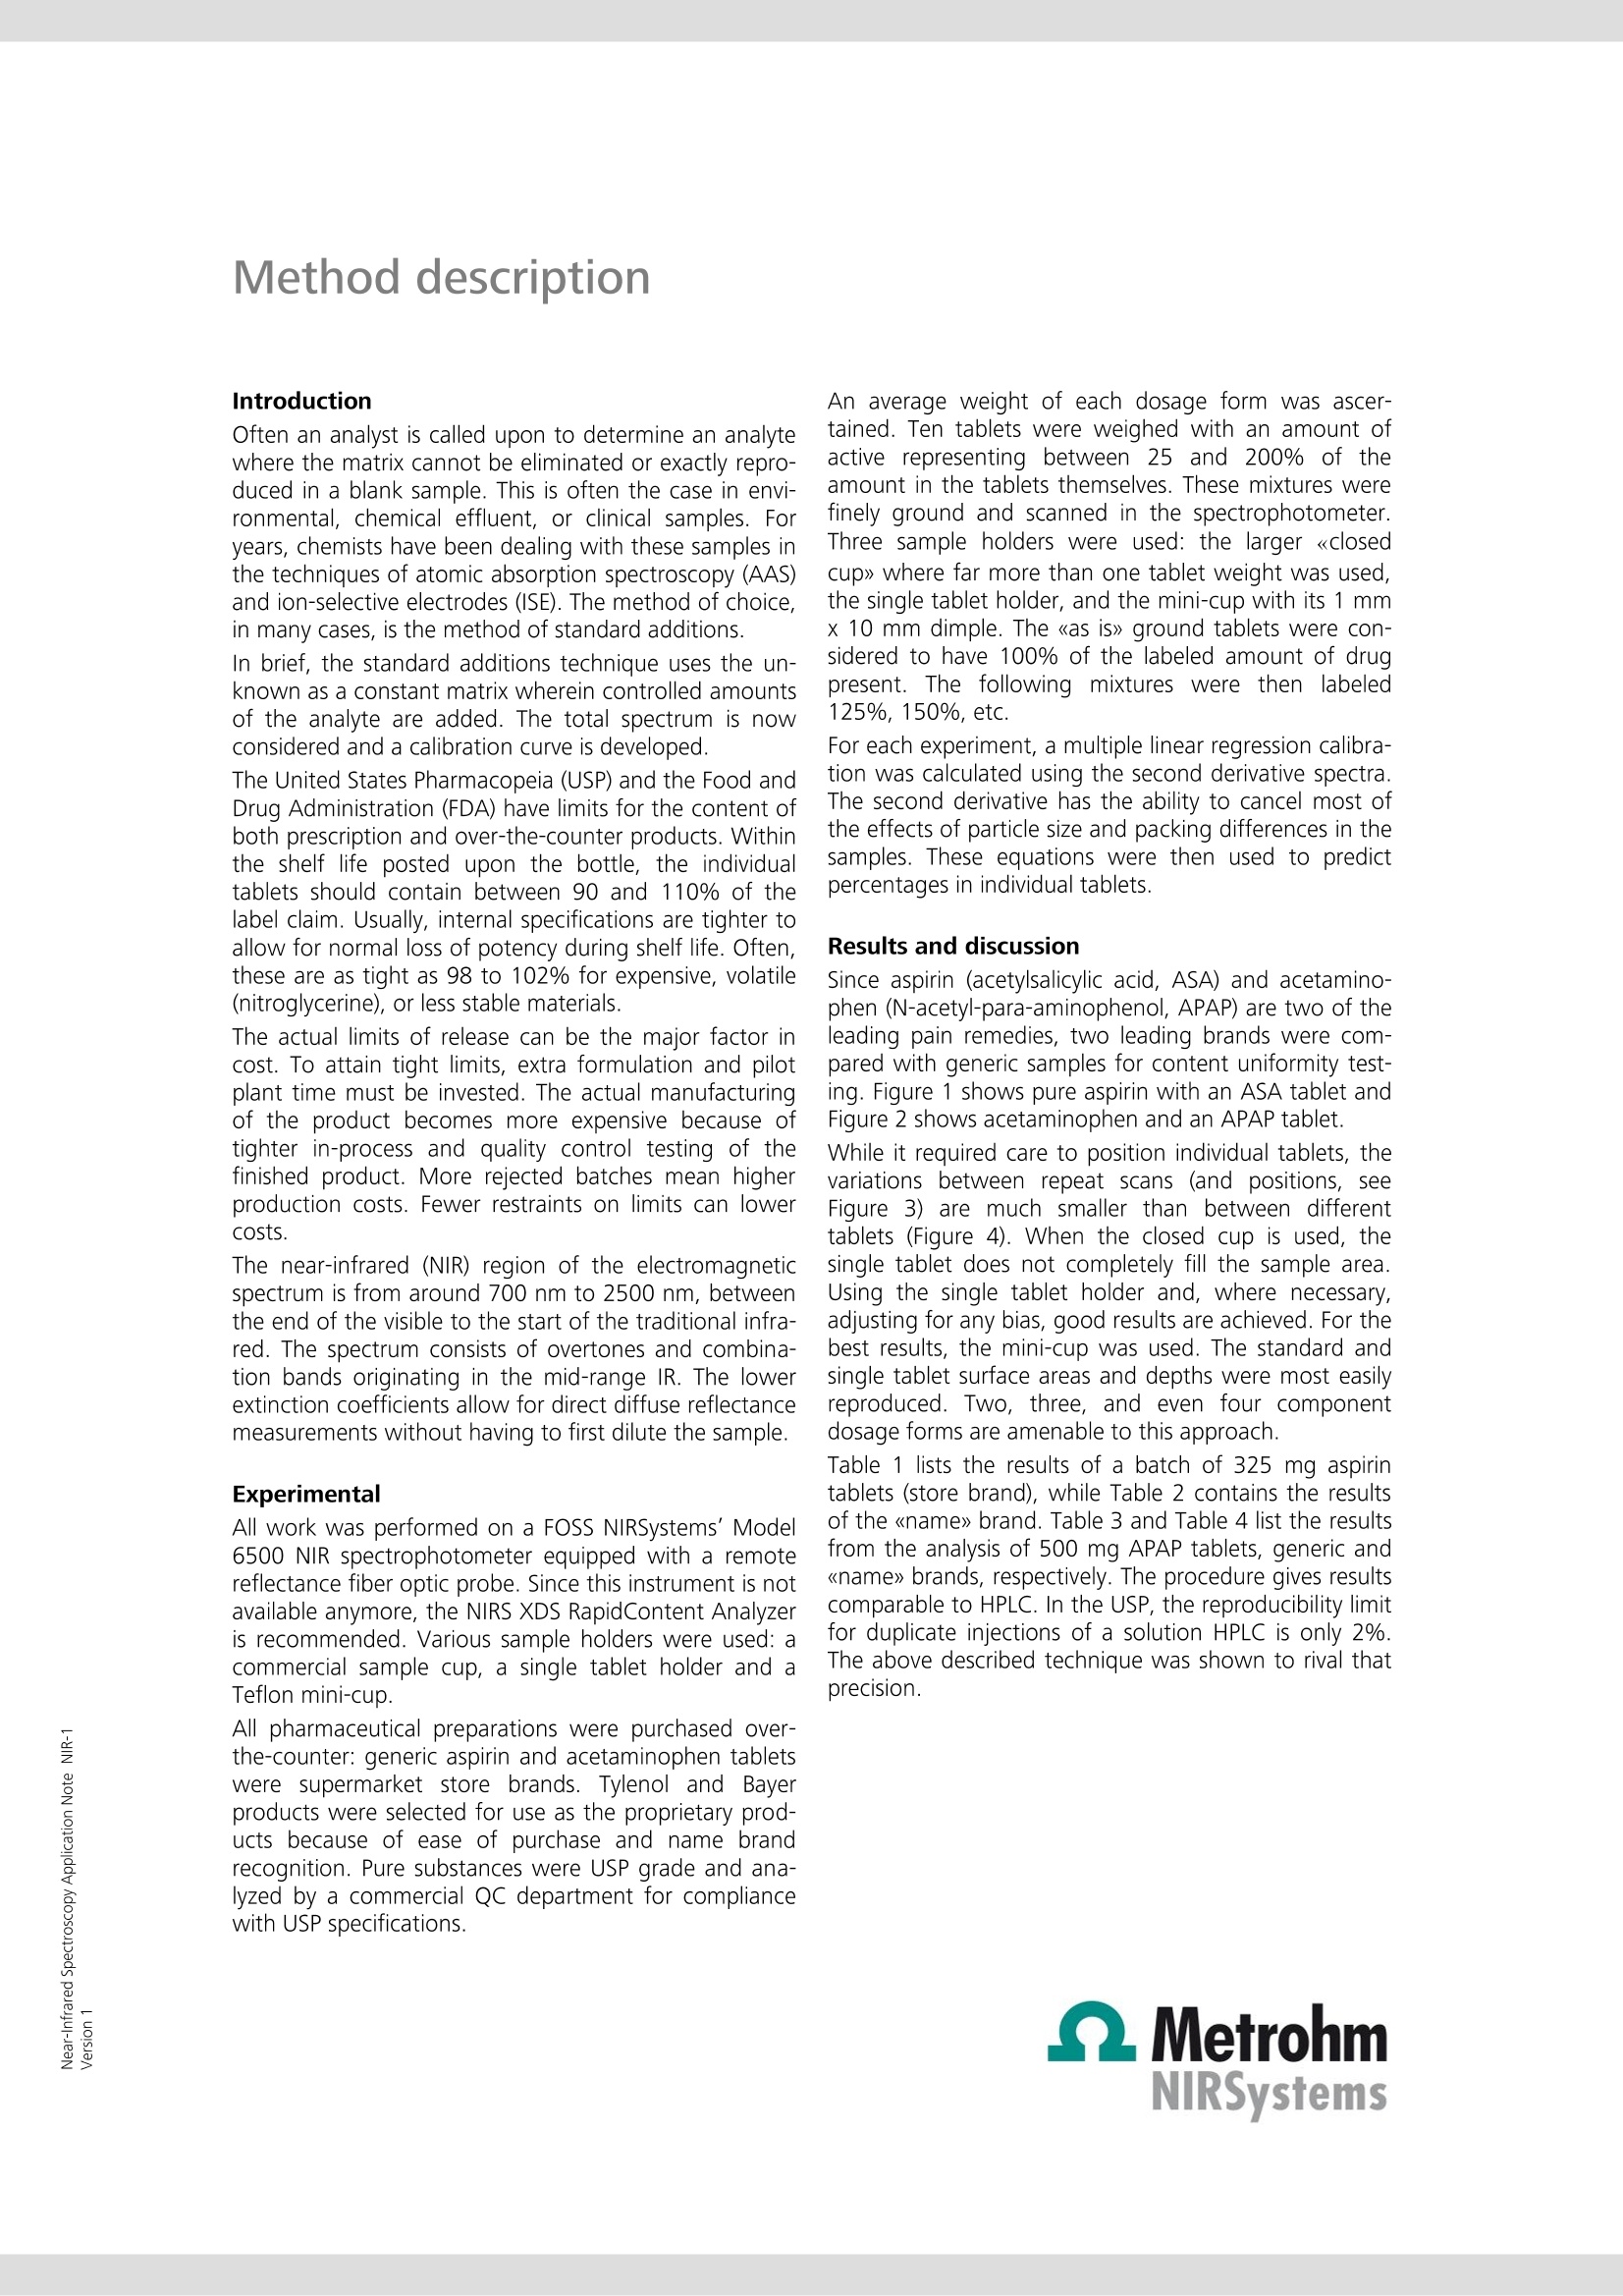
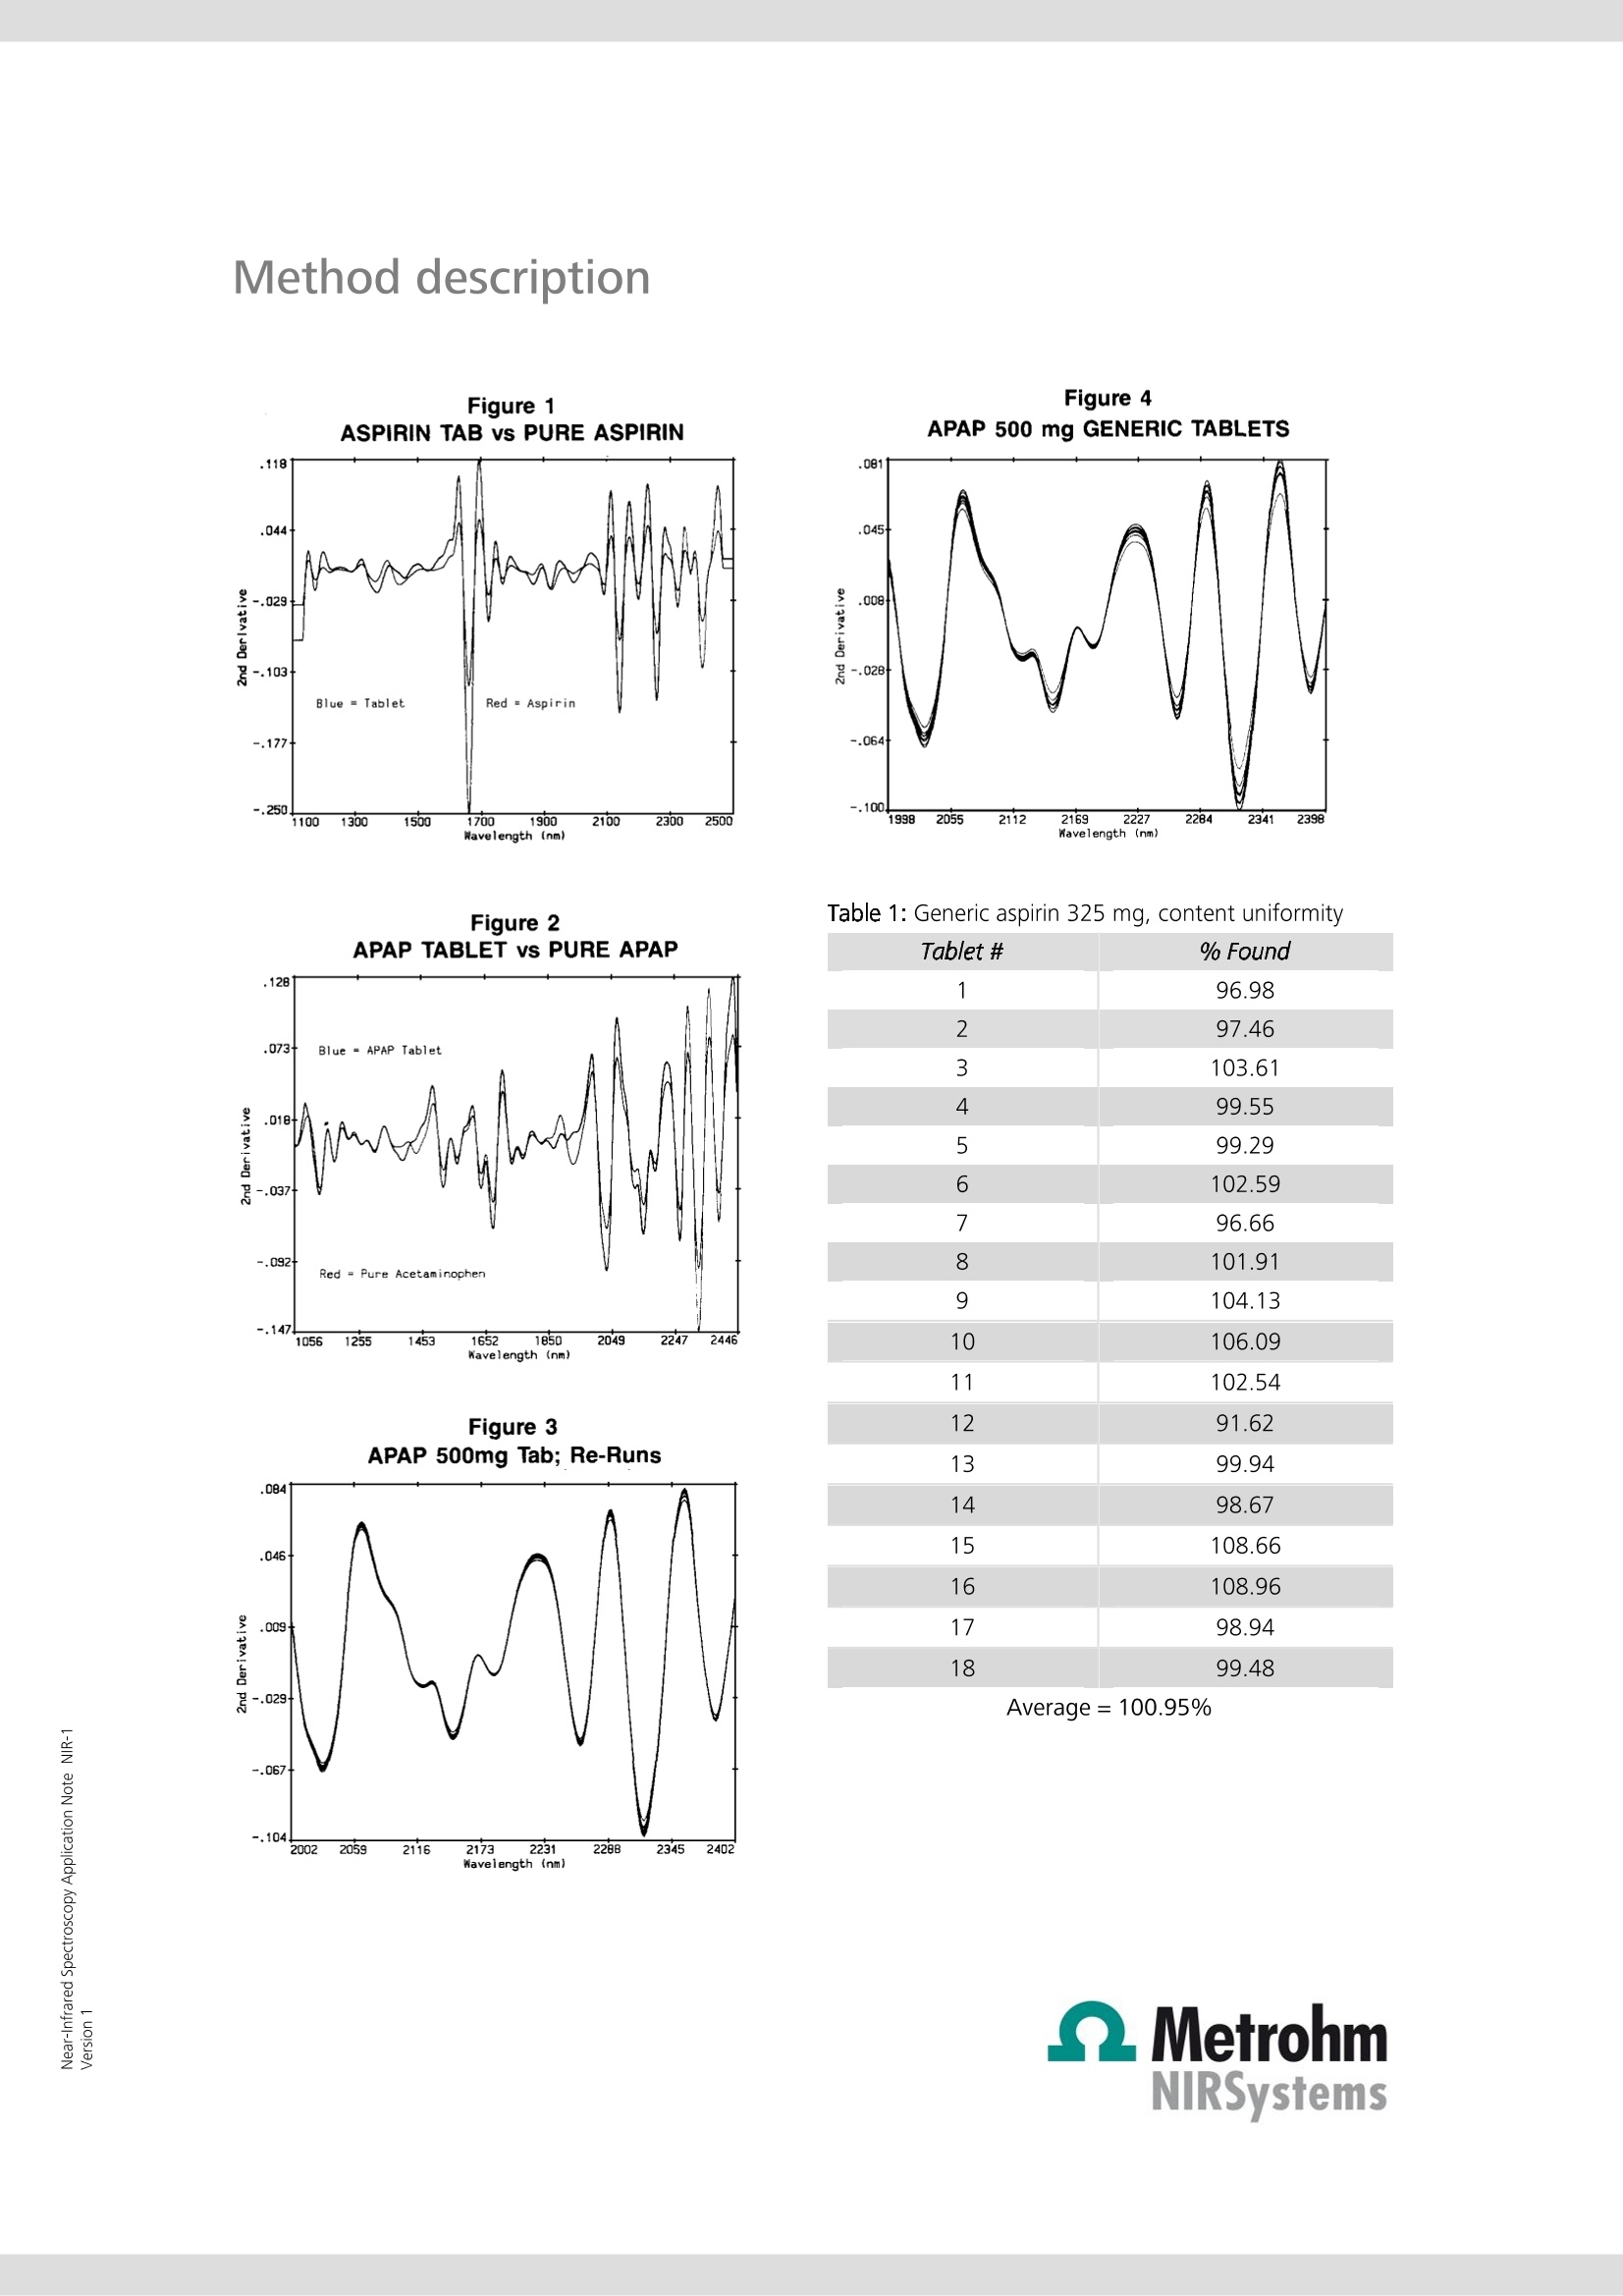
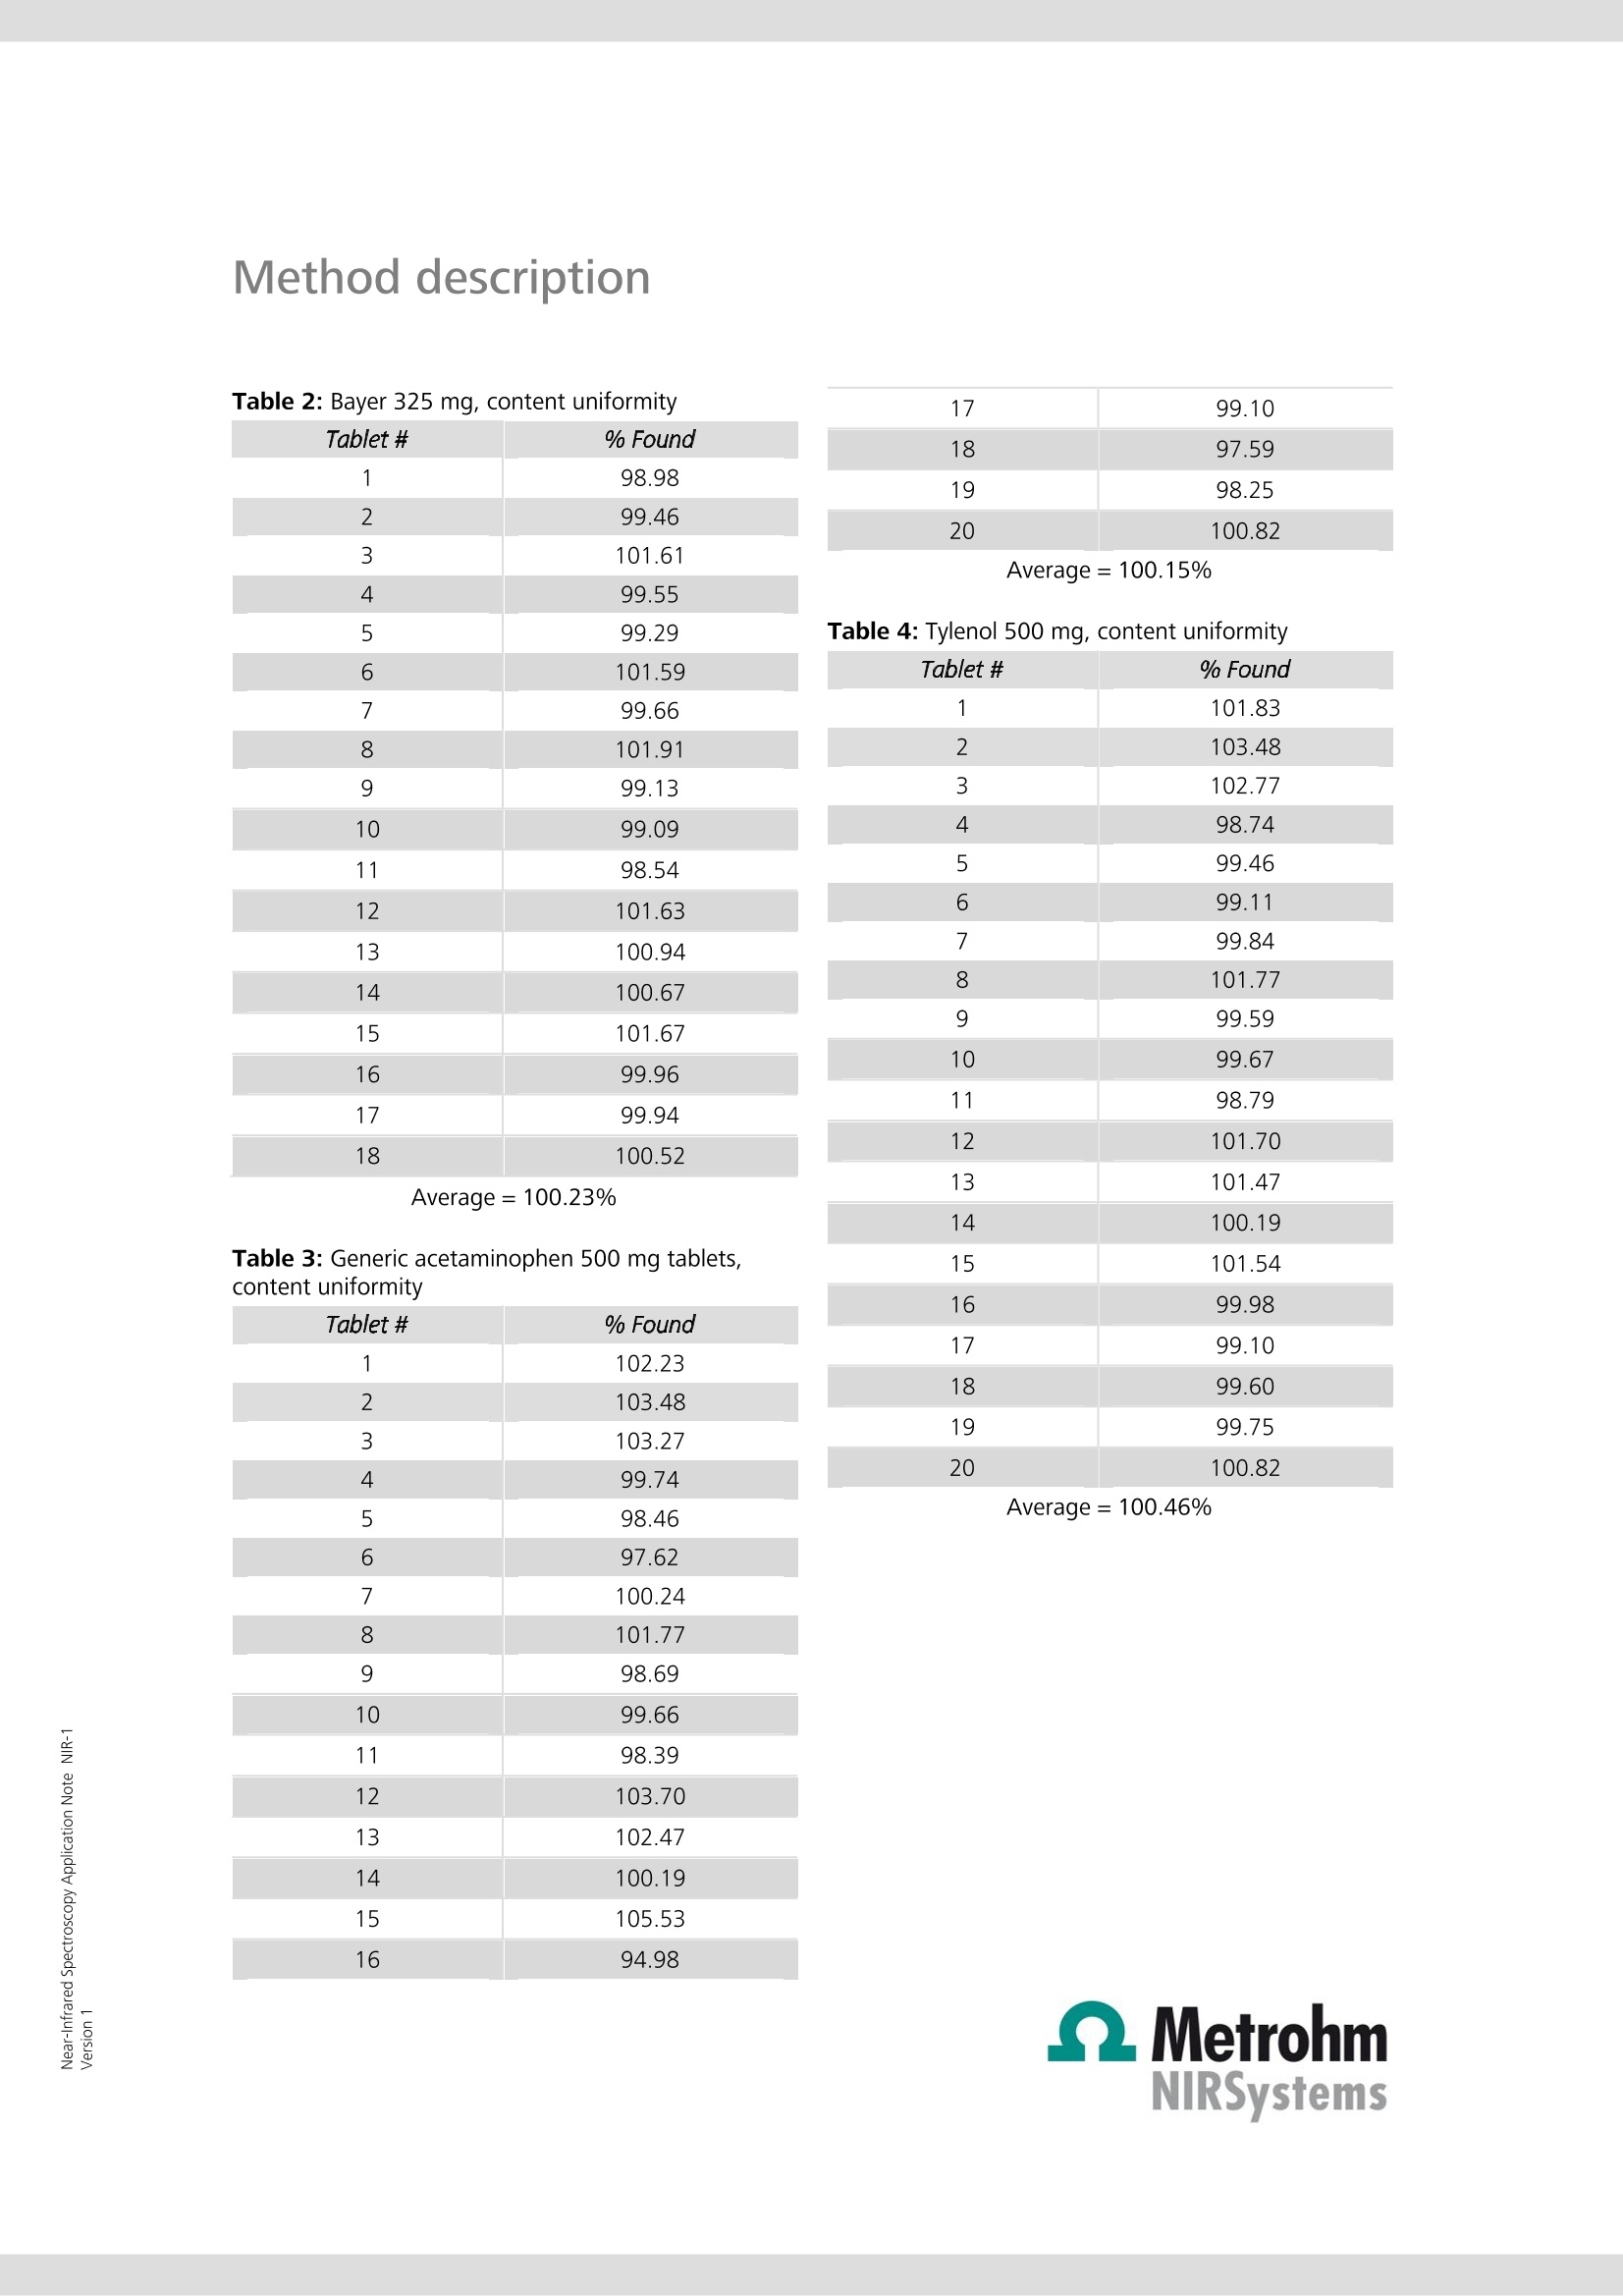
Near-Infrared Spectroscopy Application Note NIR-1 Determination of active ingredi-ents in solid (pharmaceutical)dosage forms utilizing solid-state standard additions Two of the leading pain remedies, apirin and acetaminophen, are com-pared with generic samples for content uniformity testing using near-infrared spectroscopy (NIRS). The method of standard addition is used forquantification. To reduce most of the effects that stem from particle sizeand packing differences, second derivative spectra are used. Introduction Often an analyst is called upon to determine an analytewhere the matrix cannot be eliminated or exactly repro-duced in a blank sample. This is often the case in envi-ronmental, chemical effluent, or clinical samples. Foryears, chemists have been dealing with these samples inthe techniques of atomic absorption spectroscopy (AAS)and ion-selective electrodes (ISE). The method of choice,in many cases, is the method of standard additions In brief, the standard additions technique uses the un-known as a constant matrix wherein controlled amountsof the analyte are added. The total spectrum is now.considered and a calibration curve is developed. The United States Pharmacopeia (USP) and the Food andDrug Administration (FDA) have limits for the content ofboth prescription and over-the-counter products. Withinthe shelf life posted upon the bottle, the individualtablets should contain between 90 and 110% of thelabel claim. Usually, internal specifications are tighter to.allow for normal loss of potency during shelf life. Often,these are as tight as 98 to 102% for expensive, volatile(nitroglycerine), or less stable materials. The actual limits of release can be the major factor incost. To attain tight limits, extra formulation and pilotplant time must be invested. The actual manufacturingof the product becomes more expensive because oftighter in-process and quality control testing of thefinished product. More rejected batches mean higherproduction costs. Fewer restraints on limits can lowercosts. The near-infrared (NIR) region of the electromagneticspectrum is from around 700 nm to 2500 nm, betweenthe end of the visible to the start of the traditional infra-red. The spectrum consists of overtones and combina-tion bands originating in the mid-range IR. The lowerextinction coefficients allow for direct diffuse reflectancemeasurements without having to first dilute the sample. Experimental All work was performed on a FOSS NIRSystems’ Model6500 NIR spectrophotometer equipped with a remotereflectance fiber optic probe. Since this instrument is notavailable anymore, the NIRS XDS RapidContent Analyzeris recommended. Various sample holders were used: acommercial sample cup, a single tablet holder and aTeflon mini-cup. All pharmaceutical preparations were purchased over-the-counter: generic aspirin and acetaminophen tabletswere supermarket store brands.Tylenol and Bayerproducts were selected for use as the proprietary prod-ucts because of ease of purchase and name brandrecognition. Pure substances were USP grade and ana-lyzed by a commercial QC department for compliancewith USP specifications. An average weight of each dosage form was ascer-tained. Ten tablets were weighed with an amount ofactive representing between 25 and 200% of theamount in the tablets themselves. These mixtures werefinely ground and scanned in the spectrophotometer.Three sample holders were used: the larger 《closedcup》where far more than one tablet weight was used,the single tablet holder, and the mini-cup with its 1 mmx 10 mm dimple. The 《as is》 ground tablets were con-sidered to have 100% of the labeled amount of drugpresent. The following mixtures were then labeled125%, 150%, etc. For each experiment, a multiple linear regression calibra-tion was calculated using the second derivative spectra.The second derivative has the ability to cancel most ofthe effects of particle size and packing differences in thesamples. These equations were then used to predictpercentages in individual tablets. Results and discussion Since aspirin (acetylsalicylic acid, ASA) and acetamino-phen (N-acetyl-para-aminophenol, APAP) are two of theleading pain remedies, two leading brands were com-pared with generic samples for content uniformity test-ing. Figure 1 shows pure aspirin with an ASA tablet andFigure 2 shows acetaminophen and an APAP tablet. While it required care to position individual tablets, thevariations between repeat scans (and positions, seeFigure 3) are much smaller than between differenttablets (Figure 4). When the closed cup is used, thesingle tablet does not completely fill the sample area.Using the single tablet holder and, where necessary,adjusting for any bias, good results are achieved. For thebest results, the mini-cup was used. The standard andsingle tablet surface areas and depths were most easilyreproduced. Two, three, and even four componentdosage forms are amenable to this approach. Table 1 lists the results of a batch of 325 mg aspirintablets (store brand), while Table 2 contains the resultsof the 《name》 brand. Table 3 and Table 4 list the resultsfrom the analysis of 500 mg APAP tablets, generic and《name》brands, respectively. The procedure gives resultscomparable to HPLC. In the USP, the reproducibility limitfor duplicate injections of a solution HPLC is only 2%The above described technique was shown to rival thatprecision. Method description Figure 1 Figure 4APAP 500 mg GENERIC TABLETS Table 1: Generic aspirin 325 mg, content uniformity Figure 2 Figure 3APAP 500mg Tab; Re-Runs Tablet # % Found 1 96.98 2 97.46 3 103.61 4 99.55 5 99.29 6 102.59 7 96.66 8 101.91 9 104.13 10 106.09 11 102.54 12 91.62 13 99.94 14 98.67 15 108.66 16 108.96 17 98.94 18 99.48 Average= 100.95% Method description Table 2: Bayer 325 mg, content uniformity Tablet # % Found 1 98.98 2 99.46 3 101.61 4 99.55 5 99.29 6 101.59 7 99.66 8 101.91 9 99.13 10 99.09 11 98.54 12 101.63 13 100.94 14 100.67 15 101.67 16 99.96 17 99.94 18 100.52 17 99.10 18 97.59 19 98.25 20 100.82 Average=100.15% Table 4: Tylenol 500 mg, content uniformity Average=100.23% Table 3: Generic acetaminophen 500 mg tablets,content uniformity Tablet # % Found 1 101.83 2 103.48 3 102.77 4 98.74 5 99.46 6 99.11 7 99.84 8 101.77 9 99.59 10 99.67 11 98.79 12 101.70 13 101.47 14 100.19 15 101.54 16 99.98 17 99.10 18 99.60 19 99.75 20 100.82 Tablet # % Found 1 102.23 2 103.48 3 103.27 4 99.74 5 98.46 6 97.62 7 100.24 8 101.77 9 98.69 10 99.66 11 98.39 12 103.70 13 102.47 14 100.19 15 105.53 16 94.98
确定
还剩2页未读,是否继续阅读?

产品配置单
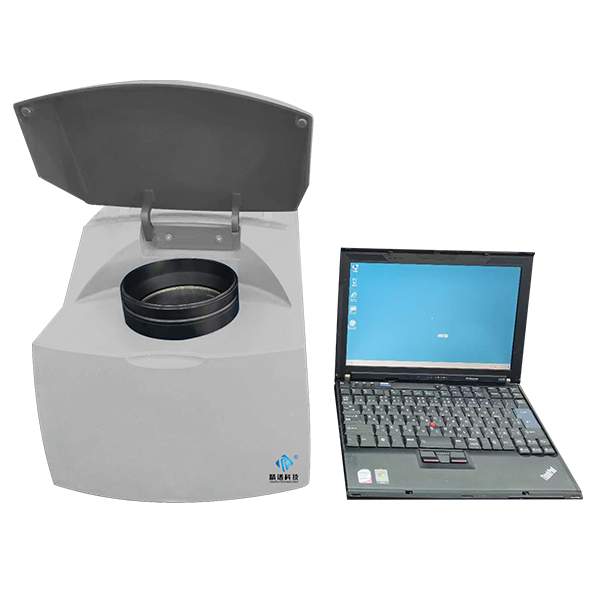
瑞士万通中国有限公司为您提供《采用近红外技术测定固体制剂中活性成分含量》,该方案主要用于其他中--检测,参考标准--,《采用近红外技术测定固体制剂中活性成分含量》用到的仪器有瑞士万通DS2500 近红外光谱分析仪、瑞士万通PRO 近红外在线分析仪
推荐专场
相关方案
更多
该厂商其他方案
更多