


方案详情
文
在合成高分子领域中,为了获得理想的材料性能,经常需要将不同的单体聚合,得到共聚物材料。研究证明共聚物分子量,以及分子结构对材料的机械性能、电学性能和热力学性能都有极大的影响。凝胶渗透色谱(GPC)作为一个基本的分子量测定方法,可以用来测定单一组分聚合物的分子量和分子量分布。但是通常情况下,无法用来分析和测定共聚物的分子量。
本文介绍了利用最新型的EcoSEC仪器,简便、快速分析共聚物的方法。
方案详情

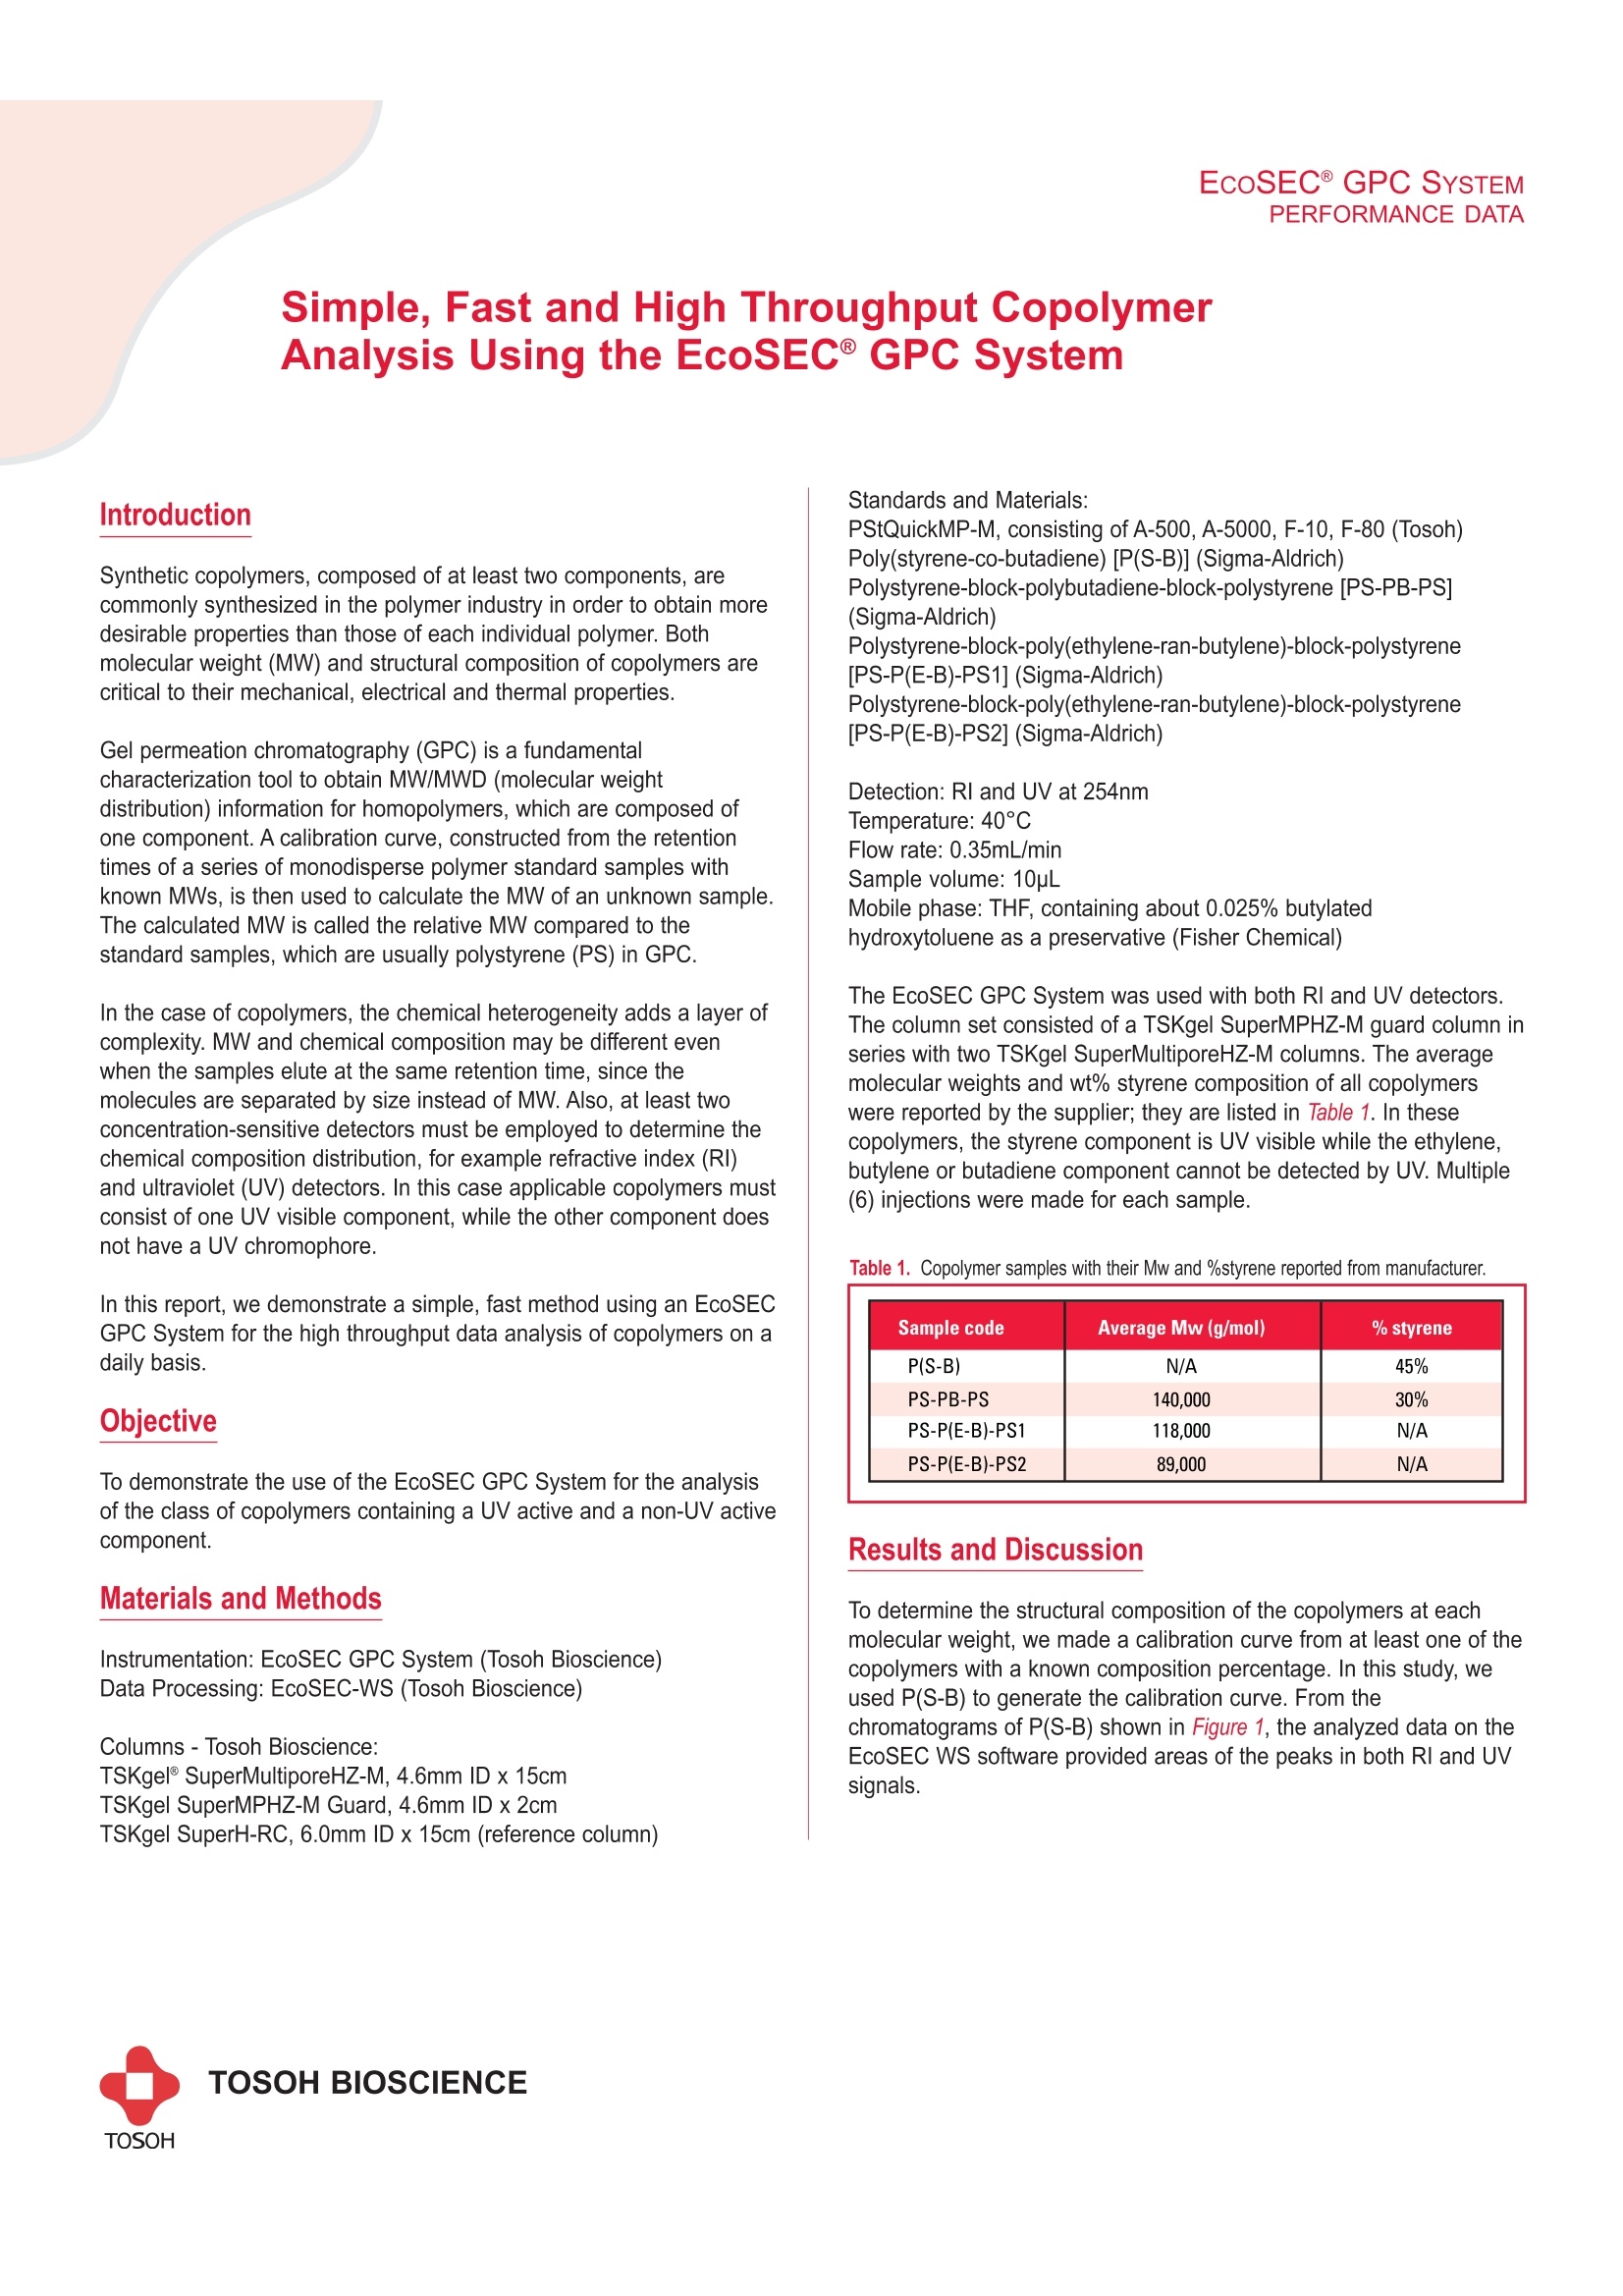
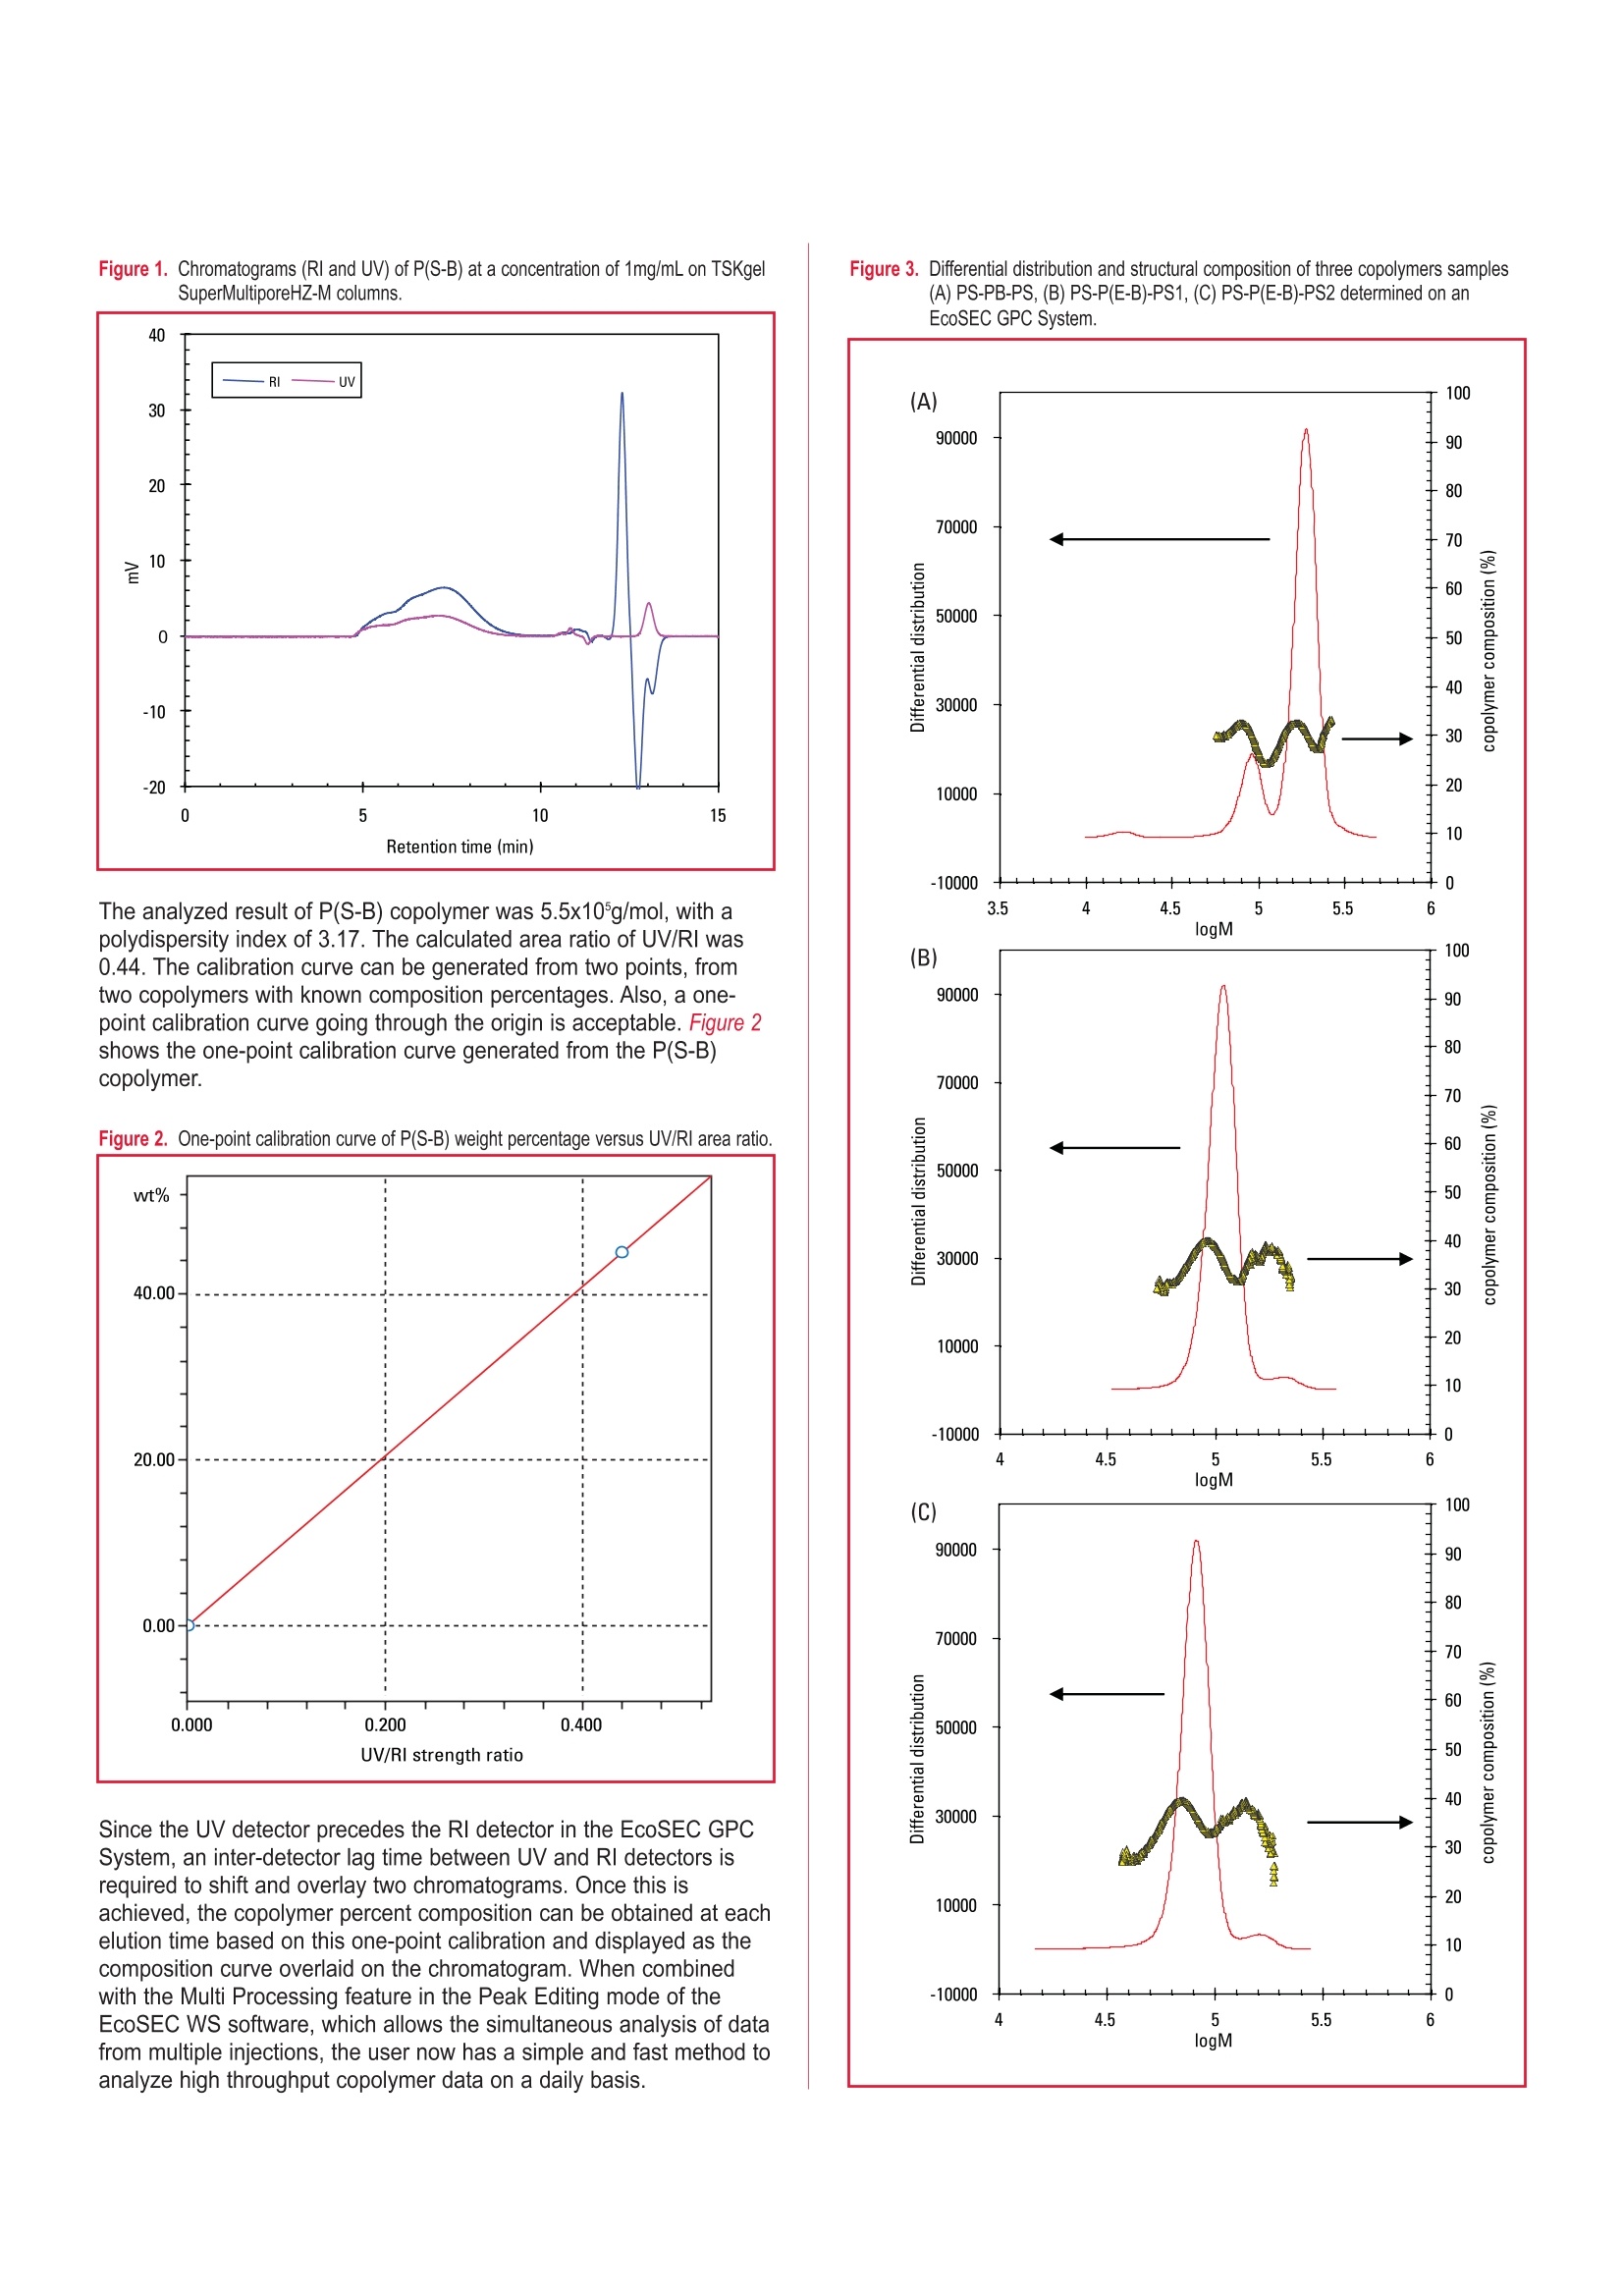
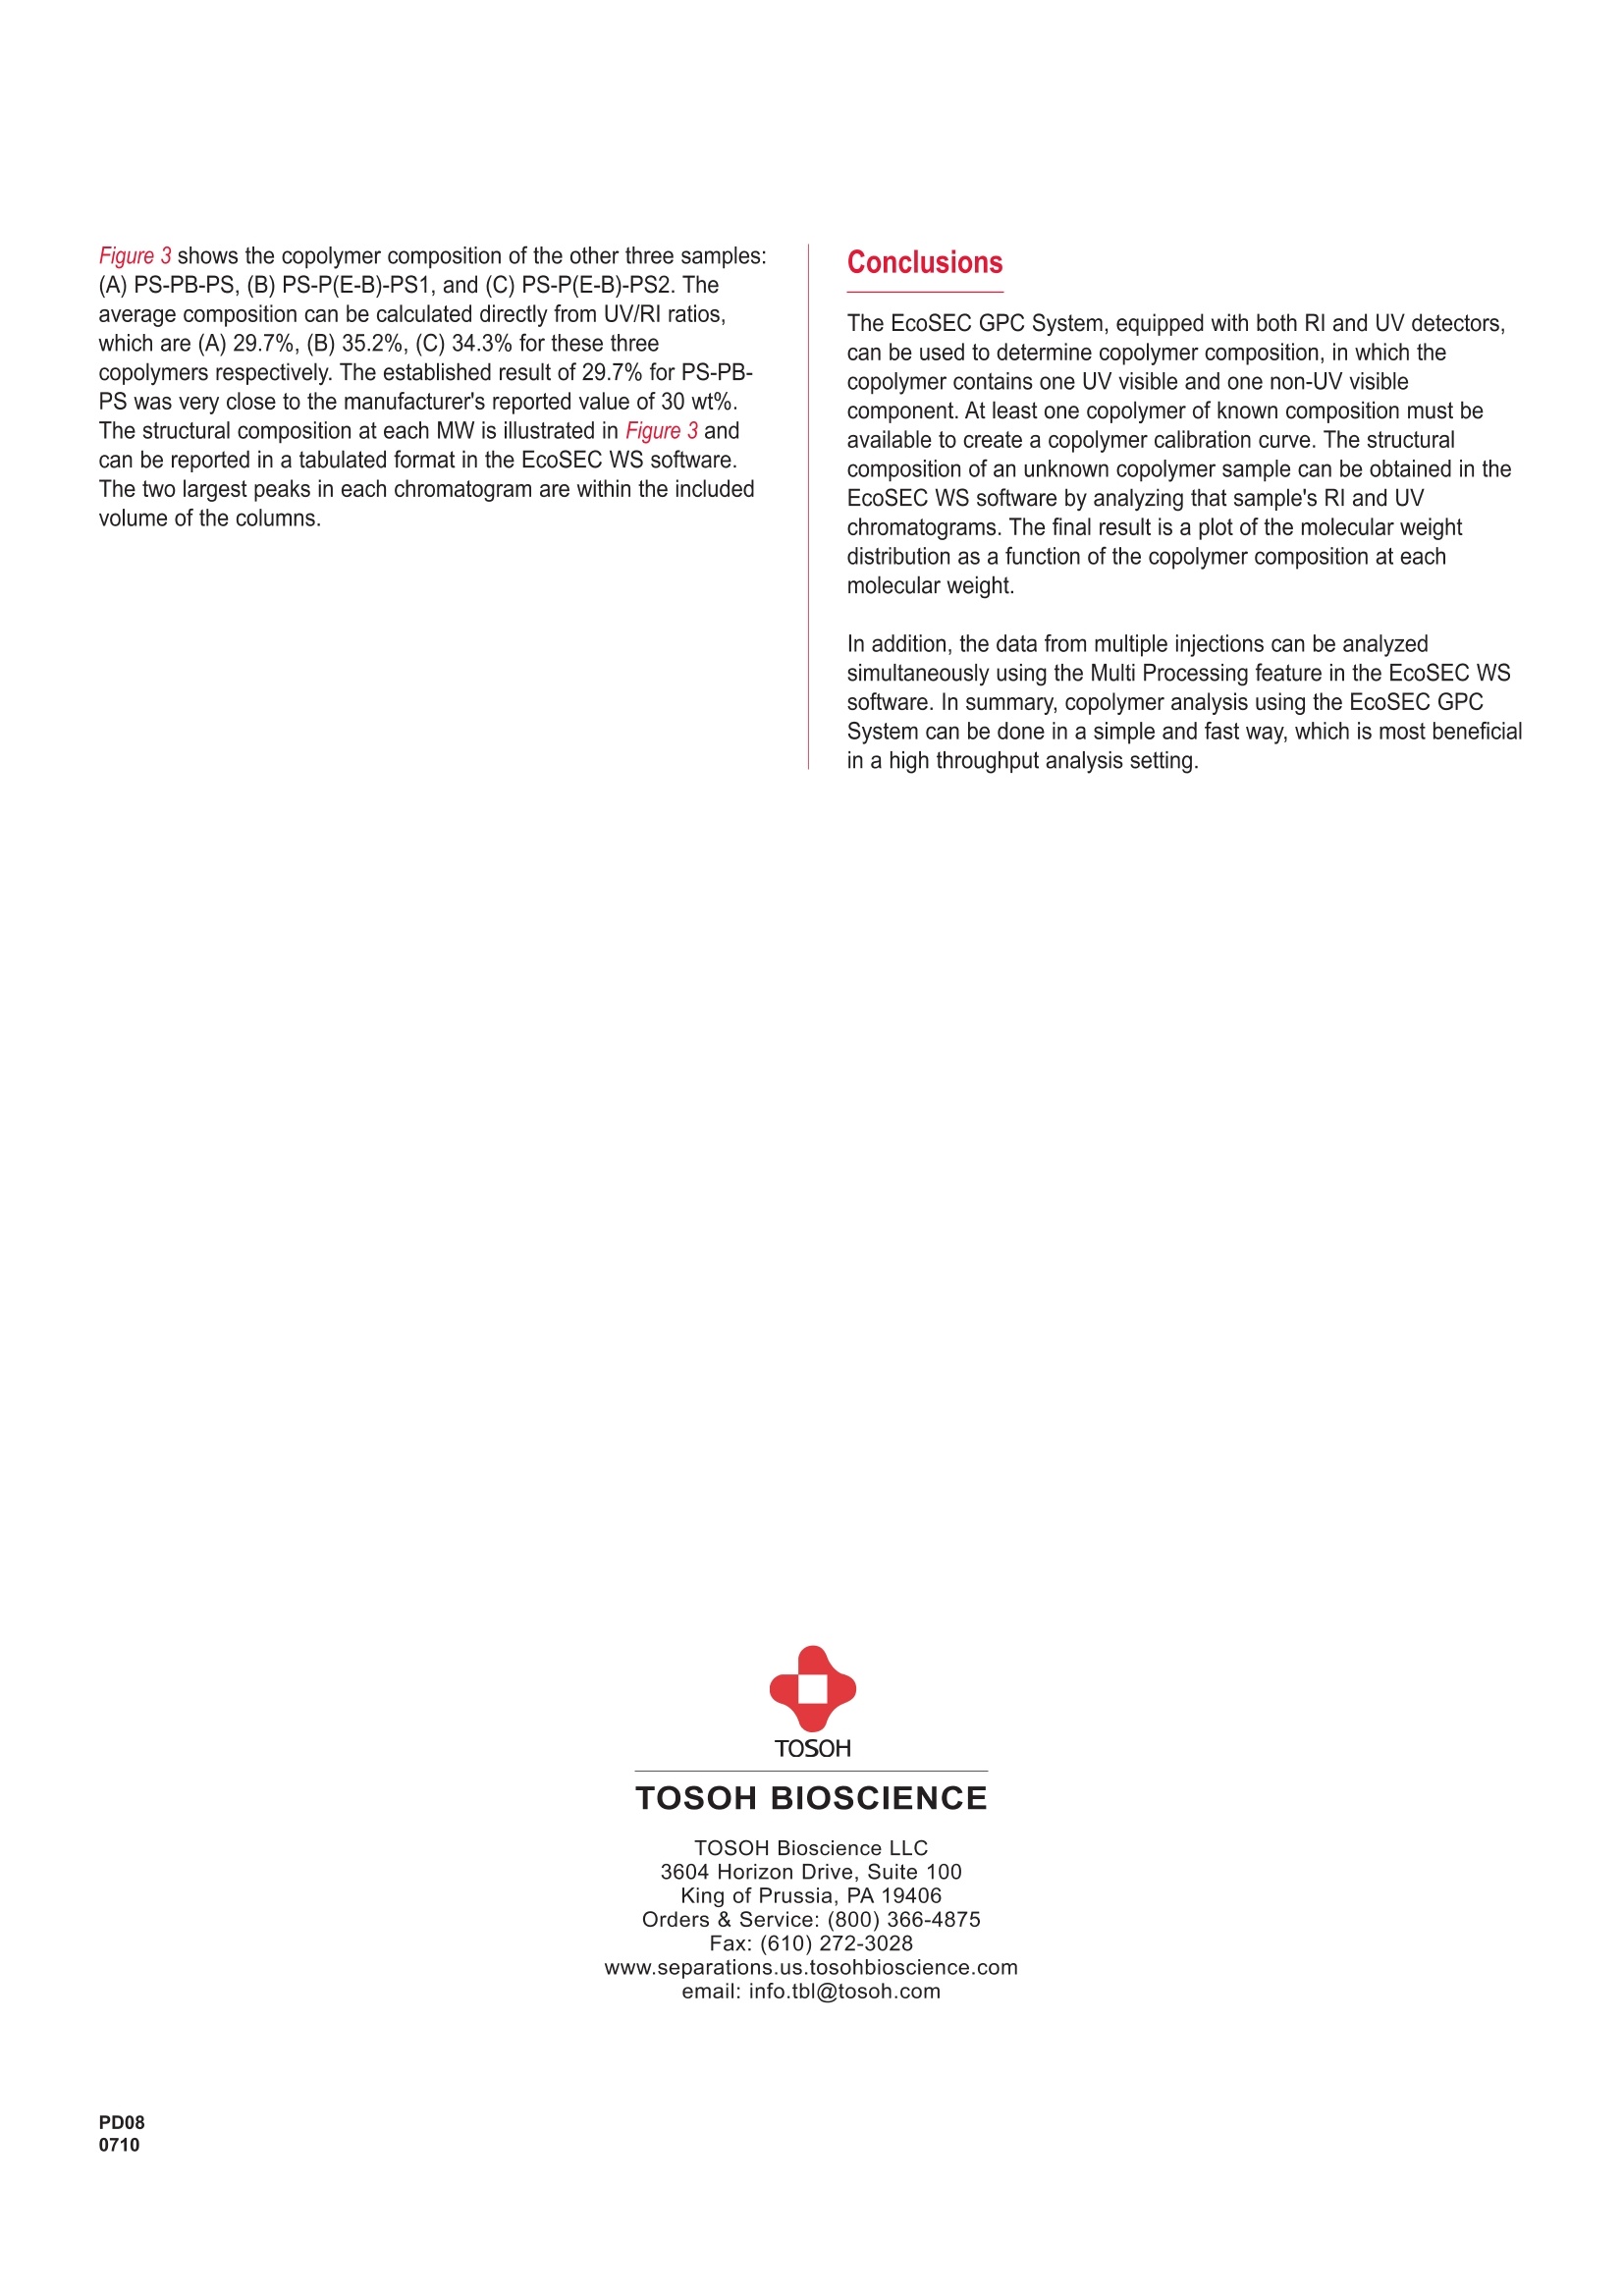
EcoSEC GPC SYSTEMPERFORMANCE DATA Simple, Fast and High Throughput CopolymerAnalysis Using the EcoSEC@ GPC System Introduction Synthetic copolymers, composed of at least two components, arecommonly synthesized in the polymer industry in order to obtain moredesirable properties than those of each individual polymer. Bothmolecular weight (MW) and structural composition of copolymers arecritical to their mechanical, electrical and thermal properties. Gel permeation chromatography (GPC) is a fundamentalcharacterization tool to obtain MW/MWD (molecular weightdistribution) information for homopolymers, which are composed ofone component. A calibration curve, constructed from the retentiontimes of a series of monodisperse polymer standard samples withknown MWs, is then used to calculate the MW of an unknown sample.The calculated MW is called the relative MW compared to thestandard samples, which are usually polystyrene (PS) in GPC. In the case of copolymers, the chemical heterogeneity adds a layer ofcomplexity. MW and chemical composition may be different evenwhen the samples elute at the same retention time, since themolecules are separated by size instead of MW. Also, at least twoconcentration-sensitive detectors must be employed to determine thechemical composition distribution, for example refractive index (Rl)and ultraviolet (UV) detectors. In this case applicable copolymers mustconsist of one UV visible component, while the other component doesnot have a UV chromophore. In this report, we demonstrate a simple, fast method using an EcoSECGPC System for the high throughput data analysis of copolymers on adaily basis. Objective To demonstrate the use of the EcoSEC GPC System for the analysisof the class of copolymers containing a UV active and a non-UV activecomponent. Materials and Methods Instrumentation: EcoSEC GPC System (Tosoh Bioscience)Data Processing: EcoSEC-WS (Tosoh Bioscience) Columns -Tosoh Bioscience: TSKgel SuperMultiporeHZ-M, 4.6mm ID x 15cm TSKgel SuperMPHZ-M Guard, 4.6mm IDx 2cm TSKgel SuperH-RC, 6.0mm ID x 15cm (reference column) Standards and Materials: PStQuickMP-M, consisting of A-500, A-5000, F-10, F-80 (Tosoh)Poly(styrene-co-butadiene) [P(S-B)] (Sigma-Aldrich) Polystyrene-block-polybutadiene-block-polystyrene [PS-PB-PS](Sigma-Aldrich) Polystyrene-block-poly(ethylene-ran-butylene)-block-polystyrene[PS-P(E-B)-PS1] (Sigma-Aldrich) Polystyrene-block-poly(ethylene-ran-butylene)-block-polystyrene [PS-P(E-B)-PS2] (Sigma-Aldrich) Detection: Rl and UV at 254nm Temperature: 40°C Flow rate: 0.35mL/minSample volume: 10pLMobile phase: THF, containing about 0.025% butylated hydroxytoluene as a preservative (Fisher Chemical) The EcoSEC GPC System was used with both Rl and UV detectors.The column set consisted of a TSKgel SuperMPHZ-M guard column inseries with two TSkgel SuperMultiporeHZ-M columns. The averagemolecular weights and wt% styrene composition of all copolymerswere reported by the supplier; they are listed in Table 1. In thesecopolymers, the styrene component is UV visible while the ethylene,butylene or butadiene component cannot be detected by UV. Multiple(6) injections were made for each sample. Table 1. Copolymer samples with their Mw and %styrene reported from manufacturer. Average Mw (g/mol) %styrene Sample code P(S-B) N/A 45% PS-PB-PS 140,000 30% PS-P(E-B)-PS1 118,000 N/A PS-P(E-B)-PS2 89,000 N/A Results and Discussion To determine the structural composition of the copolymers at eachmolecular weight, we made a calibration curve from at least one of thecopolymers with a known composition percentage. In this study, weused P(S-B) to generate the calibration curve. From thechromatograms of P(S-B) shown in Figure 1, the analyzed data on theEcoSEC WS software provided areas of the peaks in both Rl and UVsignals. Figure 1. Chromatograms (Rl and UV) of P(S-B) at a concentration of 1mg/mL on TSKgelSuperMultiporeHZ-M columns. The analyzed result of P(S-B) copolymer was 5.5x10g/mol, with apolydispersity index of 3.17. The calculated area ratio of UV/RI was0.44. The calibration curve can be generated from two points, fromtwo copolymers with known composition percentages. Also, a one-point calibration curve going through the origin is acceptable. Figure 2shows the one-point calibration curve generated from the P(S-B)copolymer. Figure 2. One-point calibration curve of P(S-B) weight percentage versus UV/RI area ratio. Since the UV detector precedes the Rl detector in the EcoSEC GPCSystem, an inter-detector lag time between UV and Rl detectors isrequired to shift and overlay two chromatograms. Once this isachieved, the copolymer percent composition can be obtained at eachelution time based on this one-point calibration and displayed as thecomposition curve overlaid on the chromatogram. When combinedwith the Multi Processing feature in the Peak Editing mode of theEcoSEC WS software, which allows the simultaneous analysis of datafrom multiple injections, the user now has a simple and fast method toanalyze high throughput copolymer data on a daily basis. Figure 3. Differential distribution and structural composition of three copolymers samples(A) PS-PB-PS, (B) PS-P(E-B)-PS1, (C) PS-P(E-B)-PS2 determined on anEcoSEC GPC System. Figure 3 shows the copolymer composition of the other three samples:(A) PS-PB-PS,(B) PS-P(E-B)-PS1, and (C) PS-P(E-B)-PS2. Theaverage composition can be calculated directly from UV/RI ratios,which are (A) 29.7%, (B) 35.2%, (C) 34.3% for these threecopolymers respectively. The established result of 29.7% for PS-PB-PS was very close to the manufacturer's reported value of 30 wt%.The structural composition at each MW is illustrated in Figure 3 andcan be reported in a tabulated format in the EcoSEC WS software.The two largest peaks in each chromatogram are within the includedvolume of the columns. The EcoSEC GPC System, equipped with both Rl and UV detectors,can be used to determine copolymer composition, in which thecopolymer contains one UV visible and one non-UV visiblecomponent. At least one copolymer of known composition must beavailable to create a copolymer calibration curve. The structuralcomposition of an unknown copolymer sample can be obtained in theEcoSEC WS software by analyzing that sample's Rl and UVchromatograms. The final result is a plot of the molecular weightdistribution as a function of the copolymer composition at eachmolecular weight. In addition, the data from multiple injections can be analyzedsimultaneously using the Multi Processing feature in the EcoSEC WSsoftware. In summary, copolymer analysis using the EcoSEC GPCSystem can be done in a simple and fast way, which is most beneficialin a high throughput analysis setting. TOSOH BIOSCIENCETOSOH Fax: ( D
确定
还剩1页未读,是否继续阅读?

东曹(上海)生物科技有限公司为您提供《高分子聚合物中分子量和分子量分布检测方案(凝胶色谱仪)》,该方案主要用于合成树脂/塑料中分子量和分子量分布检测,参考标准--,《高分子聚合物中分子量和分子量分布检测方案(凝胶色谱仪)》用到的仪器有
相关方案
更多
该厂商其他方案
更多