


方案详情
文
众所周知,分光测色仪是将反射或透射光在可见光范围内分成单色光并积分算出颜色数据的仪器,是目前最流行的仪器。但是仪器的光源是否长寿命,模拟D65是否出色,积分球是否稳定,是不是光纤传输,监测器有多少,监测精度高不高,校正板是否是国际标准传递板,您都知道吗?
本文介绍最高级别仪器UltraScan PRO的带宽,解析度和报告间隔,了解此仪器的大不同。。
方案详情

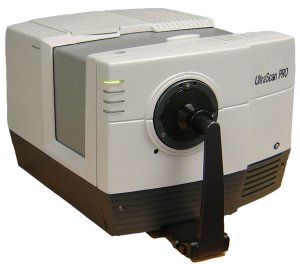
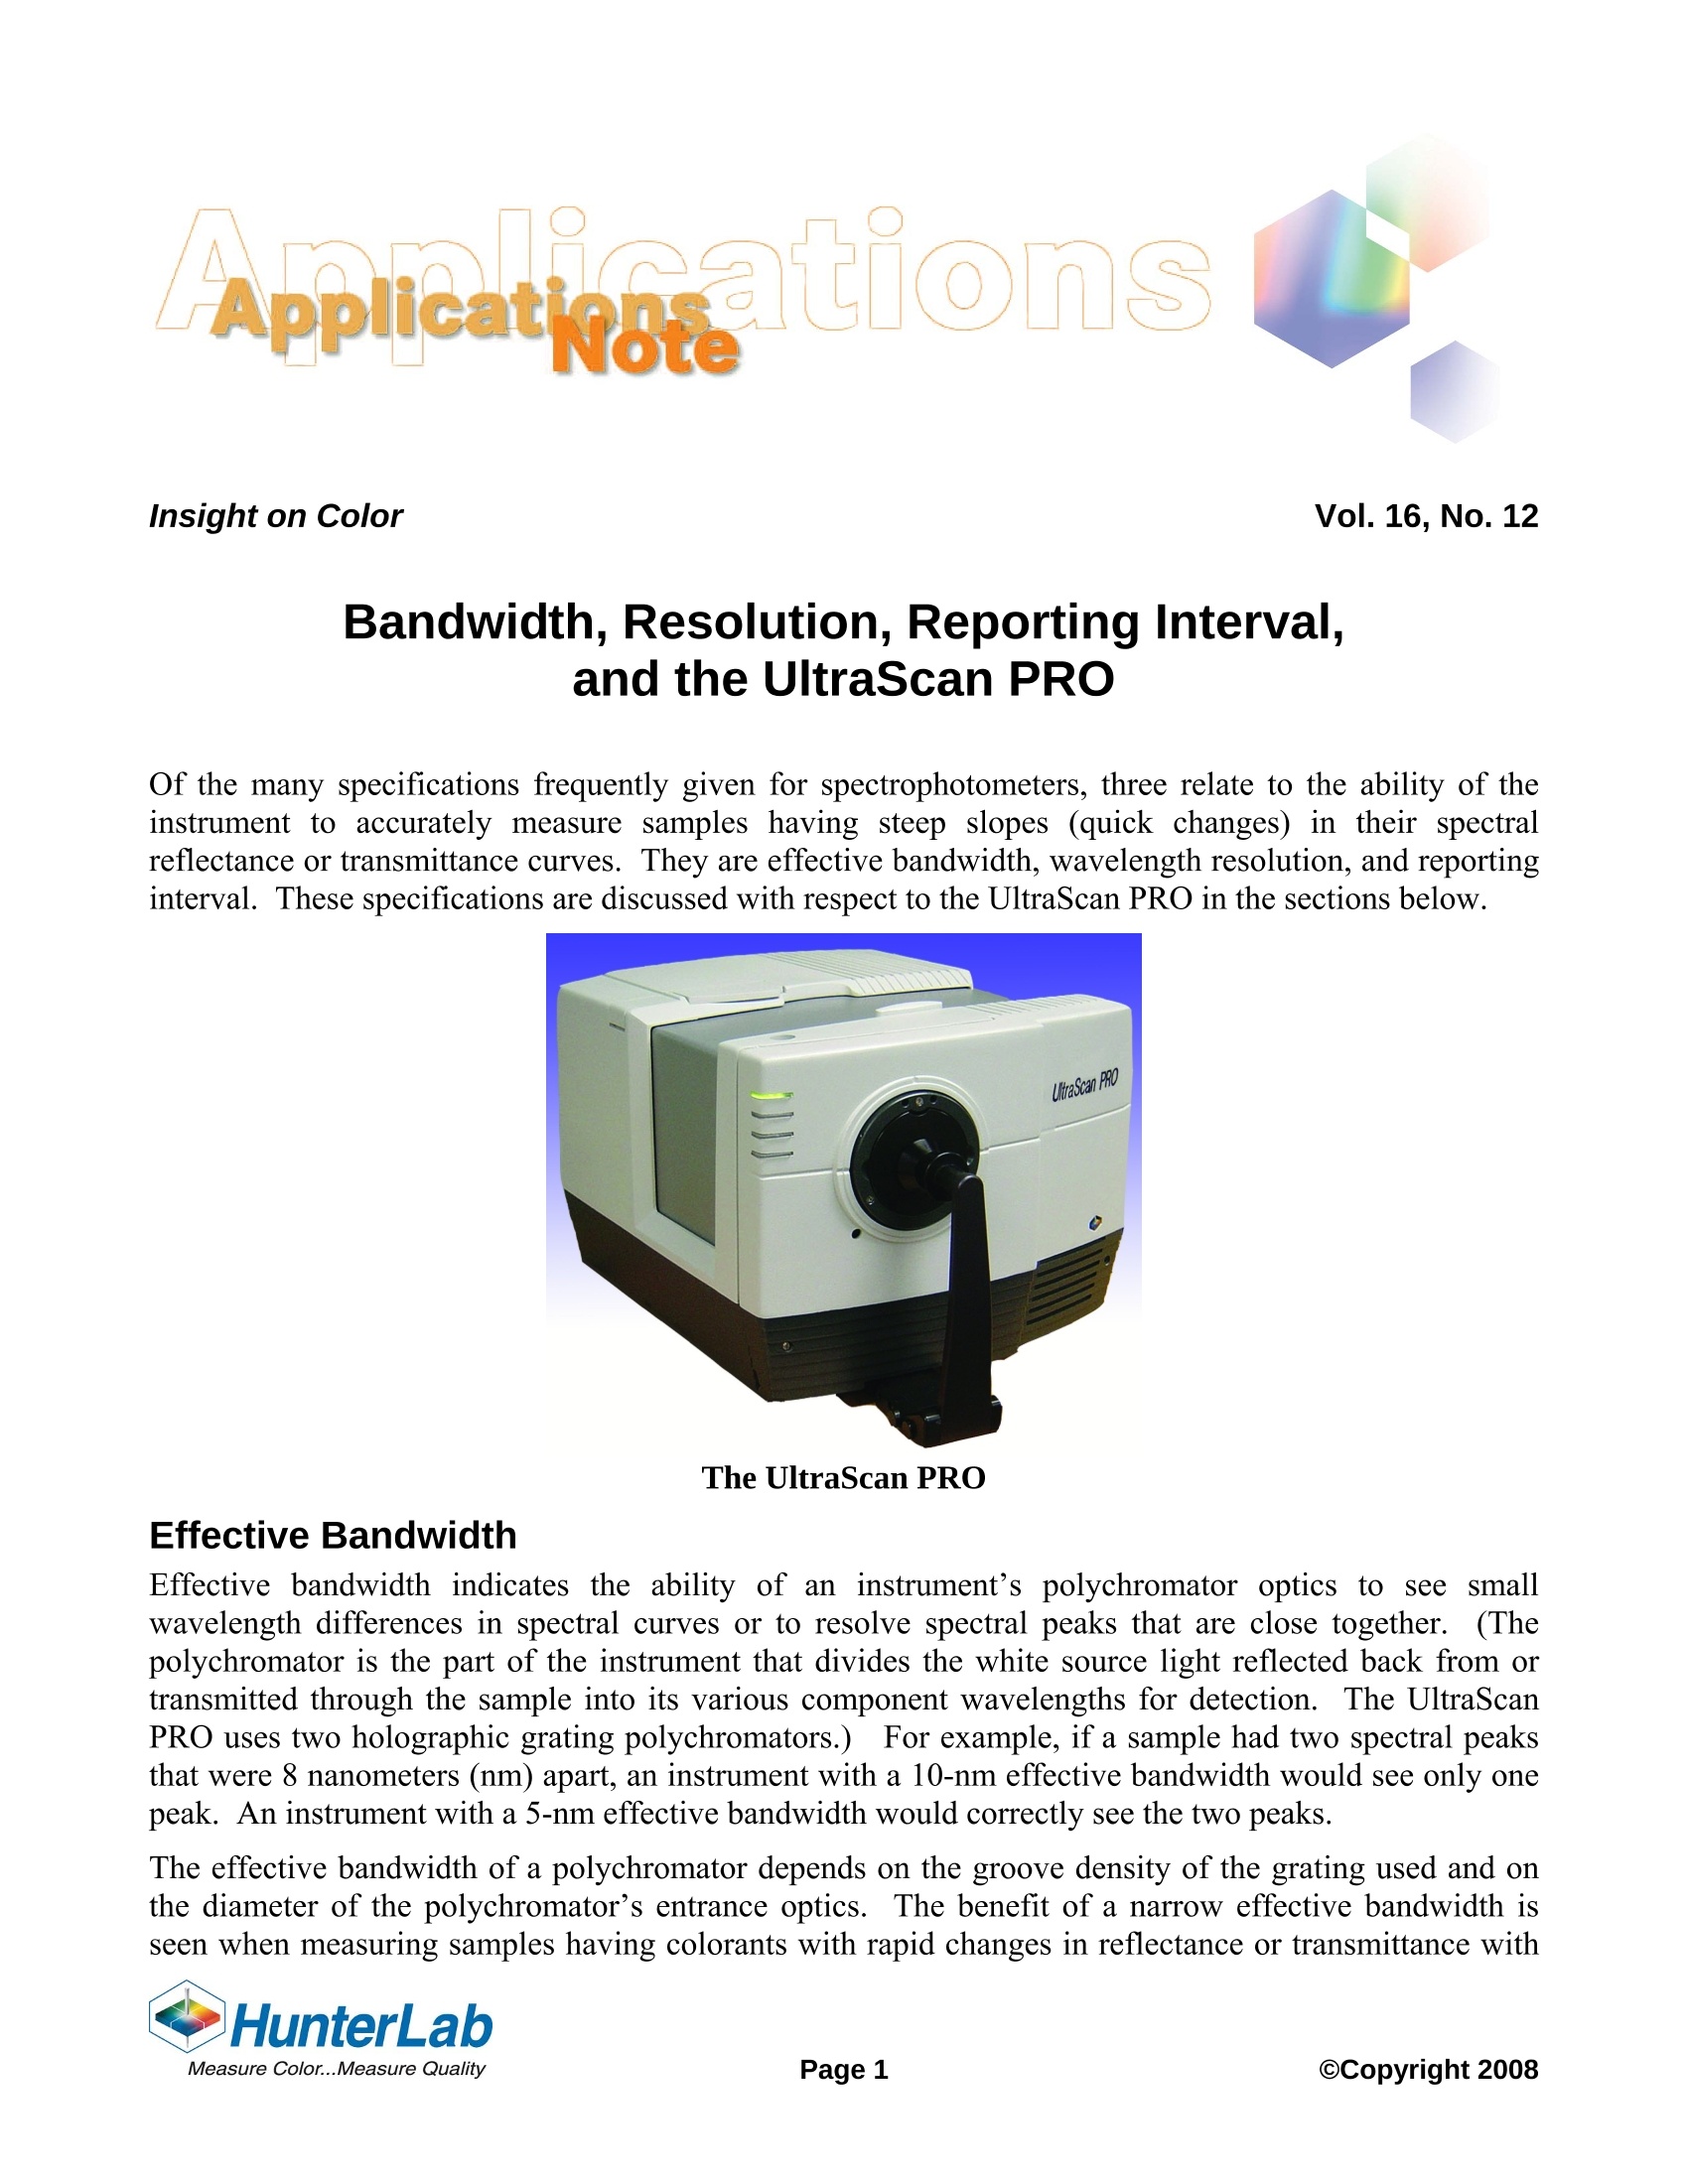
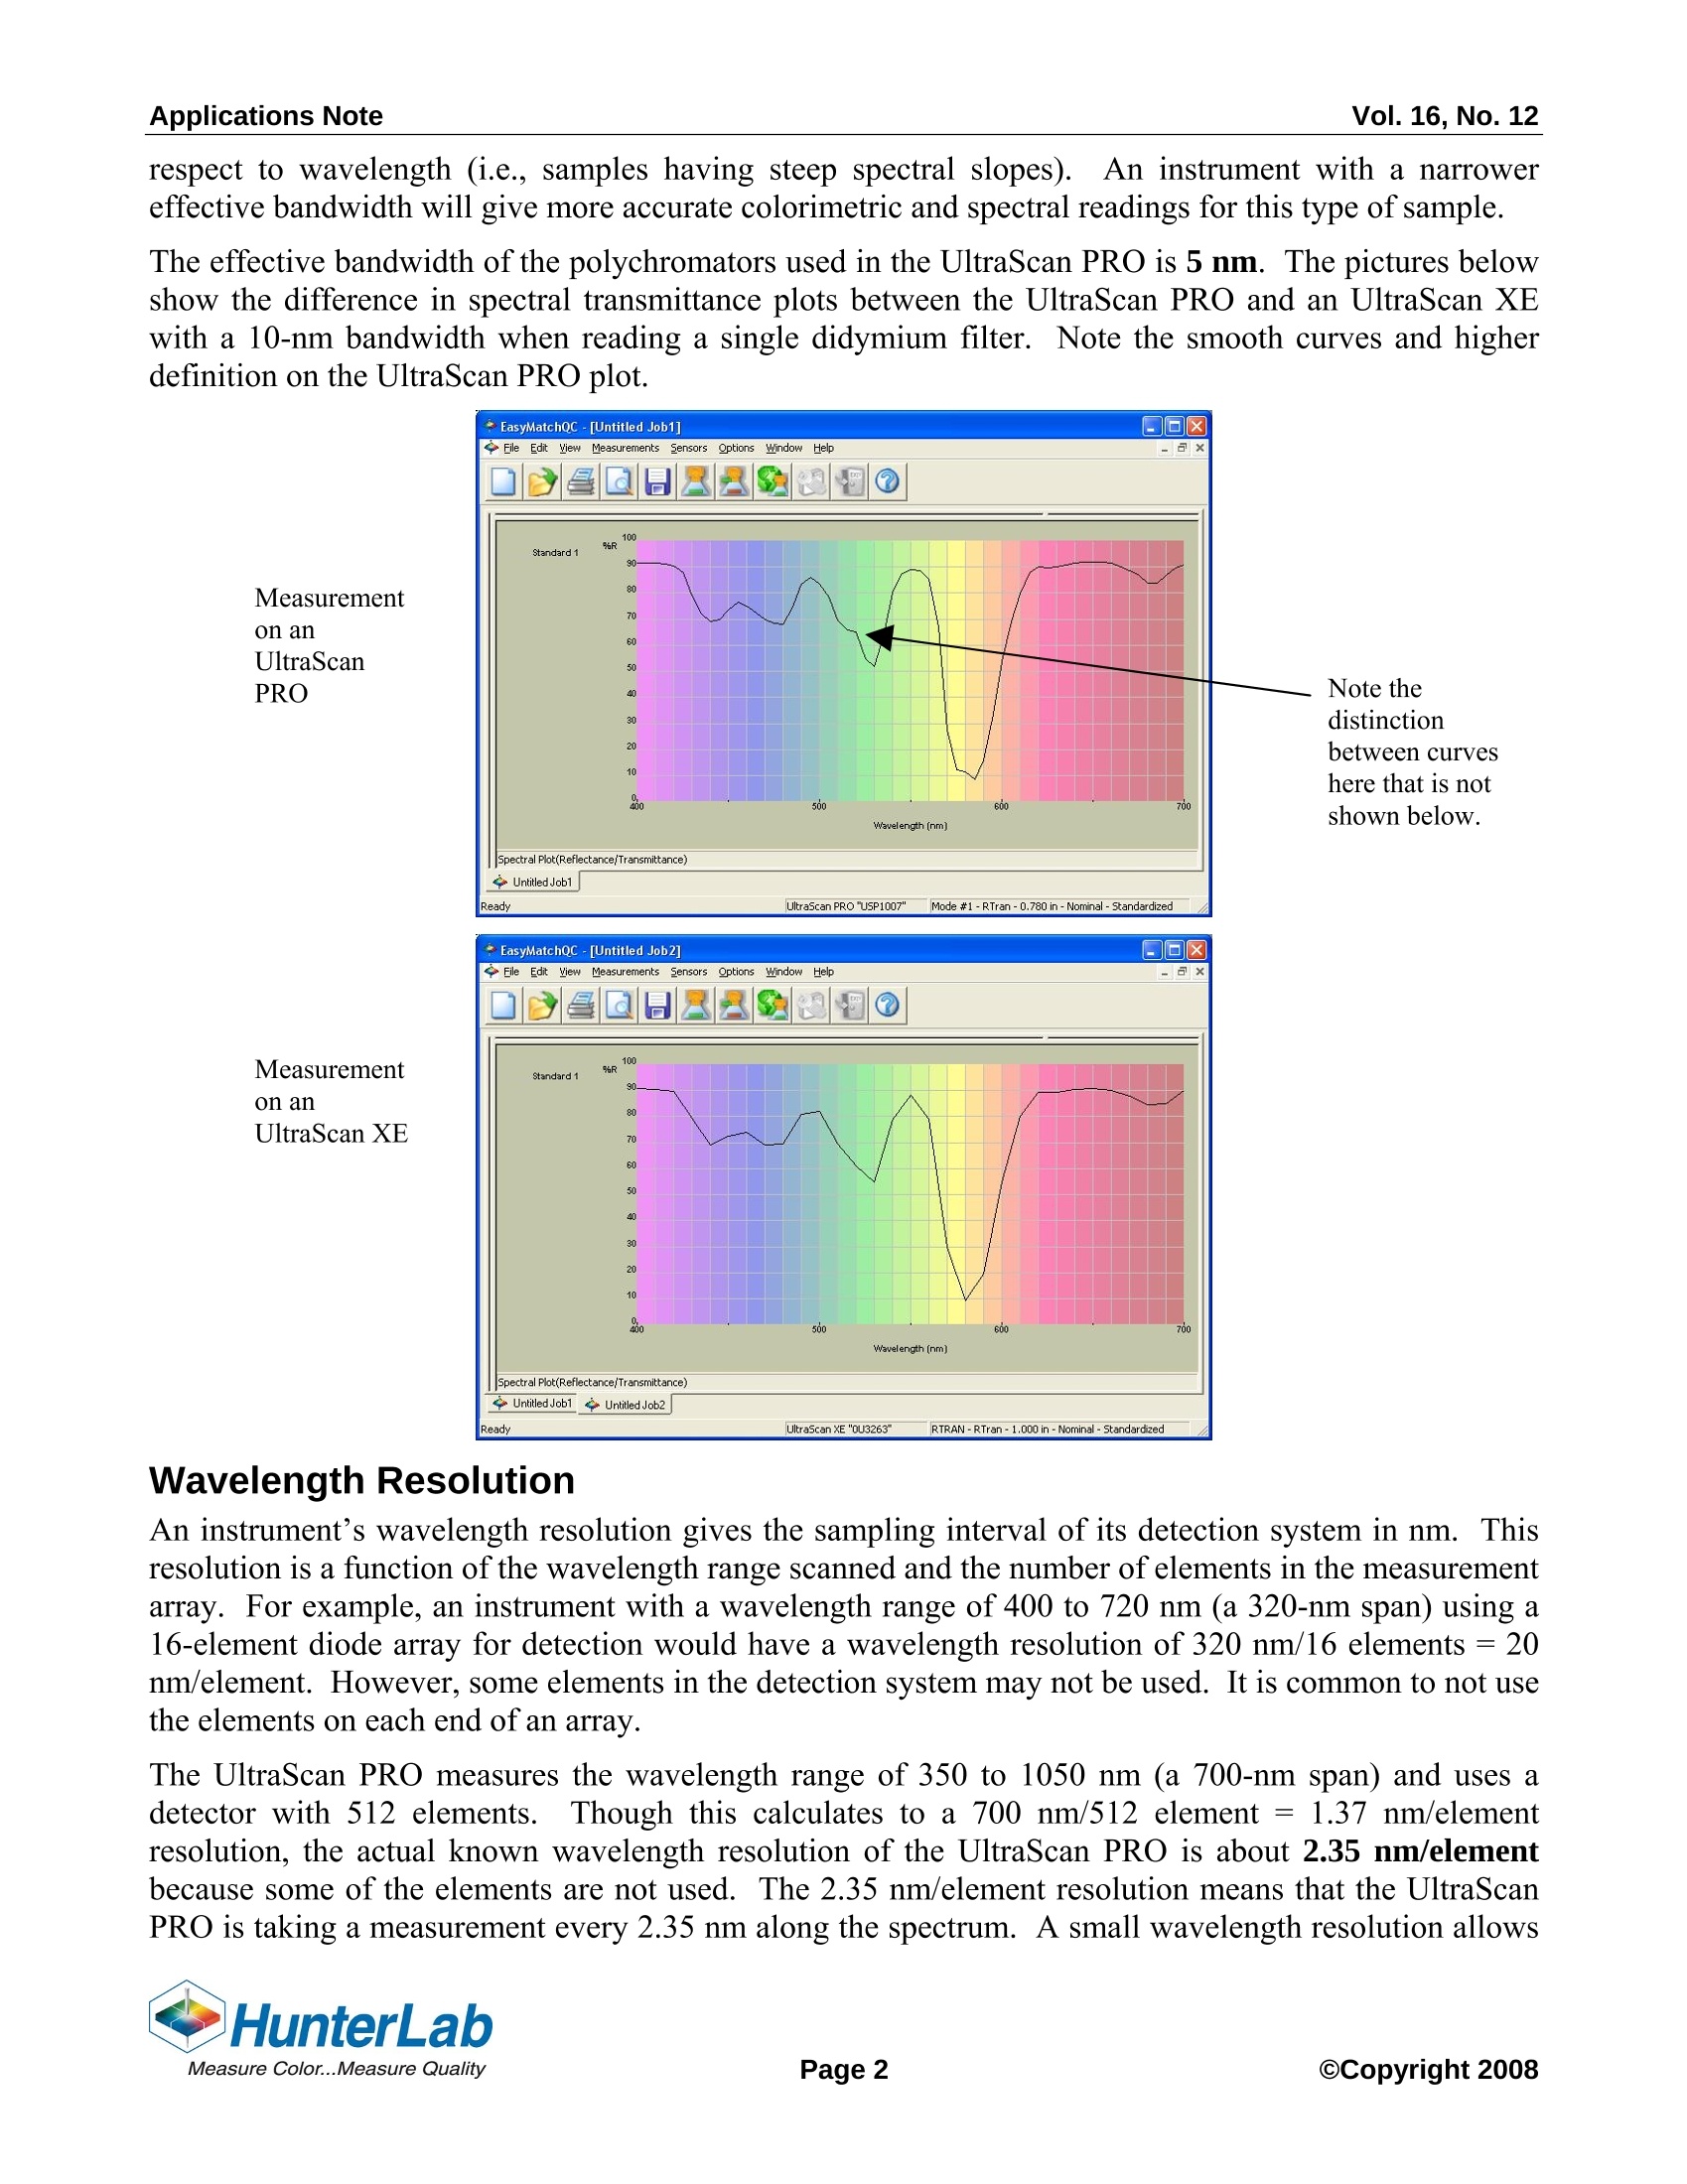
Vol. 16, No. 12 Vol. 16, No. 12Applications Note Insight on Color Bandwidth, Resolution, Reporting Interval,and the UltraScan PRO Of the many specifications frequently given for spectrophotometers, three relate to the ability of theinstrument to accurately measure samples having steep slopes (quick changes) in their spectralreflectance or transmittance curves. They are effective bandwidth, wavelength resolution, and reportinginterval. These specifications are discussed with respect to the UltraScan PRO in the sections below. The UltraScan PRO Effective Bandwidth Effective bandwidth indicates the ability of an instrument’s polychromator optics to see smallwavelength differences in spectral curves or to resolve spectral peaks that are close together. i(Thepolychromator is the part of the instrument that divides the white source light reflected back from ortransmitted through the sample into its various component wavelengths for detection. The UltraScanPRO uses two holographic grating polychromators.) For example, if a sample had two spectral peaksthat were 8 nanometers (nm) apart, an instrument with a 10-nm effective bandwidth would see only onepeak. An instrument with a 5-nm effective bandwidth would correctly see the two peaks. The effective bandwidth of a polychromator depends on the groove density of the grating used and onthe diameter of the polychromator’s entrance optics.The benefit of a narrow effective bandwidth isseen when measuring samples having colorants with rapid changes in reflectance or transmittance with respect to wavelength (i.e., samples having steep spectral slopes).An instrument with a narrowereffective bandwidth will give more accurate colorimetric and spectral readings for this type of sample. The effective bandwidth of the polychromators used in the UltraScan PRO is 5 nm. The pictures belowshow the difference in spectral transmittance plots between the UltraScan PRO and an UltraScan XEwith a 10-nm bandwidth when reading a single didymium filter. Note the smooth curves and higherdefinition on the UltraScan PRO plot. Measurement on an UltraScan pro Measurement on an UltraScan XE Note the distinction between curves here that is not shown below. Wavelength Resolution An instrument’s wavelength resolution gives the sampling interval of its detection system in nm. Thisresolution is a function of the wavelength range scanned and the number of elements in the measurementarray. For example, an instrument with a wavelength range of 400 to 720 nm (a 320-nm span) using a16-element diode array for detection would have a wavelength resolution of 320 nm/16 elements = 20nm/element. However, some elements in the detection system may not be used. It is common to not usethe elements on each end of an array. The UltraScan PRO measures the wavelength range of 350 to 1050 nm (a 700-nm span) and uses adetector with 512 elements.Though this calculates to a 700 nm/512 element= 1.317. 3n7n nm/elementresolution, the actual known wavelength resolution of the UltraScan PRO is about 2.35 nm/elementbecause some of the elements are not used. The 2.35 nm/element resolution means that the UltraScanPRO is taking a measurement every 2.35 nm along the spectrum. A small wavelength resolution allows you to more precisely calibrate the instrument’s wavelength to achieve higher wavelength accuracy.This, in turn, results in more accurate spectral and colorimetric measurements. Reporting Interval An instrument’s reporting interval is the interval (in nm) at which sample reflectance or transmittancedata is actually output by the instrument. This is the interval of the spectral data that is displayed onyour computer and that is used for the calculations that convert the spectral data to colorimetric data likeL*a*b*. The reporting interval should always be equal to or larger than the wavelength resolution. If itis not, then the reported data is being interpolated and is not the true measurement. The UltraScan PRO has a 5-nm reporting interval and a 2.35-nm wavelength resolution. Thus, the datareported every 5 nm (i.e., at 350 nm,355 nm, 360 nm, etc.) are true and accurate measurements. ASTME308-01 Section 6.3 states, “For greater accuracy select the 5-nm measurement interval over the 10-nminterval where spectral data are available at 5-nm intervals.” In addition, 5-nm spectral data gives morecomplete information about a sample's spectral characteristics when you are working with spectral dataand spectral curves. This is especially important for samples having steep spectral slopes. For Additional Information Contact: Technical Services Department Hunter Associates Laboratory, Inc. 11491 Sunset Hills Road Reston, Virginia 20190 Telephone: 703-471-6870 FAX: 703-471-4237 www.hunterlab.com Page CCopyright CCopyright age
确定
还剩1页未读,是否继续阅读?

产品配置单
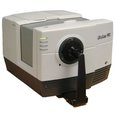
上海韵鼎国际贸易有限公司为您提供《USPRO测色仪的带宽,解析度和报告间隔》,该方案主要用于其他中--检测,参考标准--,《USPRO测色仪的带宽,解析度和报告间隔》用到的仪器有HunterLab近红外光谱多功能色差仪|测色仪UltraScan PRO
推荐专场


相关方案
更多
该厂商其他方案
更多