


方案详情
文
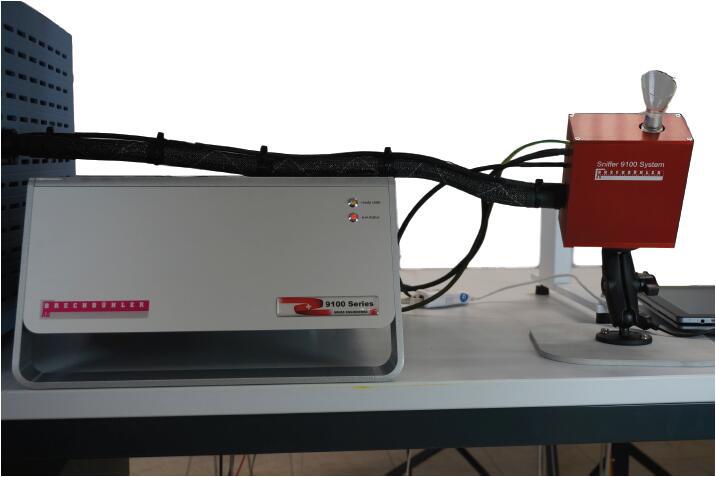
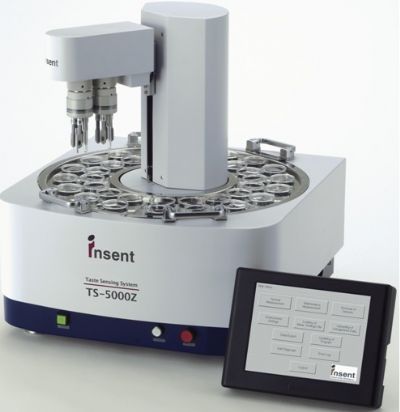
“渤海大学”基于电子鼻和电子舌技术,识别市售烤羊肉串的风味特征。采用 HS-SPME-GC-MS、SPME-Arrow-GC × GC-TOF-MS 和 HS-GC-IMS 分析知名餐厅制作的五种烤肉串,以确定其 VOC 特征,然后使用智能传感技术进行表征。采用混合数据融合策略来提高风味识别的准确性。
方案详情

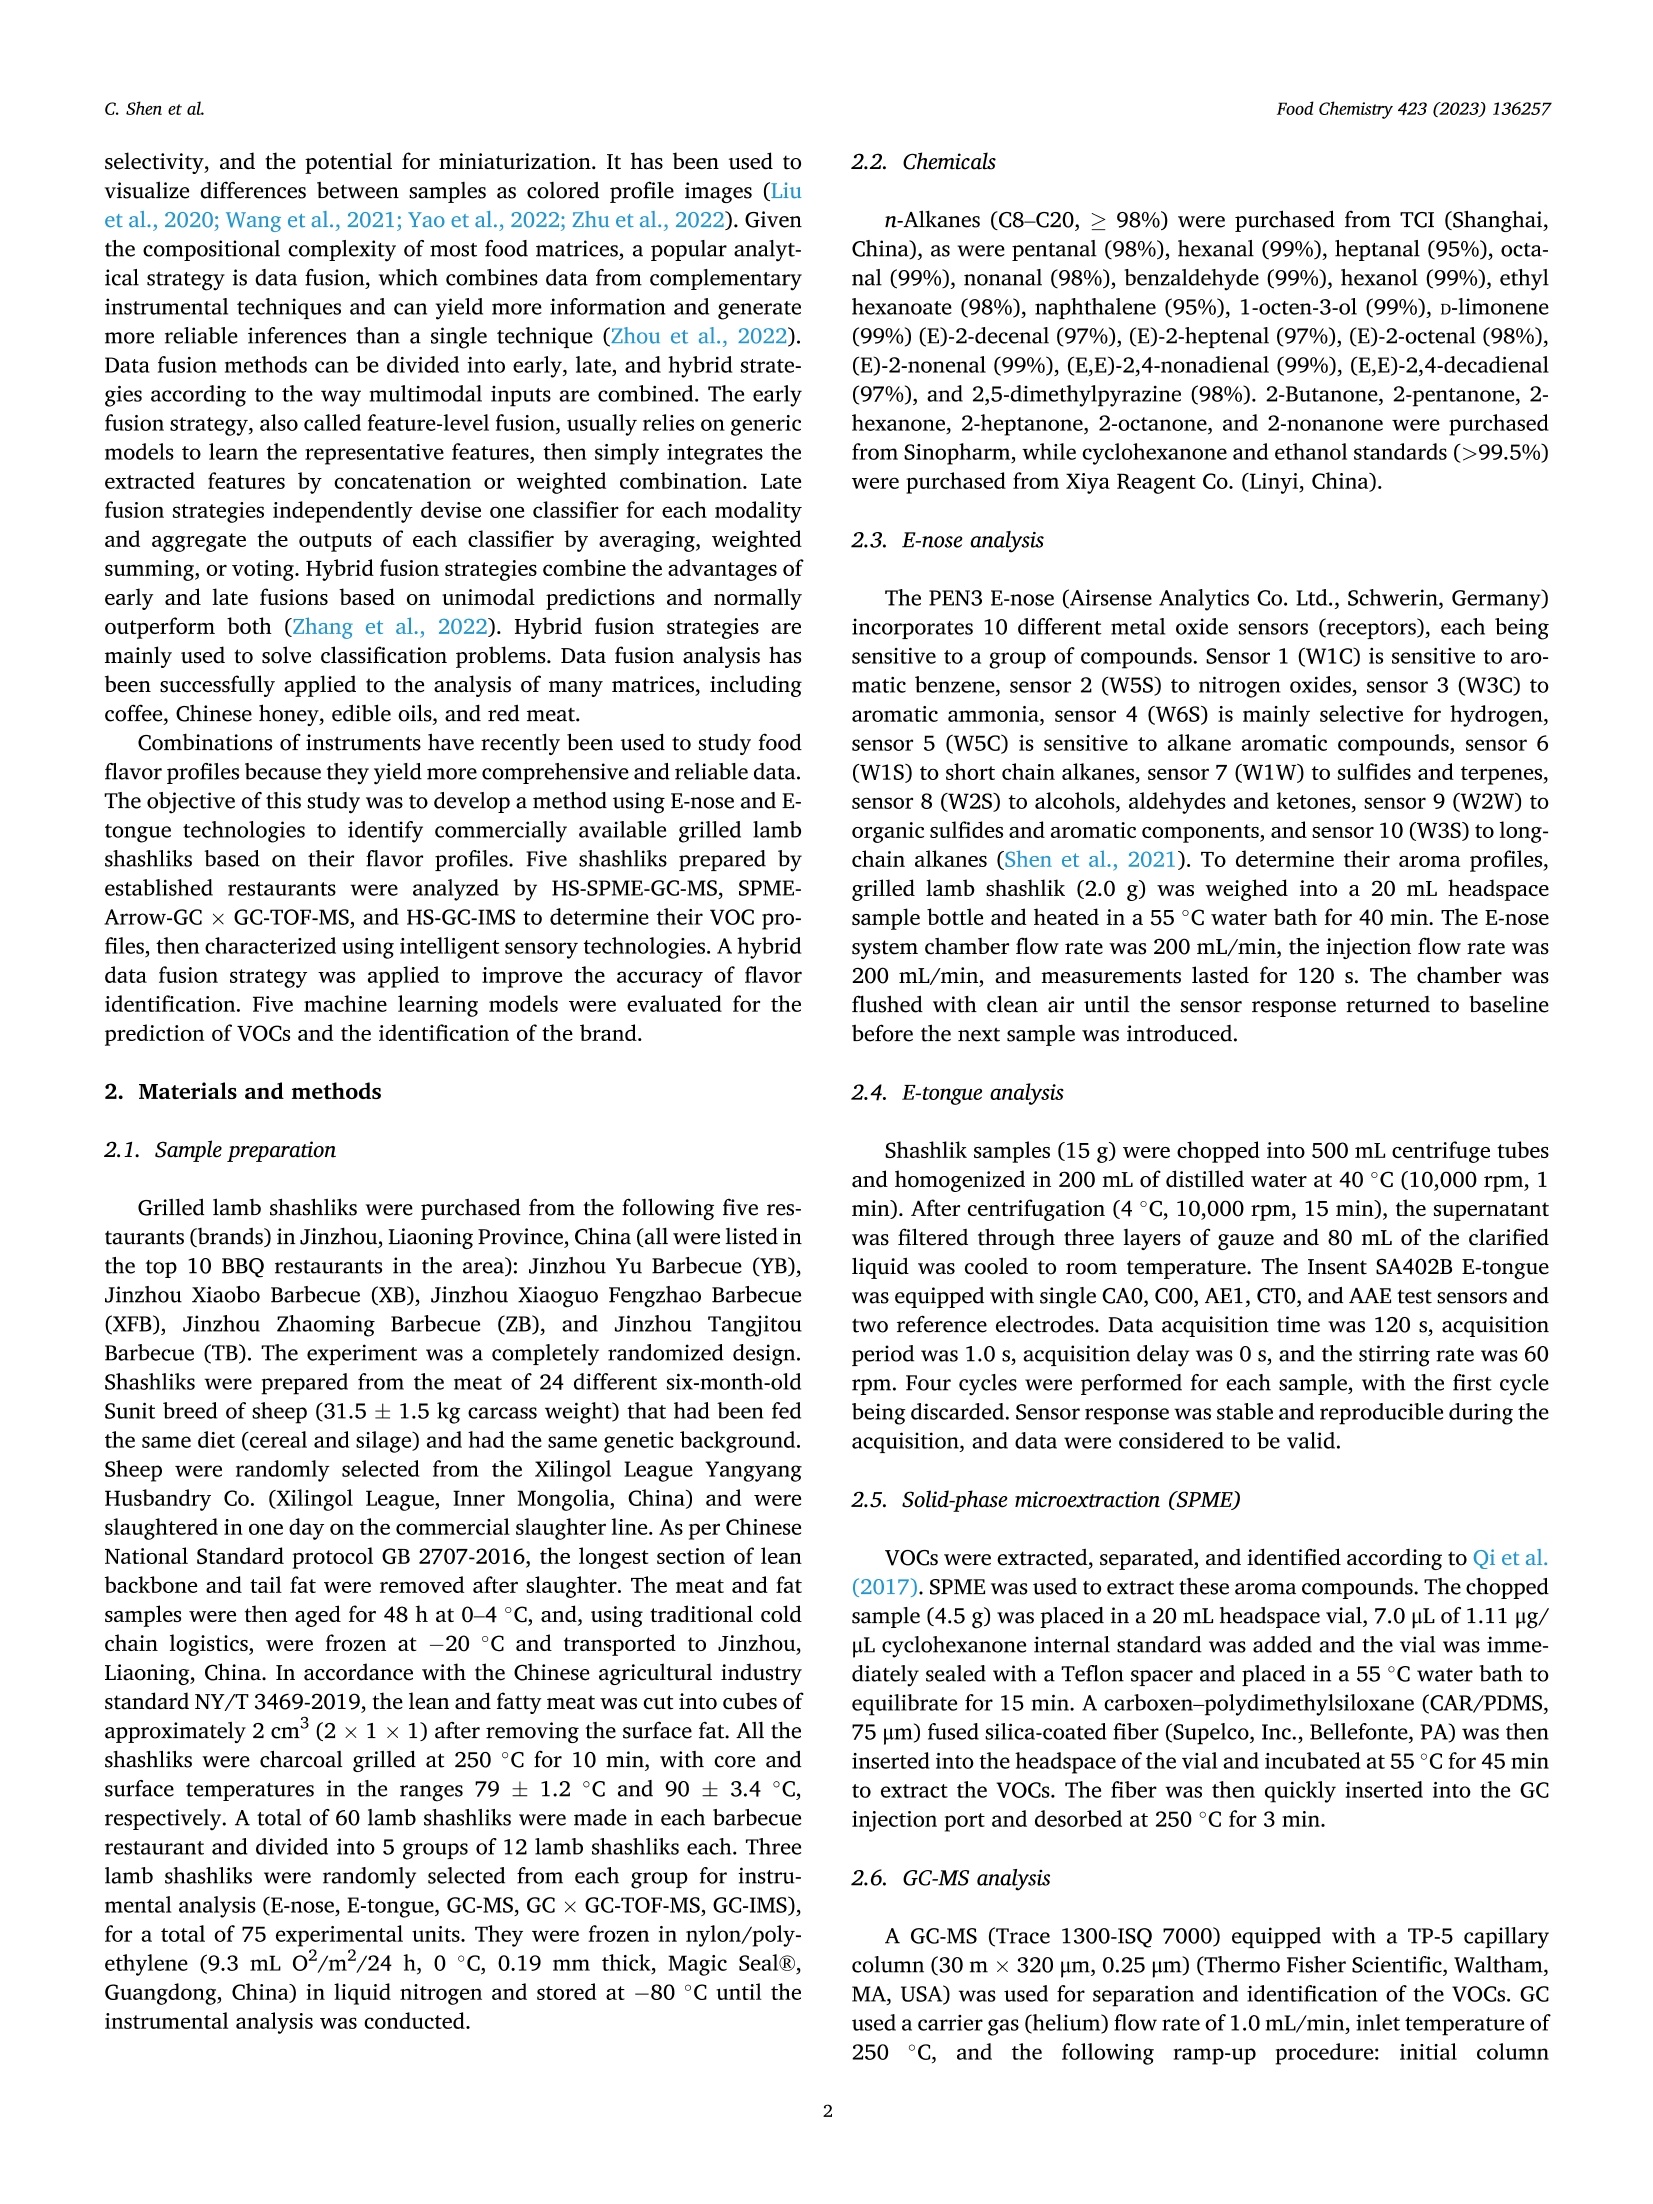
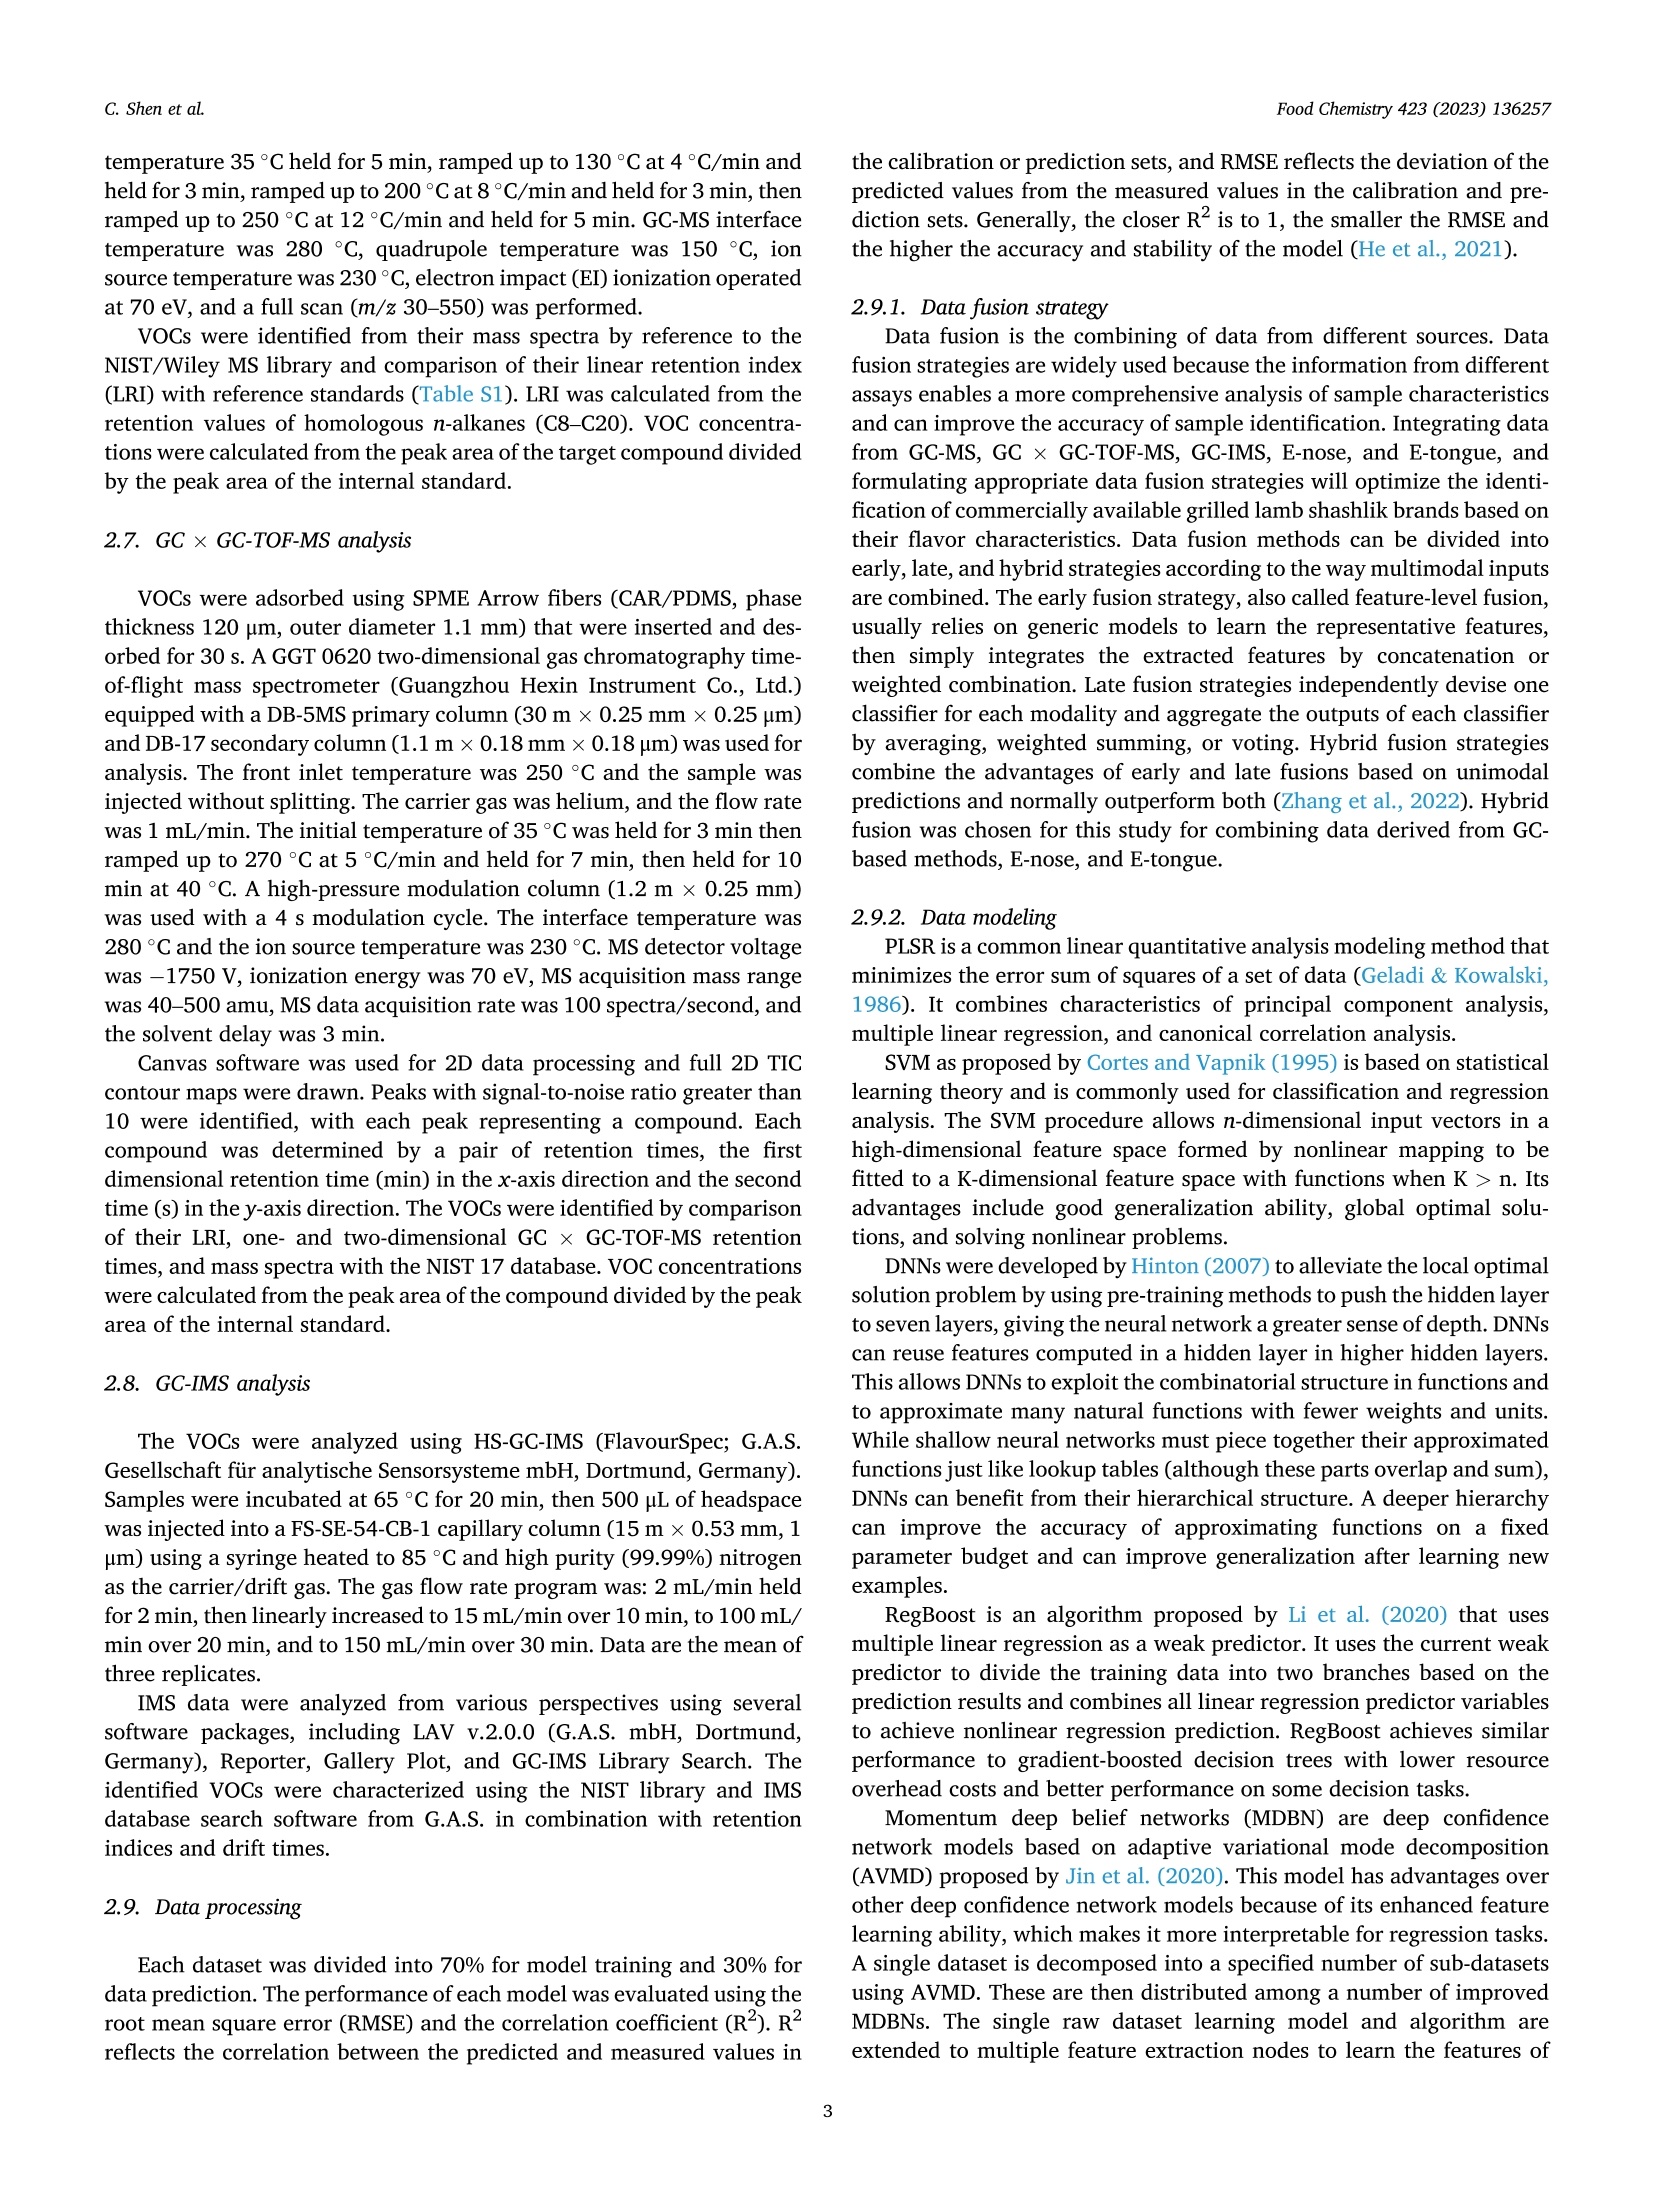
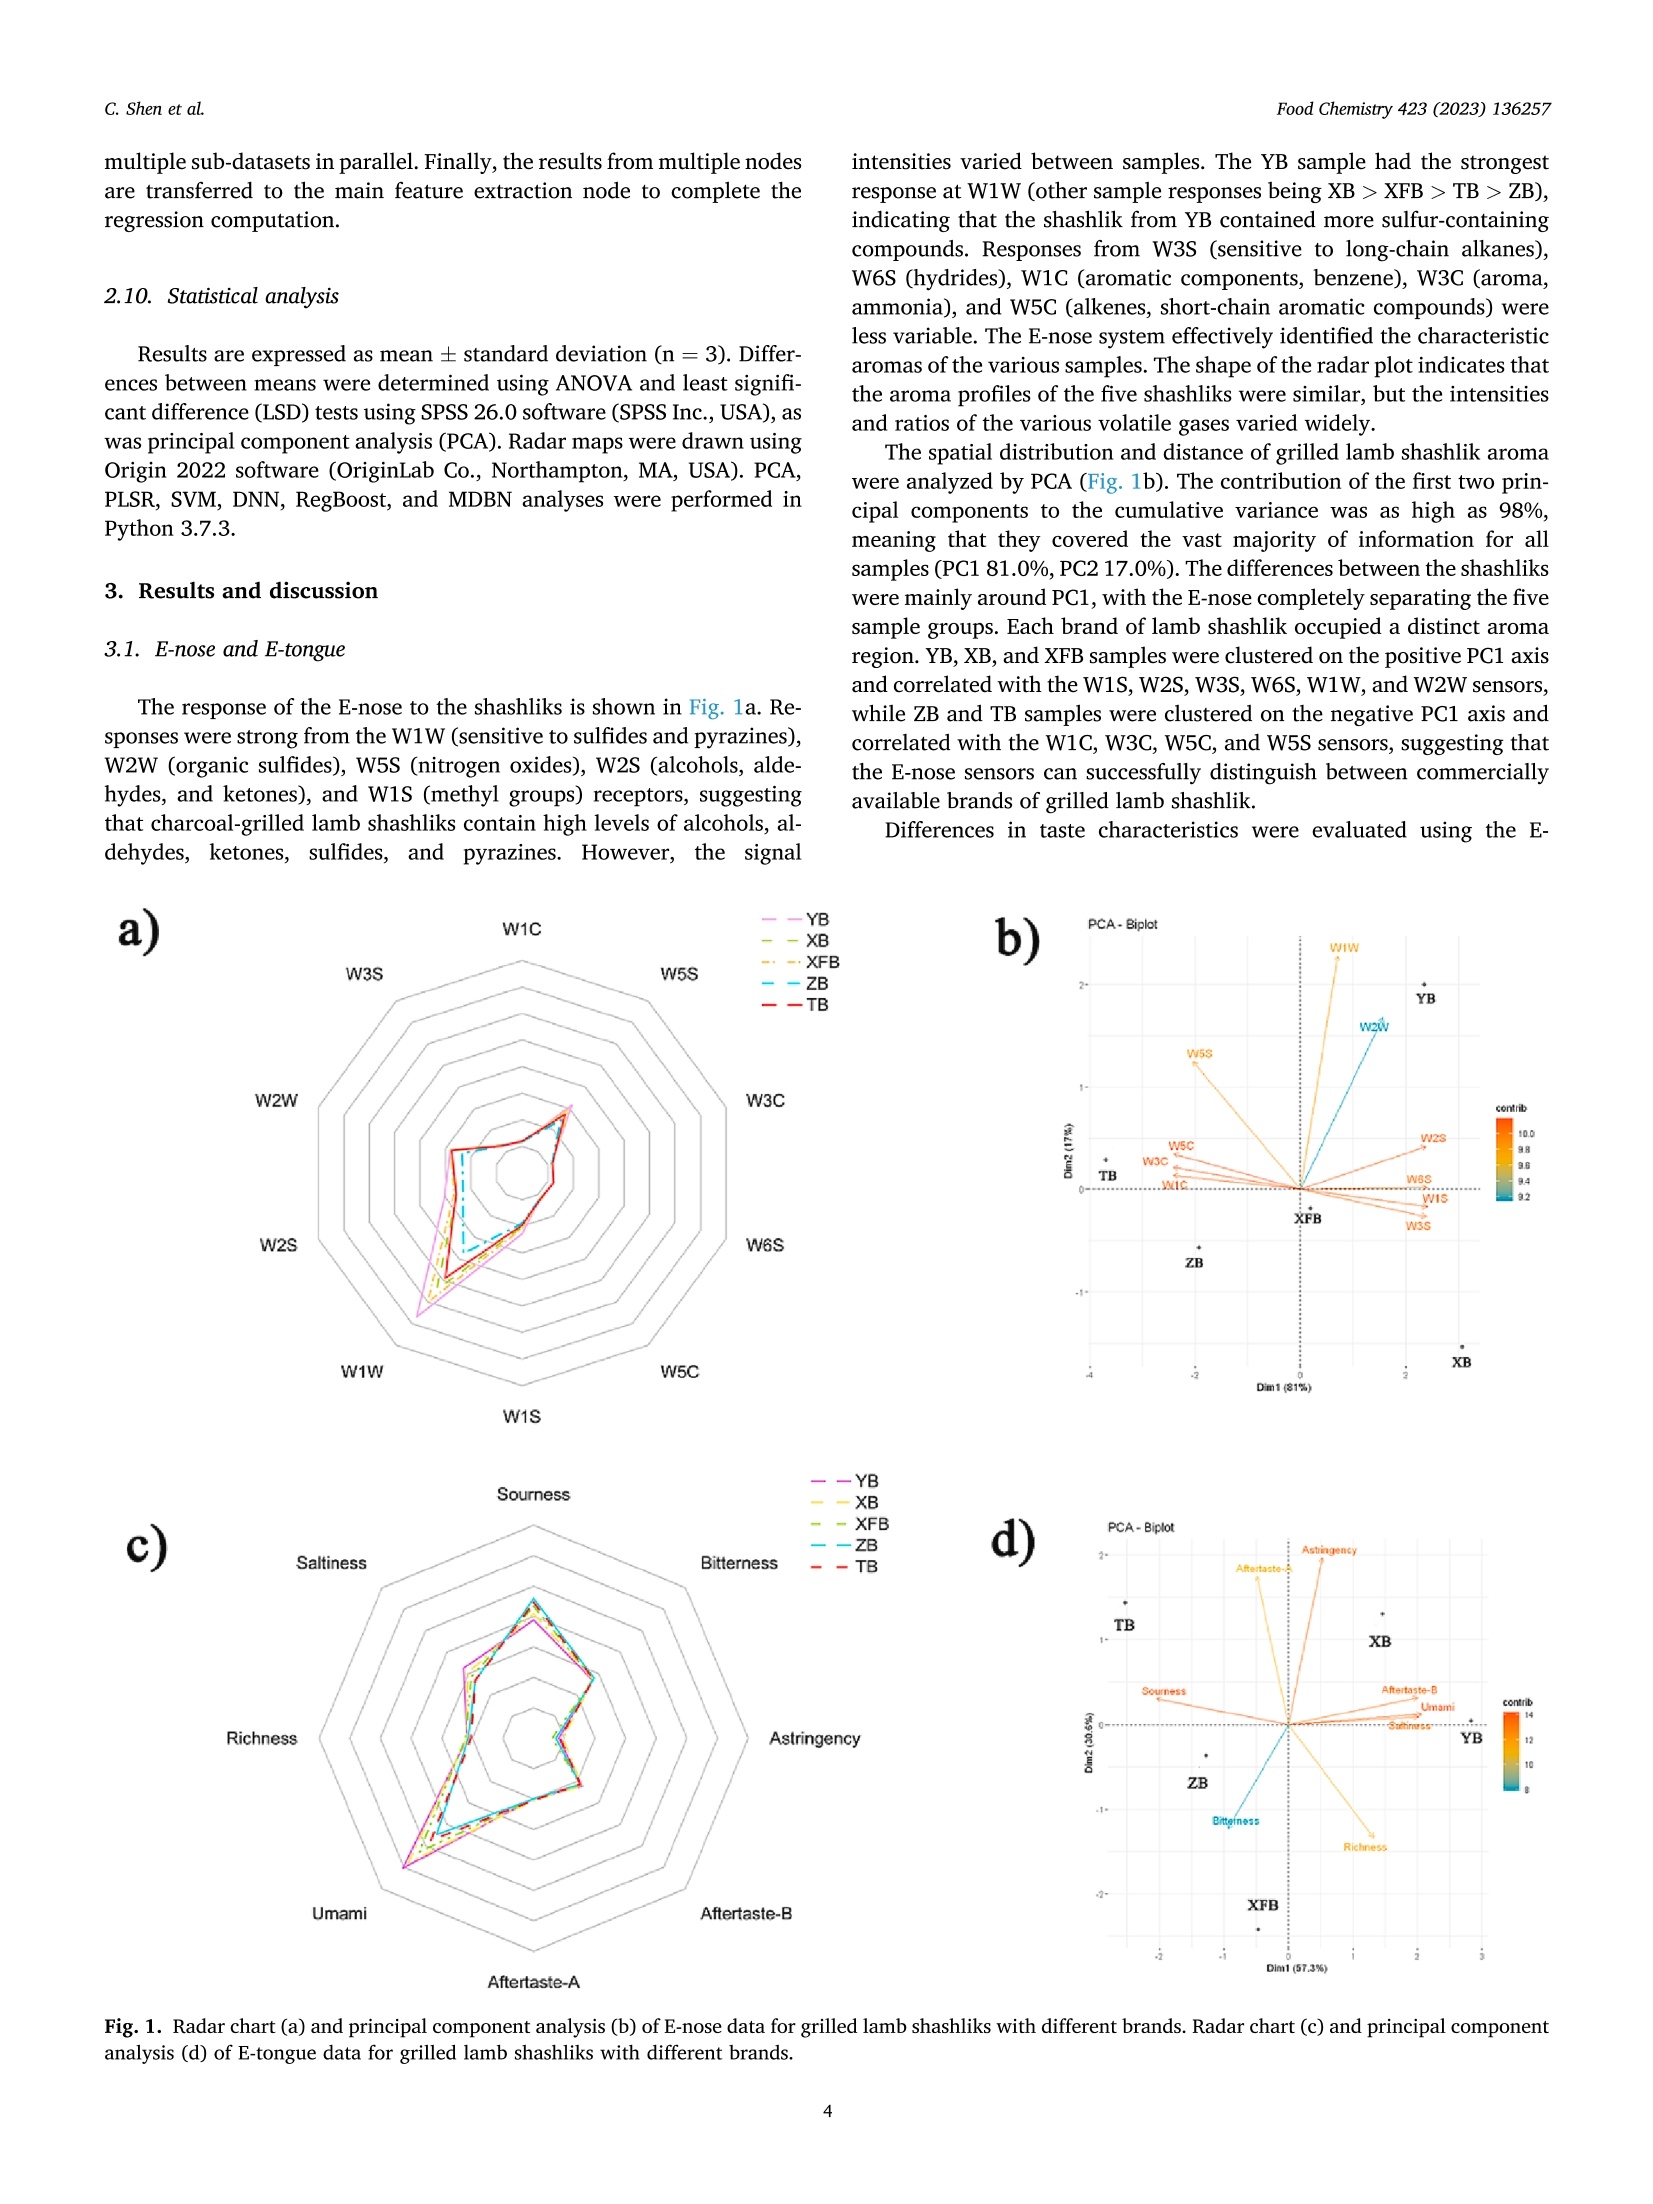
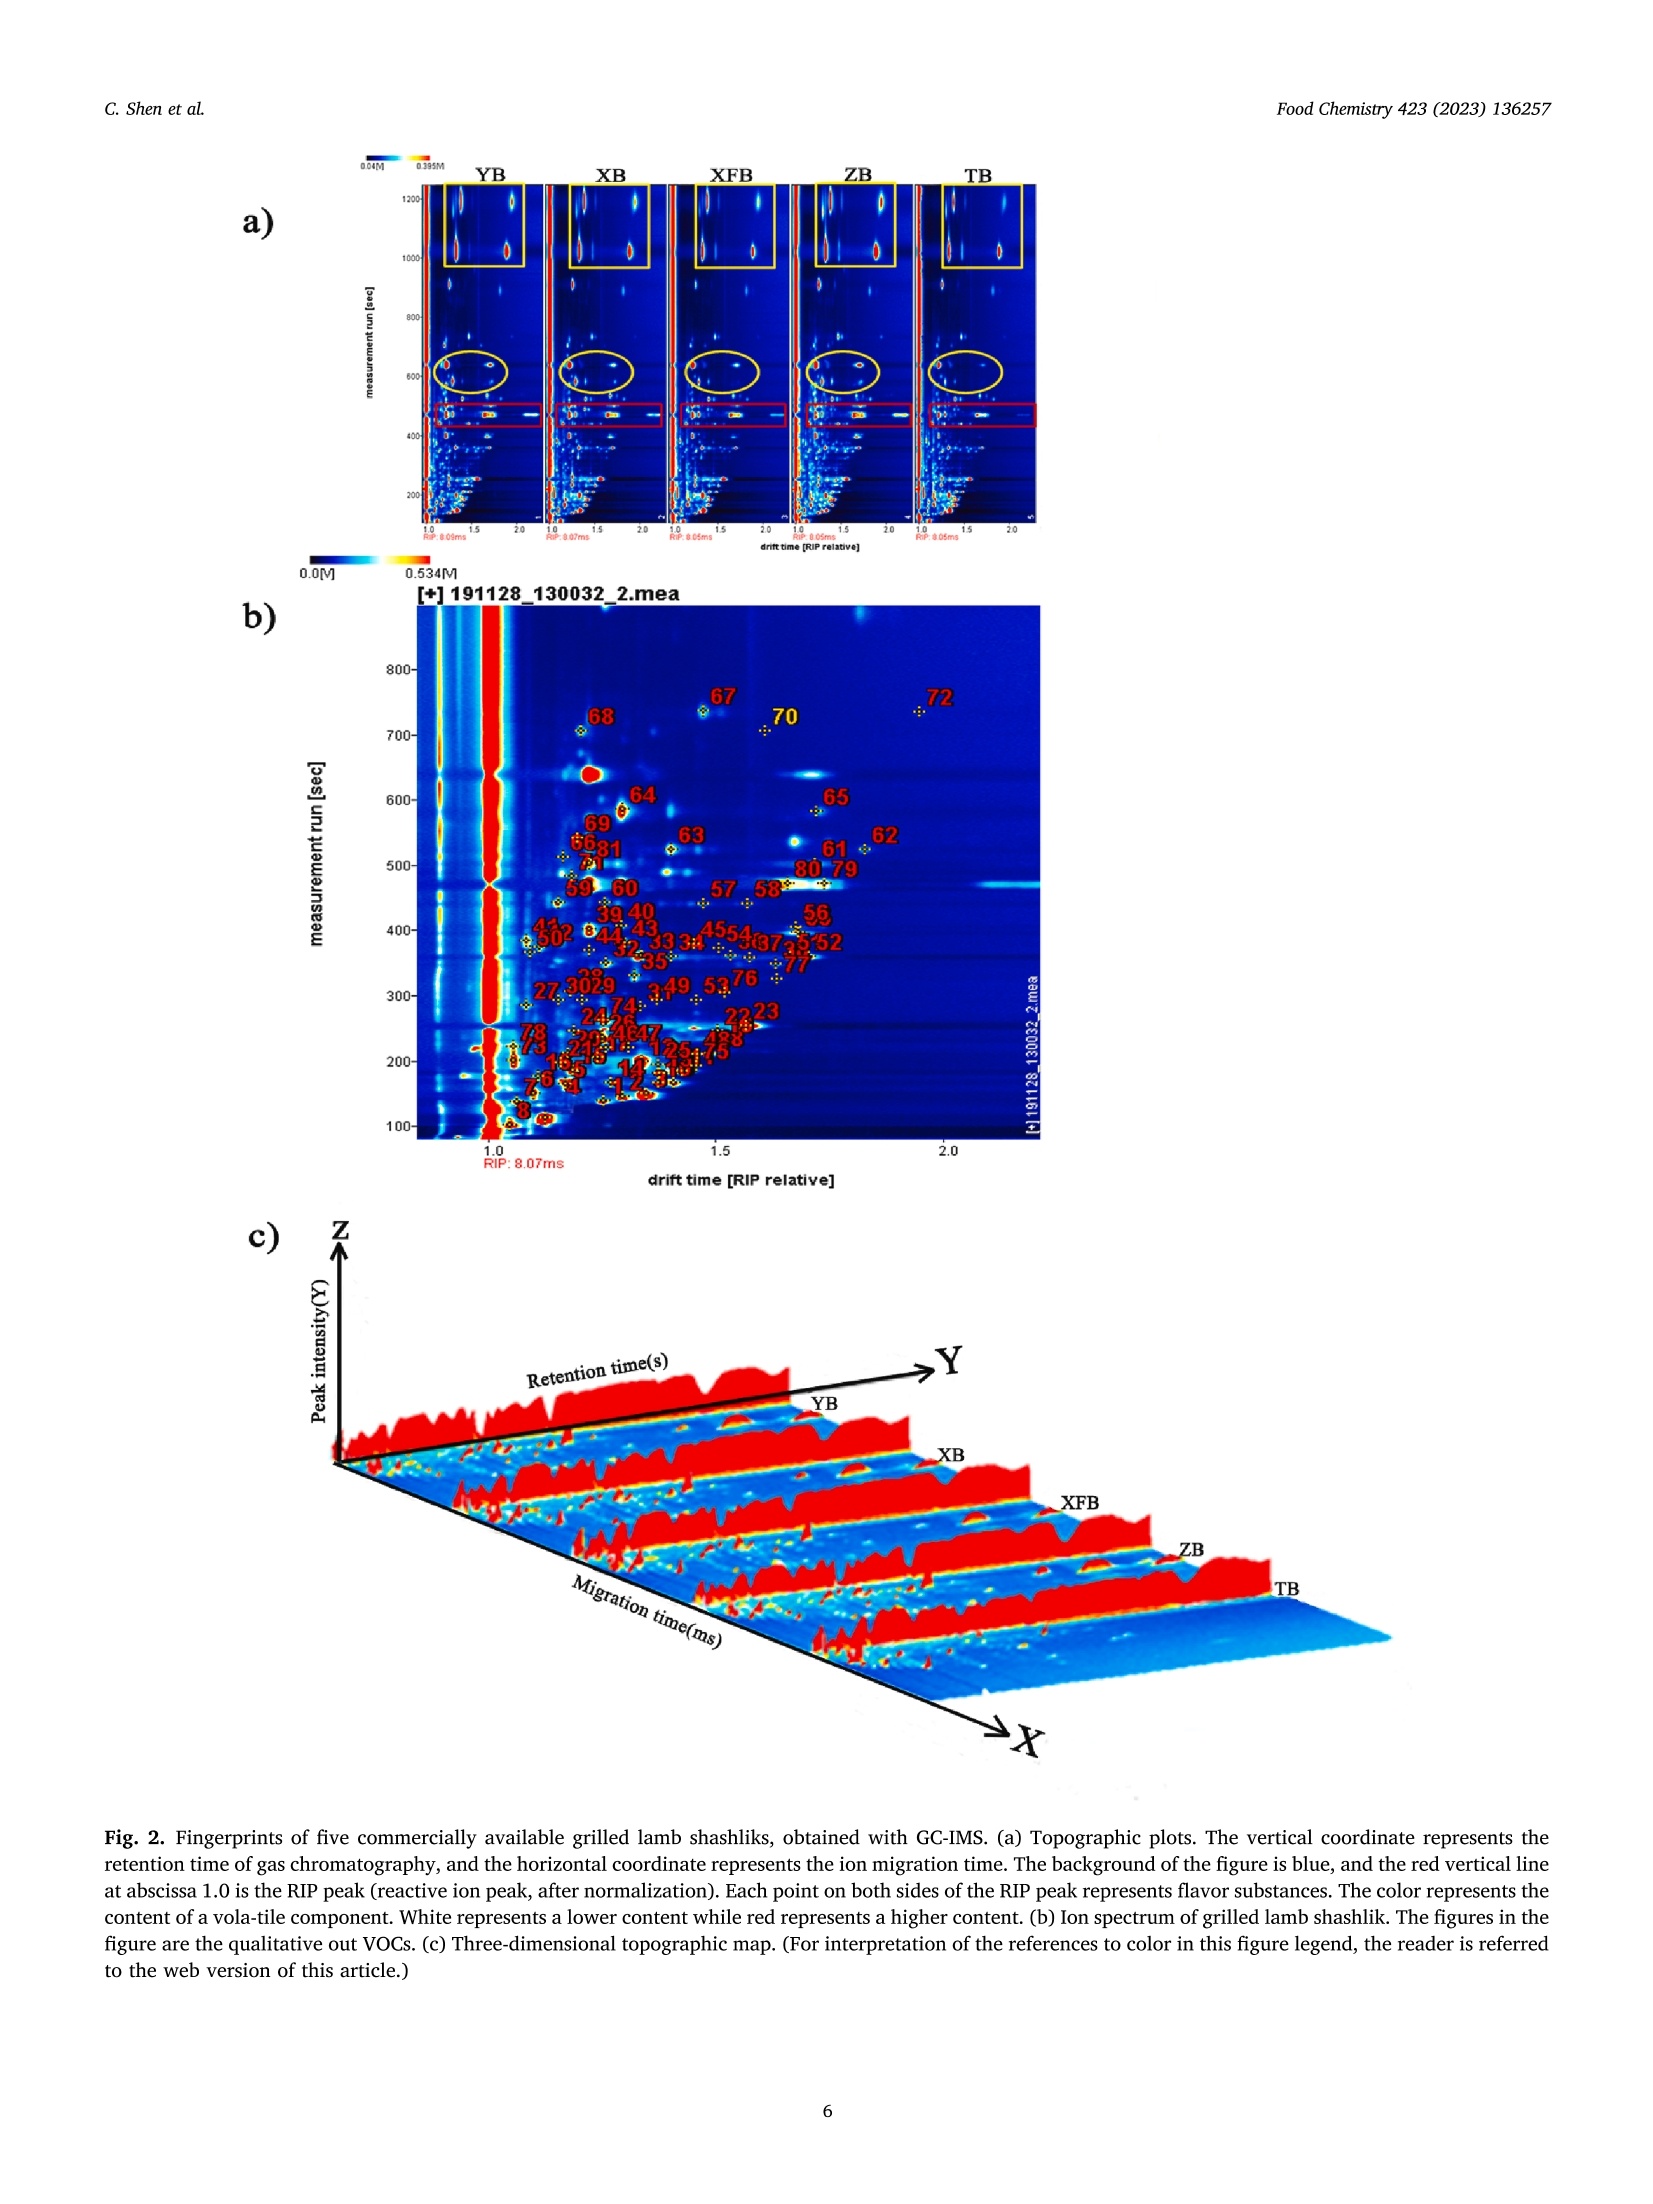
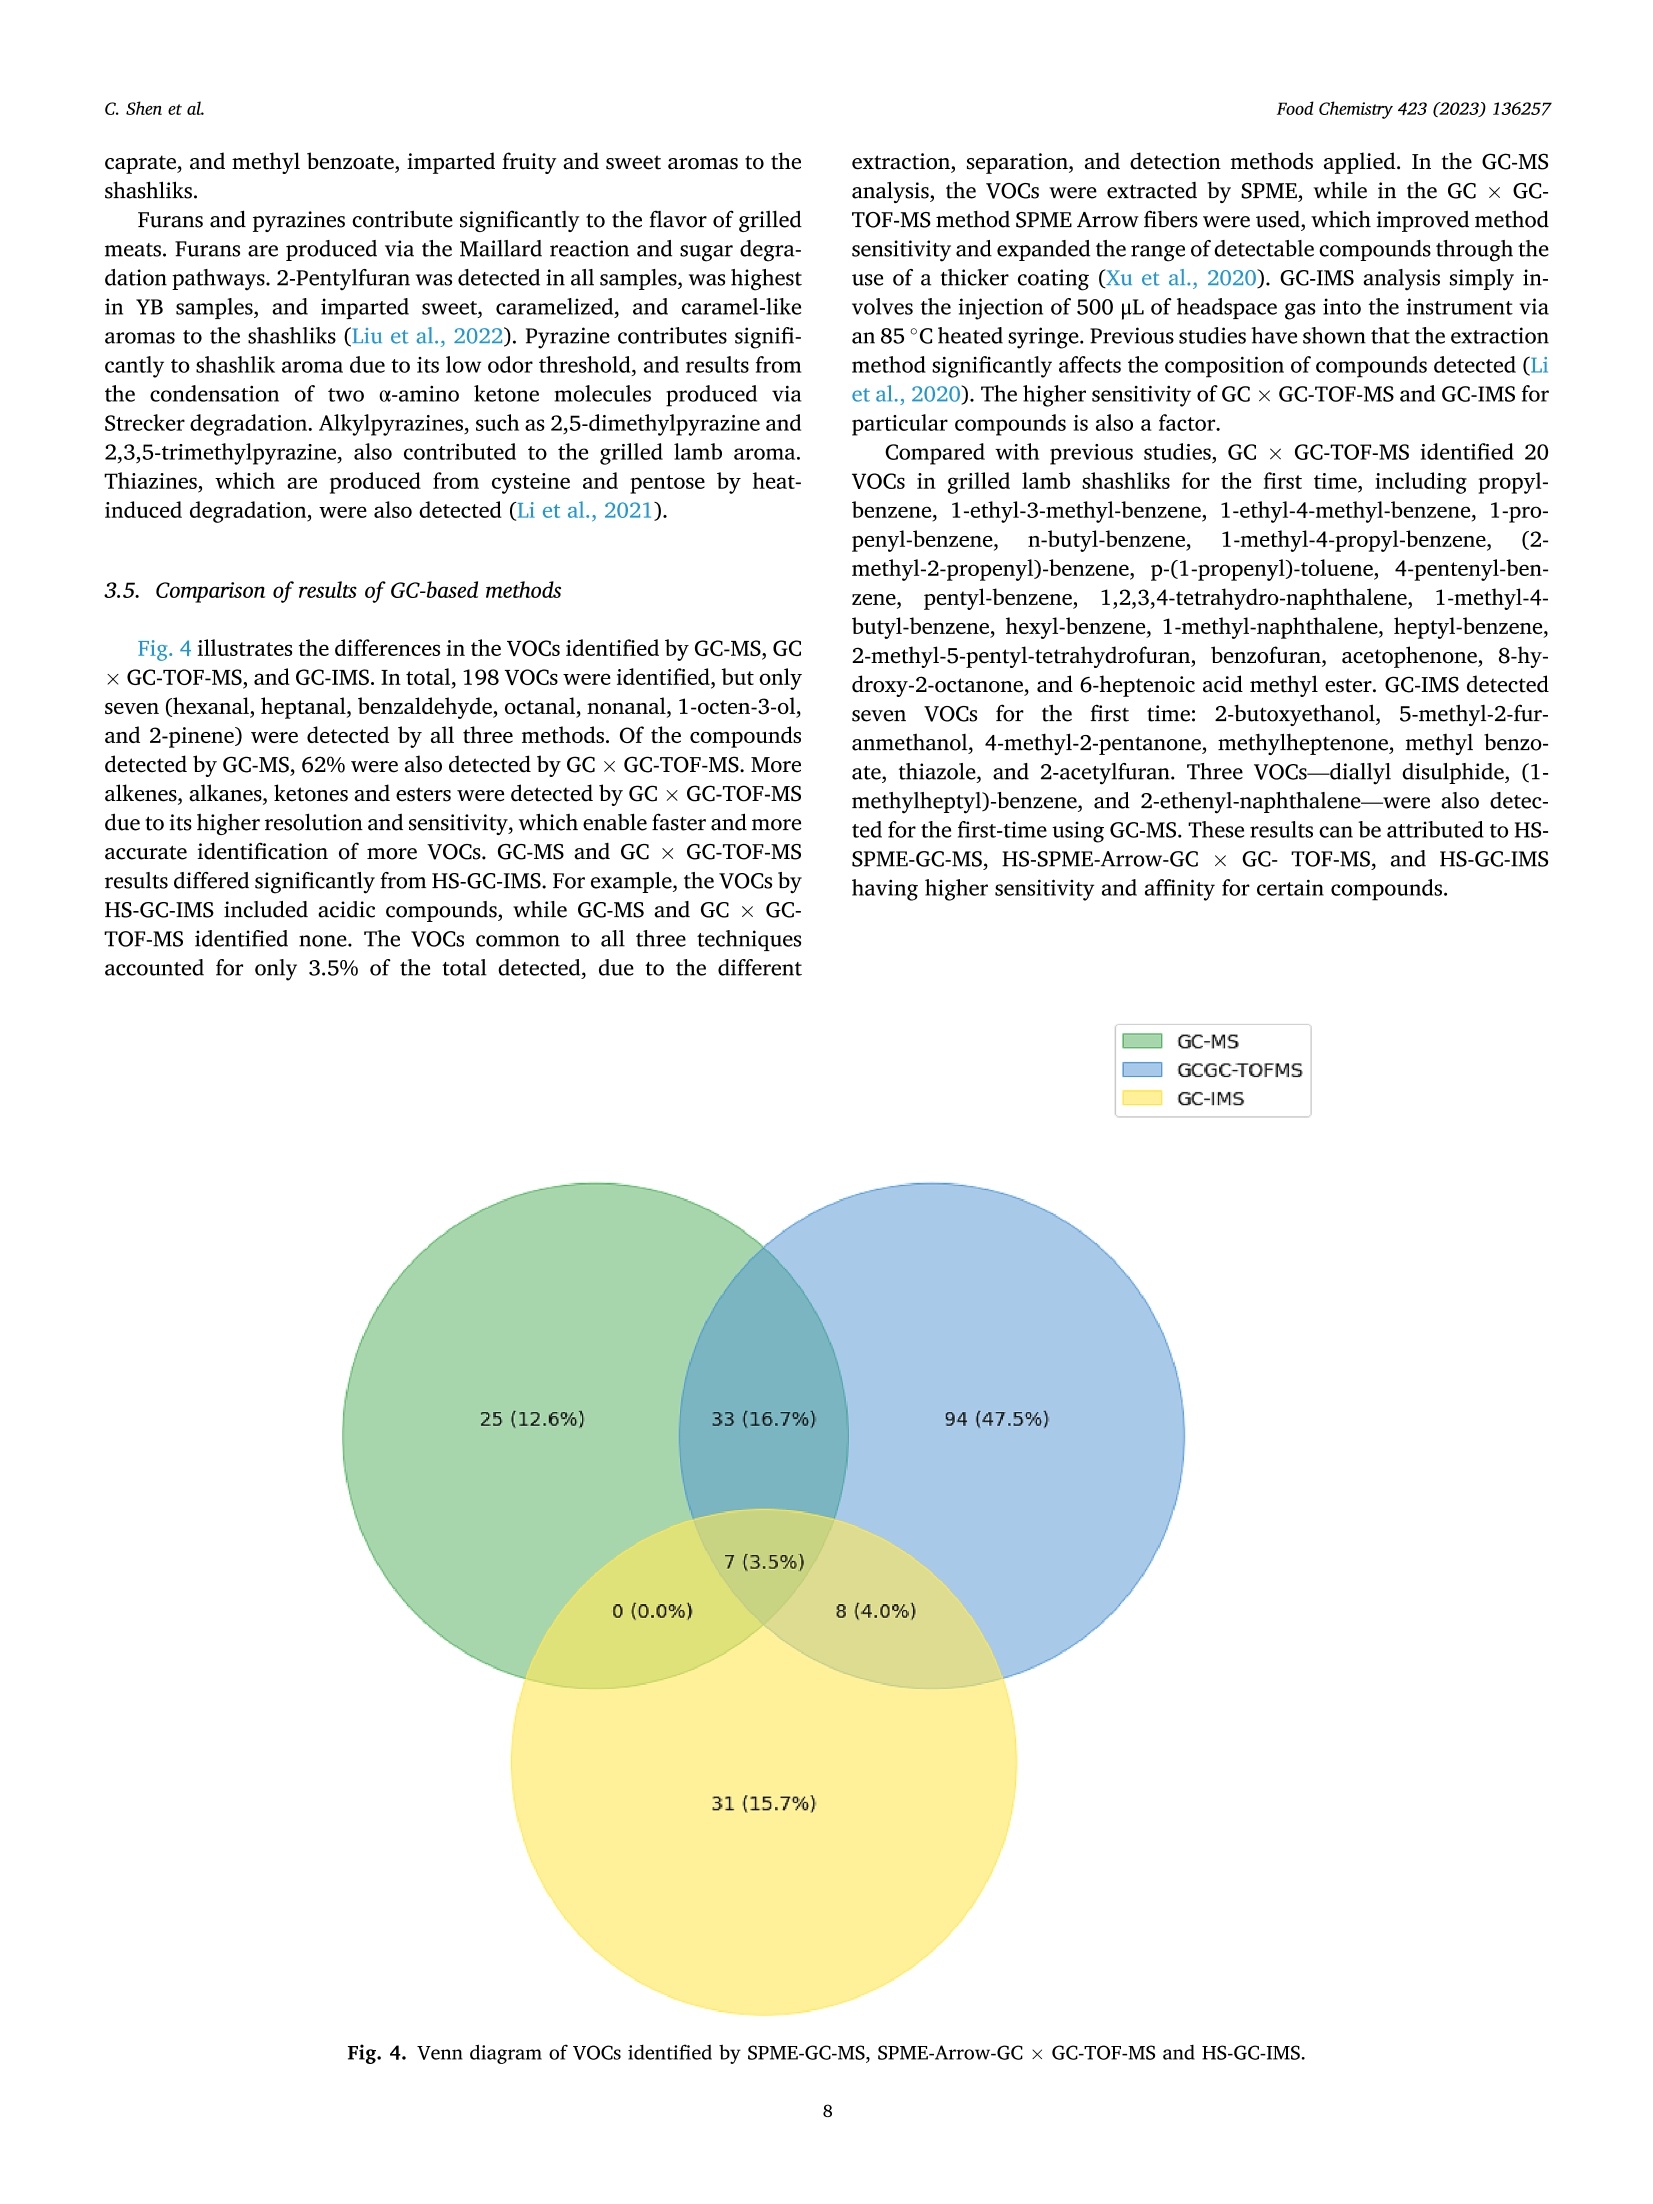
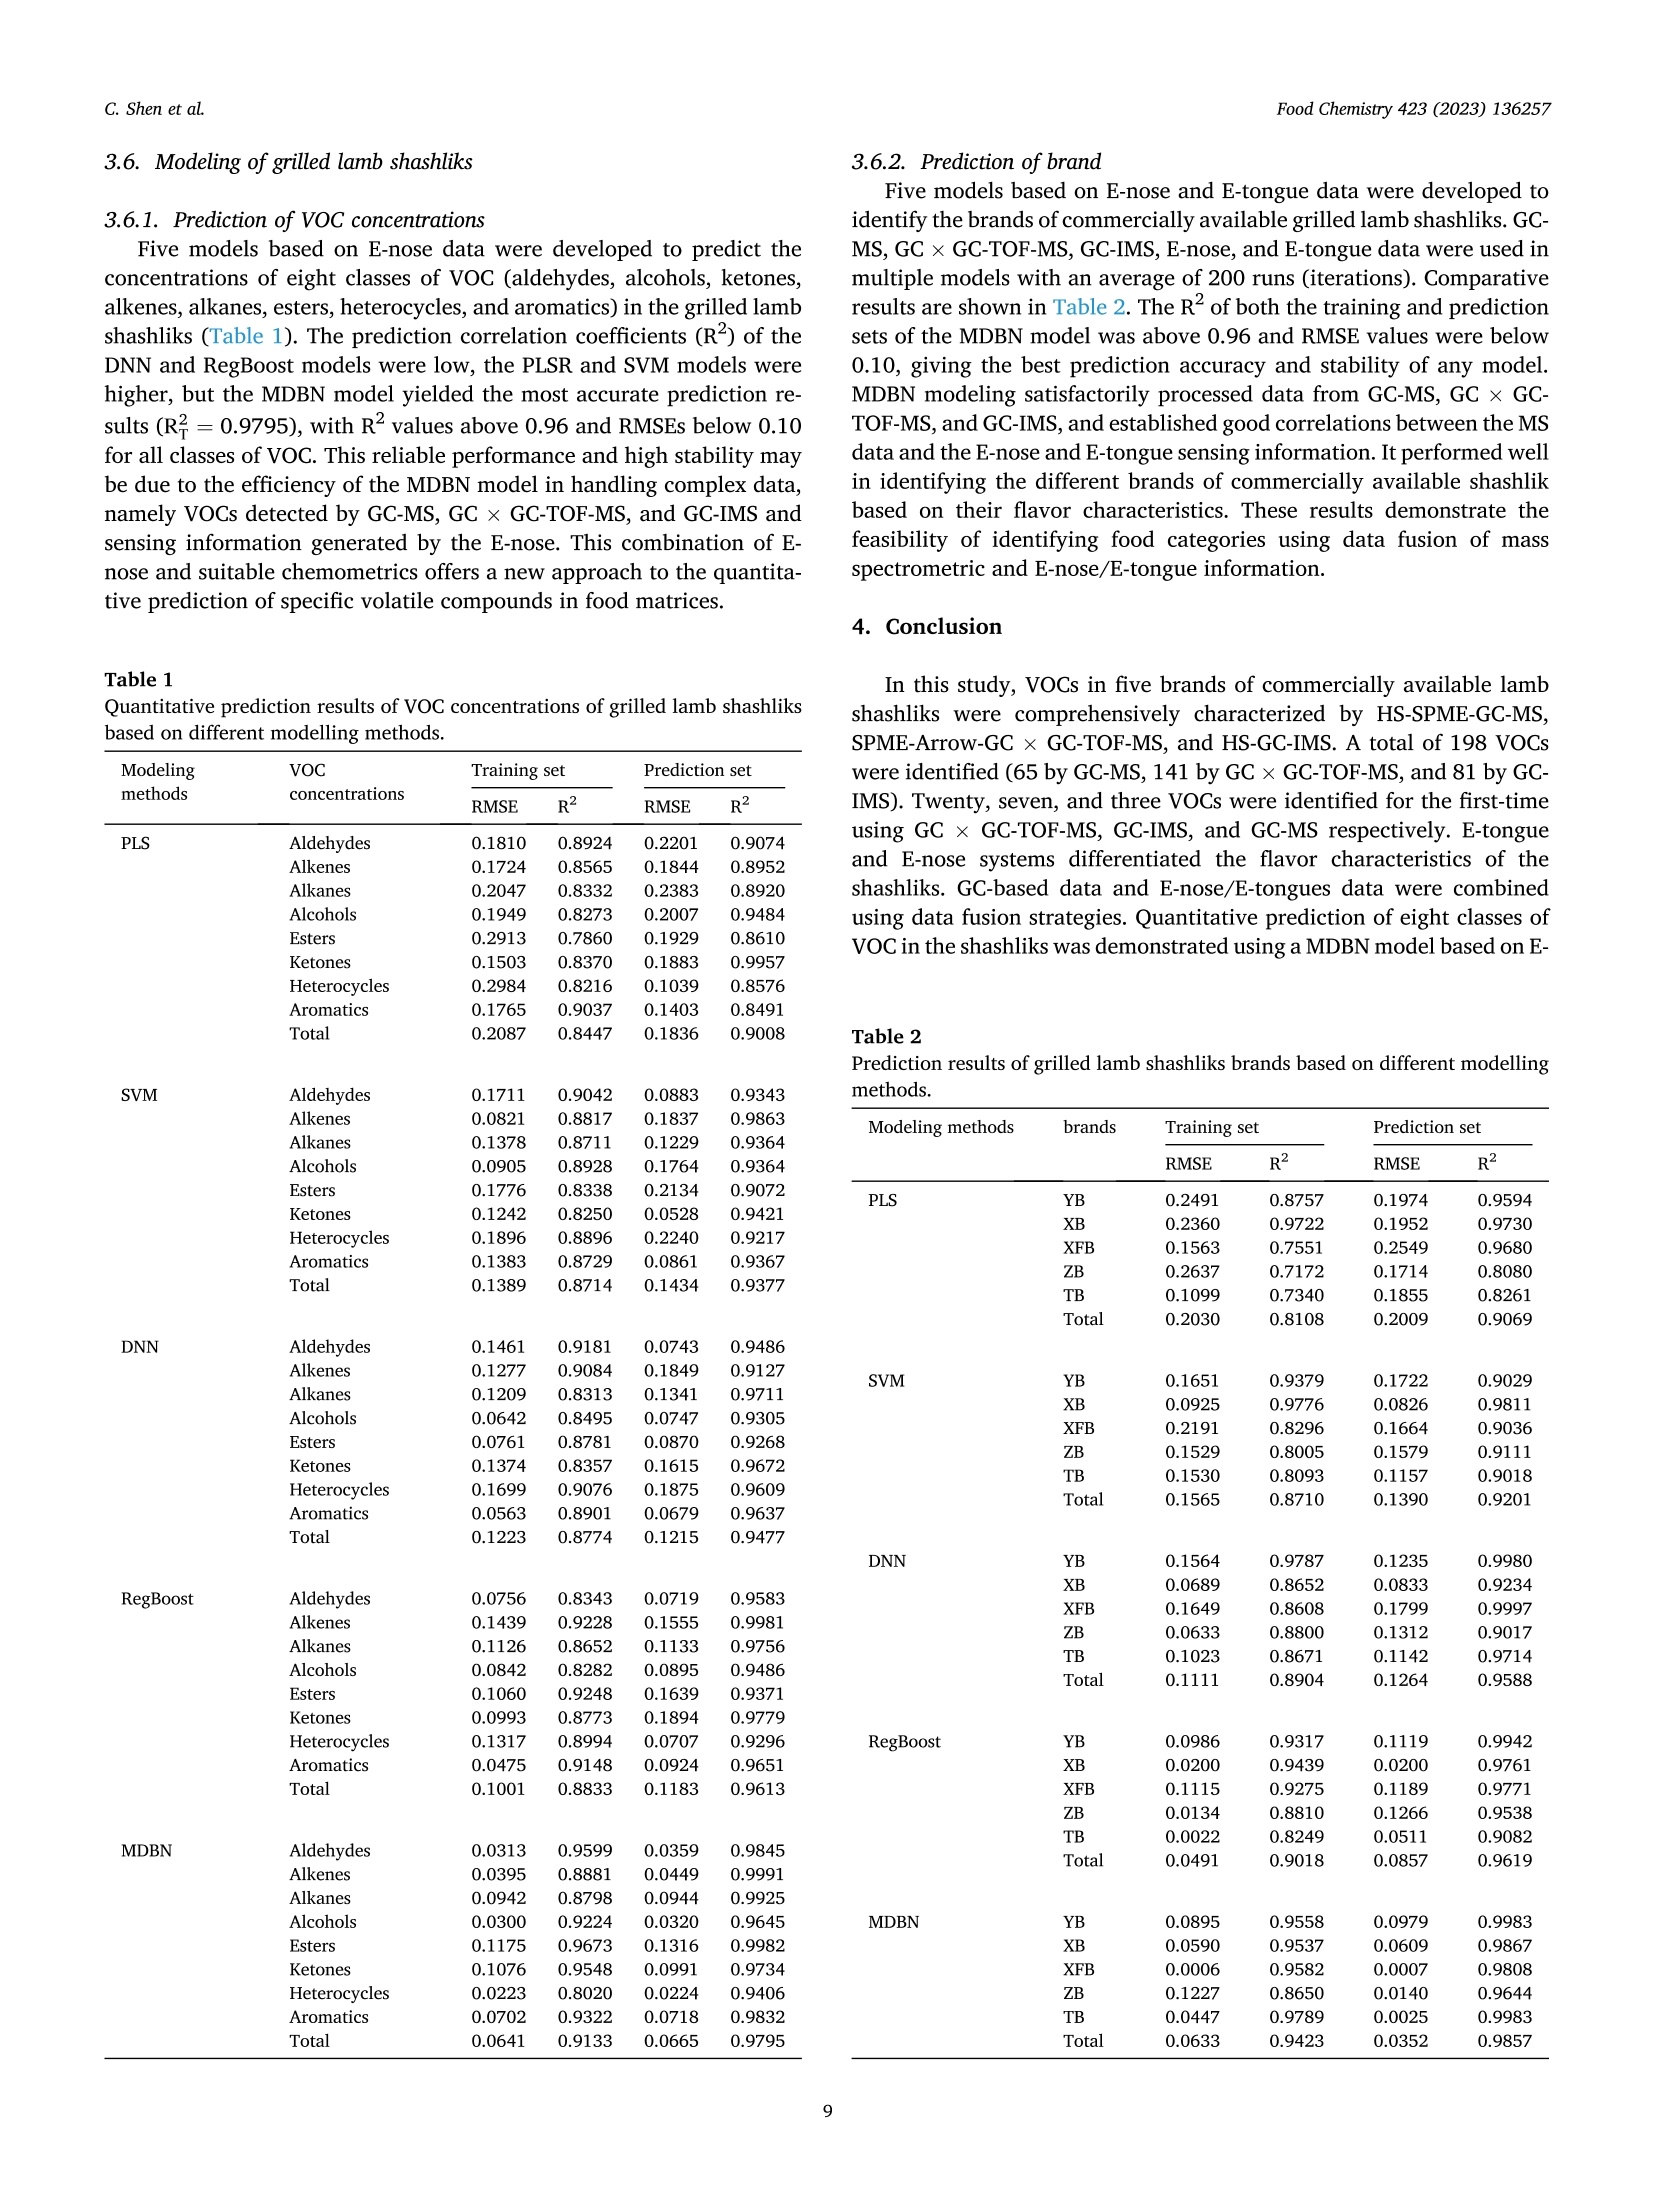
烤羊肉串在中国作为传统食品因其独特的风味和悠久的历史而受到重视,中国拥有庞大、稳定的消费群体和蓬勃发展的烧烤行业。“渤海大学”基于电子鼻和电子舌技术,识别市售烤羊肉串的风味特征。采用 HS-SPME-GC-MS、SPME-Arrow-GC × GC-TOF-MS 和 HS-GC-IMS 分析知名餐厅制作的五种烤肉串,以确定其 VOC 特征,然后使用智能传感技术进行表征。采用混合数据融合策略来提高风味识别的准确性。五种机器学习模型预测VOC的含量以及识别了烤羊肉串的不同品牌。本研究为识别市售烤羊肉串中 VOC 并揭示风味差异提供了有效方法,也为提高此类产品感官质量提供了策略。智能传感技术和化学计量学的结合是食品工业和食品科学家表征和识别产品以及了解和改善烧烤过程中风味属性的一种有前途的方法。Characterization of selected commercially available grilled lamb shashliks based on flavor profiles using GC-MS, GC × GC-TOF-MS, GC-IMS, E-nose and E-tongue combined with chemometrics发表期刊《Food Chemistry》(Q1,IF: 8.8),发表单位:渤海大学主要检测仪器:日本INSENT电子舌 ,德国AIRSENSE电子鼻等 研究结论:1、采用 HS-SPME-GC-MS、SPME-Arrow-GC × GC-TOF-MS 和 HS-GC-IMS 对 5 个品牌的市售羊肉串中的挥发性有机化合物进行了全面表征。总共鉴定出 198 种挥发性有机化合物(GC-MS 鉴定出 65 种,GC × GC-TOF-MS 鉴定出 141 种,GC-IMS 鉴定出 81 种)。2、GC×GC-TOF-MS首次鉴定出烤羊肉串中的20种挥发性有机化合物,包括丙苯、1-乙基-3-甲基苯、1-乙基-4-甲基苯、1-丙烯基-苯、正丁基苯、1-甲基-4-丙基苯、(2-甲基-2-丙烯基)-苯、对(1-丙烯基)-甲苯、4-戊烯基苯、戊基苯、1,2,3,4-四氢萘、1-甲基-4-丁基苯、己基苯、1-甲基萘、庚基苯、2-甲基-5-戊基四氢呋喃、苯并呋喃、苯乙酮、8-羟基-2-辛酮和6-庚烯酸甲酯。GC-IMS首次检测到7种挥发性有机化合物:2-丁氧基乙醇、5-甲基-2-呋喃甲醇、4-甲基-2-戊酮、甲基庚烯酮、苯甲酸甲酯、噻唑和2-乙酰呋喃。 GC-MS 还首次检测到了三种挥发性有机化合物:二烯丙基二硫化物、(1-甲基庚基)-苯和 2-乙烯基萘。3、使用数据融合策略将基于GC方法的数据和电子鼻、电子舌数据相结合。基于电子鼻数据,使用MDBN模型对市售羊肉串中八类挥发性有机化合物进行了定量预测,准确率均高于0.96。结合电子鼻、电子舌和基于GC方法的数据,基于羊肉串风味特征,MDBN模型以高精度(所有准确率均高于0.96)和稳定性(所有RMSE均低于0.10)识别了市售烤羊肉串的品牌。Food Chemistry 423 (2023) 136257Contents lists available at ScienceDirect C. Shen et al.Food Chemistry 423 (2023) 136257 Food Chemistry journal homepage: www.elsevier.com/locate/foodchem Characterization of selected commercially available grilled lamb shashliks based on flavor profiles using GC-MS, GC × GC-TOF-MS, GC-IMS, E-nose and E-tongue combined with chemometrics Che Shen , Yun Cai , Xinnan Wu , Shengmei Gai , Bo Wang a,c ,*, Dengyong Liu a ,b ,* a College of Food Science and Technology, Bohai University, Jinzhou 121013, China DJiangsu Collaborative Innovation Center of Meat Production and Processing, Quality and Safety Control, Nanjing 210095, China “ Key Laboratory of Meat Processing and Quality Control, MOE, Key Laboratory of Meat Processing, MARA, College of Food Science and Technology, Nanjing Agricultural University, Nanjing 210095, China ARTICLEINFO ABSTRACT Keywords:GC-MS GC x GC-TOF -MS GC-IMS Intel l igent sensory technology Gri l led lamb shashliks Machine learning HS-SPME-GC-MS, SPME-Arrow-GC × GC-TOF-MS, HS-GC-IMS, Electronic-nose, and Electronic-tongue systems were applied in a feasibil i ty study of the f lavor characterization of five commercially available Chinese gr i lled lamb shashliks. A total of 198 volatile organic compounds (VOCs) were identified (~71% by GC x GC-TOF-MS).Using data fusion strategies, f ive predictive models were applied to the composition of VOCs and brand iden-t i fication of the lamb shashl i ks. Compared with partial least squares regression, support vector machine, deep neural network, and RegBoost modeling, a momentum deep be l ief network model performed best in predicting VOCs content and i dentifying shashlik brands (R’ above 0.96, and RMSE below 0.1). I ntelligent sensory tech-nology combined with chemometrics is a promising approach to the flavor characterization of shashliks and other food mat r ices. 1. Introduction Gri l led lamb shashliks are valued for their unique flavor and long history as a tradi t ional food in China where there is a large, stable consumer base and a booming barbecue industry (W ang e t al., 2023).Gri l l ing meat over burning charcoal produces rich f lavor compounds and unique sensory characteristics (Pet ric ev ic et a l., 2018). Volatile organic compounds (VOCs) in grilled lamb shashliks are mainly alde-hydes, ketones, and alcohols derived from protein hydrolysis and lipolysis (Liu et al ., 2021). Aroma and flavor are the most important sensory characteristics of a food product and greatly influence consumer preference and accep-tance. Precision instrumentation for food flavor analysis is constantly improving. Intel l igent sensory technologies, such as the E-nose, can mimic the human olfactory system and identify a wide range of smells. It can be used to characterize the complete volatile compounds profile of a sample and has greatly improved the analysis of food aroma. The E-tongue converts the taste of food into electrical signals, has a low sensitivity threshold, and avoids the subjectivity of sensory evaluations (J ia ng e t a l ., 2018). Gas chromatography-mass spectrometry (GC-MS) is the most commonly used technique in food f lavor analysi s because of i ts strong qualitative and quantitative capabilities (L i u e t a l ., 2020). How-ever, advanced analytical platforms are required to differentiate low concentration flavors in highly complex food samples. Comprehensive two-dimensional gas chromatography-mass spectrometry-time-of-flight -mass spectrometry (GC x GC-TOF-MS) offers superior separation, high selectivity, and enhanced resolution and is a powerful analytical tool for such tasks (Sc hwa n z e t al., 2019). Gas chromatography-ion mobil i ty spectrometry (GC-IMS) is a newer analytical technique that operates at ambient pressure and temperature and offers low detection limits, good Abbreviations: HS, headspace; SPME, solid phase micro extrac t ion; GC-MS, gas chromatography-mass spectrometry; GCxGC-TOF-MS, comprehensive two-dimensional gas chromatography-time-of-flight mass spectrometry; HS-GC-IMS, headspace-gas chromatography-ion mobi l ity spectrometry; VOC, volatile organic compound; SVM, support vector machine; PLSR, Partial least squares regression; DNN, Deep neural network; MDBN, Momentum Deep Belief Networks; E-nose,electronic nose; E-tongue, electronic tongue. * Corresponding authors at: College of Food Science and Technology, Bohai University, No. 19, Keji Rd., New Songshan District, Jinzhou 121013, Liaoning Province, China. E-mail addresses: d a q ingwb@163.co m (B. Wang),j z _d yli u @126.c o m (D. Liu). h t tp s ://doi .or g/10.1016/j .f o o d ch em .2023.136257 Received 28 January 2023; Received i n revised form 29 March 2023; Accepted 25 April 2023 Available online 3 May 2023 selectivity, and the potential for miniaturization. It has been used to visualize differences between samples as colored profile images (L i u et al., 2020; W a ng et al., 2021; Y ao et a l ., 2022; Zh u et a l., 2022). Given the compositional complexity of most food matrices, a popular analyt-ical strategy is data fusion, which combines data from complementary instrumental techniques and can yield more information and generate more reliable inferences than a single technique (Zh o u et a l., 2022).Data fusion methods can be divided into early, late, and hybrid strate-gies according to the way mult i modal i nputs are combined. The ear l y fusion strategy, also called feature-level f usion, usually relies on gener i c models to learn the representative features, then simply integrates the extracted features by concatenation or weighted combination. Late fusion strategies independently devise one classifier for each modality and aggregate the outputs of each classi f ier by averaging, weighted summing, or voting. Hybrid fusion strategies combine the advantages of early and late fusions based on unimodal predictions and normally outperform both (Zha ng et al., 2022). Hybrid fusion strategies are mainly used to solve classification problems. Data fusion analysis has been successfully applied to the analysis of many matrices, including coffe e , Chinese honey, edible oils, and red meat. Combinations of i nstruments have recently been used to study food flavor profiles because they yield more comprehensive and reliable data.The objective of this study was to develop a method using E-nose and E-tongue technologies to ident i fy commercially available grilled lamb shashliks based on their flavor profiles. Five shashliks prepared by established restaurants were analyzed by HS-SPME-GC-MS, SPME-Arrow-GC× GC-TOF-MS, and HS-GC-IMS to determine their VOC pro-files, then characterized using intelligent sensory technologies. A hybrid data fusion strategy was applied to improve the accuracy of flavor identification. Five machine learning models were evaluated for the prediction of VOCs and the identification of the brand . 2. Materials and methods 2.1. Sample preparation Gr i lled lamb shashliks were purchased f rom the following five res-taurants (brands) in Jinzhou, Liaoning Province, China (al l were l isted i n the top 10 BBQ restaurants in the area): Jinzhou Yu Barbecue (YB),Jinzhou Xiaobo Barbecue (XB), Jinzhou Xiaoguo Fengzhao Barbecue (XFB), Jinzhou Zhaoming Barbecue (ZB), and Jinzhou Tangjitou Barbecue (TB). The experiment was a completely randomized design.Shashliks were prepared from the meat of 24 different six-month-old Sunit breed of sheep (31.5 ±1.5 kg carcass weight) that had been fed the same diet (cereal and silage) and had the same genetic background.Sheep were randomly selected from the Xilingol League Yangyang Husbandry Co. (Xilingol League, Inner Mongolia, China) and were slaughtered in one day on the commercial slaughter li ne. As per Chinese National Standard protocol GB 2707-2016, the longest section of lean backbone and tail fat were removed after slaughter. The meat and fat samples were then aged for 48 h at 0-4C, and, using traditional cold chain logistics, were frozen at -20 °C and transported to Jinzhou,Liaoning, China. In accordance with the Chinese agricultural industry standard NY/T 3469-2019, the lean and fatty meat was cut into cubes of approximately 2 cm(2×1×1) after removing the surface fat. All the shashl i ks were charcoal grilled at 250 °C for 10 min, with core and surface temperatures in the ranges 79 ±1.2 °C and 90 ± 3.4°C,respectively. A total of 60 lamb shashliks were made in each barbecue restaurant and divided into 5 groups of 12 lamb shashliks each. Three lamb shashl i ks were randomly selected from each group for instru-mental analysis (E-nose, E-tongue, GC-MS, GC xGC-TOF-MS,GC-IMS),for a total of 75 experimental units. They were frozen in nylon/poly-ethylene (9.3 mL O"/m²/24 h, o℃, 0.19 mm thick, Magic Seal@,Guangdong, China) in liquid nitrogen and stored at -80°C until the instrumental analysis was conducted. 2.2. Chemicals n-Alkanes (C8-C20, ≥ 98%) were purchased from TCI (Shanghai,China), as were pentanal (98%), hexanal (99%), heptanal (95%), octa-nal (99%), nonanal (98%), benzaldehyde (99%), h exanol (99%), ethyl hexanoate (98%), naphthalene (95%), 1-octen-3-ol (99%), D-limonene (99%) (E)-2-decenal (97%), (E)-2-heptenal (97%), (E)-2-octenal (98%),(E)-2-nonenal (99%), (E,E)-2,4-nonadienal (99%), (E,E)-2,4-decadienal (97%), and 2,5-dimethylpyrazine (98%). 2-Butanone, 2-pentanone, 2-hexanone, 2-heptanone, 2-octanone, and 2-nonanone were purchased from Sinopharm, while cyclohexanone and ethanol standards (>99.5%)were purchased from Xiya Reagent Co. (Linyi, China). 2.3. E-nose analysis The PEN3 E-nose (Airsense Analytics Co. Ltd ., Schwerin, Germany)incorporates 10 different metal oxide sensors (receptors), each being sensi t ive to a group of compounds. Sensor 1 (W1C) is sensi t ive to aro-matic benzene, sensor 2 (W5S) to nitrogen oxides, sensor 3 (W3C) to aromatic ammonia, sensor 4 (W6S) is mainly selective for hydrogen,sensor 5 (W5C) is sensitive to alkane aromatic compounds, sensor 6(W1S) to short chain alkanes, sensor 7 (W1W) to sulfides and terpenes,sensor 8 (W2S) to alcohols, aldehydes and ketones, sensor 9 (W2W) to organic sulfides and aromatic components, and sensor 10 (W3S) to long-chain alkanes (S h en et a l., 2021). To determine their aroma profiles,gr il led lamb shashl i k (2.0 g) was weighed into a 20 mL headspace sample bot tl e and heated in a 55 °C water bath for 40 min. The E-nose system chamber flow rate was 200 mL/min, the injection flow rate was 200 mL/min, and measurements lasted for 120 s. The chamber was flushed with clean air unti l the sensor response returned to baseline before the next sample was introduced. 2.4. E-tongue analysis Shashlik samples (15 g) were chopped into 500 mL centrifuge tubes and homogenized in 200 mL of distilled water at 40 °C (10,000 rpm, 1min). After centrifugation (4°C, 10,000 rpm, 15 min), the supernatant was f iltered through three layers of gauze and 80 mL of the clarified liquid was cooled to room temperature. The Insent SA402B E-tongue was equipped with single CA0, C00,AE1, CT0, and AAE test sensors and two reference electrodes. Data acquisition time was 120 s, acquisition period was 1.0 s, acquisition delay was 0 s, and the stirring rate was 60rpm. Four cycles were performed for each sample, with the f i rst cycle being discarded. Sensor response was stable and reproducible during the acquisition, and data were considered to be valid. 2.5. Solid-phase microextraction (SPME) VOCs were extracted, separated, and identi f ied according to Q i e t a l .(2017). SPME was used to extract these aroma compounds. The chopped sample (4.5 g) was placed i n a 20 mL headspace vial, 7.0 pL of 1.11 ug/uL cyclohexanone interna l standard was added and the vial was imme-diately sealed with a Teflon spacer and placed in a 55 °C water bath to equilibrate for 15 min. A carboxen-polydimethylsiloxane (CAR/PDMS,75 um) f used s il ica-coated f iber (Supelco, Inc., Bellefonte, PA) was then inserted into the headspace of the vial and i ncubated at 55 °C for 45 min to extract the VOCs. The fiber was then quickly inserted into the GC injection port and desorbed at 250 °C for 3 min. 2.6. GC-MS analysis A GC-MS (Trace 1300-ISQ 7000) equipped with a TP-5 capillary column (30 m x 320 um,0.25 um) (Thermo Fisher Scientific, Waltham,MA, USA) was used for separation and identification of the VOCs. GC used a carrier gas (helium) flow rate of 1.0 mL/min, inlet temperature of 250 C, and the following ramp-up procedure: initial column temperature 35 °C held for 5 min, ramped up to 130 °C at 4°C/min and held for 3 min, ramped up to 200°C at 8°C/min and held for 3 min, then ramped up to 250 °C at 12°C/min and held for 5 min. GC-MS interface temperature was 280 °C, quadrupole temperature was 150 °C, ion source temperature was 230 °C, electron impact (EI) ionization operated at 70 eV, and a ful l scan (m/z 30-550) was performed. VOCs were ident i fied from their mass spectra by reference to the NIST/Wiley MS library and comparison of their linear retention index (LRI) with reference standards (Table S1). LRI was calculated from the retention values of homologous n-alkanes (C8-C20). VOC concentra-tions were calculated from the peak area of the target compound divided by the peak area of the internal standard. 2.7. GC ×GC-TOF-MS analysis VOCs were adsorbed using SPME Arrow fibers (CAR/PDMS, phase thickness 120 um, outer diameter 1.1 mm) that were inserted and des-orbed for 30 s. A GGT 0620 two-dimensional gas chromatography time-of-flight mass spectrometer (Guangzhou Hexin Instrument Co., Ltd.)equipped with a DB-5MS primary column (30 m x0.25 mmx0.25 um)and DB-17 secondary column (1.1m x0.18 mmx0.18 um) was used for analysis. The front inlet temperature was 250 °C and the sample was injected without splitting. The carrier gas was hel i um, and the flow rate was 1 mL/min . The initial temperature of 35°C was held for 3 min then ramped up to 270°C at 5°C/min and held for 7 min, then held for 10min at 40 °C. A high-pressure modulation column (1.2 mx0.25mm)was used with a 4 s modulation cycle. The interface temperature was 280 °C and the ion source temperature was 230 °C. MS detector voltage was -1750 V, ionization energy was 70 eV, MS acquisition mass range was 40-500 amu, MS data acquisition rate was 100 spectra/second,and the solvent delay was 3 min. Canvas software was used for 2D data processing and full 2D TIC contour maps were drawn. Peaks with signal-to-noise ratio greater than 10 were identified, with each peak representing a compound. Each compound was determined by a pair of retention times, the first dimensional retention time (min) in the x-axis direction and the second t i me (s) i n the y-axis direction. The VOCs were ident i fied by comparison of their LRI, one- and two-dimensional GC x GC-TOF-MS retention times, and mass spectra with the NIST 17 database. VOC concentrations were calculated from the peak area of the compound divided by the peak area of the internal standard. 2.8. GC-IMS analysis The VOCs were analyzed using HS-GC-IMS (FlavourSpec; G.A.S.Gesellschaft f iir analyt i sche Sensorsysteme mbH, Dortmund, Germany).Samples were incubated at 65°C for 20 min, then 500 uL of headspace was injected into a FS-SE-54-CB-1 capillary column (15 m x0.53 mm,1um) using a syringe heated to 85C and high purity (99.99%) nitrogen as the carrier/drift gas. The gas flow rate program was: 2 mL/min held for 2 min, then linearly increased to 15 mL/min over 10 min, to 100 mL/min over 20 min, and to 150 mL/min over 30 min. Data are the mean of three replicates. IMS data were analyzed from various perspectives using several software packages, including LAV v.2.0.0 (G.A.S. mbH, Dortmund,Germany), Reporter , Gallery Plot, and GC-IMS Library Search. The identified VOCs were characterized using the NIST library and IMS database search software from G.A.S. in combination with retention indices and drift times. 2.9. Data processing Each dataset was divided into 70% for model training and 30% for data prediction. The performance of each model was evaluated using the root mean square error (RMSE) and the correlation coef f icient (R).R reflects the correlation between the predicted and measured values in the calibration or prediction sets, and RMSE reflects the deviation of the predicted values from the measured values in the calibration and pre-diction sets. Generally, the closer R" is to 1, t he smaller t he RMSE and the higher the accuracy and stability of the model (He et al ., 2021). 2.9.1. Data fusion strategy Data fusion is the combining of data from different sources. Data fusion strategies are widely used because the information from different assays enables a more comprehensive analysis of sample characteristics and can improve the accuracy of sample ident if ication. Integrating data from GC-MS, GC × GC-TOF-MS, GC-IMS, E-nose, and E-tongue, and formulating appropriate data fusion strategies will optimize the identi-fication of commercially available gri l led lamb shashlik brands based on their flavor characteristics. Data fusion methods can be divided into early,late, and hybrid strategies according to the way mul t imodal inputs are combined. The ear l y fusion strategy, also called feature-leve l fusion,usually relies on generic models to learn the representative features,then simply integrates the extracted features by concatenation or weighted combination. Late fusion strategies independently devise one classi f ier for each modality and aggregate the outputs of each classifier by averaging, weighted summing, or voting. Hybrid fusion strategies combine the advantages of early and late fusions based on unimodal predictions and normally outperform both (Zhang e t a l ., 2022). Hybrid fusion was chosen for this study for combining data derived from GC-based methods, E-nose, and E-tongue. 2.9.2. Data modeling PLSR is a common l i near quantitative analysis model i ng method that minimizes the error sum of squares of a set of data (Gel a d i & Kowalsk i,1986). It combines characteristics of principal component analysis,multiple linear regression, and canonical correlation analysis. SVM as proposed by C o rte s a nd V a p nik (1995) is based on statistical learning theory and is commonly used for classification and regression analysis. The SVM procedure allows n-dimensional input vectors in a high-dimensional feature space formed by nonl i near mapping to be fitted to a K-dimensional feature space with functions when K> n. Its advantages include good generalization ability, global optimal solu-tions, and solving nonlinear problems. DNNs were developed by Hi nt o n (2007) to alleviate the local optimal solution problem by using pre-training methods to push the hidden layer to seven layers, giving the neural network a greater sense of depth. DNNs can reuse features computed in a hidden layer i n higher hidden layers.This allows DNNs to exploit the combinatorial structure in functions and to approximate many natural functions with fewer weights and units.While shallow neural networks must piece together thei r approximated functions just like lookup tables (although these parts overlap and sum),DNNs can benefit from their hierarchical structure. A deeper hierarchy can improve t he accuracy of approximating f unctions on a fixed parameter budget and can i mprove generalization after learning new examples. RegBoost is an algorithm proposed by Li et a l. (2020) that uses multiple l inear regression as a weak predictor. It uses the current weak predictor to divide the training data into two branches based on the prediction results and combines all linear regression predictor variables to achieve nonlinear regression prediction. RegBoost achieves similar performance to gradient-boosted decision trees with lower resource overhead costs and better performance on some decision tasks. Momentum deep belief networks (MDBN) are deep confidence network models based on adaptive variational mode decomposi t ion (AVMD) proposed by J i n et al. (2020). This model has advantages over other deep confidence network models because of its enhanced feature learning ability, which makes it more interpretable for regression tasks.A s i ngle dataset i s decomposed into a specified number of sub-datasets using AVMD. These are then distributed among a number of improved MDBNs. The single raw dataset learning model and algorithm are extended to multiple feature extraction nodes to learn the features of mul t iple sub-datasets in paral l el. Finally, the results from mul t iple nodes are transferred to the main feature extraction node to complete the regression computation. 2.10. Statistical analysis Results are expressed as mean ± standard deviation (n =3). Differ-ences between means were determined using ANOVA and least signif i-cant difference (LSD) tests using SPSS 26.0 software (SPSS Inc., USA), as was principal component analysis (PCA). Radar maps were drawn using Origin 2022 software (OriginLab Co., Northampton, MA, USA). PCA,PLSR, SVM, DNN, RegBoost, and MDBN analyses were performed in Python 3.7.3. 3. Results and discussion 3.1. E-nose and E-tongue The response of the E-nose to the shashliks i s shown i n F i g . 1a. Re-sponses were strong from the W1W (sensitive to sulfides and pyrazines),W2W (organic sulfides), W5S (nitrogen oxides), W2S (alcohols, alde-hydes, and ketones), and W1S (methyl groups) receptors, suggesting that charcoal-grilled lamb shashliks contain high levels of alcohols, al-dehydes, ketones, sulfides, and pyrazines. However,the signal intensi t ies varied between samples. The YB sample had the strongest response at W1W (other sample responses being XB > XFB> TB>ZB),indicating that the shashl i k from YB contained more sulfur-containing compounds . Responses from W3S (sensitive to long-chain alkanes),W6S (hydrides), W1C (aromatic components, benzene), W3C (aroma,ammonia), and W5C (alkenes, short-chain aromatic compounds) were less variable. The E-nose system effectively identi f ied the characteristic aromas of the various samples. The shape of the radar plot indicates that the aroma profiles of the five shashliks were similar, but the intensities and ratios of the various volatile gases varied widely. The spatial distribution and distance of grilled lamb shashlik aroma were analyzed by PCA (F i g . 1b). The contribution of the first two prin-cipal components to the cumulative variance was as high as 98%,meaning that they covered the vast majority of information for all samples (PC1 81.0%, PC2 17.0%). The differences between the shashliks were mainly around PC1, with the E-nose completely separating the five sample groups. Each brand of lamb shashl i k occupied a distinct aroma region. YB, XB, and XFB samples were clustered on the positive PC1 axis and correlated with the W1S, W2S, W3S, W6S, W1W, and W2W sensors,while ZB and TB samples were clustered on the negative PC1 axis and correlated with the W1C, W3C, W5C, and W5S sensors, suggesting that the E-nose sensors can successfully distinguish between commercially available brands of grilled lamb shashlik. Differences in taste characteristics were evaluated using the E- d) Afte r ta s te-A Fig. 1. Radar chart (a) and princ i pal component analysis (b) of E-nose data for gril l ed lamb shashl i ks with different brands. Radar chart (c) and principal component analysis (d) of E-tongue data for grilled lamb shashliks with different brands. tongue. F ig . 1c shows the responses for bitterness, saltiness, astringency,sourness, aftertaste-B, aftertaste-A, richness, and umami. Umami and salt i ness responses were highest in YB samples, followed by XB. Sour-ness was highest in ZB. Richness, aftertaste-A (astringency), aftertaste-B (bitterness), astringency, and bitterness showed no significant differ-ences between samples. The PCA plot of E-tongue taste differences is shown i n F i g . 1d. PC1(57.3%) and PC2 (30.6%) accounted for 87.9% of the cumulative cont r ibution and can reflect the overall characteristics of the samples.XFB, ZB, and TB shashliks were clustered on the negative PC1 axis associated with sourness, bitterness, and aftertaste-B. YB and XB shashliks clustered on the positive PC1 axis associated with other taste sensors. XB and YB samples were close to each other, probably due to their similar saltiness, umami , and aftertaste-A responses. 3.2. VOCs identified by GC-MS and GC × GC-TOF-MS Tab le s S1 and S2 list the VOCs identified by GC-MS and GC × GC-TOF-MS,respectively. A total of 65 VOCs were identified by GC-MS. YB,XB, XFB, ZB, and TB samples contained 55, 43, 48, 56, and 46 VOCs,respectively. Of these, 15,14, 13,17, and 14 were aldehydes; 15,14,15,16, and 14 were alkenes; 7, 6, 8, 9, and 8 were alkanes; 3,2, 3, 4, and 3were alcohols; and 9, 7, 6, 7,and 6 were aromatics, respectively. A total of 141 VOCs were identified by GC × GC-TOF-MS -twice as many as GC-MS, i ts higher resolution and sensitivity enabling faster and more accurate identification of more compounds (Wa ng et a l., 2021).These VOCs comprised 15 aldehydes, 46 alkenes, 21 alkanes, 16 alco-hols, 7 esters, 10 ketones,6 heterocycles, and 20 aromatics. Ninety-eight compounds were identified i nnYB samples (total concentration 118959.79 ng/g). Similarly, 96 compounds were also identified in XB samples (total concentration 117000.62 ng/g). Totals of 109,110,and 96 compounds were ident i fied in XFB, ZB, and TB samples (81039.35ng/g,84086.12ng/g and 110158.9 ng/g, respectively). Similar numbers of VOCs were detected within a given sample group, but there were significant differences between the groups. There is close agreement between the GC × GC-TOF-MS and E-nose results, confirming the sig-nificant differences in aroma characteristics between the five brands of shashlik. It has been reported that aldehydes are dominant aroma compounds in roasted lamb (L i u e t a l ., 2022). Aldehydes were detected at high concentrations in all the grilled lamb shashliks. The total alde-hyde concentrations in YB, XB, XFB, ZB, and TB samples were 49311.68ng/g, 44902.67 ng/g,30922.81 ng/g,22865.23 ng/g, and 26528.21 ng/g, accounting for 41.5%, 38.4%,38.2%,27.2%, and 24.1% of their total VOCs, respectively. 3.3. VOCs identified by HS-GC-IMS GC-IMS analysis detected 81 signals (F i g . 2b and T a bl e S3). The retention index of each VOC was calculated based on retention time and drift t i me, using the n-ketones C4-C9 as external reference standards,and matching with the VOCs GC-IMS library. Each characterized VOC is marked with a number in F ig . 2a. Eighty-one monomers and dimers were characterized, including 19 aldehydes, 4 alkenes , 17 alcohols, 15ketones, 8 acids, 8 esters, 7 heterocycles, and 1 sulfur compound.Notably, aldehydes were the main chemical class identified by GC-IMS,accounting for 23.5% of al l compounds detected. Fi g . 2b and Ta bl e S3 show that some compounds exhibited multiple signals (monomers and dimers) due to the i ncorporation of i onic and neutral molecules (Li e t a l., 2019). 3-Methylbutyraldehyde, pentanal,hexanal , furfural, methional, heptanal, benzaldehyde, octanal, nonanal,2-pinene, limonene, 2-methylbutanol, n-pentanol, n-hexanol, 2-butox-yethanol, 2-hexen-1-ol, 5-methyl-2-f uranmethanol, eucalyptol, 2-buta-none, 2-pentanone, 3-hydroxy-2-butanone, 4-methyl-2-pentanone, 2-hexanone, 2-heptanone, 2-methylbutanoic acid, butanoic acid, ethyl acetate, propy l acetate, methyl caproate, methyl benzoate, 2-ethylfuran,2-acetylfuran, and y-butyrolactone exhibited monomers and dimers with similar retention t imes but different drift times (for example,RtHeptanal monomer =361.39, RtHeptanal dimer = 361.19; DtHeptanal monomer = 1.33, Dt Heptanal dimer =1.7). GC-IMS difference images compare the five brands of shashlik (F ig . 2a). The YB spectrum was used as a reference for comparison with the other samples. Each point in the graph represents a VOC and con-centration is indicated by color (white corresponding to low concen-trations, red to higher). In the drift time range of 1.0-1.5 ms, the concentration of VOCs in YB was higher than in XB, XFB, ZB, and TB.The yellow and red areas show there were significant differences in the classes and concentration of VOCs in the various samples, which is consistent with the GC-MS and GC x GC-TOF-MS results. Three-dimensional spectra of VOCs in the shashliks are shown in F i g . 2c. To compare differences between brands, XB, XFB, ZB, and TB samples were compared against YB as a reference. The original background color faded to white after deduction. A red dot signifies a VOC concentration is higher than in the reference, while a blue dot signifies the concentration is lower. The VOCs in the extracted spectra were used to establish fingerprint profiles for a comprehensive visual comparison of the VOCs in the five brands of shashlik (F i g. 3). Each row represents the signal peak of one sample, while each column represents the same volatile component in other samples. Colors represent the concentration of a volatile com-pound-the brighter the color, the higher the concentration. The VOCs differ significantly between brands. VOCs common to all samples include pentanal, nonanal, octanal, hexanal, heptanal , benzaldehyde, 3-hydroxy-2-butanone, 2-heptanone, 2-butanone, 6-methyl-5-hepten-2-one, 3-methylbutyraldehyde, methional, pentanol, y-butyrolactone,ethyl acetate, 2-pinene, and 1,8-cineole. The higher intense signals of the YB samples include methyl hexanoate, furfural, butanoic acid, 2-butoxyethanol, 5-methyl-2-furanmethanol, 2-acetylfuran, 2,3,5-trime-thylpyrazine, 2-methylbutanoic acid, propanoic acid, pentanoic acid,and 2-pentanone. Concentrations of butanol, propyl acetate, 2-hexa-none, butanoic acid, methional, 4-methyl-2-pentanone, and acetic acid were higher in the XB samples than in other brands. Furfural, 2-ethyl-furan, 2-hexen-1-ol, thiazole, and 2-methylbutanoic acid were higher in XFB samples than in other samples. Hexanol , pentanol, 2,6-dimethyl-pyrazine, y-butyrolactone, and 5-methyl-2-furanmethanol were higher in ZB samples than i n other samples. 2-Methylbutanol was highest in TB samples. 3.4. Analysis of VOC profiles obtained by GC-based methods Differences in the classes and concentrations of VOCs detected by the three GC-based methods may be due to the different sampling and detection techniques employed. Shashliks from YB had the highest content of aldehydes, followed by XB, XFB, TB, and ZB samples (Tables S 1 an d S2). Aldehydes are the main degradation products of lipid oxidation (Vi da l e t a l., 2020). Some are also produced during Maillard reaction-induced degradation of amino acids and are the main contributors to the characteristic f lavor of grilled meat due to their low odor thresholds (Res con i et al., 2012; Nar sa iah et al., 2020). Pentanal,hexanal, heptanal, benzaldehyde, octanal , nonanal, (E)-2-nonanal,decanal, (E)-2-decanal, 4-isopropylbenzaldehyde, 2-caren-10-al, 1,4-p-menthadien-7-al, undecanal, dodecanal, and tetradecanal were present in all five shashlik samples. YB and XB samples had high concentrations of hexanal, which is the dominant VOC in cooked lamb (M e i n e rt et al.,2007) and originates from oleic, linoleic and arachidonic acids and the Maillard reaction (B i l ler e t a l ., 2016). It contributes to the fatty, fruity,and grassy aromas of grilled lamb shashliks (D om inguez et a l., 2014b ).Among t he other straight-chain aldehydes, pentanal was abundant in YB and ZB samples, heptanal and nonanal in YB and XB samples, and octanal in YB and XFB samples. Decanal was most abundant in YB samples. (E)-2-decanal was highest in XFB and TB samples (T a b le S 1)but was detected by GC ×GC-TOF-MS in low amounts in al l samples (Table S 2). Pentanal and heptanal are mainly derived from li pid b) c) Retention tim e(s) >Y YB XB XFB ZB Migra tion t ime(m s) T B 一、 Fig. 2. Fingerprints of five commercially available grilled lamb shashl i ks, obtained with GC-IMS. (a) Topographic plots. The vertical coordinate represents the retention t i me of gas chromatography, and the horizontal coordinate represents the ion migration t ime. The background of the figure is blue, and the red vertical l ine at abscissa 1.0 is the RIP peak (reactive ion peak, after normalization). Each point on both sides of the RIP peak represents f lavor substances. The color represents the content of a vola-tile component. White represents a lower content while red represents a higher content. (b) Ion spectrum of grilled lamb shashlik. The f igures i n the figure are the qualitative out VOCs. (c) Three-dimensional topographic map. (For interpretation of t he references to color i n t his figure legend, the reader is referred to the web version of this article.) Fig. 3. Dynamic fingerprints of five commercially available grilled l amb shashliks, generated by Gallery Plot . Each row represent s the signal peak of one sample while each column r epresents the same VOC in different samples. Colors represent t he content of a VOC, and the brighter the color is, the higher the content. oxidation and Strecker degradation of amino acids (D o ming ue z et a l .,2014b ), producing fermented and pungent fatty aromas, respectively (B a s sa m et al., 2022). Pentanal is also abundant in roasted meat (B i ller et a l., 2016). The rapid oxidation of unsaturated fatty acids when heated generates free radicals that attack other less sensitive fatty acids,including oleic acid, leading to the production of octanal and nonanal (Domi n guez e t al .,2014b ). Octanal has a fruity, green aroma, while nonanal produces rose, citrus, f atty and grassy aromas and is considered an important meat flavor compound (Doming u e z et al., 2014a ; Xi et a l .,2018). Pentanal, hexanal, heptanal , octanal, nonanal, (E)-2-nonenal,and benzaldehyde are all major volatile compounds in roasted lamb,probably due to their generally low odor thresholds and higher con-centrations than other lipid-degrading compounds (L iu et al ., 2022; Qi e t a l., 2022). Furfural, phenylacetaldehyde, and (E, E)-2,4-heptadienal can be formed under the influence of high heat (Ch o e t al ., 2005),such as the charcoal grilling used to prepare lamb shashliks. Similarly,the degradation of L-phenylalanine can generate phenylacetaldehyde (V ar l e t et a l ., 2007). 3-Methylbutyraldehyde has a sour, unpleasant odor that may contribute to the gamy odor of gri l led lamb shashliks. 4-Isopro-pylbenzaldehyde (p-isopropylbenzaldehyde, also known as cumin aldehyde), 2-caren-10-al, and 1,4-p-menthadien-7-al (y-terpinen-7-al)were present in high amounts in the samples (Ta b l e s S 1 and S 2). The f irst of these is the most abundant component of cumin (S ushmita Beh e ra et a l., 2004; Ben e l li et a l ,2018) and the generation of these VOCs can be attributed to the cumin powder added during shashlik preparation. Ketones are produced from amino acid degradation, unsaturated fatty acid oxidation or degradation, carbohydrate metabol i sm, Strecker reactions, and p-keto acid oxidation (Dom i n g uez et al ., 2014b ; Bi l ler e t a l ., 2016). Acetoin (3-hydroxy-2-butanone) was present at high con-centrations in YB (3101.5 ng/g) and TB (2993.52 ng/g) samples. 2,3-Pentanedione, 2-heptanone, 8-hydroxy-2-octanone, 2-octanone, 2-non-anone, 2-decanone, and 2-undecanone were present in TB samples at higher concentrations than the other samples, while acetophenone was most concentrated in YB samples (Ta bl e S 2). Other VOCs were also detected by GC-IMS: 2-butanone, 2-pentanone, 4-methyl-2-pentanone,2-hexanone, 1-octen-3-one, and 6-methyl-5-hepten-2-one (Tabl e S 3).2-Hexanone was highest in the XB samples and 2-pentanone was highest in XFB samples (Fig . 3). 2-Ketones are the main contributors to the aroma of gr i lled meat (D o m i n g u e z e t a l., 2014b ). 2-Pentanone and acetophenone provide the floral , fruity, and sweet aromas of grilled lamb shashl i ks, 2-heptanone provides the fruity and blue cheese aromas,while 2-octanone provides the meaty, floral, and green aromas. 3-Hy -droxy-2-butanone has a buttery aroma, acts as a carbonyl compound in the Maillard reaction, and may originate from glucose catabolism or products of oleic acid oxidation (Xi et a l ., 2018).4-Methyl-2-pentanone contributes fruity, vanilla, dusty, and green aromas to grilled lamb shashliks (Dom i ng uez e t a l ., 2014b ). 1-Octen-3-one is abundant in YB, XFB, and ZB samples (F i g . 3), i s formed by the oxidation of oleic, lino-leic, o-linolenic, or arachidonic acids, and accounts for the mushroom,fried meat, or rusty aromas of the shashliks (R es coni et a l ., 2012). Alcohols can be formed via the microbial metabolism of proteins and amino acids and the reduction of ketones/aldehydes produced by lipid peroxidation (B ass am et a l., 2022). 1-Octen-3-ol has a pleasant mush-room, grassy aroma with a low threshold and is important in roast meat aroma, contributing significantly to the flavor of l amb (Xi et a l ., 2018).It was detected in all the samples, being highest in YB shashliks, followed by XB and TB samples (Tabl es S 1-S3). Q i e t al . (2022) a n d Li u e t al .(2022) both state that 1-octen-3-ol is the main aroma component of lamb. n-Pentanol, n-hexanol, (E)-3-decen-2-ol, and eucalyptol were also detected in all the samples. However, alcohols are not considered the main aroma contributor in grilled meat (B ass am et al., 2022)). Aliphatic and aromatic hydrocarbons are products of l ipid oxidation and contribute to the pleasant f lavor of grilled meats (Dom in g uez e t al.,2014b ). Alkanes are produced by the incomplete combustion of meat and fat during the grilling process. Alkanes identified in all the samples included: heptane, octane, nonane, decane, undecane, n-dodecane, tri -decane, tetradecane, hexadecane, and heptadecane. Heptane and hep-tadecane were most abundant in YB samples, while octane, nonane,decane, tridecane, and hexadecane were most abundant in TB samples.Udecane and dodecane were detected in XB and ZB samples, respec-tively. All samples contained abundant levels of alkenes such as (-)-a-thujene, a-pinene, p-pinene, p-laurane, D-l i monene, y-terpinene, and a-phellandrene. Many alkenes were detected in the shashliks and were the most diverse and abundant group in some samples. Notably, (-)-a-thujene, a-pinene, p-pinene, B-laurene,y-terpinene, and o-phellandrene are important components of cumin (Sushmit a Be h er a et a l ., 2004;B en e l l i e t al., 2018), which is added to lamb shashl i ks. Prolonged grilling resulted i n the production of more aromatic compounds, with o-cymene being present in all samples at high l evels. This may be related to the aromatic spices added during the preparation of the shashl i ks.Toluene was detected only in YB samples. While it has been reported that toluene (fruity and sweet) is important in the aroma of cooked meat (Do m i ng ue z e t al., 2014b ), hydrocarbons have a high odor threshold and contribute less to the overal l aroma of gri l led lamb shashl i ks. Acids, which are mainly produced by enzymat i c digestion or heat oxidation of fatty acid glycerides and phospholipids i n muscle, are one of the major contributors to the gamy odor of lamb (X i e t a l., 2018).However, acids were only detected i n the shashlik samples using GC-IMS, and at relatively low concentrations. Thus, their contribution to the overall aroma of gri l led lamb shashl i ks was not significant. Esters are produced by the esterification of alcohols and carboxylic acids. T hey are particularly aromatic compounds with low odor detection thresholds (D o m i n g uez et al ., 2014a). Various methyl and ethyl esters, including hexyl formate, methyl caproate, ethyl acetate, methyl caprylate, methyl caprate, and methyl benzoate, i mparted fruity and sweet aromas to the shashliks. Furans and pyrazines cont ri bute significantly to the flavor of grilled meats. Furans are produced via the Maillard reaction and sugar degra-dation pathways. 2-Pentylfuran was detected in all samples, was highest in YB samples, and imparted sweet, caramelized, and caramel-like aromas to the shashliks (Li u e t a l ., 2022). Pyrazine contributes signifi-cantly to shashlik aroma due to its low odor threshold, and results from the condensation of two a-amino ketone molecules produced via Strecker degradation. Alkylpyrazines, such as 2,5-dimethylpyrazine and 2,3,5-trimethylpyrazine, also contributed to the grilled lamb aroma.Thiazines, which are produced from cysteine and pentose by heat-induced degradation, were also detected (Li et al ., 2021). 3.5. Comparison of results of GC-based methods Fi g. 4 illustrates the differences in the VOCs identified by GC-MS, GC x GC-TOF-MS, and GC-IMS. In total, 198 VOCs were identified, but only seven (hexanal, heptanal, benzaldehyde, octanal, nonanal, 1-octen-3-ol,and 2-pinene) were detected by all three methods. Of the compounds detected by GC-MS, 62% were also detected by GCx GC-TOF-MS. More alkenes, alkanes, ketones and esters were detected by GC×GC-TOF-MS due to its higher resolution and sensitivity, which enable faster and more accurate identification of more VOCs. GC-MS and GC x GC-TOF-MS results differed significantly from HS-GC-IMS. For example, the VOCs by HS-GC-IMS included acidic compounds, while GC-MS and GC ×GC-TOF-MS identi f ied none. The VOCs common to all three techniques accounted for only 3.5% of the total detected, due to the different extraction, separation, and detection methods applied. In the GC-MS analysis, the VOCs were extracted by SPME, whi l e in the GC × GC-TOF-MS method SPME Arrow f ibers were used, which improved method sensitivity and expanded the range of detectable compounds through the use of a thicker coating (Xu et a l ., 2020). GC-IMS analysis simply in-volves the injection of 500 uL of headspace gas into the instrument via an 85 °C heated syringe. Previous studies have shown that the extraction method significantly affects the composition of compounds detected (Li e t a l., 2020). The higher sensitivity of GC × GC-TOF-MS and GC-IMS for part i cular compounds is also a factor. Compared with previous studies, GC × GC-TOF-MS identi f ied 20VOCs in gri l led lamb shashliks for the first time, including propyl-benzene, 1-ethyl-3-methyl-benzene, 1-ethyl-4-methyl-benzene, 1-pro-penyl-benzene, n-butyl-benzene, 1-methyl-4-propyl-benzene,(2-methyl-2-propenyl)-benzene, p-(1-propenyl)-toluene, 4-pentenyl-ben-zene, pentyl-benzene, 1,2,3,4-tetrahydro-naphthalene, 1-methyl-4-butyl-benzene, hexyl-benzene, 1-methyl-naphthalene, heptyl-benzene,2-methyl-5-pentyl-tetrahydrofuran, benzofuran, acetophenone, 8-hy-droxy-2-octanone, and 6-heptenoic acid methyl ester. GC-IMS detected seven VOCs for the first time: 2-butoxyethanol, 5-methyl-2-fur-anmethanol, 4-methyl-2-pentanone, methylheptenone, methyl benzo-ate, thiazole, and 2-acetylfuran. Three VOCs-diallyl disulphide, (1-methylheptyl)-benzene, and 2-ethenyl-naphthalene-were also detec-ted for t he f i rst -t i me using GC-MS. These results can be attributed to HS-SPME-GC-MS, HS-SPME-Arrow-GC × GC- TOF-MS, and HS-GC-IMS having higher sensitivity and affinity for certain compounds. Fig. 4. Venn diagram of VOCs identified by SPME-GC-MS, SPME-Arrow-GC × GC-TOF-MS and HS-GC-IMS. 3.6.1. Prediction of VOC concentrations Five models based on E-nose data were developed to predict the concentrations of eight classes of VOC (aldehydes, alcohols, ketones,alkenes, alkanes, esters, heterocycles, and aromatics) in the grilled lamb shashliks (Tabl e 1). The prediction correlation coefficients (R²) of the DNN and RegBoost models were low, the PLSR and SVM models were higher, but the MDBN model yielded the most accurate prediction re-sults (R?=0.9795), with R2values above 0.96 and RMSEs below 0.10for all classes of VOC. This reliable performance and high stability may be due to t he efficiency of the MDBN model in handling complex data,namely VOCs detected by GC-MS, GC x GC-TOF-MS, and GC-IMS and sensing information generated by the E-nose. This combination of E-nose and suitable chemometrics offers a new approach to the quantita-tive prediction of specific volatile compounds in food matrices. Table 1 Quantitative predic t ion results of VOC concentrations of grilled lamb shashl i ks based on different modelling methods. Modeling VOC Training set Prediction set methods concentrations RMSE R RMSE R2 PLS Aldehydes 0.1810 0.8924 0.2201 0.9074 Alkenes 0.1724 0.8565 0.1844 0.8952 Alkanes 0.2047 0.8332 0.2383 0.8920 Alcohols 0.1949 0.8273 0.2007 0.9484 Esters 0.2913 0.7860 0.1929 0.8610 Ketones 0.1503 0.8370 0.1883 0.9957 Heterocycles 0.2984 0.8216 0.1039 0.8576 Aromatics 0.1765 0.9037 0.1403 0.8491 Total 0.2087 0.8447 0.1836 0.9008 SVM Aldehydes 0.1711 0.9042 0.0883 0.9343 Alkenes 0.0821 0.8817 0.1837 0.9863 Alkanes 0.1378 0.8711 0.1229 0.9364 Alcohols 0.0905 0.8928 0.1764 0.9364 Esters 0.1776 0.8338 0.2134 0.9072 Ketones 0.1242 0.8250 0.0528 0.9421 Heterocycles 0.1896 0.8896 0.2240 0.9217 Aromatics 0.1383 0.8729 0.0861 0.9367 Total 0.1389 0.8714 0.1434 0.9377 DNN Aldehydes 0.1461 0.9181 0.0743 0.9486 Alkenes 0.1277 0.9084 0.1849 0.9127 Alkanes 0.1209 0.8313 0.1341 0.9711 Alcohols 0.0642 0.8495 0.0747 0.9305 Esters 0.0761 0.8781 0.0870 0.9268 Ketones 0.1374 0.8357 0.1615 0.9672 Heterocycles 0.1699 0.9076 0.1875 0.9609 Aromatics 0.0563 0.8901 0.0679 0.9637 Total 0.1223 0.8774 0.1215 0.9477 RegBoost Aldehydes 0.0756 0.8343 0.0719 0.9583 Alkenes 0.1439 0.9228 0.1555 0.9981 Alkanes 0.1126 0.8652 0.1133 0.9756 Alcohols 0.0842 0.8282 0.0895 0.9486 Esters 0.1060 0.9248 0.1639 0.9371 Ketones 0.0993 0.8773 0.1894 0.9779 Heterocycles 0.1317 0.8994 0.0707 0.9296 Aromatics 0.0475 0.9148 0.0924 0.9651 Total 0.1001 0.8833 0.1183 0.9613 MDBN Aldehydes 0.0313 0.9599 0.0359 0.9845 Alkenes 0.0395 0.8881 0.0449 0.9991 Alkanes 0.0942 0.8798 0.0944 0.9925 Alcohols 0.0300 0.9224 0.0320 0.9645 Esters 0.1175 0.9673 0.1316 0.9982 Ketones 0.1076 0.9548 0.0991 0.9734 Heterocycles 0.0223 0.8020 0.0224 0.9406 Aromatics 0.0702 0.9322 0.0718 0.9832 Total 0.0641 0.9133 0.0665 0.9795 3.6.2. Prediction of brand Five models based on E-nose and E-tongue data were developed to identify the brands of commercially available grilled lamb shashliks.GC-MS, GC xGC-TOF-MS, GC-IMS, E-nose, and E-tongue data were used in mul t iple models with an average of 200 runs (iterations). Comparative results are shown in Ta b le 2. The R2 of both t he t raining and prediction sets of the MDBN model was above 0.96 and RMSE values were below 0.10, giving the best prediction accuracy and stability of any model.MDBN modeling satisfactorily processed data from GC-MS, GC × GC-TOF-MS, and GC-IMS, and established good correlations between the MS data and the E-nose and E-tongue sensing information. It performed well in identifying the different brands of commercially available shashlik based on their flavor characteristics. These results demonstrate the feasibility of ident i fying food categories using data f usion of mass spectrometric and E-nose/E-tongue information. 4. Conclusion In this study, VOCs in five brands of commercially available lamb shashliks were comprehensively characterized by HS-SPME-GC-MS,SPME-Arrow-GC × GC-TOF-MS, and HS-GC-IMS. A total of 198 VOCs were identi f ied (65 by GC-MS, 141 by GC x GC-TOF-MS, and 81 by GC-IMS). Twenty, seven, and three VOCs were identified for t he first-time using GC × GC-TOF-MS, GC-IMS, and GC-MS respectively. E-tongue and E-nose systems differentiated the flavor characteristics of the shashliks. GC-based data and E-nose/E-tongues data were combined using data fusion strategies. Quantitative prediction of eight classes of VOC in the shashliks was demonstrated using a MDBN model based on E- Table 2 Prediction results of gri l led l amb shashliks brands based on different model l ing methods. Modeling methods brands Training set Prediction set RMSE R2 RMSE R2 PLS YB 0.2491 0.8757 0.1974 0.9594 XB 0.2360 0.9722 0.1952 0.9730 XFB 0.1563 0.7551 0.2549 0.9680 0.2637 0.7172 0.1714 0.8080 0.1099 0.7340 0.1855 0.8261 Total 0.2030 0.8108 0.2009 0.9069 SVM 0.1651 0.9379 0.1722 0.9029 0.0925 0.9776 0.0826 0.9811 XFB 0.2191 0.8296 0.1664 0.9036 2 0.1529 0.8005 0.1579 0.9111 0.1530 0.8093 0.1157 0.9018 Total 0.1565 0.8710 0.1390 0.9201 DNN 0.1564 0.9787 0.1235 0.9980 0.0689 0.8652 0.0833 0.9234 XFB 0.1649 0.8608 0.1799 0.9997 2 0.0633 0.8800 0.1312 0.9017 0.1023 0.8671 0.1142 0.9714 Total 0.1111 0.8904 0.1264 0.9588 RegBoost 0.0986 0.9317 0.1119 0.9942 0.0200 0.9439 0.0200 0.9761 XFB 0.1115 0.9275 0.1189 0.9771 ZB 0.0134 0.8810 0.1266 0.9538 0.0022 0.8249 0.0511 0.9082 Total 0.0491 0.9018 0.0857 0.9619 MDBN 0.0895 0.9558 0.0979 0.9983 0.0590 0.9537 0.0609 0.9867 XFB 0.0006 0.9582 0.0007 0.9808 0.1227 0.8650 0.0140 0.9644 0.0447 0.9789 0.0025 0.9983 Total 0.0633 0.9423 0.0352 0.9857 nose response data (all R"above 0.96). Combining the E-nose, E-tongue and GC-based data, the MDBN model identified the brands of the commercially available grilled lamb shashliks based on their f l avor characteristics with high accuracy (all R’above 0.96) and stability (all RMSE below 0.10). Thus, SPME-Arrow-GC × GC-TOF-MS, HS-GC-IMS,and SPME-GC-MS are effective methods for ident i fying VOCs and revealing flavor differences in commercially available grilled lamb shashliks, providing a basis for the development of strategies to improve the sensory qual i ty of such products. The combination of intelligent sensory technologies and chemometrics is a promising approach for the food industry and food scientists to characterize and identify products,and to understand and improve flavor attributes during the grilling process. CRediT authorship contribution statement Che Shen: Conceptualization, Investigation, Formal analysis, Data curation, Writing - original draft. Yun Cai: Data curation. Xinnan Wu:Data curation. Shengmei Gai: Supervision. Bo Wang: Methodology,Formal analysis, Visualization, Funding acquisition . Dengyong Liu:Project administration, Funding acquisition. Declaration of Competing Interest The authors declare that they have no known competing financial interests or persona l relationships that could have appeared to influence the work reported in this paper. Data availability No data was used for the research described in the article. Acknowledgement The authors would like to express their gratitude to EditSprings (h ttps ://www.e ditspr in g s.cn ) for the expert l inguistic services provided . Funding Research on Innovation of Educational Discourse of Role Models in Universities in the New Era" [2022SJZDSZ018] and the "Science and Technology Project of Unvei l ing and Commanding" from Liaoning Province [2021JH1/10400033]. This work was supported by Liaoning Revitalization Talents Program [XLYC1807100], the Open Fund of Institute of Ocean Research, Bohai University [BDHYYJY2021007],Liaoning Key Laboratory o of food safety V ,,Bohai University [LNKLFS202115], Bohai University General Cultivation Research Proj-ect [0522xn048], Bohai University Postgraduate Innovation Fund Project [YJC2022-014]. Ethics declarations The authors declare no competing interests. Appendix A. Supplementary data Supplementary data to this article can be found online at h t t p s://do i .org /10.1016/j .f o o d chem.2023.136257. References Bassam, S. M., Noleto-Dias, C., & Farag, M. A. (2022). Dissecting grilled red and white meat f l avor: I t s characteristics, production mechanisms, inf l uencing factors and chemical hazards. Food Chemistry, 371, Article 131139. h t tps://d o i .org/10.1016/j .foodc h em .2021.131139 Bi l ler, E., Bose l l i , E., Obiedzinski, M., Karpinski, P., & Waszkiewicz-Robak, B. (2016).The profile of volat i le compounds i n the outer and i nner parts of broiled pork neck is strongly influenced by the acetic-acid marination conditions. Meat Science, 121,292-301. h t t p s://do i .o rg /10.1016/j .meatsci .2016.06.029 C h o , I . H., L e e, H . J ., & Ki m , Y . S . (2005). Ana ly s i s o f vola t i l e compo u n ds in Bul gogi p r epa r ed by d i f f e r e n t h ea t i n g pro c e du r e. Foo d Scien c e a n d Bio t ec hno logy, 14(3),428-432. Cortes, C., & Vapnik,V. (1995). Support -vector networks. Machine Learning, 20(3),273-297. h t t ps://doi.org /10.1007/BF00994018 Dominguez, R., Gomez, M., Fonseca, S., & Lorenzo, J . M. (2014a). Effect of different cooking methods on lipid oxidation and format i on of volatile compounds i n foal meat. Meat Science, 97(2), 223-230. h t tps ://d oi .org /10.1016/j .me a tsci.2014.01.023 D B Gom inguez , R., G o mez , M., Fonseca, S ., & Lore n zo , J . M . (2014b ). I nf l u e n c e of t he rm a l tr e a t ment on format i on o f vola t i l e co mp o u nd s, co ok ing l o ss and l i pid oxi d at ion in foa l m ea t . LWT -Food Scien c e a nd T echno l og y,58(2), 439-445. Geladi, P ., & Kowalski, B. R. (1986). Partial least-squares regression: A tutorial . Analytica Chimica Acta, 185,1-17. ht tp s://doi.org /10.1016/0003-2670(86)80028-9 Bene l l i , G., Pavela , R., Petrel l i , R., Cappellacc i, L., Canale, A., Senthi l -Nathan, S., &Maggi , F. (2018). Not j ust popular spices! Essential oi l s f rom Cuminum cyminum and Pimpine l la anisum are toxic to insect pests and vectors without affecting non-target invertebrates. Industrial Crops and Products, 124,236-243.h t tp s://d o i .org/10.1016/j .ind c ro p.2018.07.048 He, X., Han, X., Yu, J ., Feng, Y., & Chu , G . (2021). Rapid prediction method of α-glycosidase inhibitory activ i ty of Coreopsis t inc t oria extract from di f ferent habitats by near infrared spectroscopy. Spectrochimica Acta Part A: Molecular and Biomolecular Spectroscopy, 120601. htt ps://do i.org/10.1016/j .saa .2021.120601 Hinton, G. E. (2007). To recognize shapes, first l earn to generate images. In P. C i sek,T. Drew, & J . F. Kalaska (Eds.), Progress in Brain Research (pp. 535-547). Elsevier.https ://do i .org/10.1016/S0079-6123(06)65034-6. Jiang, H. Y., Zhang, M., Bhandari , B., & Adhikari, B. (2018). Application of electronic t ongue for fresh f oods quality evaluation: A review. Food Reviews International, 34,746-769. h t t p s://doi .or g /10.1080/87559129.2018.1424184 Jin, Q., Zhang, H., Zhang, Y., Ca i , W., & Chi, M. (2020). An improved parallel MDBN with AVMD for nonlinear system modeling. IEEE Access, 8, 18408-18419. htt ps://d oi.o r g /10.1109/ACCESS.2020.2968508 L i , J ., Fu , Y ., B ao , X ., L i , H ., Zu o, J ., Z h a ng, M ., & Wa n g, J . (2020). Co m pa r ison and ana l ys i s o f to m a t o flavor comp o u n d s us i ng differe n t e xt rac t i on met h od s . Journ a l of Food Meas u r e men t a nd Ch a ra cter iza t ion, 14(1), 465-475. L i , M., Y a ng, R ., Z h a n g, H ., W ang , S ., C h en , D., & Li n, s . (2019). D eve l opm en t of a flavor fi n gerp rin t b y H S -GC -IMS wi t h P CA f or volat i le c ompou n ds of T r i c h olom a m atsutake Si n ger . F oo d Chemi s try , 290, 32-39. Li , W., Chen, Y. P., Blank , I., Li , F., Li, C., & Liu, Y . (2021). GC x GC-ToF -MS and GC-IMS based volati l e prof i le characterization of the Chinese dry-cured hams from different regions. Food Research International, 142, Art i cle 110222. h t t ps://d o i .or g/10.1016/j .foodres.2021.110222 Liu, D ., Bai, L., Feng, X., Chen, Y . P., Zhang, D., Yao, W., Zhang, H., Chen, G., & Liu, Y.(2020). Character i zation of J inhua ham aroma profi l es in speci f ic to aging time by gas chromatography-ion mobility spectrometry (GC-IMS). Meat Science, 168, Article 108178. h t t ps://d o i .o r g/10.1016/j .meatsci .2020.108178 Liu, H., Hui, T ., Fang, F., Li, S., Wang, Z., & Zhang, D. (2022). The formation of key aroma compounds in roasted mutton during the traditional charcoal process. Meat Science, 184, Artic l e 108689. h t tps ://d o i.org/10.1016/j .mea t sc i.2021.108689 Liu, H., Ma, J., Pan, T ., Suleman, R., Wang, Z., & Zhang , D. (2021). Effects of roasting by charcoal, electric, microwave and superheated steam methods on (non)volat i le compounds in oyster cuts of roasted lamb. Meat Science, 172, Article 108324.https ://do i .org/10.1016/j .mea t s ci .2020.108324 Meinert, L., Andersen, L. T ., Bredie, W. L. P., Bjergegaard, C., & Aaslyng, M. D. (2007).Chemical and sensory characterisation of pan-fried pork flavour: Interactions between raw meat quality, ageing and fry i ng temperature. Meat Science, 75(2),229-242. htt p s ://do i .org/10.1016/j.meatsc i .2006.07.004 N arsaia h , K., Biswas, A ., & Ma n da l, P . (2020). Me a t q ua l i t y an al ysis. MA, USA: Academic Press Cam br i dge . Petricevic, S ., Marusic, R. N., Lukic, K., Listes, E., & Medic , H. (2018). Differentiation of dry -cured hams from different processing methods by means of volatile compounds,physico-chemical and sensory analysis. Meat Science, 137, 217-227.h t t ps://doi.o r g/10.1016/j .meatsc i .2017.12.001 Qi , J., Li u , D . Y ., Z ho u , G . H ., & Xu, X . L. (2017). Cha r ac t er i st i c f l avor of tradi t iona l s oup made by st e w i n g C h in e se yel l ow -feat h er c h i ck ens . Journal of Foo d Sc i e n c e , 82(9),2031-2040. Qi, S., Wang, P., Zhan, P., & Tian, H. (2022). Characterization of key aroma compounds in stewed mutton (goat meat ) added with thyme (Thymus vulgaris L.) based on the combination of instrumental analysis and sensory ver i fication. Food Chemistry, 371,Article 131111. htt p s://d o i.org /10.1016/j .f ood c h em .2021.131111 Resconi , C . V., del Ma r Ca mpo , M., M on tossi , F., Fer r eir a , V., San ud o , C ., & Escu de r o , A .(2012). G as c hr omatogra p h i c -ol f a ct ometr i c aro m a p ro fil e and quan t i t a t ive analysis o 1S f volat il e carb o n y ls of gr ill ed bee f fr om d i ff erent f in i s hi ng feed syst e ms . J ournal of Food Scien c e, 77(6), S 240-S246. Schwanz , T . G., Boko w ski , L . V . V ., M a rcelo, M. C . A., Ja nd r e y , A . C., D ia s, J . C .,M ax i miano, D . H., ...Ka i ser , S. (2019). Ana l ys i s of chem os ensory markers i n c i garet t e smoke from d i ffe r ent t oba c co var i e t i e s by GCxG C -TOFMS a n d chemo m e t rics. Talan t a, 202,74-89. Shen, D. Y ., Li, M. K., Song, H. L ., Zou, T. T., Zhang, L ., & Xiong, J . (2021).Character i zation of aroma in response surface optimized no-salt bovine bone protein extract by switchable GC/GC x GC-olfactometry-mass spectrometry, electronic nose,and sensory evaluation. LWT-Food Science and Technology, 147, Article 111559.h t tps ://do i .or g /10.1016/j .l wt .2021.111559 Sushmita Behera, S., Nagarajan, L. J., & Rao, M. (2004). Microwave heating and conventional roas t ing o f cumin seeds (Cuminum cyminum L.) and effect on chemical composition of volatiles. Food Chemistry, 8(1), 25-29. http s ://doi.org /10.1016/j .f o od ch em .2003.10.012 Varlet, V., Prost, C., & Serot, T. (2007). Volat i le aldehydes in smoked fish: Analysis methods, occurrence and mechanisms o f formation. Food Chemistry, 105,1536-1556. h t tp s://d o i .o r g /10.1016/j .foodc he m .2007.03.041 Vidal , N. P., Manful , C., Pham, T . H., Wheeler, E., Stewar t, P., Keough, D., & Thomas, R.(2020). Novel unfi l tered beer-based marinades to improve the nutri t ional quality,safety, and sensory perception of gri l led ruminant meats. Food Chemistry, 302,Art i cle 125326. htt ps ://d o i .o r g /10.1016/j.f oo d che m .2019.125326 Wang, B., Shen, C., Cai , Y ., Dai , L., Gai, S., & Liu, D. (2023). Consumer culture in traditional food market: The inf l uence of Chinese consumers to the cultural construction of Chinese barbecue. Food Control, 143, Article 109311. h t t ps://d o i .or g /10.1016/j.f oodco n t.2022.109311 Wan g, D ., Z h an g,J ., Z hu , Z ., L ei , Y ., H ua ng , S., & Hu an g, M . (2021). Effect o f agei n g t i me 1g on t h e f l avou r co mp o u nd s in Nanj i ng water -boi l e d sa l ted duck de t ec t ed by H S -GC -IM S . LWT, 155, Art ic l e 112870. Xi , J ., Zh an, P., T i an, H ., Wa n g, P., Gen g , Q ., Wan g , Y ., Zhang, F ., & J i , Y. (2018).Compa ri s on o f d i f f ere nt ext r ac t i on f ib ers f or an al ys i s of chara c te ri s t ic a r o m a co mp o u nd s i n Xinj i ang r oa st ed la mb by SP ME -GC -MS an d PCA . Food Sc ie nce,39(10),234-241. Xu , X. B ., Mu rt a d a, K ., & P awl i szyn, J . (2020). D et e r minat i on o f se l ec t ed vol a t i le ter p en e s in fi s h sa mp les via s olid ph a se m i cr oex tr a ct i o n arr o w coup l ed wi th GC -MS .Ta la nta, 221, Ar t i cle 121446. Yao, W., Cai, Y., Liu, D., Chen, Y., Li, J., Zhang, M., Chen, N., & Zhang, H. (2022).Analysis of flavor formation during production of Dezhou braised chicken using headspace-gas chromatography-ion mobility spectrometry (HS-GC-IMS). Food Chemistry, 370, Article 130989. h t t ps://doi .o rg/10.1016/j.f oo d chem.2021.130989 Zhang, F ., Li, X., Lim, C., Hua , Q., Dong, C., & Zhai , J . (2022). Deep emotional arousal network for multimodal sentiment analysis and emotion recognition. Information Fusion, 88, 296-304. h t tps ://doi .or g /10.1016/j .i n f f us .2022.07.006 Zhou, X., L i, X., Zhao, B., Chen, X., & Zhang, Q. (2022). Discriminant analysis of vegetable oils by thermogravimetric -gas chromatography/mass spectrometry combined wi t h data fusion and chemometrics without sample pretreatment. LWT,161, Article 113403. h t tp s://doi .or g /10.1016/j .lwt .2022.113403 Zh u, Z., Bassey , A. P., Cao , Y., D u, X., Hu a ng, T ., Cheng , Y., & H u an g , M. (2022). Mea t q u ality and f l a vor eva l ua t ion o f Na nj ing wa t e r b oi l ed sa l ted duc k (NW S D) p r o d u ce d b y d i f fe re n t M u sco vy d uck (Ca i r i n a m oscha t a ) i n g r e d i e nt s. Food C hem i s t r y , 397,A rt i cl e 133833.
确定


还剩9页未读,是否继续阅读?

产品配置单
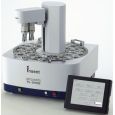
北京盈盛恒泰科技有限责任公司为您提供《使用 GC-MS、GC × GC-TOF-MS、GC-IMS、电子鼻和电子舌结合化学计量学表征选定的市售烤羊肉串风味剖面》,该方案主要用于熟肉制品中风味检测,参考标准--,《使用 GC-MS、GC × GC-TOF-MS、GC-IMS、电子鼻和电子舌结合化学计量学表征选定的市售烤羊肉串风味剖面》用到的仪器有日本INSENT味觉分析系统(电子舌)
推荐专场
感官智能分析系统(电子鼻/电子舌)
相关方案
更多
该厂商其他方案
更多